Embed Size (px)
Citation preview

Characterization of bubble dynamics and heat transfer
processes in pool boiling under extreme wetting scenarios
Tiago Mesquita Palma
Thesis to obtain the Master of Science Degree in
Mechanical engineering
Supervisors: Dr. Ana Sofia Oliveira Henriques Moita
Prof. António Luís Nobre Moreira
Examination Committee
Chairperson: Prof. Viriato Sérgio de Almeida Semião
Supervisor: Dr. Ana Sofia Oliveira Henriques Moita
Member of the Comittee: Prof. José Maria Campos da Silva André
November 2016

II
III
Acknowledgments
To all people that stood with me, not only through this thesis, but also through the course of
Mechanical Engineer at Instituto Superior Técnico I am deeply thankful. I’d like to thank some of them
individually:
To Professor Ana Moita for the guidance provided throughout these past few months, for always
being available and for the final effort that made it possible to finish this document.
To Tomás Valente for providing all the tools and sharing all his knowledge on the subject that
allowed this work to launch and find its way until the end.
I also thank Professor Doutor Luís Nobre Moreira for accepting me in this lab and incorporating
me in the team.
To all my companions in the lab who one way or another contributed for this thesis to be
complete, for always keeping the good mood and provide me with moments that will not soon be
forgotten.
To my friends who accompanied me on this journey that culminates with this work. Without their
support and friendship for sure it would have been double the work and half the fun.
A special thanks to Vasco, Pedro, Diogo and Gonçalo who helped and shared the workplace on
the last weeks.
To my brother, Miguel, and Andrea for reading my thesis with such attention and detail. Also for
the support and encouragement given. Their effort is invaluable.
Finally, to my parents who have been present all my life. Everything good I have is thanks to
them and it’s impossible for me to describe how thankful I am that the two best individuals I know
happen to be my parents.

IV

V
Abstract
The present work addresses the effect of extreme wetting regimes on pool boiling heat transfer,
analysing the boiling curves together with detailed description of bubble dynamics. The work focuses
on the use of biphilic surfaces (hydrophilic surfaces with superhydrophobic spots) although
superhydrophilic surfaces are also swiftly addressed. Within biphilic surfaces similar patterns are
devised with different dimensions. The patterns have squared spots of 10 mm, 5 mm and 2 mm side.
Biphilic surfaces show a better performance than hydrophilic and superhydrophobic surfaces, since
higher heat fluxes are usually achieved for the same wall superheat. They seem to be able to combine
the best of the two regimes, having an early onset of nucleate boiling and an efficient rewetting
mechanism. This is promoted by the contrast of wettability which doesn’t allow an insulating vapor
layer (characteristic of superhydrophobic surfaces) to be formed, since the bubbles are confined to the
superhydrophobic spot. Contac line velocity is zero, which means the bubble is stuck on the border of
the spot. Bubble departing diameter is shown to be controlled by the size of the spot. The larger the
spot the larger is the diameter while the lower is the departure frequency. From the various biphilic
patterns tested, the best performing one has the largest superhydrophobic spot. Estimates of the heat
transfer mechanisms are made which point to the fact that this surface extracts more heat than the
others due to a higher vaporization rate and also due to a better rewetting mechanism.
Keywords: Wettability, Pool boiling, Boiling curves, Bubble dynamics, Biphilic surfaces,

VI
VII
Resumo
Este trabalho estuda a ebulição em meio quiescente usando superfícies com molhabilidades
distintas. O trabalho focou-se no uso de superfícies bifílicas, i.e. que contêm zonas superhidrofóbicas
rodeadas por áreas hidrofílicas, embora tenha também abordado levemente o uso de superfícies
superhidrofílicas. As superfícies bifílicas apresentam padrões superhidrofóbicos com diferentes
dimensões. Estes padrões consistem em zonas quadradas com 10, 5 ou 2 mm de lado. As
superfícies bifílicas apresentam melhor desempenho em relação às superfícies com molhabilidade
uniforme, permitindo atingir fluxos de calor mais elevados para o mesmo sobreaquecimento.
Aparentemente estas superfícies combinam as vantagens da ebulição em regimes hidrofílicos e em
regimes superhidrofóbicos, apresentando um início de ebulição nucleada mais prematuro e um
mecanismo de rewetting mais eficiente. Isto é promovido pelo contraste de molhabilidade que não
permite uma camada de vapor isolante ser formada (característica das superfícies superhidrofóbicas)
dado que as bolhas estão confinadas à zona superhidrofóbica. A velocidade da linha de contacto é
zero o que quer dizer que a bolha está confinada à zona superhidrofóbica. Demonstra-se que o
diâmetro de partida da bolha é controlado pelo tamanho desta zona. Quanto maior é a zona, maior é
o diâmetro e menor é a frequência de partida da bolha. Das superfícies bifílicas, a que tem maiores
zonas superhidrofóbicas é a que melhores resultados apresenta. Estimativas dos mecanismos de
transferência de calor são realizadas, que apontam que a superfície bifílica extrai mais calor que as
outras devido a uma maior taxa de vaporização e também a um melhor mecanismo de molhabilidade.
Palavras-chave: Molhabilidade, Ebulição em piscina, Curvas de ebulição, Dinâmica de bolha,
superfícies bifílicas.

VIII
IX
Contents Acknowledgments ................................................................................................................................... III
Abstract .................................................................................................................................................... V
Resumo .................................................................................................................................................. VII
List of Figures .......................................................................................................................................... XI
List of tables .......................................................................................................................................... XIII
Abbreviations ......................................................................................................................................... XV
Nomenclature ...................................................................................................................................... XVII
1 Introduction ....................................................................................................................................... 1
1.1 Motivation and aim of the work ................................................................................................ 2
1.2 State of the Art ......................................................................................................................... 3
1.2.1 Early Studies .................................................................................................................... 3
1.2.2 Wettability studies ............................................................................................................ 5
1.3 Objectives ................................................................................................................................. 8
1.4 Thesis Outline .......................................................................................................................... 9
2 Theoretical Background ................................................................................................................. 10
2.1 Pool Boiling............................................................................................................................. 11
2.2. Wettability ............................................................................................................................... 12
2.3 Nucleation............................................................................................................................... 15
2.4 Bubble dynamics .................................................................................................................... 18
3 Experimental Method ..................................................................................................................... 20
3.1 Experimental Setup ................................................................................................................ 20
3.2 Experimental procedure ......................................................................................................... 26
3.2.1 Surface preparation ........................................................................................................ 26
3.2.2 Surface Characterization ................................................................................................ 30
3.2.3 Pool boiling tests ............................................................................................................ 31
3.2 Experimental data analysis and uncertainties........................................................................ 33
3.2.1 Bubble dynamics analysis routine .................................................................................. 33
3.2.2. Experimental uncertainties ............................................................................................. 33
4 Results and discussion................................................................................................................... 36
5 Conclusions .................................................................................................................................... 50
Bibliography ............................................................................................................................................ 52
Annexes.................................................................................................................................................. 56
Annex A – Hydrophobic bubble contact line velocity ......................................................................... 56

X
XI
List of Figures
Figure 1 – Wetting regimes (adapted from (M.Jakob & Fritz, 1931)) ...................................................... 3
Figure 2 – Pool boiling curve. (Source: Lienhard,J.H.,A Heat Transfer Textbook, Prentice Hall Inc.,
Englewood)............................................................................................................................................. 11
Figure 3 – Contact angle and balance of forces as defined by Young’s equation, (Source: (Grundke et
al., 2015)) ............................................................................................................................................... 12
Figure 4 – Different wetting regimes. From left to right: Hydrophilic, Hydrophobic and
Superhydrophobic, respectively. ............................................................................................................ 13
Figure 5: Force balance on the triple contact of a bubble...................................................................... 15
Figure 6 – Conditions of entrapment of gas in a V shaped cavity (left) and on a rounded on (right),
(Source: (Bankoff, 1958)) ....................................................................................................................... 17
Figure 7 – Change in availability function with radius (left) and change in dimensionless availability
with wettability (Quan et al., 2011) ......................................................................................................... 18
Figure 8 – Wide shot capturing full setup ............................................................................................... 20
Figure 9 – Top part of set up: Degassing station ................................................................................... 21
Figure 10: Mid part of set up. ................................................................................................................. 22
Figure 11 – Back view of set-up ............................................................................................................. 22
Figure 12 – Heating block: Section view on the left; detail of sensor on the top right; photography of
heating block on bottom right ................................................................................................................. 24
Figure 13 – Bottom part of the set up..................................................................................................... 24
Figure 14 – Simplistic schematic of experimental set up ....................................................................... 25
Figure 15 – LabVIEW Block Diagram .................................................................................................... 26
Figure 16 – Front Panel for DT QuickDAQ ............................................................................................ 26
Figure 17 – Bare surfaces (top) and top view (bottom) with dimensions and location of the heating
area (in green). Images are not at the same scale. ............................................................................... 27
Figure 18 – Ultrasound machine ............................................................................................................ 28
Figure 19 – Biphilic surfaces patterns with circunference representing the limit of the heating area. On
the left, A, on the middle, B, and on the right, C .................................................................................... 29
Figure 20 – Structures seen through a confocal microscope ................................................................ 29
Figure 21 – THETA tensiometer on the left and snapshot of software analysis on the right ................ 30
Figure 22 – Flowchart of the experimental procedure ........................................................................... 32
Figure 23 – Pool boiling curves for tested surfaces and those from (Valente, 2015) ............................ 37
Figure 24 – Bubble confined to superhydrophobic spots. Clockwise starting on top left: B10 at 1 K
superheat, B05 at 2 K superheat and B02 at 6 K superheat. ................................................................ 38
Figure 25 – Bubbles of the interface merging and departure of the hydrophobic bubble. On top B10
surface and on the bottom B05 .............................................................................................................. 39
Figure 26 – Hydrophilic and hydrophobic bubbles at high wall superheat. Clockwise starting on top left:
B10 at 16 K superheat, B05 at 12 K superheat and B02 at 16 K superheat. ........................................ 40

XII
Figure 27 – Departure diameter as a function of Heat flux. For the biphilic surfaces it is for the
hydrophobic bubbles. ............................................................................................................................. 41
Figure 28 – Bubble departure frequency as a function of the heat flux. For the biphilic surfaces only
the hydrophobic bubbles were accounted for. ....................................................................................... 42
Figure 29 – Bubble departure frequency as a function of heat flux for biphilic surfaces. ...................... 43
Figure 30 – B02 hydrophobic bubble growth at 5 K superheat ............................................................. 44
Figure 31 – B05 hydrophobic bubble growth at 3 K superheat ............................................................. 44
Figure 32 – B10 hydrophobic bubble growth at 2 K superheat ............................................................. 44
Figure 33 – Bubble diameter temporal evolution. .................................................................................. 45
Figure 34 – Temporal evolution of the hydrophobic bubble contact angle ............................................ 46
Figure 35 – Temporal evolution of the hydrophobic bubble contact line velocity for the biphilic surfaces
and of the superhydrophobic surface ..................................................................................................... 47
Figure 36 – Bubble at 16 K superheat ................................................................................................... 49
Figure 37 – Temporal evolution of the hydrophobic bubble contact line velocity for biphilic surfaces .. 56

XIII
List of tables
Table 1 – Characteristics of biphilic surfaces......................................................................................... 28
Table 2 – Characterization parameters of all surfaces .......................................................................... 31
Table 3 – Errors for superheat and heat flux ......................................................................................... 34
Table 4 – Hydrophobic bubbles departure diameter .............................................................................. 40
Table 5 – Estimation of latent heat and total heat of the B05 and B10 surfaces................................... 48

XIV
XV
Abbreviations
CA Contact Angle
CHF Critical Heat Flow
CuO Copper Oxide
DT DATATRANSLATION
HTC Heat Transfer Coefficient
IST Instituto Superior Técnico
LED Light-Emitting Diode
N2 Nitrogen
NI National Instruments
O2 Oxygen
ONB Onset of Nucleate Boiling
PID Proportional-integral-derivative controller
Ra Mean roughness

XVI
XVII
Nomenclature Roman Letters
Cp Specific heat of a liquid J/Kg.K Cf Calibration factor Pixels/mm D Bubble diameter mm edb Boundary detection error Pixels E Error - F Frequency Hz h Convective heat transfer coefficient 𝑊/𝑚2. 𝐾 hfg Latent heat of vaporization KJ/Kg q’’ Heat flux 𝑊/𝑐𝑚2 Ra Average roughness amplitude μm Rb Bubble radius m Rc Cavity radius m r Roughness factor 𝑟𝑛 Bubble nucleous radius mm Rz Mean peak-to-valley roughness μm T Temperature K 𝑇𝑔 Bubble growth time s
𝑇𝑤 Bubble waiting time s
Greek Letters
β Aperture angle of the conical section o
θ Contact angle o
ρ Density 𝐾𝑔/𝑚3 σ \ 𝛾 Surface tension N/m 𝜙 Cavity angle ° Ψ Availability -
Subscripts
adv Advancing rec receding e Equilibrium d Dynamic g Gravity l Liquid ls Liquid-solid lv Liquid-vapour sv Solid-vapour sat Saturation b Bubble n Nucleous

XVIII

1
1 Introduction
2
1.1 Motivation and aim of the work
Heat transfer is crucial in many engineering applications and throughout many other fields of activity.
In particular, fields such as electronics, energy production or automotive industry are many times
directly associated with productivity and efficiency. Refrigerating a system may be achieved through
different mechanisms, from free and forced convection in single-phase flow to pool boiling in two-
phase flows. The latter often depicts higher heat transfer coefficients (HTC), due to the combination of
the main heat transfer processes (free convection, quenching and induced bulk convection and
naturally liquid evaporation during bubble formation) thus being of more interest to explore.
Further increasing heat transfer coefficients in pool boiling requires for the mechanisms that govern it
to be fully understood, which is nowadays not completely achieved yet, although is known to strongly
depend on the nucleation and bubble dynamics phenomena occurring near the surface. Indeed,
surface wettability, which quantifies the degree at which the surface is wetted, is known to play a vital
role in pool boiling heat transfer. Therefore, controlling surface topography and/or surface chemistry,
both affecting the wettability, provides the means to enhance the HTC, which is the ultimate goal.
Wettability quantified through the apparent angle between the solid surface and the tangent of the
surface of the bubble at the contact line between the three media: solid, liquid and gas/vapor. Different
wetting regimes can be identified by this angle, . For 0° < 𝜃 < 90° the surface is hydrophilic while for
𝜃 > 90° the surface is called hydrophobic. Technically, the prefix hydro should only be applied when
the liquid is water, but it is widely used when referring surfaces in contact with any liquid. If the value
of the contact angle reaches extreme values, then the expressions used are superhydrophilic (𝜃 ≈ 0°)
and superhydrophobic (𝜃 ≫ 90°). These specific extreme wetting regimes will be discussed later.
The effect of wettability on pool boiling heat transfer has been the subject of many studies, but is not
yet fully understood. Moreover, only recently some authors started to point out that it is important to
separate the effects of surface chemistry and topography on pool boiling (Malavasi, Bourdon, Di
Marco, de Coninck, & Marengo, 2015) as they may act in very distinct ways.
A previous work (Valente, 2015) has been carried out, which addressed the effect of using
superhydrophobic and hydrophilic surfaces on pool boiling heat transfer. This study included the
complete description of heat transfer, through the reconstruction of the boiling curve, as well as bubble
dynamics, through the analysis of high-speed images and quantification of relevant parameters.
In the present work, the same methodology was adopted enlarging the study to superhydrophilic and
the so-called biphilic surfaces, i.e. hydrophilic surfaces patterned by superhydrophobic spots.
Changes in wettability were achieved by means of varying the surface chemistry while keeping the
mean roughness constant. The motivation to produce these surfaces is cleared out in the context of
the State of the Art presented in the following subsection.
3
1.2 State of the Art
1.2.1 Early Studies
As early as 1805, Thomas Young wrote an essay on the cohesion of fluids (Young, 1805) where he
describes the governing forces on the interface between a solid, a liquid and a gas.
Nukiyama reconstructed, in 1934 (Nukiyama, 1934), the boiling curve and was able to identify
different regimes within pool boiling. He plotted the heat flux generated by the temperature difference
between the surface (in his case a wire) and the surrounding liquid against the temperature difference
itself. This temperature difference is commonly referred to as surface superheat.
In 1936, Wenzel describes the wetting of solids by water by investigating the solid’s water
repellence and states that “Measurements then soon revealed the fact that, for certain materials, the
method of producing the surface – that is, its physical condition – had a much more pronounced
effect”. At this point, several texts and articles on the subject had already been published, as Wenzel
himself points out, but they did not fully account for the effect of roughness on wetting.
(M.Jakob & Fritz, 1931) experiments with smooth and rough surfaces brought attention to the
fact that roughening a surface could in fact enhance pool boiling heat transfer. In this study, different
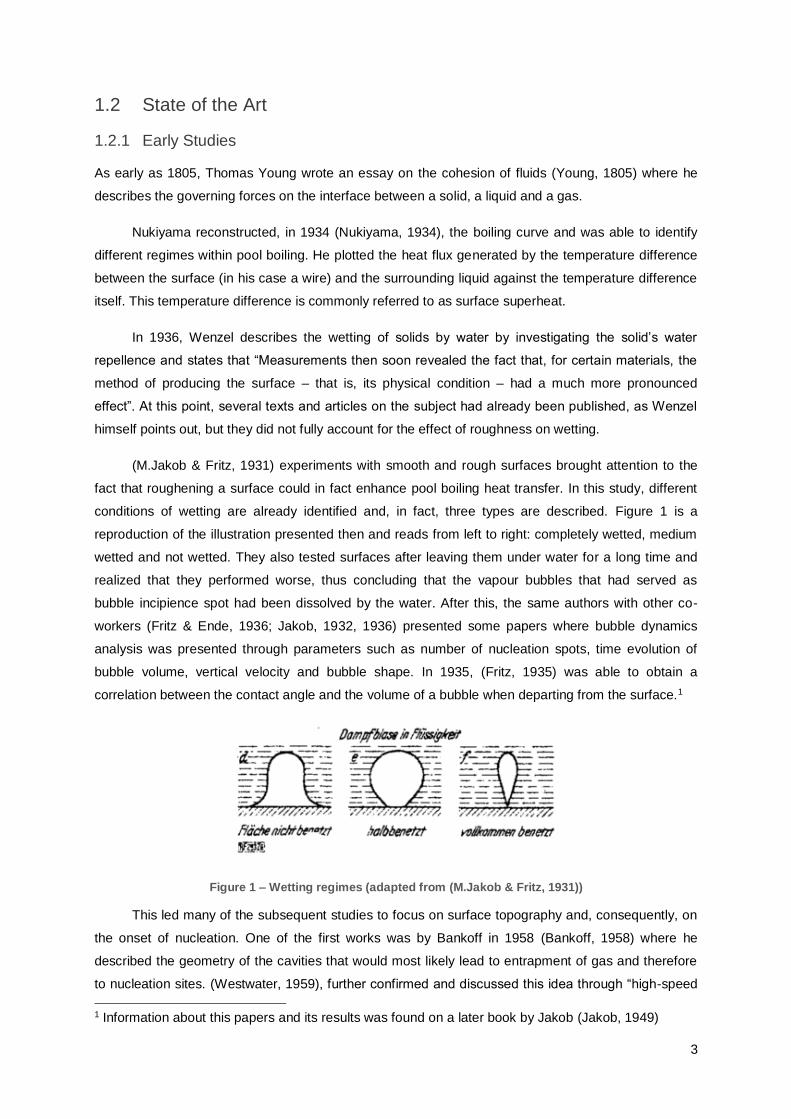
conditions of wetting are already identified and, in fact, three types are described. Figure 1 is a
reproduction of the illustration presented then and reads from left to right: completely wetted, medium
wetted and not wetted. They also tested surfaces after leaving them under water for a long time and
realized that they performed worse, thus concluding that the vapour bubbles that had served as
bubble incipience spot had been dissolved by the water. After this, the same authors with other co-
workers (Fritz & Ende, 1936; Jakob, 1932, 1936) presented some papers where bubble dynamics
analysis was presented through parameters such as number of nucleation spots, time evolution of
bubble volume, vertical velocity and bubble shape. In 1935, (Fritz, 1935) was able to obtain a
correlation between the contact angle and the volume of a bubble when departing from the surface.1
Figure 1 – Wetting regimes (adapted from (M.Jakob & Fritz, 1931))
This led many of the subsequent studies to focus on surface topography and, consequently, on
the onset of nucleation. One of the first works was by Bankoff in 1958 (Bankoff, 1958) where he
described the geometry of the cavities that would most likely lead to entrapment of gas and therefore
to nucleation sites. (Westwater, 1959), further confirmed and discussed this idea through “high-speed
1 Information about this papers and its results was found on a later book by Jakob (Jakob, 1949)
4
motion pictures” taken through a microscope of the incipience of boiling. This was also confirmed by
(Griffith & Wallis, 1958) who additionally claim that only one dimension (mouth radius of cavity) is
needed to find out at which temperature bubbles will nucleate (assuming liquid properties are known).
(Hsu, 1962), gave even further insight by incorporating these earlier theories into a model that also
considered the thermal layer and introducing new conditions for a cavity to be activated.
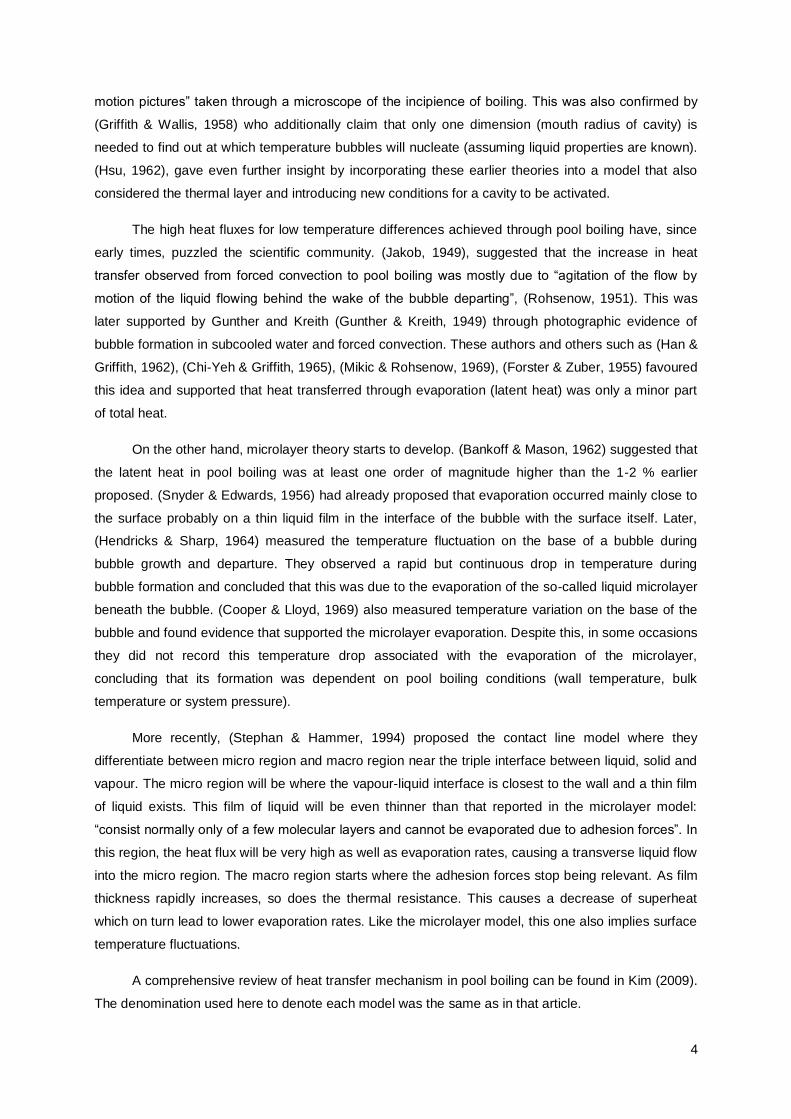
The high heat fluxes for low temperature differences achieved through pool boiling have, since
early times, puzzled the scientific community. (Jakob, 1949), suggested that the increase in heat
transfer observed from forced convection to pool boiling was mostly due to “agitation of the flow by
motion of the liquid flowing behind the wake of the bubble departing”, (Rohsenow, 1951). This was
later supported by Gunther and Kreith (Gunther & Kreith, 1949) through photographic evidence of
bubble formation in subcooled water and forced convection. These authors and others such as (Han &
Griffith, 1962), (Chi-Yeh & Griffith, 1965), (Mikic & Rohsenow, 1969), (Forster & Zuber, 1955) favoured
this idea and supported that heat transferred through evaporation (latent heat) was only a minor part
of total heat.
On the other hand, microlayer theory starts to develop. (Bankoff & Mason, 1962) suggested that
the latent heat in pool boiling was at least one order of magnitude higher than the 1-2 % earlier
proposed. (Snyder & Edwards, 1956) had already proposed that evaporation occurred mainly close to
the surface probably on a thin liquid film in the interface of the bubble with the surface itself. Later,
(Hendricks & Sharp, 1964) measured the temperature fluctuation on the base of a bubble during
bubble growth and departure. They observed a rapid but continuous drop in temperature during
bubble formation and concluded that this was due to the evaporation of the so-called liquid microlayer
beneath the bubble. (Cooper & Lloyd, 1969) also measured temperature variation on the base of the
bubble and found evidence that supported the microlayer evaporation. Despite this, in some occasions
they did not record this temperature drop associated with the evaporation of the microlayer,
concluding that its formation was dependent on pool boiling conditions (wall temperature, bulk
temperature or system pressure).
More recently, (Stephan & Hammer, 1994) proposed the contact line model where they
differentiate between micro region and macro region near the triple interface between liquid, solid and
vapour. The micro region will be where the vapour-liquid interface is closest to the wall and a thin film
of liquid exists. This film of liquid will be even thinner than that reported in the microlayer model:
“consist normally only of a few molecular layers and cannot be evaporated due to adhesion forces”. In
this region, the heat flux will be very high as well as evaporation rates, causing a transverse liquid flow
into the micro region. The macro region starts where the adhesion forces stop being relevant. As film
thickness rapidly increases, so does the thermal resistance. This causes a decrease of superheat
which on turn lead to lower evaporation rates. Like the microlayer model, this one also implies surface
temperature fluctuations.
A comprehensive review of heat transfer mechanism in pool boiling can be found in Kim (2009).
The denomination used here to denote each model was the same as in that article.
5
All these phenomena are directly influenced by bubble dynamics, namely bubble departure
diameter, bubble departure frequency and bubble contact angle. Also, the interaction between the
different nucleation sites, i.e. bubbles rising from them, is of great importance. Wettability has a key
role in these dynamics.
1.2.2 Wettability studies
Wettability is influenced by surface topography and chemistry and also by liquid properties. This
makes it difficult to isolate the separate effects of these three when dealing with influence of wettability
on pool boiling. For instance, increasing surface roughness can increase the heat transfer coefficient
but this might be due to the increase in the contact area as well as the changes it causes in the
contact angle. Many early studies actually focused on changing surface roughness stochastically
such as (Messina & Park, 1981) or (Kurihara & Myers, 1960). Others instead address varying surface
topography through organized structures as done by (Anderson & Mudawar, 1989), (Honda,
Takamastu, & Wei, 2001), (Wei & Honda, 2003) or (Yao, Lu, & Kandlikar, 2011). As argued by (Jones,
McHale & Garimella, 2009), it is difficult to characterize a surface based on available parameters as 𝑅𝑞
(rms roughness) or 𝑅𝑎 (average roughness) because these parameters cannot accurately relate the
performance of the surface in pool boiling with its topography. Two surfaces might have similar values
of these parameters, but if the shape of valleys and peak is different, the effect on wettability will be
different. It is worth mentioning, as stated by many authors, e.g. (Ahn et al., 2010) or (Bourdon,
Rioboo, Marengo, Gosselin, & De Coninck, 2012) that surface roughness affects pool boiling on a
higher degree at low heat fluxes acting over the density of nucleation sites.
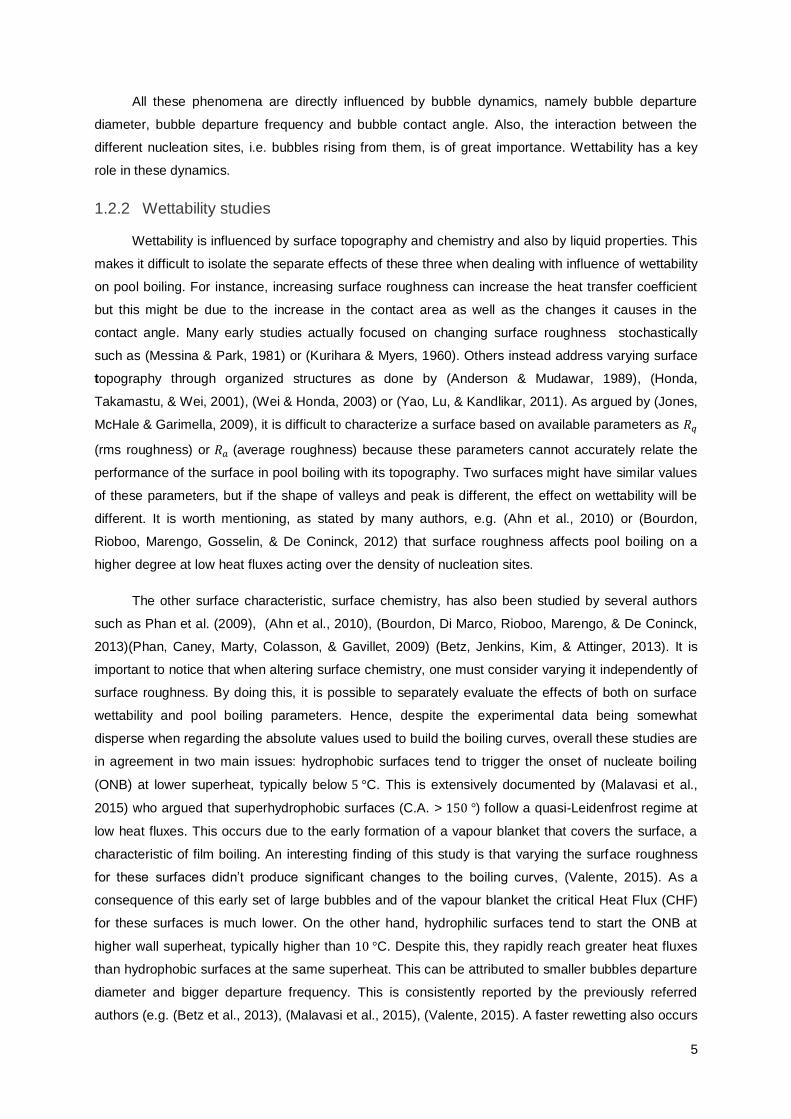
The other surface characteristic, surface chemistry, has also been studied by several authors
such as Phan et al. (2009), (Ahn et al., 2010), (Bourdon, Di Marco, Rioboo, Marengo, & De Coninck,
2013)(Phan, Caney, Marty, Colasson, & Gavillet, 2009) (Betz, Jenkins, Kim, & Attinger, 2013). It is
important to notice that when altering surface chemistry, one must consider varying it independently of
surface roughness. By doing this, it is possible to separately evaluate the effects of both on surface
wettability and pool boiling parameters. Hence, despite the experimental data being somewhat
disperse when regarding the absolute values used to build the boiling curves, overall these studies are
in agreement in two main issues: hydrophobic surfaces tend to trigger the onset of nucleate boiling
(ONB) at lower superheat, typically below 5 °C. This is extensively documented by (Malavasi et al.,
2015) who argued that superhydrophobic surfaces (C.A. > 150 °) follow a quasi-Leidenfrost regime at
low heat fluxes. This occurs due to the early formation of a vapour blanket that covers the surface, a
characteristic of film boiling. An interesting finding of this study is that varying the surface roughness
for these surfaces didn’t produce significant changes to the boiling curves, (Valente, 2015). As a
consequence of this early set of large bubbles and of the vapour blanket the critical Heat Flux (CHF)
for these surfaces is much lower. On the other hand, hydrophilic surfaces tend to start the ONB at
higher wall superheat, typically higher than 10 °C. Despite this, they rapidly reach greater heat fluxes
than hydrophobic surfaces at the same superheat. This can be attributed to smaller bubbles departure
diameter and bigger departure frequency. This is consistently reported by the previously referred
authors (e.g. (Betz et al., 2013), (Malavasi et al., 2015), (Valente, 2015). A faster rewetting also occurs
6
for hydrophilic surfaces, which also contributes to higher CHF. Several authors have studied this
subject both theoretically, (Kutateladze, 1951), (Rohsenow, W. M., and Griffith, 1956), (Zuber, 1959),
(Lienhard, J. H., and Dhir, 1973),(Kandlikar, 2001) and experimentally (e.g. (S. J. Kim, Bang,
Buongiorno, & Hu, 2007), (Ahn et al., 2010), (Forrest et al., 2010), (Kamatchi & Venkatachalapathy,
2015). Taking hydrophilicity to the extreme, (contact angle close to zero) the liquid completely wets the
surface. Consequently, it requires the highest wall superheat, but also leads to the highest CHF and
HTC (e.g. Takata et al., 2003, Betz, 2013). The bubbles also depict the smallest departure diameters
and highest departure frequencies, eve when compared to hydrophilic surfaces (e.g. Nam, et al.,
2011).
Based on the aforementioned observations, some authors such as (Betz et al., 2010) argued
that the best wetting solution for pool boiling applications relies on the development of surfaces with
mixed wettability characteristics, which henceforth will be designated biphilic:
hydrophilic/superhydrophilic surfaces patterned with hydrophobic/superhydrophobic spots. This
concept was probably first explored by (Hummel, 1965) who argue that the rate of boiling can be
increased by providing a relatively heterogeneous surface which consists of a plurality of spots of
hydrophobic substance and a somewhat larger area of wettable or hydrophilic portions. No other
studies on this type of surfaces are reported during the following decades, until, in the end of last
decade, (Jo et al., 2009) reconstructed the boiling curves of hydrophilic surfaces (= 60 °) with 1
millimetre diameter dots of hydrophobic material (Teflon = 1260 °). Among the surfaces tested by (Jo
et al., 2009), the highest HTC was obtained with 9 of these dots, despite having a lower CHF than the
bare surface. (Betz et al., 2010) also carried out experiments on biphilic surfaces, both with
hydrophobic islands on a hydrophilic surface and vice versa. The contact angles were similar to those
reported by (Jo et al., 2009). (Betz et al., 2013) concluded that the first combination (hydrophobic
islands on hydrophilic surfaces) improved both HTC and CHF, while the second only improved the
HTC with a lower CHF than the bare surface (hydrophilic). This can be due to the larger hydrophobic
area of this second type of biphilic surface, since (Jo et al. 2011) showed that the critical heat flux was
more dependent on the area ratio between hydrophobic islands and hydrophilic substrate than on the
pitch and diameter of the islands. This trend was even more prominent for lower pitch and diameter
ratios. Again, the contact angles were 60 ° for the hydrophilic and 120 ° for hydrophobic regions,
respectively. Later, Jo et al. (2011, 2014) investigated the effect of varying the pitch, diameter and
number of hydrophobic sites. They concluded that the influence of the area ratio of hydrophobic dots
to heating surface had the most predominant effects on CHF and that pitch and diameter size and
number of spots dominated the effect on HTC.
Betz et al. (2013) fabricated biphilic surfaces (contact angles 20° for the hydrophilic regions and
120° for the hydrophobic spots) and superbiphilic surfaces (with 0° for superhydrophilic regions and
150° for superhydrophobic spots). They compared HTC with the results obtained using two
nanofabricated surfaces, previously reported in the literature (Chen et al. 2009, Ahn et al., 2010),
which depicted the highest observed HTC in literature, and concluded that their biphilic surfaces
presented comparable HTC while the superbiphilic presented a threefold in the HTC. They established

7
that this enhanced performance was due to the fact that the hydrophobic (and superhydrophobic)
spots would facilitate nucleation and provide for numerous nucleation sites while the hydrophilic (and
superhydrophilic) area around would prevent bubbles from growing too big, coalesce and form an
insulating vapour blanket.
Jo et al. (2016) further extended the study of pool boiling on biphilic surfaces to include a bubble
dynamics analysis. The experiments were performed on a single hydrophobic dot (C.A. = 123° )
surrounded by a hydrophilic area (C.A.= 54°). Different size dots were studied with a diameter ranging
between 1, 4 and 6 mm. A single bubble would grow on the dot starting with a smaller base diameter
than the dot itself and departing only after the bubble boundary reached the border of the dot. Here,
because of the discontinuity on the surface wettability, the bubble would stop growing and the
interface was pinned on the boundary. As the bubble kept growing, the contact angle first decreased
and then increased when the bubble started to grow vertically, until it detached. It is important to clarify
that the bubble contact angle is measured on the inside of the bubble, which means it is on the vapour
side just as the droplet static (or quasi-static) contact angle measured to characterize the surfaces.
When working with patterns of several 50 and 100 μm dots, it was reported that the bubble no longer
displayed the pinning behaviour. The authors theorized that this would occur since instead of one big
wettability boundary, there were several smaller ones, which allowed the bubble to grow beyond the
dot where it nucleated. When the pitch was the smallest, more bubbles would coalesce creating bigger
bubbles departing from the surface. Jo et al (2016) also reported that after the bubble is released from
the hydrophobic dot, the base of the bubble stays attached to the surface. The next bubble will then
start to grow from this vapour blanket. Due to the small pitch between dots, interaction between
bubbles from each dot would occur. Hence, when the bubble merged, it was possible for water to be
trapped under the vapour. Following these observations, Jo et al (2016) concluded that the
vaporization of this liquid would cause an even further increase of the HTC when compared to
homogeneous hydrophilic surfaces. The bubble confinement was previously reported by Chen and
Qiu (2015).
Despite these few studies, supporting the best performance of biphilic surfaces, investigation on
the use of these surfaces is still scarce, particularly concerning bubble dynamics. The data reported
can also be relatively sparse with varying HTC and CHF values among different studies. So, deeper
understanding and consensual description of the physics governing the reported phenomena is
required.
8
1.3 Objectives
Following the context and state of the art the main objectives of this work can then be summarized as:
1. Test biphilic surfaces under pool boiling to recreate the boiling curves. The main purpose in
not to obtain the best performing surfaces providing the highest CHT and HTC, but instead to
be able to describe the processes governing the typical phenomena reported when using the
biphilic surfaces;
2. Vary the patterns of biphilic surfaces to infer on its influence on pool boiling;
3. Characterize bubble dynamics (diameter and contact angle temporal evolution, contact line
velocity and bubble frequency) to relate it with the heat transfer measurements (taken with the
pool boiling curves to better describe the difference of using these surfaces, when compared
to those with uniform wettability;
4. Perform a preliminary test on superhydrophilic surfaces also to recreate the boiling curve.
9
1.4 Thesis Outline
The present work is organized in 5 main sections. The first and present one where the scope of
the work is presented along with its objectives and the current stage of scientific knowledge in this
area. The second section will focus on theoretical aspects which are required to understand the
results discussed in section 4. This section deepens the main topics addressed in the State of the Art.
The third section describes the experimental methodology followed to perform this work. Hence, a
complete description of the experimental set-up and procedures is provided in this section, including
how the surfaces where prepared and characterized. Moreover, this section will present the
methodology used to extract bubble dynamics parameters and the uncertainties considered in this
work. The fourth section presents and discusses the experimental results. The last section will focus
on the conclusions drawn from this work and proposes future work that may be developed in
forthcoming studies.

10
2 Theoretical Background

11
2.1 Pool Boiling
Pool boiling occurs on a surface that is at a higher temperature, wall superheat, than the
saturation temperature of the fluid with which it is in contact, 𝑇𝑊 − 𝑇𝑠𝑎𝑡. This temperature difference will
correspond to a heat flux q, from the wall to the liquid. This relation is graphically represented by the
boiling curves. Shiro Nukiyama in 1934 developed an experiment that allowed for one of the first
representations of this curves (Nukiyama, 1934). Figure 2 is a curve similar to the one presented by
Nukiyama in his paper but without the connected lines in the transition regime that he conjectured.
The curves can be built considering the heat flux as the independent variable, as done by Nukiyama,
or considering the wall superheat as the independent variable, as considered by (Berenson, 1960).
Figure 2 – Pool boiling curve. (Source: Lienhard,J.H.,A Heat Transfer Textbook, Prentice Hall Inc., Englewood)
Five main regimes can be identified on the boiling curve. Each of them has a different behaviour
both in terms of dynamics of the bubbles and in the boiling curve itself. Figure 2 identifies these
regimes which are related with the concepts introduced next.
When superheat is still too low to promote phase change from liquid to vapour, the heat is
transferred through natural convention. The flow of the liquid (if no liquid movement is promoted by
external devices) will be due to the temperature gradient that causes density variations across the
liquid. These density variations are the base of the buoyance forces that promote liquid flow. If
superheat increases beyond a certain value, then sufficient energy will eventually be supplied to the
liquid for boiling to take place. In, this region bubbles start to growth from nucleation sites. The change
in regime is accompanied by a sharp increase in the heat transfer coefficient, which can be seen in

12
Figure 2 by the increase in the curve’s slope. This region is referred to as partial nucleate boiling or
region of isolated bubbles. With the increase in superheat, more nucleation sites are activated and
interaction phenomenon between bubbles starts to take place. Bubbles start to merge and form
vapour columns or jets. This regime, known as the jets and columns region or full nucleate boiling is
the regime allowing to extract huge amounts of heat with relatively low superheat.
A further increase of superheat will lead to peak heat flux or critical heat flux or also called
burnout point. Here two paths can be taken. If one is controlling heat flux, then the superheat will
increase very rapidly and film boiling will start. Here the entire surface is covered with a vapour blanket
which will considerably increase thermal resistance. In practical application this is never desired since
in will very likely structurally damage the surface. If the independent variable is superheat, then
transition boiling will start with further increases of superheat and the heat flux will actually decrease
until it reaches minimum value. From this point on, film boiling will start and heat flux will again
increase.
Wettability has a key role here since it can change the superheat at which these transitions
happen. For instance, poor wettability (i.e. hydrophobicity) can anticipate the start of nucleate boiling
but it also anticipates the critical heat flux. On the other hand, surfaces with good wettability (i.e.
hydrophilicity) can delay the critical heat flux by providing better rewetting of the surface. For better
understating these mechanisms, the next sections will focus on wettability, nucleation and bubble
dynamics, all of which have major effects on pool boiling heat transfer.
2.2. Wettability
Wettability can be defined as the affinity of a surface to a liquid. It is quantified by the contact
angle between the liquid-gas interface and the gas-solid interface at the triple contact line as
represented in Figure 3. It influences pool boiling at all levels from onset of nucleate boiling to critical
flux.
Figure 3 – Contact angle and balance of forces as defined by Young’s equation, (Source: (Grundke et al., 2015))
Usually wetting regimes are referred to as complete wetting and partial wetting. Complete
wetting means that the contact angle is zero or very close to zero and the liquid completely spreads
over the surface. On the other hand, partial wetting can comprise different “sub-regimes” depending
on the value of the contact angle. If the contact angle is below ninety degrees, then the surface will
13
have affinity to wetting and the liquid will tend to spread on the surface. If the contact angle is above
ninety degrees (also referred to has nonwetting) then the “liquid tends to ball up and run off the
surface easily”, (W. Adamson, 1976).
When the liquid advances along the surface, a change on the surface free energy occurs, which
is proportional to the change in wetted area:
𝜟𝑮𝒔 = 𝜟𝑨 (𝜸𝑺𝑳 − 𝜸𝑺𝑽) + 𝜟𝑨𝜸𝑳𝑽𝒄𝒐𝒔 (𝜣 − 𝜟𝜣) ( 1 )
When equilibrium (minimization of free energy) between the three phases is reached, and
considering constant temperature and pressure, one reaches the commonly called Young’s equation
or Young-Dupré equation represents the equilibrium condition between the liquid, the solid and the
vapor. Setting:
𝒍𝒊𝒎𝜟𝑨→𝟎
𝜟𝑮𝒔/𝜟𝑨 = 𝟎 ( 2 )
Which yields:
𝜸𝑳𝑽 𝒄𝒐𝒔(𝜣𝒆) = 𝜸𝑺𝑽 − 𝜸𝑺𝑳 ( 3 )
This equation is valid for smooth homogenous surfaces which do not exist. Also, this angle,
static contact angle, represents an ideal or theoretical angle for static conditions. Many considerations
arise from this equation. These comprise the chemical and structural non-uniformity or the fact that it
has never been experimentally verified due to the difficulty in measuring the interfacial tension
between a solid and a fluid. A more fundamental question is whether it accurately represents a
thermodynamic equilibrium (of the surface) since the vertical component of 𝛾𝐿𝑉 is not considered
which might produce local stresses at the molecular level, altering the shape of the surface. (Hiemenz
& Rajagopalan, 1997), (W. Adamson, 1976) and (Decker, Frank, Suo, & Garoff, 1999).
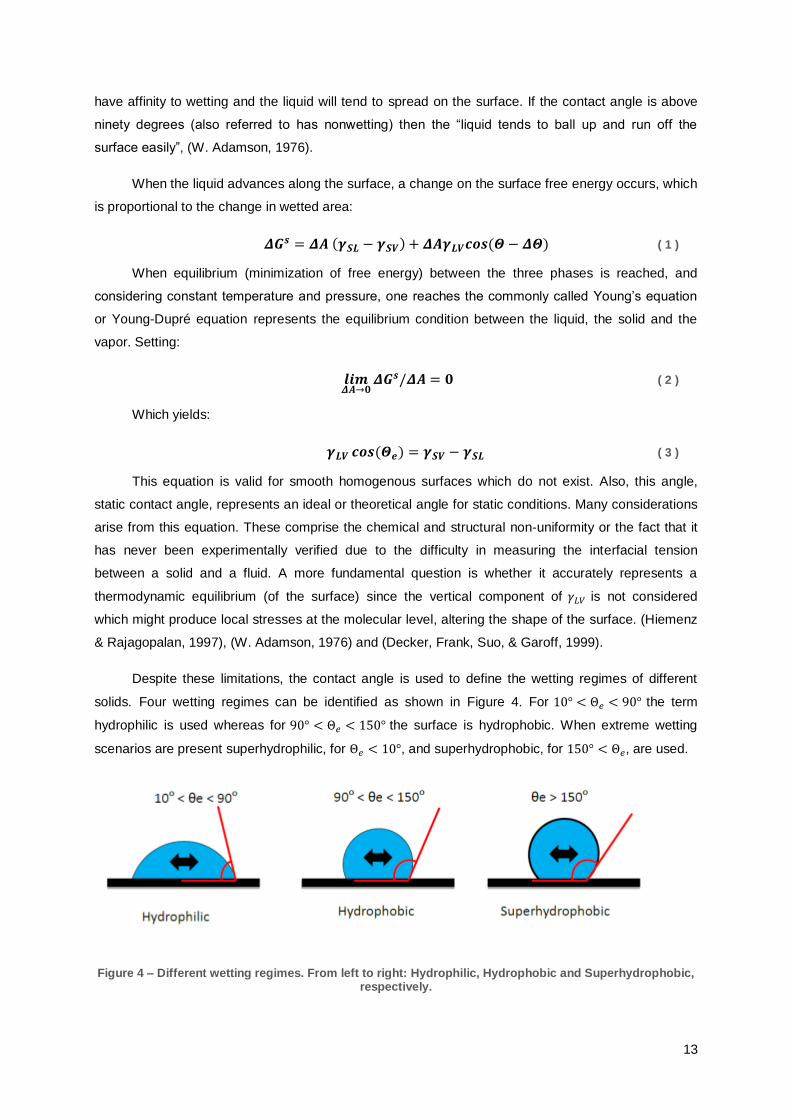
Despite these limitations, the contact angle is used to define the wetting regimes of different
solids. Four wetting regimes can be identified as shown in Figure 4. For 10° < Θ𝑒 < 90° the term
hydrophilic is used whereas for 90° < Θ𝑒 < 150° the surface is hydrophobic. When extreme wetting
scenarios are present superhydrophilic, for Θ𝑒 < 10°, and superhydrophobic, for 150° < Θ𝑒, are used.
Figure 4 – Different wetting regimes. From left to right: Hydrophilic, Hydrophobic and Superhydrophobic, respectively.

14
In practice, no surface is completely homogenous. However, the whole surface generally fits
within a single regime unless it is the desire of the individual to have a heterogeneous wetting regime.
In this case a surface might have a well-defined pattern of areas with hydrophobic characteristics
interposed with hydrophilic areas. This type of surfaces has been previously introduced in 1.2
State of the Art, and, may be called biphilic surfaces (hydrophilic vs hydrophobic areas),
superbiphilic surfaces (superhydrophobic vs superhydrophilic surfaces), (Betz et al., 2013), or mixed
surfaces, (Jo, Park, & Kim, 2016) and wettability patterned surfaces, (Lee & Lee, 2016). Throughout
this study the general denomination used for this kind of surfaces will be biphilic such as previously
stated. Biphilic surfaces introduce an additional feature since there is an interface between regions of
different wettability.
The unintentional non-homogeneity of a surface, both in roughness and chemical terms, can
have a particular strong effect on superhydrophobic surfaces. When dealing with dynamic processes
where the drop is not static, one may be confronted with two different contact angles, an advancing
contact angle at the front of the advancing drop and a receding contact angle as the droplet recedes.
The difference between these two angles is the contact angle hysteresis and it is a “measure of
energy dissipation during the flow of a droplet along a solid surface”, (Bhushan & Jung, 2011). This
author considers that superhydrophobic surfaces should have a very low value of hysteresis (<10º)
specially when concerning self-cleaning applications.
Another important aspect of wettability related to the roughness of the surface is how the
surface is wetted. This was theoretically explained earlier by (Wenzel, 1936) and later by (Cassie &
Baxter, 1944). The former considers that liquid completely wets the solid including all cavities, which
means that the actual area of contact will be larger than the geometrical one. This leads to a change in
the force balance at the contact line. Wenzel adapted the original Young’s equation (equation 3) with
the inclusion of a roughness factor r:
𝒓 =𝒂𝒄𝒕𝒖𝒂𝒍 𝒂𝒓𝒆𝒂
𝒈𝒆𝒐𝒎𝒆𝒕𝒓𝒊𝒄 𝒂𝒓𝒆𝒂 ( 4 )
Cassie and Baxter extended this analysis to porous surfaces where air or gas may be trapped
in the cavities of the surfaces, (Cassie & Baxter, 1944).
It is now important to distinguish between wettability concerning a droplet and a bubble. In the
later, under pool boiling, the vapour bubble has interfaces with a surface and liquid while the droplet is
surrounded by air and the surface. The static contact angle measured with the droplet is useful to
characterize the surface, however, when concerning the dynamics of pool boiling, one has to consider
that it is no longer a static phenomenon. Also, it is clear that the forces represented in Figure 3 will be
reversed. The new force balance is shown on Figure 5.
During pool boiling the bubble grows until detaching from the surface. During this process,
evaporation is taking place at very high rates and, according to the previously presented contact line
model, this occurs very close to the triple contact line. This can induce changes in the contact angle at
length scales too small to be observed.

15
Phan et al (2012) discussed the fact that the micro contact angle formed inside the bubble will
determine the force relation at the contact line. The direction of this force will make the contact line
move inward and outward relative to the bubble axis. This receding and advancing of liquid will also
produce changes in the macro-contact angle. The macro contact angle should be the one that is
observed at naked eye. This model is still not fully validated since there is no direct observation of this
micro contact angle and more measurements are needed to compare results.
Figure 5: Force balance on the triple contact of a bubble.
In this work only the macro contact angle is measured as well as the tracking of its evolution
during bubble growth.
2.3 Nucleation
On the field of pool boiling nucleation can be described as the phase change from liquid to
vapour. The vapour can either be completely surrounded by liquid, denominated homogenous
nucleation, or surrounded by liquid and a solid surface, denominated heterogeneous nucleation.
In pool boiling, nucleation generally takes place from a pre-existing volume of gas trapped in a
cavity of the surface. Some controversy may exist in defining this phenomenon as heterogeneous
nucleation since a gas phase is already present, nevertheless this denomination will be used here
since it is commonly used to refer to the birth of the bubble.
(Corty & Foust, 1955) came to the conclusion that surface roughness influenced the number of
nucleation sites and described a vapour entrapment mechanism that would account for the differences
observed in the boiling curves. After this (Bankoff, 1958) developed the first quantification method for
gas entrapment in V-shaped and rounded cavities. In the first case, he asserted that the condition for
gas entrapment should be:
𝟐𝜱 > 𝜣 ( 5 )
Where Φ is the angle between the wall of the cavity and the horizontal direction and Θ is the
contact angle of the advancing liquid layer as shown in Figure 6. Bankoff also conluded that rounded
𝜎𝑙𝑣
𝜎𝑠𝑙 𝜎𝑠𝑣

16
cavities, such as the one in Figure 6, would be poor entrapment cavities since very high contact
angles would be necessary, according to this criterion.

17
Figure 6 – Conditions of entrapment of gas in a V shaped cavity (left) and on a rounded on (right), (Source: (Bankoff, 1958))
Several other authors also studied entrapment mechanisms such as (Westwater, 1959),
(Kurihara & Myers, 1960), (Lorenz, Mikic, & Rohsenow, 1972) or (Wang & Dhir, 1993). Once gas is
trapped in a cavity it will only become an active nucleation site if a minimum energy barrier is
transposed. Different models have been proposed to explain this. The classical model by (Hsu, 1962)
is described here, together with two more recent ones which relate the criteria to the activation of the
nucleation site to wettability.
Including a superheated layer near the wall in his model (Hsu, 1962) postulated the criteria for a
cavity to become active. He assumed a transient-conduction profile between the wall and the limit of
the superheated layer and found the bubble temperature using the Clausius-Claperon equation, a
distinction from previous authors that had used it directely to predict the superheat corresponding to
inception of boiling.
𝑻𝒃 = 𝑻𝒔𝒂𝒕 +𝟐𝝈𝒍𝒗𝑻𝒔𝒂𝒕
𝒉𝒇𝒈𝝆𝒗𝒓𝒏 ( 6 )
Here 𝑇𝑏 is the bubble temperature, 𝑇𝑠𝑎𝑡 is the saturation temperature of the liquid, 𝜎𝑙𝑣 is liquid-
vapour tension, ℎ𝑓𝑔 is the latent heat of vaporization, 𝜌𝑣 is the vapour density and 𝑟𝑛 is the bubble
nucleous radius. The condition for a bubble to start to grow is that the surrounding liquid temperature
at the same distance from the wall as the bubble nucleous height should be equal (or greater) than the
bubble saturation temperature corresponding to the pressure inside the bubble.
More recent models were proposed by Quan et al (2011) and later discussed by Dong et al
(2012) and are based on the Gibbs free energy and availability equation.
(Quan, Chen, & Cheng, 2011) defined the change in Gibbs free energy variation as:
𝒅𝑮 = 𝑮𝒗 − 𝑮𝒍 ( 7 )
For inception to take place, from a pre-existing vapour nucleous, then 𝑑𝐺 ≤ 0. This comes from
the assumption that the process occurs at constant pressure and temperature. Hence, from he second
law of thermodynamics 𝑑𝑆 ≥ 0 and from equation 8.
𝑮 = 𝑼 + 𝒑𝑽 − 𝑻𝑺 ( 8 )
18
Quan et al. (2011) then assumed that the temperature at the tip of the bubble had to be at least
the same as the saturation temperature corresponding to the liquids pressure and that the superheat
layer had a linear temperature profile (as also assumed by (Hsu, 1962). The authors also assume that
the temperature at the interface is the same in the liquid and in the vapour phase. From here they
developed equation 7 and set it to zero, Δ𝐺 = 0, in order to obtain the critical radius. Still, this is a
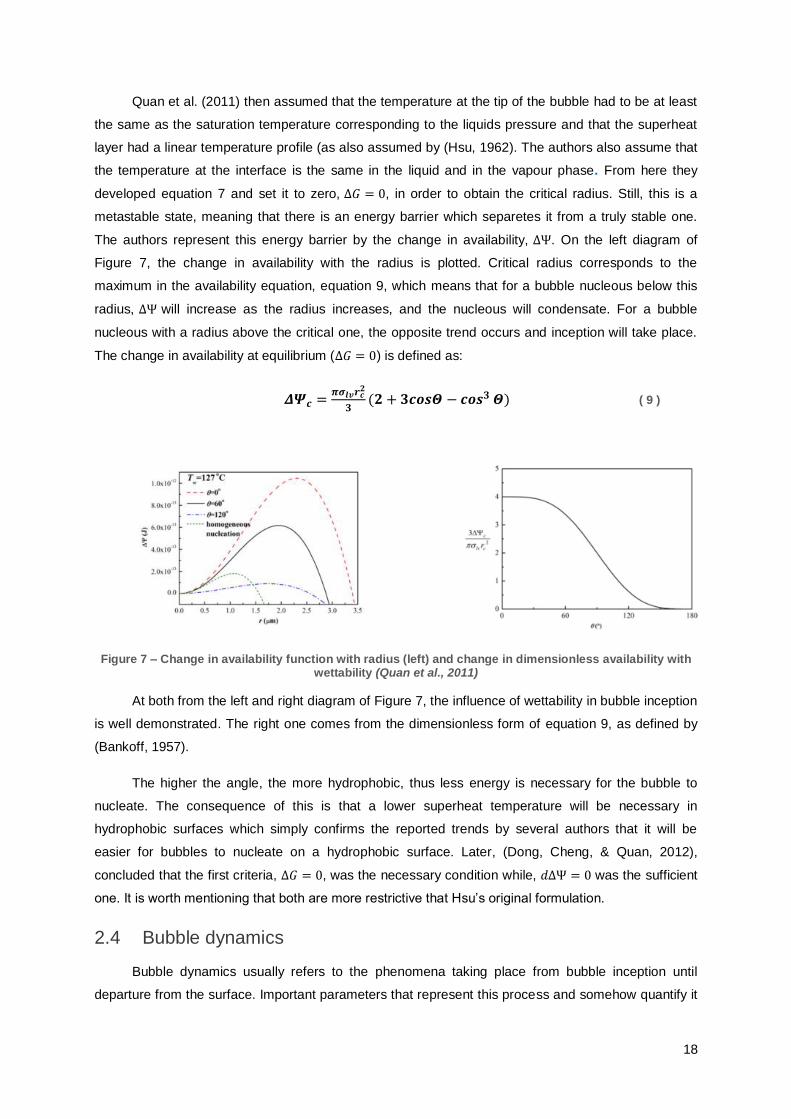
metastable state, meaning that there is an energy barrier which separetes it from a truly stable one.
The authors represent this energy barrier by the change in availability, ΔΨ. On the left diagram of
Figure 7, the change in availability with the radius is plotted. Critical radius corresponds to the
maximum in the availability equation, equation 9, which means that for a bubble nucleous below this
radius, ΔΨ will increase as the radius increases, and the nucleous will condensate. For a bubble
nucleous with a radius above the critical one, the opposite trend occurs and inception will take place.
The change in availability at equilibrium (Δ𝐺 = 0) is defined as:
𝜟𝜳𝒄 =𝝅𝝈𝒍𝒗𝒓𝒄
𝟐
𝟑(𝟐 + 𝟑𝒄𝒐𝒔𝜣 − 𝒄𝒐𝒔𝟑 𝜣) ( 9 )
Figure 7 – Change in availability function with radius (left) and change in dimensionless availability with wettability (Quan et al., 2011)
At both from the left and right diagram of Figure 7, the influence of wettability in bubble inception
is well demonstrated. The right one comes from the dimensionless form of equation 9, as defined by
(Bankoff, 1957).
The higher the angle, the more hydrophobic, thus less energy is necessary for the bubble to
nucleate. The consequence of this is that a lower superheat temperature will be necessary in
hydrophobic surfaces which simply confirms the reported trends by several authors that it will be
easier for bubbles to nucleate on a hydrophobic surface. Later, (Dong, Cheng, & Quan, 2012),
concluded that the first criteria, Δ𝐺 = 0, was the necessary condition while, 𝑑ΔΨ = 0 was the sufficient
one. It is worth mentioning that both are more restrictive that Hsu’s original formulation.
2.4 Bubble dynamics
Bubble dynamics usually refers to the phenomena taking place from bubble inception until
departure from the surface. Important parameters that represent this process and somehow quantify it
19
are: bubble departure frequency, 𝑓, bubble growth (i.e. bubble volume temporal evolution) and bubble
departure frequency. Other parameters that can also be of importance are the contact line velocity and
the dynamic contac angle.
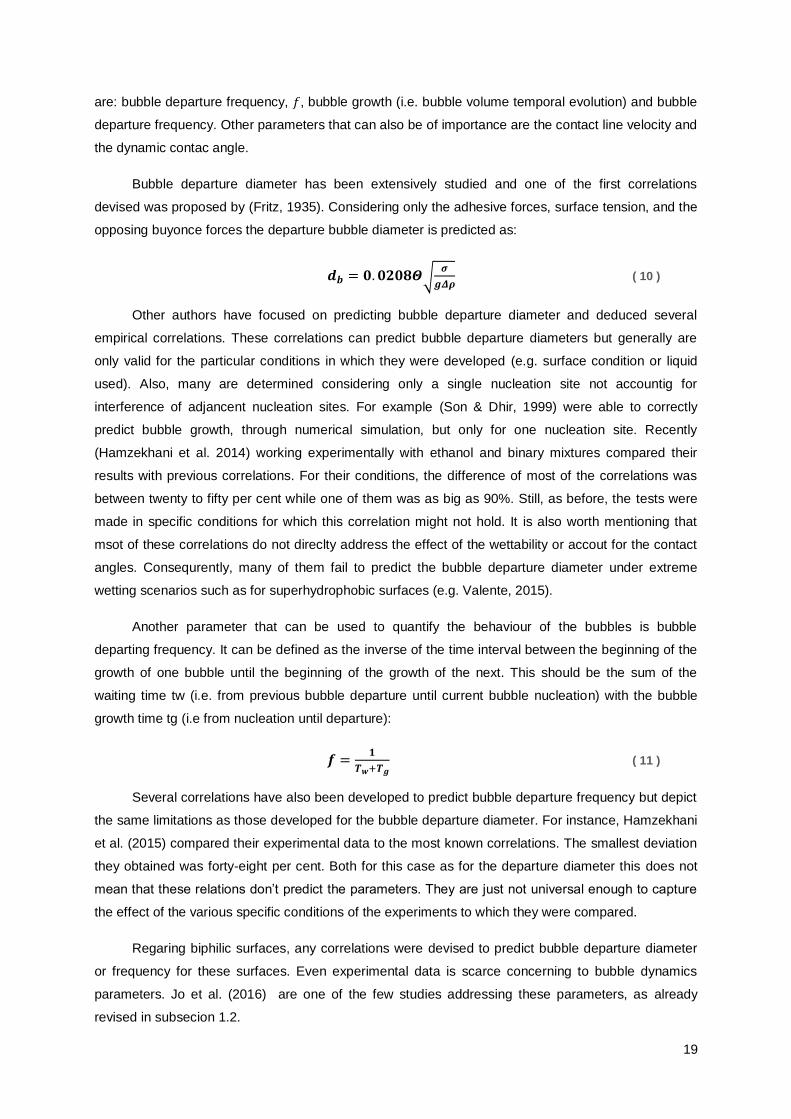
Bubble departure diameter has been extensively studied and one of the first correlations
devised was proposed by (Fritz, 1935). Considering only the adhesive forces, surface tension, and the
opposing buyonce forces the departure bubble diameter is predicted as:
𝒅𝒃 = 𝟎. 𝟎𝟐𝟎𝟖𝜣√𝝈
𝒈𝜟𝝆 ( 10 )
Other authors have focused on predicting bubble departure diameter and deduced several
empirical correlations. These correlations can predict bubble departure diameters but generally are
only valid for the particular conditions in which they were developed (e.g. surface condition or liquid
used). Also, many are determined considering only a single nucleation site not accountig for
interference of adjancent nucleation sites. For example (Son & Dhir, 1999) were able to correctly
predict bubble growth, through numerical simulation, but only for one nucleation site. Recently
(Hamzekhani et al. 2014) working experimentally with ethanol and binary mixtures compared their
results with previous correlations. For their conditions, the difference of most of the correlations was
between twenty to fifty per cent while one of them was as big as 90%. Still, as before, the tests were
made in specific conditions for which this correlation might not hold. It is also worth mentioning that
msot of these correlations do not direclty address the effect of the wettability or accout for the contact
angles. Consequrently, many of them fail to predict the bubble departure diameter under extreme
wetting scenarios such as for superhydrophobic surfaces (e.g. Valente, 2015).
Another parameter that can be used to quantify the behaviour of the bubbles is bubble
departing frequency. It can be defined as the inverse of the time interval between the beginning of the
growth of one bubble until the beginning of the growth of the next. This should be the sum of the
waiting time tw (i.e. from previous bubble departure until current bubble nucleation) with the bubble
growth time tg (i.e from nucleation until departure):
𝒇 =𝟏
𝑻𝒘+𝑻𝒈 ( 11 )
Several correlations have also been developed to predict bubble departure frequency but depict
the same limitations as those developed for the bubble departure diameter. For instance, Hamzekhani
et al. (2015) compared their experimental data to the most known correlations. The smallest deviation
they obtained was forty-eight per cent. Both for this case as for the departure diameter this does not
mean that these relations don’t predict the parameters. They are just not universal enough to capture
the effect of the various specific conditions of the experiments to which they were compared.
Regaring biphilic surfaces, any correlations were devised to predict bubble departure diameter
or frequency for these surfaces. Even experimental data is scarce concerning to bubble dynamics
parameters. Jo et al. (2016) are one of the few studies addressing these parameters, as already
revised in subsecion 1.2.
20
3 Experimental Method 3.1 Experimental Setup
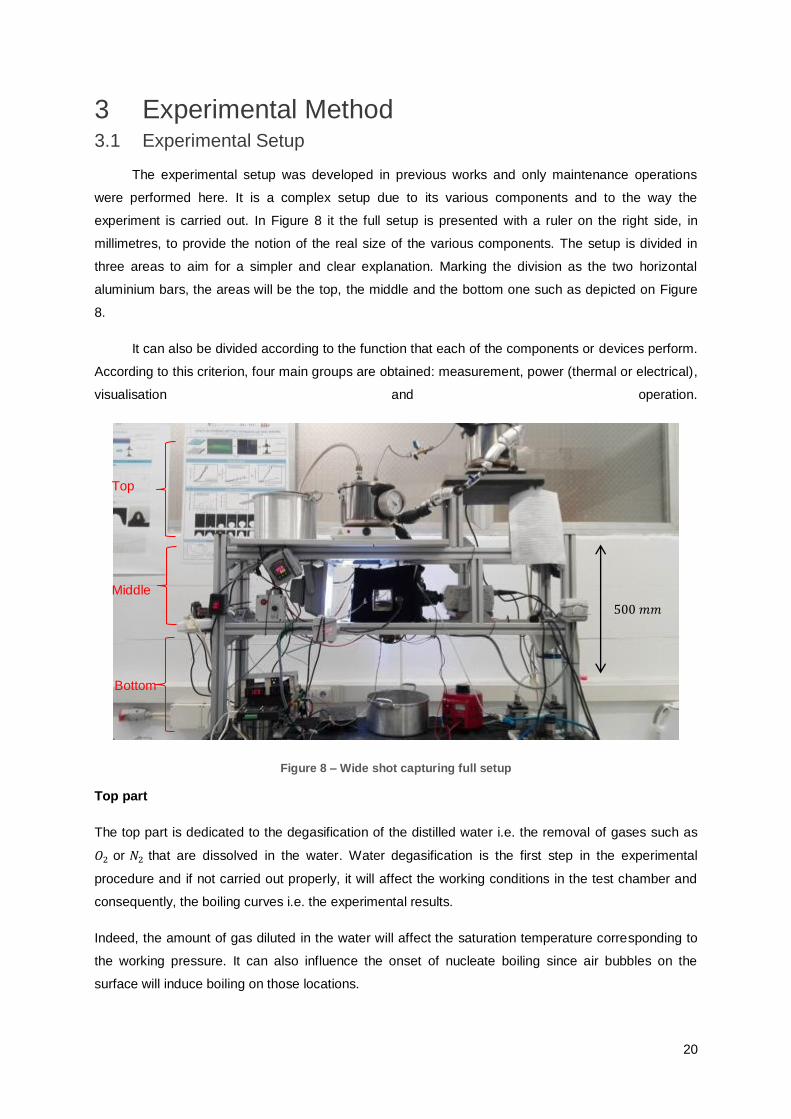
The experimental setup was developed in previous works and only maintenance operations
were performed here. It is a complex setup due to its various components and to the way the
experiment is carried out. In Figure 8 it the full setup is presented with a ruler on the right side, in
millimetres, to provide the notion of the real size of the various components. The setup is divided in
three areas to aim for a simpler and clear explanation. Marking the division as the two horizontal
aluminium bars, the areas will be the top, the middle and the bottom one such as depicted on Figure
8.
It can also be divided according to the function that each of the components or devices perform.
According to this criterion, four main groups are obtained: measurement, power (thermal or electrical),
visualisation and operation.
Figure 8 – Wide shot capturing full setup
Top part
The top part is dedicated to the degasification of the distilled water i.e. the removal of gases such as
𝑂2 or 𝑁2 that are dissolved in the water. Water degasification is the first step in the experimental
procedure and if not carried out properly, it will affect the working conditions in the test chamber and
consequently, the boiling curves i.e. the experimental results.
Indeed, the amount of gas diluted in the water will affect the saturation temperature corresponding to
the working pressure. It can also influence the onset of nucleate boiling since air bubbles on the
surface will induce boiling on those locations.
500 𝑚𝑚
Top
Middle
Bottom

21
For this operation, three reservoirs are used with a respective connection between them. Referring to
Figure 9:
1. Main reservoir connected directly to the test chamber with a 5 L capacity (index 2);
2. Manometer for pressure measurement inside the main reservoir (index 4)
3. Secondary reservoir for refilling of the main reservoir when it is discharged to the test
chamber. Also with a 5 L capacity (index 3);
4. Auxiliary reservoir for water vapour recovery (index 1).
5. Thermocouple in the main reservoir for temperature measurement
Figure 9 – Top part of set up: Degassing station
Middle part
The test chamber is where the pool boiling tests are conducted. It is a 40x40x40 mm cube
made of aluminium with side windows. Figure 10 shows a view of mid part of the set-up as well as a
schematic of the test chamber. It is possible to see the pressure transducer (OMEGADYNE) for
pressure measurement inside the chamber (index 1). Also, both thermocouple (type K) connections
can be seen on the schematic. One of the thermocouples is used to record the saturation pressure
and is placed close to the surface without perturbing the boiling phenomena. The other one is placed a
bit farther from the surface and is connected to a PID controller, which, in turn, controls the internal
resistances (index 2). Both thermocouples have a 1ºC precision while the pressure transducer
(OMEGA DYNE Inc.) has a 1.6 mbar precision.
The internal resistances have the function of maintaining the saturation temperature. For this
purpose to be achieved, their power is controlled through a rheostat. Additionally, a PID controller
(index 2) will turn them off or on according to the temperature measured by the referred thermocouple.
Two external resistances on the sides of the chamber were placed to minimize heat loss to the
exterior. These are also controlled by a rheostat which keeps them at a temperature of 120 °C.
1 2
4
3

22
Figure 10: Mid part of set up.
Figure 11 – Back view of set-up
One of the main objectives of this setup was to allow high speed image recording. A high speed
camera (Phantom v4.2 from Vision Research Inc.) records the videos at 2200 fps with a 512x512 pixel
resolution. For contrast, a 50 Watts pure white LED is placed on the opposite side of the chamber.
Also, to keep the camera from overheating, a fan is aimed directly at the camera
Tubes connect the main reservoir to the test chamber (index 1 of Figure 11). There is also a
connection for the outflow. Both the inflow and outflow are controlled by two electro valves (index 2 of
1
1
2
2
Outflow from tank
Outflow towards
recovery tank
Inflow towards tank
1
2
Outflow
Inflow
Window
Thermocouple
PID Thermocouple
Internal resistance
Heating cylinder
PEEK pins Teflon Block
Heat flux sensor
Base for heating block
attachement

23
Figure 11), which, in turn, are controlled by a National Instrument (NI) LabVIEW routine based on the
pressure transducer measurements. Through this system, atmospheric pressure is kept inside the test
chamber. This routine will be presented further ahead.
Probably the most critical component of this part of the set-up is the heating block, which is
composed by the following elements:
Support structure fabricated in Teflon due to its insulation properties (index 1 of Figure
12)
Heating cylinder (index 2 of Figure 12) with measurement devices
Polyether Ether Ketone (PEEK) pins for the surface attachment to the Teflon block (index
3 of Figure 12)
4 springs on the bottom to firmly hold the cylinder against the surface (index 4 of Figure
12)
Teflon piece between springs and cylinder for better insulation (index 5 of Figure 12)
Circular base made from aluminium for the attachment to the test chamber (index 6 of
Figure 12)
2 Vitton O-rings between the surface and Teflon block
2 Vitton O-rings on the circular base to prevent leakage to the exterior
One might notice that both the heating cylinder and the Teflon piece that supports it are hollow.
On the first case, this is in order to accommodate a cartridge heater of 315 watts. This is the
component that heats the surface. The teflon piece is hollow for the heat flux sensor and type T
thermocouple wires (index 8 of Figure 12) to pass through. Both sensors are manufactured and
assembled by Captec Enterprise. The heat flux sensor has a sensitivity of 1.55 mV/(W/m2).
As referred before, the testing surface (index 7 of Figure 12) is mounted at the top of the
heating block and firmly secured by PEEK pins and nuts. The two O-rings prevent the water from
infiltrating towards the heating cylinder. To assure the minimum thermal resistance, a thermal paste is
used (MK-5) between the sensor and the top of the surface. Nevertheless, this resistance exists and
further ahead it will be explained how its value was calculated. This is very important because to
reconstruct the boiling curves one must use the corrected surface temperature, taking the thermal
resistance into account. This is the one on the top of the surface. So, referring to the bottom right
image of Figure 12 it is possible to understand that one has to account for the contact resistance
between sensor and surface and across the surface itself.
3
3
7
24
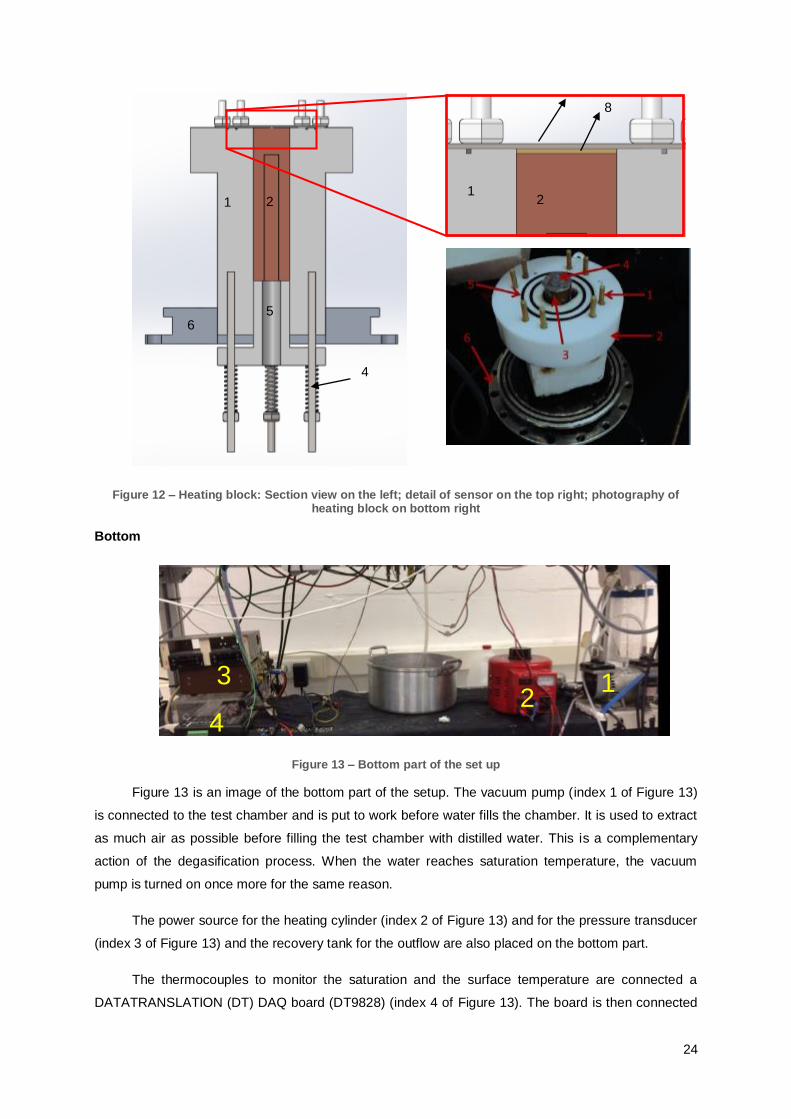
Figure 12 – Heating block: Section view on the left; detail of sensor on the top right; photography of heating block on bottom right
Bottom
Figure 13 – Bottom part of the set up
Figure 13 is an image of the bottom part of the setup. The vacuum pump (index 1 of Figure 13)
is connected to the test chamber and is put to work before water fills the chamber. It is used to extract
as much air as possible before filling the test chamber with distilled water. This is a complementary
action of the degasification process. When the water reaches saturation temperature, the vacuum
pump is turned on once more for the same reason.
The power source for the heating cylinder (index 2 of Figure 13) and for the pressure transducer
(index 3 of Figure 13) and the recovery tank for the outflow are also placed on the bottom part.
The thermocouples to monitor the saturation and the surface temperature are connected a
DATATRANSLATION (DT) DAQ board (DT9828) (index 4 of Figure 13). The board is then connected
1
2
1
2
4
5
6
8
1 2
3
4
25
to the computer where the read values are recorded. On the other hand, the heat flux sensor and
electro valves signals are received through a NI BNC-2120 acquisition board where are amplified and
transmitted to the LabVIEW routine.
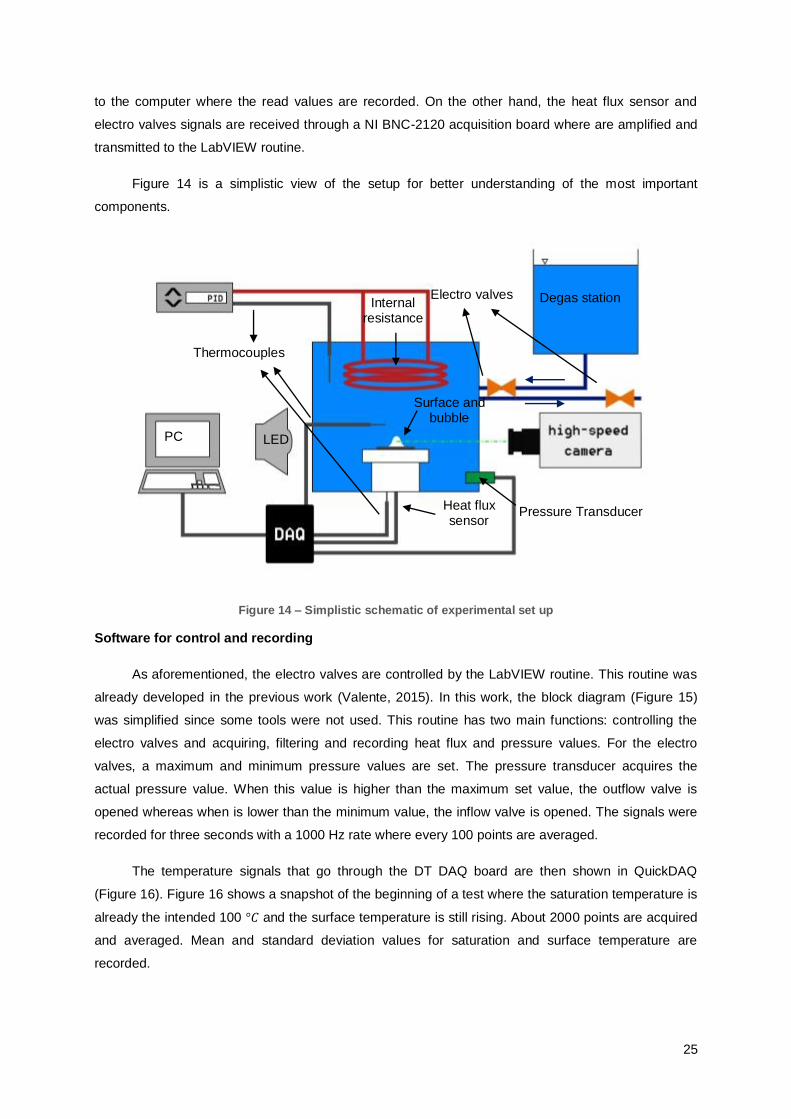
Figure 14 is a simplistic view of the setup for better understanding of the most important
components.
Figure 14 – Simplistic schematic of experimental set up
Software for control and recording
As aforementioned, the electro valves are controlled by the LabVIEW routine. This routine was
already developed in the previous work (Valente, 2015). In this work, the block diagram (Figure 15)
was simplified since some tools were not used. This routine has two main functions: controlling the
electro valves and acquiring, filtering and recording heat flux and pressure values. For the electro
valves, a maximum and minimum pressure values are set. The pressure transducer acquires the
actual pressure value. When this value is higher than the maximum set value, the outflow valve is
opened whereas when is lower than the minimum value, the inflow valve is opened. The signals were
recorded for three seconds with a 1000 Hz rate where every 100 points are averaged.
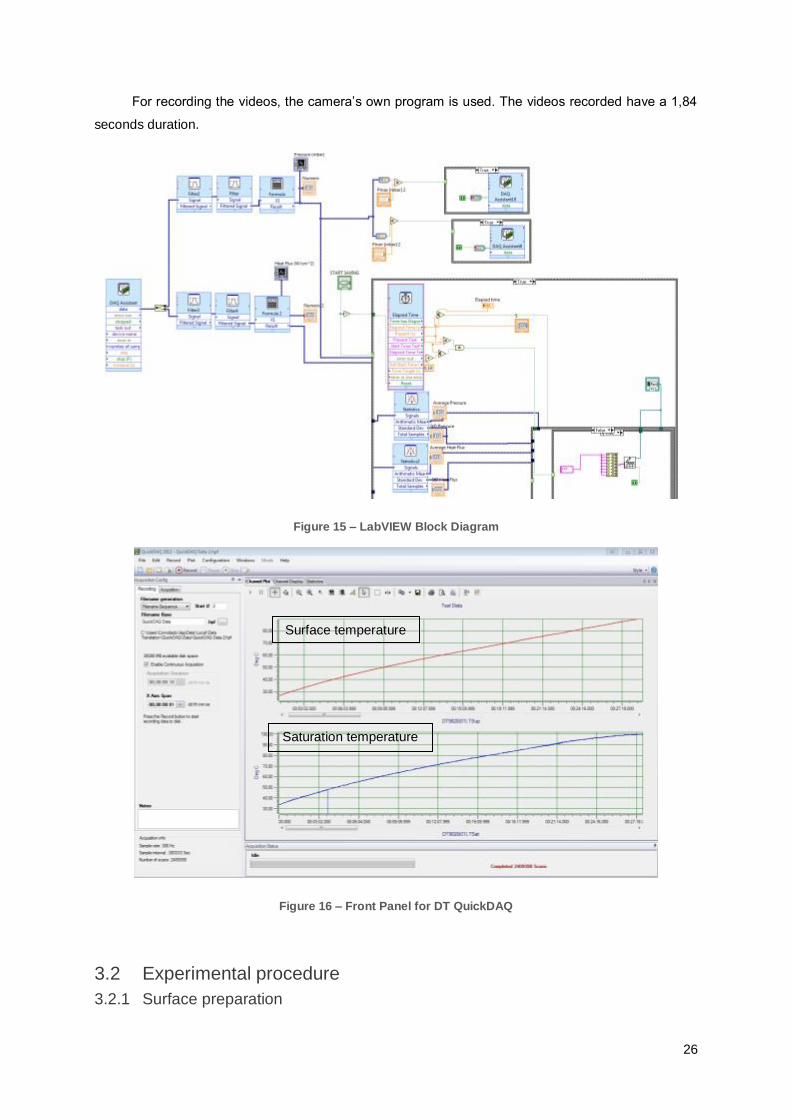
The temperature signals that go through the DT DAQ board are then shown in QuickDAQ
(Figure 16). Figure 16 shows a snapshot of the beginning of a test where the saturation temperature is
already the intended 100 °𝐶 and the surface temperature is still rising. About 2000 points are acquired
and averaged. Mean and standard deviation values for saturation and surface temperature are
recorded.
Thermocouples
LED
Surface and bubble
Heat flux sensor
Pressure Transducer
Degas station Electro valves Internal
resistance
PC
26
For recording the videos, the camera’s own program is used. The videos recorded have a 1,84
seconds duration.
Figure 15 – LabVIEW Block Diagram
Figure 16 – Front Panel for DT QuickDAQ
3.2 Experimental procedure
3.2.1 Surface preparation
Surface temperature
Saturation temperature
27
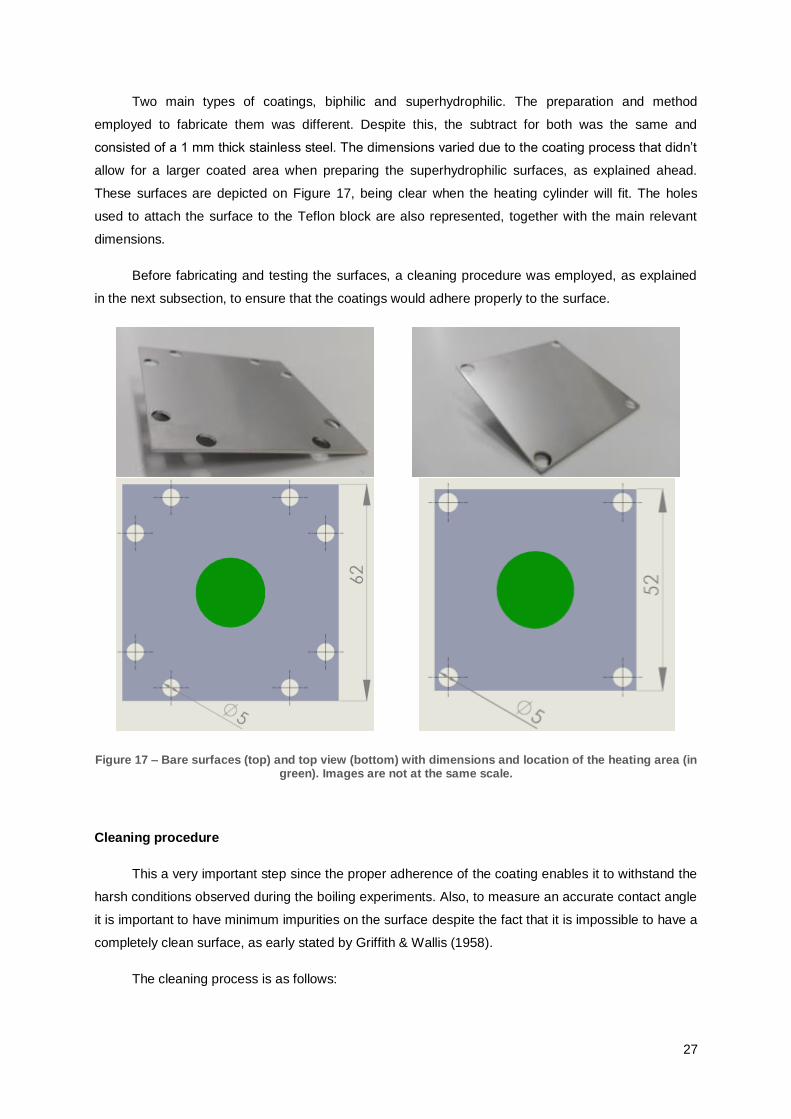
Two main types of coatings, biphilic and superhydrophilic. The preparation and method
employed to fabricate them was different. Despite this, the subtract for both was the same and
consisted of a 1 mm thick stainless steel. The dimensions varied due to the coating process that didn’t
allow for a larger coated area when preparing the superhydrophilic surfaces, as explained ahead.
These surfaces are depicted on Figure 17, being clear when the heating cylinder will fit. The holes
used to attach the surface to the Teflon block are also represented, together with the main relevant
dimensions.
Before fabricating and testing the surfaces, a cleaning procedure was employed, as explained
in the next subsection, to ensure that the coatings would adhere properly to the surface.
Figure 17 – Bare surfaces (top) and top view (bottom) with dimensions and location of the heating area (in green). Images are not at the same scale.
Cleaning procedure
This a very important step since the proper adherence of the coating enables it to withstand the
harsh conditions observed during the boiling experiments. Also, to measure an accurate contact angle
it is important to have minimum impurities on the surface despite the fact that it is impossible to have a
completely clean surface, as early stated by Griffith & Wallis (1958).
The cleaning process is as follows:
28
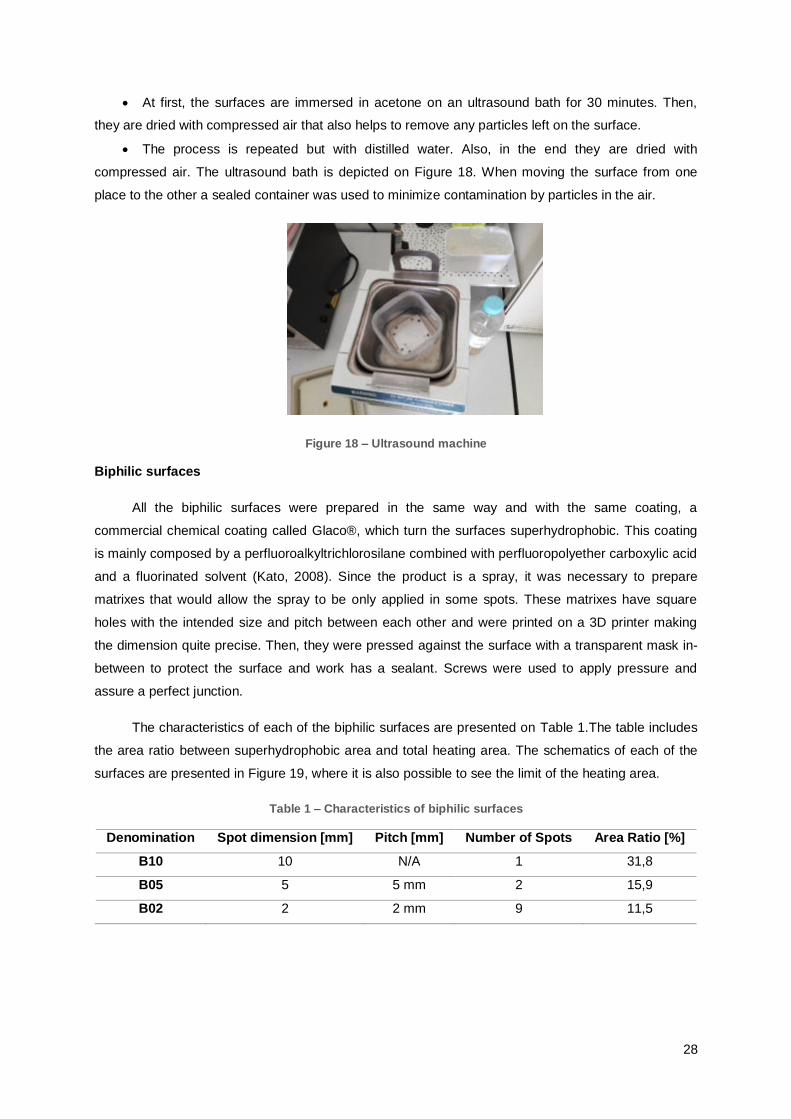
At first, the surfaces are immersed in acetone on an ultrasound bath for 30 minutes. Then,
they are dried with compressed air that also helps to remove any particles left on the surface.
The process is repeated but with distilled water. Also, in the end they are dried with
compressed air. The ultrasound bath is depicted on Figure 18. When moving the surface from one
place to the other a sealed container was used to minimize contamination by particles in the air.
Figure 18 – Ultrasound machine
Biphilic surfaces
All the biphilic surfaces were prepared in the same way and with the same coating, a
commercial chemical coating called Glaco®, which turn the surfaces superhydrophobic. This coating
is mainly composed by a perfluoroalkyltrichlorosilane combined with perfluoropolyether carboxylic acid
and a fluorinated solvent (Kato, 2008). Since the product is a spray, it was necessary to prepare
matrixes that would allow the spray to be only applied in some spots. These matrixes have square
holes with the intended size and pitch between each other and were printed on a 3D printer making
the dimension quite precise. Then, they were pressed against the surface with a transparent mask in-
between to protect the surface and work has a sealant. Screws were used to apply pressure and
assure a perfect junction.
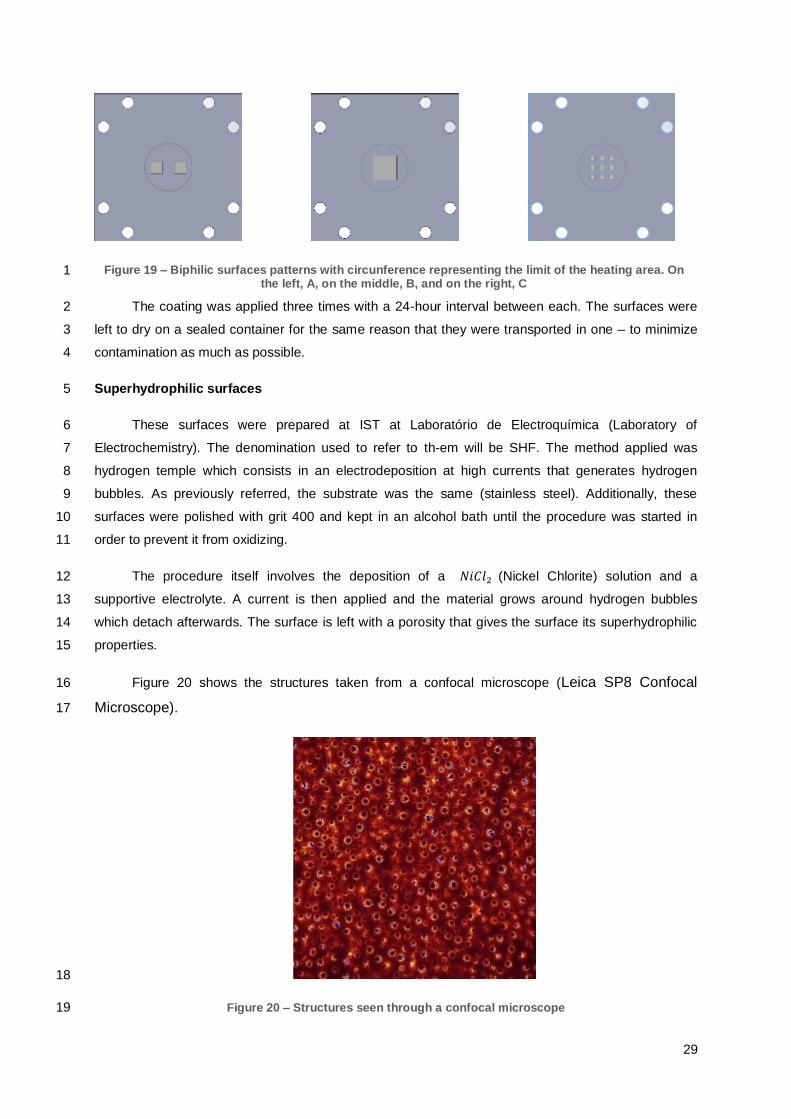
The characteristics of each of the biphilic surfaces are presented on Table 1.The table includes
the area ratio between superhydrophobic area and total heating area. The schematics of each of the
surfaces are presented in Figure 19, where it is also possible to see the limit of the heating area.
Table 1 – Characteristics of biphilic surfaces
Denomination Spot dimension [mm] Pitch [mm] Number of Spots Area Ratio [%]
B10 10 N/A 1 31,8
B05 5 5 mm 2 15,9
B02 2 2 mm 9 11,5
29
Figure 19 – Biphilic surfaces patterns with circunference representing the limit of the heating area. On the left, A, on the middle, B, and on the right, C
1
The coating was applied three times with a 24-hour interval between each. The surfaces were 2
left to dry on a sealed container for the same reason that they were transported in one – to minimize 3
contamination as much as possible. 4
Superhydrophilic surfaces 5
These surfaces were prepared at IST at Laboratório de Electroquímica (Laboratory of 6
Electrochemistry). The denomination used to refer to th-em will be SHF. The method applied was 7
hydrogen temple which consists in an electrodeposition at high currents that generates hydrogen 8
bubbles. As previously referred, the substrate was the same (stainless steel). Additionally, these 9
surfaces were polished with grit 400 and kept in an alcohol bath until the procedure was started in 10
order to prevent it from oxidizing. 11
The procedure itself involves the deposition of a 𝑁𝑖𝐶𝑙2 (Nickel Chlorite) solution and a 12
supportive electrolyte. A current is then applied and the material grows around hydrogen bubbles 13
which detach afterwards. The surface is left with a porosity that gives the surface its superhydrophilic 14
properties. 15
Figure 20 shows the structures taken from a confocal microscope (Leica SP8 Confocal 16
Microscope). 17
18
Figure 20 – Structures seen through a confocal microscope 19

30
3.2.2 Surface Characterization 1
Contact angles and surface topography were measured before and after the experiments. This 2
allows controlling the ageing of the surface conditions to be tracked ensuring that the boundary 3
conditions when comparing the results. 4
The surface roughness is quantified through mean roughness, Ra, and the average of the five 5
highest peaks and five lowest valleys, Rz. It has already been discussed in the state of the art that 6
some authors, (e.g. Jones et al., 2009), consider that these parameters don’t accurately characterize 7
the topography of the surface. Despite this, most of the studies reported in the literature use these 8
parameters. 9
Contact angle 10
Contact angles whereas measured with an optical tensiometer, at 20°𝐶. The optical tensiometer 11
(THETA from Attension) is shown in Figure 21 and is run using its own software, One Attension. The 12
measurement method comprises the deposition of a sessile drop with 5 𝜇𝑙 volume. The tensiometer 13
has a camera that captures a video at 12 fps and analyses the recorded images using post-processing 14
procedures. The droplet profile is adjusted to the Young-Laplace equation. Figure 21 depicts a 15
snapshot from the software’s droplet detection algorithm. It can be seen that the software measures 16
the left and right angles and also calculates their average. The static angles are evaluated as an 17
average of 5 measurements taken at different surface regions. To evaluate the hysteresis, one must 18
measure the quasi-static advancing and receding contact angles (as the hysteresis is the difference 19
between them). The advancing angle is measured as the droplet is slowly inflated being the first angle 20
taken as the droplet starts to spread and the contact line moves. The receding contact angle is 21
measured as the bubble is deflated (and therefore recedes on the surface) and the recorded value is 22
the one from the first frame where a motion of the contact line is seen. 23
For the biphilic surfaces, both hydrophilic and superhydrophobic areas are fully characterized. 24
25
Figure 21 – THETA tensiometer on the left and snapshot of software analysis on the right 26
27
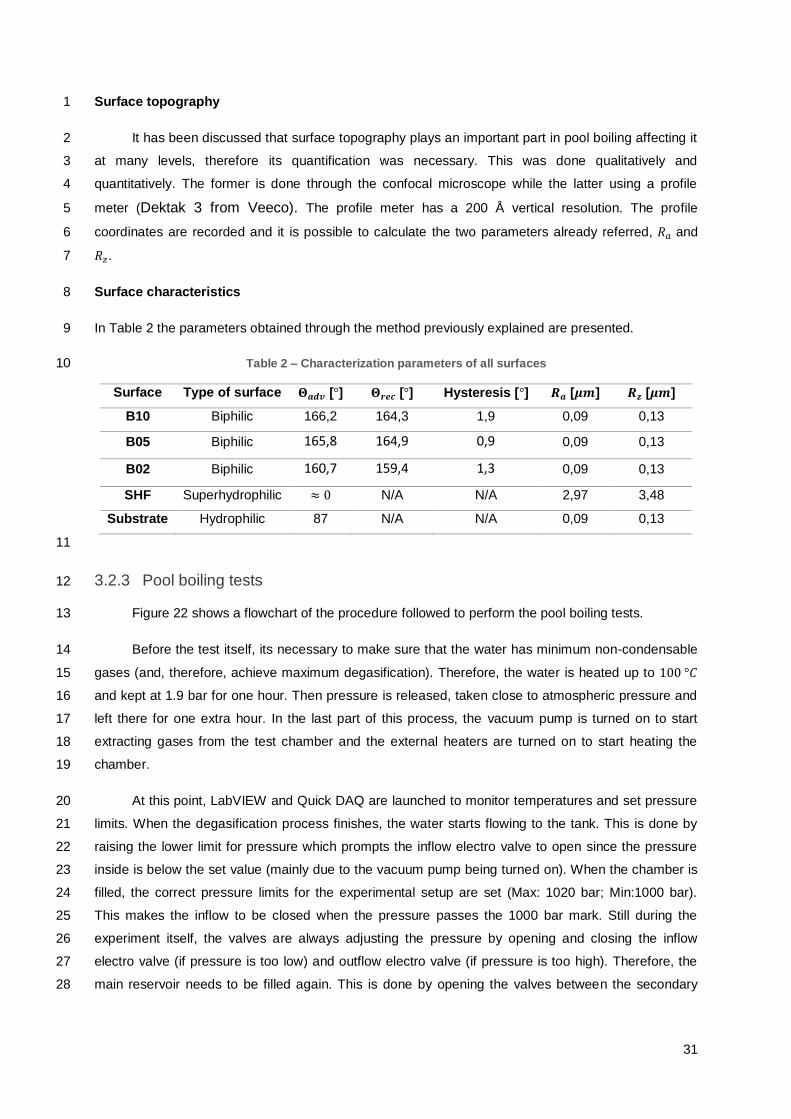
31
Surface topography 1
It has been discussed that surface topography plays an important part in pool boiling affecting it 2
at many levels, therefore its quantification was necessary. This was done qualitatively and 3
quantitatively. The former is done through the confocal microscope while the latter using a profile 4
meter (Dektak 3 from Veeco). The profile meter has a 200 Å vertical resolution. The profile 5
coordinates are recorded and it is possible to calculate the two parameters already referred, 𝑅𝑎 and 6
𝑅𝑧. 7
Surface characteristics 8
In Table 2 the parameters obtained through the method previously explained are presented. 9
Table 2 – Characterization parameters of all surfaces 10
Surface Type of surface 𝚯𝒂𝒅𝒗 [°] 𝚯𝒓𝒆𝒄 [°] Hysteresis [°] 𝑹𝒂 [𝝁𝒎] 𝑹𝒛 [𝝁𝒎]
B10 Biphilic 166,2 164,3 1,9 0,09 0,13
B05 Biphilic 165,8 164,9 0,9 0,09 0,13
B02 Biphilic 160,7 159,4 1,3 0,09 0,13
SHF Superhydrophilic ≈ 0 N/A N/A 2,97 3,48
Substrate Hydrophilic 87 N/A N/A 0,09 0,13
11
3.2.3 Pool boiling tests 12
Figure 22 shows a flowchart of the procedure followed to perform the pool boiling tests. 13
Before the test itself, its necessary to make sure that the water has minimum non-condensable 14
gases (and, therefore, achieve maximum degasification). Therefore, the water is heated up to 100 °𝐶 15
and kept at 1.9 bar for one hour. Then pressure is released, taken close to atmospheric pressure and 16
left there for one extra hour. In the last part of this process, the vacuum pump is turned on to start 17
extracting gases from the test chamber and the external heaters are turned on to start heating the 18
chamber. 19
At this point, LabVIEW and Quick DAQ are launched to monitor temperatures and set pressure 20
limits. When the degasification process finishes, the water starts flowing to the tank. This is done by 21
raising the lower limit for pressure which prompts the inflow electro valve to open since the pressure 22
inside is below the set value (mainly due to the vacuum pump being turned on). When the chamber is 23
filled, the correct pressure limits for the experimental setup are set (Max: 1020 bar; Min:1000 bar). 24
This makes the inflow to be closed when the pressure passes the 1000 bar mark. Still during the 25
experiment itself, the valves are always adjusting the pressure by opening and closing the inflow 26
electro valve (if pressure is too low) and outflow electro valve (if pressure is too high). Therefore, the 27
main reservoir needs to be filled again. This is done by opening the valves between the secondary 28
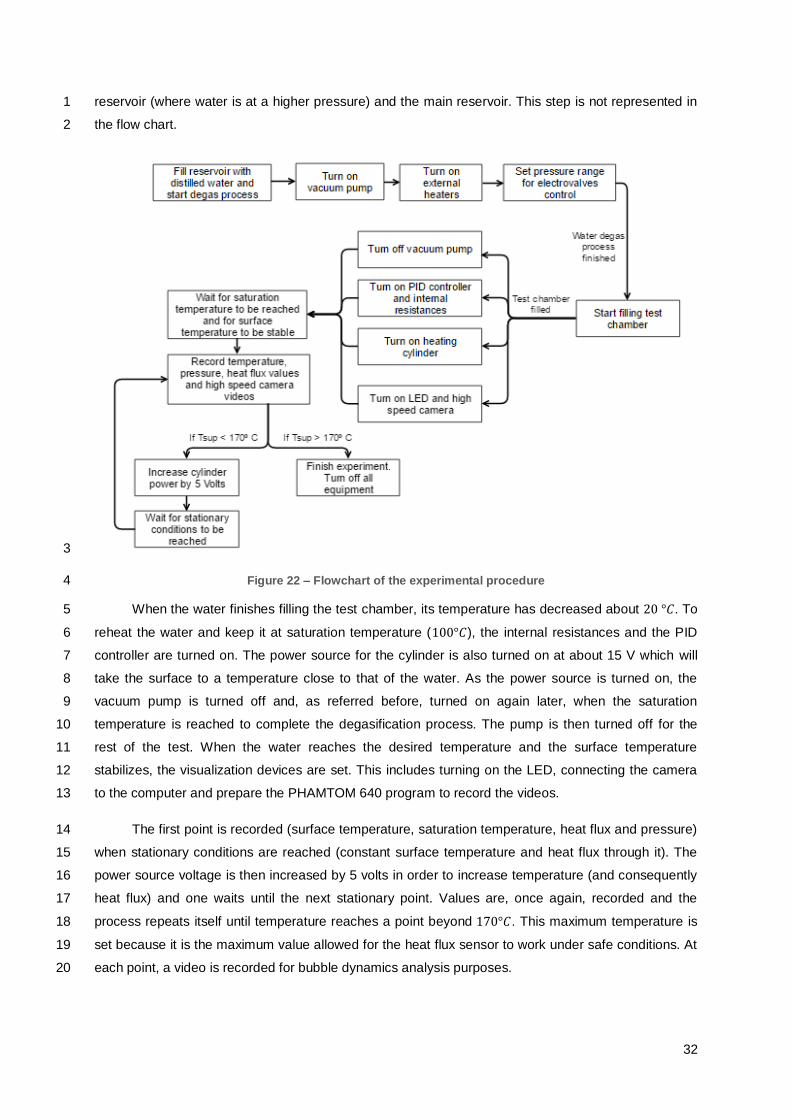
32
reservoir (where water is at a higher pressure) and the main reservoir. This step is not represented in 1
the flow chart. 2
3
Figure 22 – Flowchart of the experimental procedure 4
When the water finishes filling the test chamber, its temperature has decreased about 20 °𝐶. To 5
reheat the water and keep it at saturation temperature (100°𝐶), the internal resistances and the PID 6
controller are turned on. The power source for the cylinder is also turned on at about 15 V which will 7
take the surface to a temperature close to that of the water. As the power source is turned on, the 8
vacuum pump is turned off and, as referred before, turned on again later, when the saturation 9
temperature is reached to complete the degasification process. The pump is then turned off for the 10
rest of the test. When the water reaches the desired temperature and the surface temperature 11
stabilizes, the visualization devices are set. This includes turning on the LED, connecting the camera 12
to the computer and prepare the PHAMTOM 640 program to record the videos. 13
The first point is recorded (surface temperature, saturation temperature, heat flux and pressure) 14
when stationary conditions are reached (constant surface temperature and heat flux through it). The 15
power source voltage is then increased by 5 volts in order to increase temperature (and consequently 16
heat flux) and one waits until the next stationary point. Values are, once again, recorded and the 17
process repeats itself until temperature reaches a point beyond 170°𝐶. This maximum temperature is 18
set because it is the maximum value allowed for the heat flux sensor to work under safe conditions. At 19
each point, a video is recorded for bubble dynamics analysis purposes. 20
33
3.2 Experimental data analysis and uncertainties 1
3.2.1 Bubble dynamics analysis routine 2
As already stated, a Matlab routine was used to process the high speed videos and determine 3
three bubble dynamics parameters: bubble diameter, bubble contact angle and contact line velocity. 4
This routine was developed in a previous work and an its extensive description can be found in 5
Valente (2015), so that a shot description of the routine is provided here. 6
First step is to convert the high speed video into bitmap images with 8 bit per pixel. The images 7
are then uploaded to the routine and converted to a matrix of grey scale intensities. The 8bit format 8
allows for 256 different intensities which means that this matrix will have values from 0 (white) to 256 9
(black). A background image is taken for each experiment before boiling starts which is subtracted to 10
the image to be analysed by the routine. A threshold value is then specified according to the bubble’s 11
intensity. The matrix entries will then be zero if its intensity is below the threshold value (not part of the 12
bubble) or one if the intensity is above the threshold (meaning that they belong to the bubble). 13
After the bubble boundary is traced, the routine will first look for the first non-zero value in the 14
last row (bubble base plain) and from there will trace the boundary in a specified direction (in this case 15
up or North). The function used, bwtraceboundary, basically looks for the highest gradients which will 16
be between entries with zeros and ones. 17
The total area of the bubble is calculated as the equivalent diameter of a circle: 18
𝐃 = 𝟐×√𝐀
𝛑 ( 12 ) 19
Contact angle is calculated with the fitting of a polynomial to the first 5 points of the boundary. 20
The contact line velocity will be the horizontal displacement of the first point that was identified on the 21
boundary divided by the time interval between each frame. 22
Finally, the pixels must be converted to mm and frames to seconds. The first is done by 23
recording a video of a millimetre paper and measuring with a pixel ruler on the pc, the relation 24
pixels/mm. This yields a conversion factor of 31,4 pixels/mm. Frames to seconds is done based on the 25
frame rate at which the videos were recorded. 26
27
3.2.2. Experimental uncertainties 28
For the boiling curves the uncertainties are associated with the temperature measurements and 29
the heat flux measurement. Error is estimated through Equation 13 (Abernethy et al. 1985). 30
𝑬 = √𝑼𝟐 + (𝟐𝝈)𝟐 ( 13 ) 31
Where U is the uncertainty of the thermocouple or heat flux sensor. The latter is dependent on 32
the heat flux at which it is operating. Since there are two thermocouples, surface and saturation 33
temperatures, Equation 14 is used to compute the total error: 34
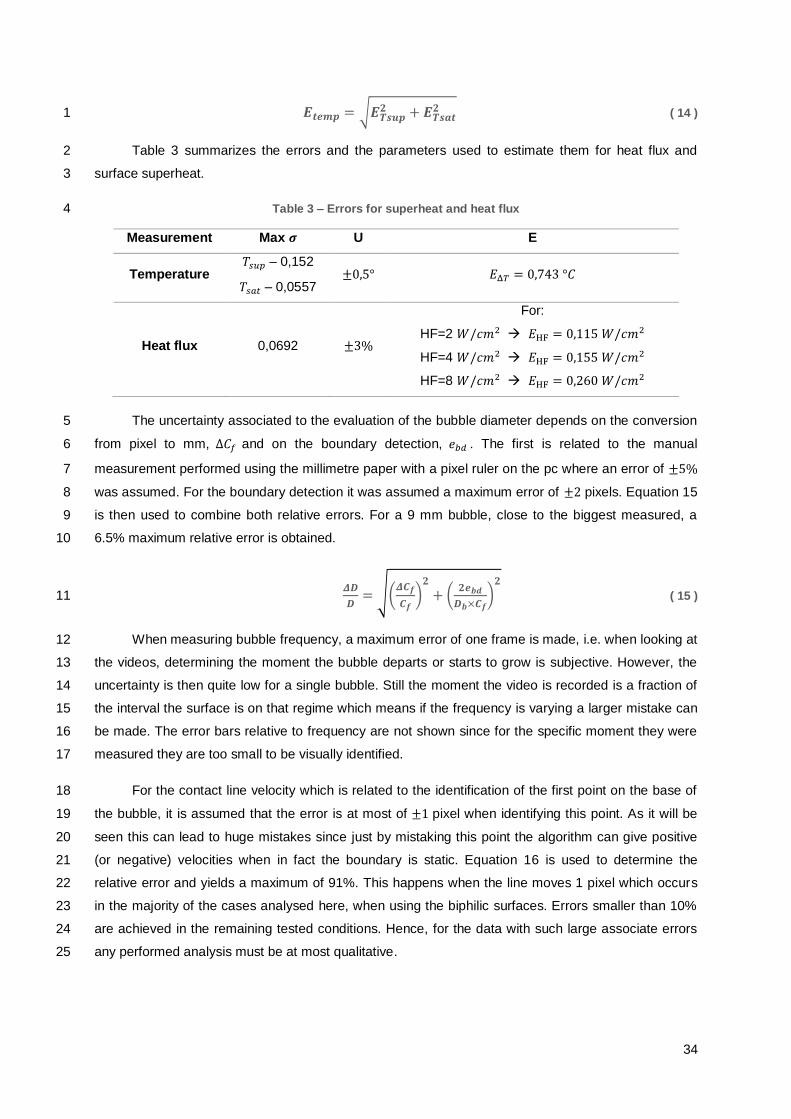
34
𝑬𝒕𝒆𝒎𝒑 = √𝑬𝑻𝒔𝒖𝒑𝟐 + 𝑬𝑻𝒔𝒂𝒕
𝟐 ( 14 ) 1
Table 3 summarizes the errors and the parameters used to estimate them for heat flux and 2
surface superheat. 3
Table 3 – Errors for superheat and heat flux 4
Measurement Max 𝝈 U E
Temperature 𝑇𝑠𝑢𝑝 – 0,152
𝑇𝑠𝑎𝑡 – 0,0557 ±0,5° 𝐸Δ𝑇 = 0,743 °𝐶
Heat flux 0,0692 ±3%
For:
HF=2 𝑊/𝑐𝑚2 𝐸HF = 0,115 𝑊/𝑐𝑚2
HF=4 𝑊/𝑐𝑚2 𝐸HF = 0,155 𝑊/𝑐𝑚2
HF=8 𝑊/𝑐𝑚2 𝐸HF = 0,260 𝑊/𝑐𝑚2
The uncertainty associated to the evaluation of the bubble diameter depends on the conversion 5
from pixel to mm, Δ𝐶𝑓 and on the boundary detection, 𝑒𝑏𝑑 . The first is related to the manual 6
measurement performed using the millimetre paper with a pixel ruler on the pc where an error of ±5% 7
was assumed. For the boundary detection it was assumed a maximum error of ±2 pixels. Equation 15 8
is then used to combine both relative errors. For a 9 mm bubble, close to the biggest measured, a 9
6.5% maximum relative error is obtained. 10
𝜟𝑫
𝑫= √(
𝜟𝑪𝒇
𝑪𝒇)
𝟐
+ (𝟐𝒆𝒃𝒅
𝑫𝒃×𝑪𝒇)
𝟐
( 15 ) 11
When measuring bubble frequency, a maximum error of one frame is made, i.e. when looking at 12
the videos, determining the moment the bubble departs or starts to grow is subjective. However, the 13
uncertainty is then quite low for a single bubble. Still the moment the video is recorded is a fraction of 14
the interval the surface is on that regime which means if the frequency is varying a larger mistake can 15
be made. The error bars relative to frequency are not shown since for the specific moment they were 16
measured they are too small to be visually identified. 17
For the contact line velocity which is related to the identification of the first point on the base of 18
the bubble, it is assumed that the error is at most of ±1 pixel when identifying this point. As it will be 19
seen this can lead to huge mistakes since just by mistaking this point the algorithm can give positive 20
(or negative) velocities when in fact the boundary is static. Equation 16 is used to determine the 21
relative error and yields a maximum of 91%. This happens when the line moves 1 pixel which occurs 22
in the majority of the cases analysed here, when using the biphilic surfaces. Errors smaller than 10% 23
are achieved in the remaining tested conditions. Hence, for the data with such large associate errors 24
any performed analysis must be at most qualitative. 25
35
𝜟𝒗𝒄𝒍
𝒗𝒄𝒍=
√(𝜟𝑪𝒇
𝑪𝒇)
𝟐
+(𝟐 𝒑𝒊𝒙𝒆𝒍𝒔
𝜟𝒙×𝑪𝒇)
𝟐
𝜟𝒕 ( 16 ) 1
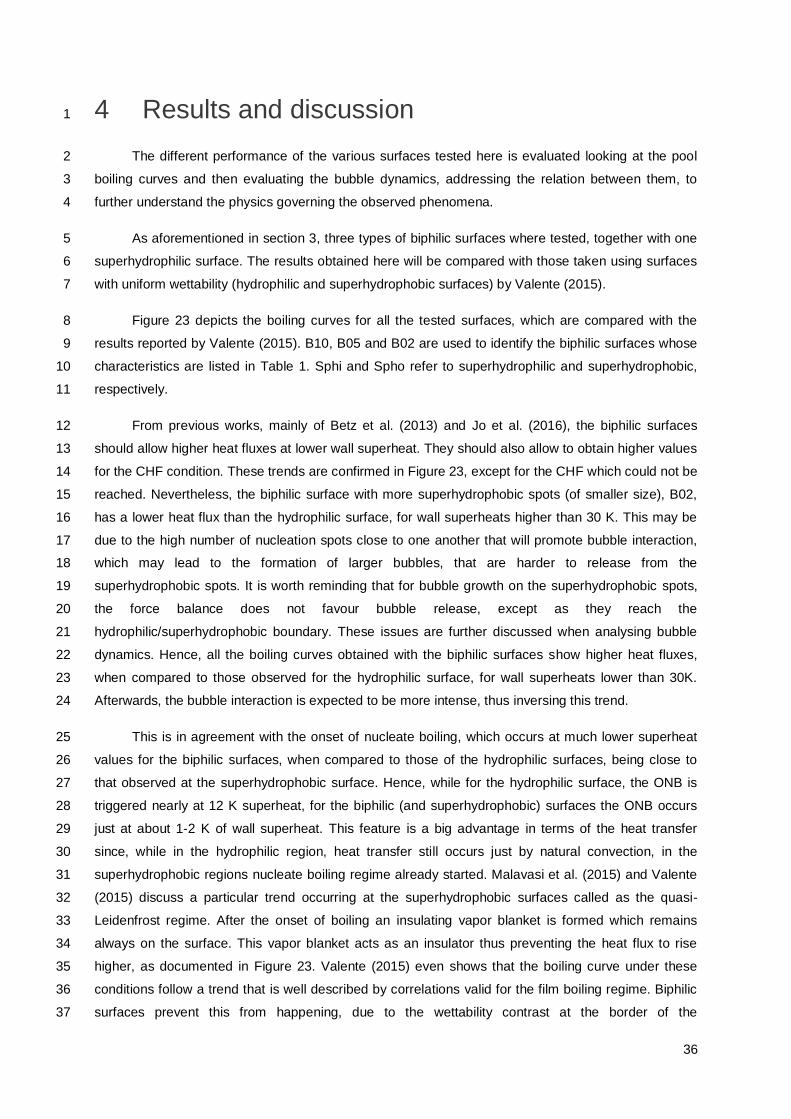
36
4 Results and discussion 1
The different performance of the various surfaces tested here is evaluated looking at the pool 2
boiling curves and then evaluating the bubble dynamics, addressing the relation between them, to 3
further understand the physics governing the observed phenomena. 4
As aforementioned in section 3, three types of biphilic surfaces where tested, together with one 5
superhydrophilic surface. The results obtained here will be compared with those taken using surfaces 6
with uniform wettability (hydrophilic and superhydrophobic surfaces) by Valente (2015). 7
Figure 23 depicts the boiling curves for all the tested surfaces, which are compared with the 8
results reported by Valente (2015). B10, B05 and B02 are used to identify the biphilic surfaces whose 9
characteristics are listed in Table 1. Sphi and Spho refer to superhydrophilic and superhydrophobic, 10
respectively. 11
From previous works, mainly of Betz et al. (2013) and Jo et al. (2016), the biphilic surfaces 12
should allow higher heat fluxes at lower wall superheat. They should also allow to obtain higher values 13
for the CHF condition. These trends are confirmed in Figure 23, except for the CHF which could not be 14
reached. Nevertheless, the biphilic surface with more superhydrophobic spots (of smaller size), B02, 15
has a lower heat flux than the hydrophilic surface, for wall superheats higher than 30 K. This may be 16
due to the high number of nucleation spots close to one another that will promote bubble interaction, 17
which may lead to the formation of larger bubbles, that are harder to release from the 18
superhydrophobic spots. It is worth reminding that for bubble growth on the superhydrophobic spots, 19
the force balance does not favour bubble release, except as they reach the 20
hydrophilic/superhydrophobic boundary. These issues are further discussed when analysing bubble 21
dynamics. Hence, all the boiling curves obtained with the biphilic surfaces show higher heat fluxes, 22
when compared to those observed for the hydrophilic surface, for wall superheats lower than 30K. 23
Afterwards, the bubble interaction is expected to be more intense, thus inversing this trend. 24
This is in agreement with the onset of nucleate boiling, which occurs at much lower superheat 25
values for the biphilic surfaces, when compared to those of the hydrophilic surfaces, being close to 26
that observed at the superhydrophobic surface. Hence, while for the hydrophilic surface, the ONB is 27
triggered nearly at 12 K superheat, for the biphilic (and superhydrophobic) surfaces the ONB occurs 28
just at about 1-2 K of wall superheat. This feature is a big advantage in terms of the heat transfer 29
since, while in the hydrophilic region, heat transfer still occurs just by natural convection, in the 30
superhydrophobic regions nucleate boiling regime already started. Malavasi et al. (2015) and Valente 31
(2015) discuss a particular trend occurring at the superhydrophobic surfaces called as the quasi-32
Leidenfrost regime. After the onset of boiling an insulating vapor blanket is formed which remains 33
always on the surface. This vapor blanket acts as an insulator thus preventing the heat flux to rise 34
higher, as documented in Figure 23. Valente (2015) even shows that the boiling curve under these 35
conditions follow a trend that is well described by correlations valid for the film boiling regime. Biphilic 36
surfaces prevent this from happening, due to the wettability contrast at the border of the 37
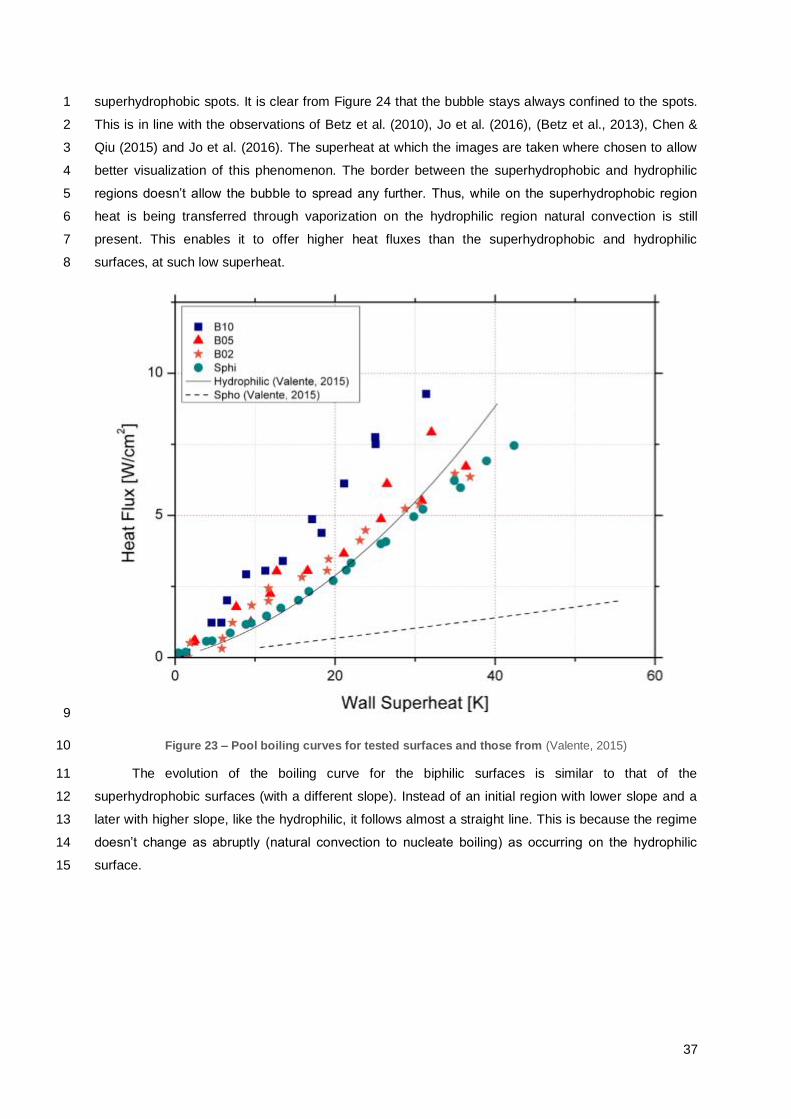
37
superhydrophobic spots. It is clear from Figure 24 that the bubble stays always confined to the spots. 1
This is in line with the observations of Betz et al. (2010), Jo et al. (2016), (Betz et al., 2013), Chen & 2
Qiu (2015) and Jo et al. (2016). The superheat at which the images are taken where chosen to allow 3
better visualization of this phenomenon. The border between the superhydrophobic and hydrophilic 4
regions doesn’t allow the bubble to spread any further. Thus, while on the superhydrophobic region 5
heat is being transferred through vaporization on the hydrophilic region natural convection is still 6
present. This enables it to offer higher heat fluxes than the superhydrophobic and hydrophilic 7
surfaces, at such low superheat. 8
9
Figure 23 – Pool boiling curves for tested surfaces and those from (Valente, 2015) 10
The evolution of the boiling curve for the biphilic surfaces is similar to that of the 11
superhydrophobic surfaces (with a different slope). Instead of an initial region with lower slope and a 12
later with higher slope, like the hydrophilic, it follows almost a straight line. This is because the regime 13
doesn’t change as abruptly (natural convection to nucleate boiling) as occurring on the hydrophilic 14
surface. 15

38
1
2
Figure 24 – Bubble confined to superhydrophobic spots. Clockwise starting on top left: B10 at 1 K 3 superheat, B05 at 2 K superheat and B02 at 6 K superheat. 4
Increasing wall superheat, bubbles start to nucleate in two other areas. So, the first bubbles 5
appear at the superhydrophobic spots, but afterwards, bubbles star to form also at the interface 6
between the two regions with different wettability. Further increasing the wall superheat finally 7
promotes the nucleation to start within the hydrophilic area. 8
The bubbles at interface normally appeared on the second or third point at about 5 K superheat 9
for the B10 and 7 K for the B05 and B02. Most of these bubbles grow until their interface is close 10
enough to the bubble generated at the superhydrophobic spot, to merge with it. This allows for the 11
bubbles to grow faster, favouring an increase of the bubble release frequency, as it will be shown in 12
Figure 28. On the case of the B02 and B05, this event promotes the release of the bubble formed on 13
the superhydrophobic spot, since its diameter is closer to that of the bubbles on the interface. When 14
they merge the impulsion forces on the bubble formed on the superhydrophobic spot immediately 15
increase, surpassing the surface tension forces. On the other hand, on the B10 surface the bubble 16
generated on the superhydrophobic region is not released, since the bubbles that merge with this 17
larger bubble are not large enough to increase dramatically the impulsion forces. The bubble would 18
then grow faster than in the first points but the difference was not as big as for the B05 and B02. 19
These phenomena are illustrated in Figure 25 for the B10 and B05 surfaces. The B02 is not 20
shown on this case since the visualization on this surface did not render such clear images. Figure 25 21
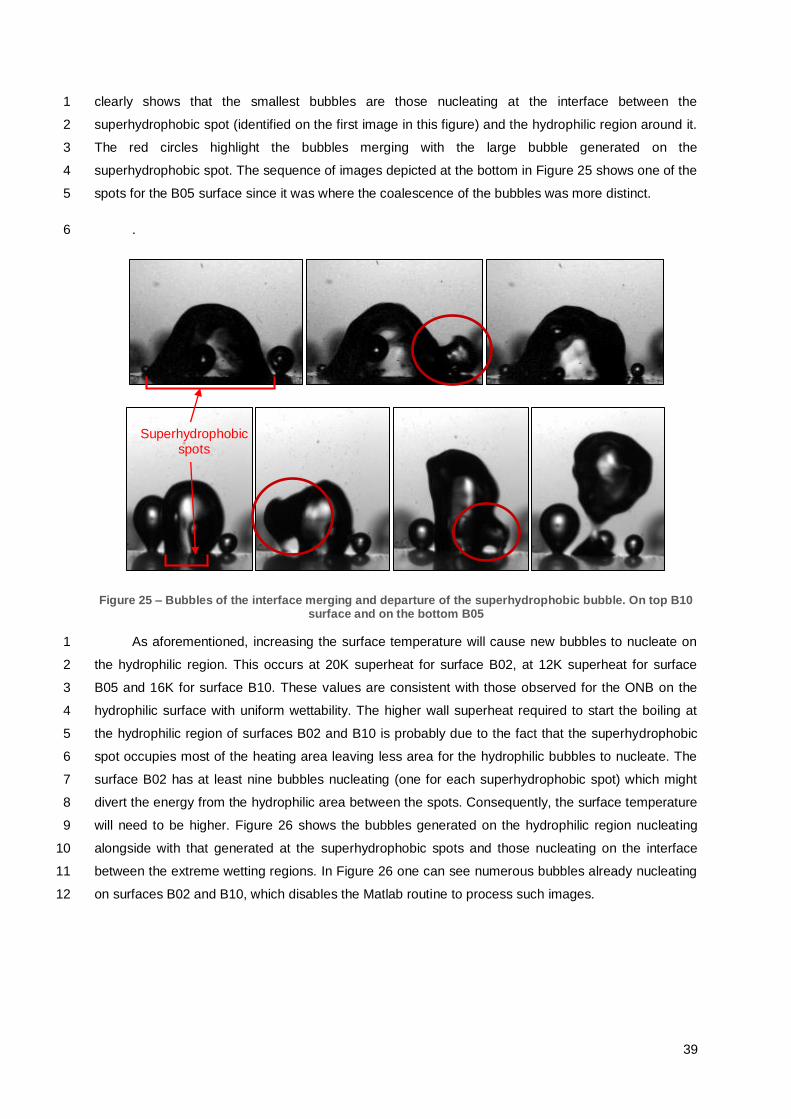
39
clearly shows that the smallest bubbles are those nucleating at the interface between the 1
superhydrophobic spot (identified on the first image in this figure) and the hydrophilic region around it. 2
The red circles highlight the bubbles merging with the large bubble generated on the 3
superhydrophobic spot. The sequence of images depicted at the bottom in Figure 25 shows one of the 4
spots for the B05 surface since it was where the coalescence of the bubbles was more distinct. 5
.6
Figure 25 – Bubbles of the interface merging and departure of the superhydrophobic bubble. On top B10 surface and on the bottom B05
As aforementioned, increasing the surface temperature will cause new bubbles to nucleate on 1
the hydrophilic region. This occurs at 20K superheat for surface B02, at 12K superheat for surface 2
B05 and 16K for surface B10. These values are consistent with those observed for the ONB on the 3
hydrophilic surface with uniform wettability. The higher wall superheat required to start the boiling at 4
the hydrophilic region of surfaces B02 and B10 is probably due to the fact that the superhydrophobic 5
spot occupies most of the heating area leaving less area for the hydrophilic bubbles to nucleate. The 6
surface B02 has at least nine bubbles nucleating (one for each superhydrophobic spot) which might 7
divert the energy from the hydrophilic area between the spots. Consequently, the surface temperature 8
will need to be higher. Figure 26 shows the bubbles generated on the hydrophilic region nucleating 9
alongside with that generated at the superhydrophobic spots and those nucleating on the interface 10
between the extreme wetting regions. In Figure 26 one can see numerous bubbles already nucleating 11
on surfaces B02 and B10, which disables the Matlab routine to process such images. 12
Superhydrophobic spots

Figure 26 – Hydrophilic and superhydrophobic bubbles at high wall superheat. Clockwise starting on top left: B10 at 16 K superheat, B05 at 12 K superheat and B02 at 16 K superheat.
A consequence of the bubbles being confined on the superhydrophobic spots is that it is 1
possible to control its departure diameter. It can be seen from Figure 27 that depending on the size of 2
the spots the bubble departure diameter assumes a steady value. The larger the spots the larger the 3
departing diameter of the bubble. This plot only shows the departure diameter of the bubbles 4
generated on the superhydrophobic spot. 5
For the 5 mm spots (B05) and the 2 mm spots (B02) there is no clear change in the diameter 6
with increasing heat flux. The 10 mm spot (B10) starts with a lower departure diameter that steadily 7
rises until a constant value is observed at higher heat flux. It was observed, for this surface, that in the 8
first points (corresponding to lower heat flux values) the bubble doesn’t yet occupy the whole spot. 9
Only from the third point onward the base of the bubble coalesces with smaller bubbles that were 10
nucleating right next to the contact line and reaches its full dimension. From this point it can be seen 11
from Figure 27 that the departure diameter assumes a steady value. The average diameters for each 12
of the surfaces are presented at Table 4. 13
Table 4 – Superhydrophobic bubbles departure diameter 14
Denomination Bubble departure diameter [mm]
B02 3.701
B05 4.510
B10 (last four points) 9.264
Hydrophilic
bubbles
41
1
Figure 27 – Departure diameter as a function of Heat flux. For the biphilic surfaces it is for the 2 superhydrophobic bubbles. 3
As explained in section 2, besides the departure bubble diameter, departure frequency is also 4
an important parameter to describe bubble dynamics. This was estimated based on the post 5
processing of the images of the surfaces B10 and B05. For the surface B02 the number of spots is too 6
big to accurately determine this parameter, i.e. there are too many bubbles both from the 7
superhydrophobic spots and from the hydrophilic area. Also the diameter of the bubbles nucleating on 8
the superhydrophobic spots was already similar to that of the bubbles generated at the hydrophilic 9
region, being difficult to distinguish. 10
Figure 28 depicts the bubble departure frequency for the surfaces B05, B10, for the hydrophilic 11
and finally for the superhydrophobic surfaces tested by (Valente, 2015). For the biphilic surfaces only 12
the frequency of the bubbles generated on the superhydrophobic spots is depicted. The frequency for 13
the bubbles generated on the superhydrophobic spot of surface B10 follows a steady increase. As 14
discussed before this is due not only to the increase in surface temperature (which increases the 15
vaporization rate) but also to the merging of the smaller bubbles created at the 16
hydrophilic/superhydrophobic interfacial region on the interface with the large bubbles generated on 17
the superhydrophobic spots. This “feeding mechanism” allows the bubble on the superhydrophobic 18
spot to grow faster. 19
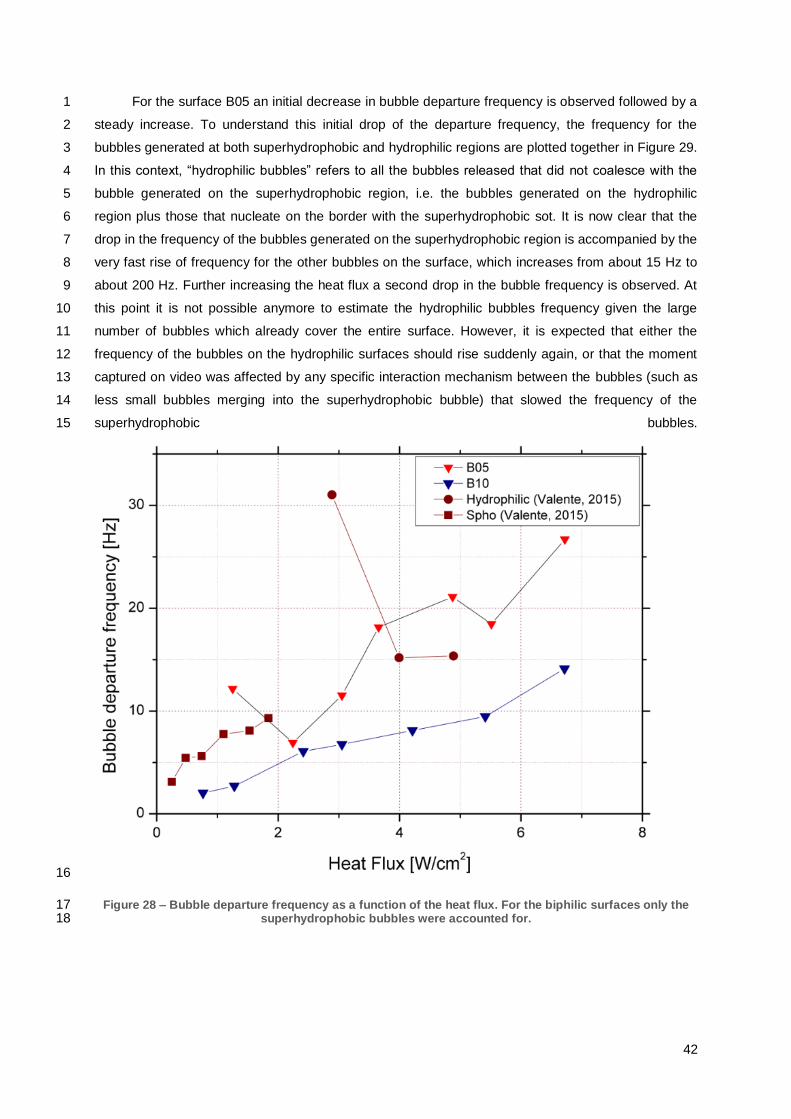
42
For the surface B05 an initial decrease in bubble departure frequency is observed followed by a 1
steady increase. To understand this initial drop of the departure frequency, the frequency for the 2
bubbles generated at both superhydrophobic and hydrophilic regions are plotted together in Figure 29. 3
In this context, “hydrophilic bubbles” refers to all the bubbles released that did not coalesce with the 4
bubble generated on the superhydrophobic region, i.e. the bubbles generated on the hydrophilic 5
region plus those that nucleate on the border with the superhydrophobic sot. It is now clear that the 6
drop in the frequency of the bubbles generated on the superhydrophobic region is accompanied by the 7
very fast rise of frequency for the other bubbles on the surface, which increases from about 15 Hz to 8
about 200 Hz. Further increasing the heat flux a second drop in the bubble frequency is observed. At 9
this point it is not possible anymore to estimate the hydrophilic bubbles frequency given the large 10
number of bubbles which already cover the entire surface. However, it is expected that either the 11
frequency of the bubbles on the hydrophilic surfaces should rise suddenly again, or that the moment 12
captured on video was affected by any specific interaction mechanism between the bubbles (such as 13
less small bubbles merging into the superhydrophobic bubble) that slowed the frequency of the 14
superhydrophobic bubbles.15
16
Figure 28 – Bubble departure frequency as a function of the heat flux. For the biphilic surfaces only the 17 superhydrophobic bubbles were accounted for. 18
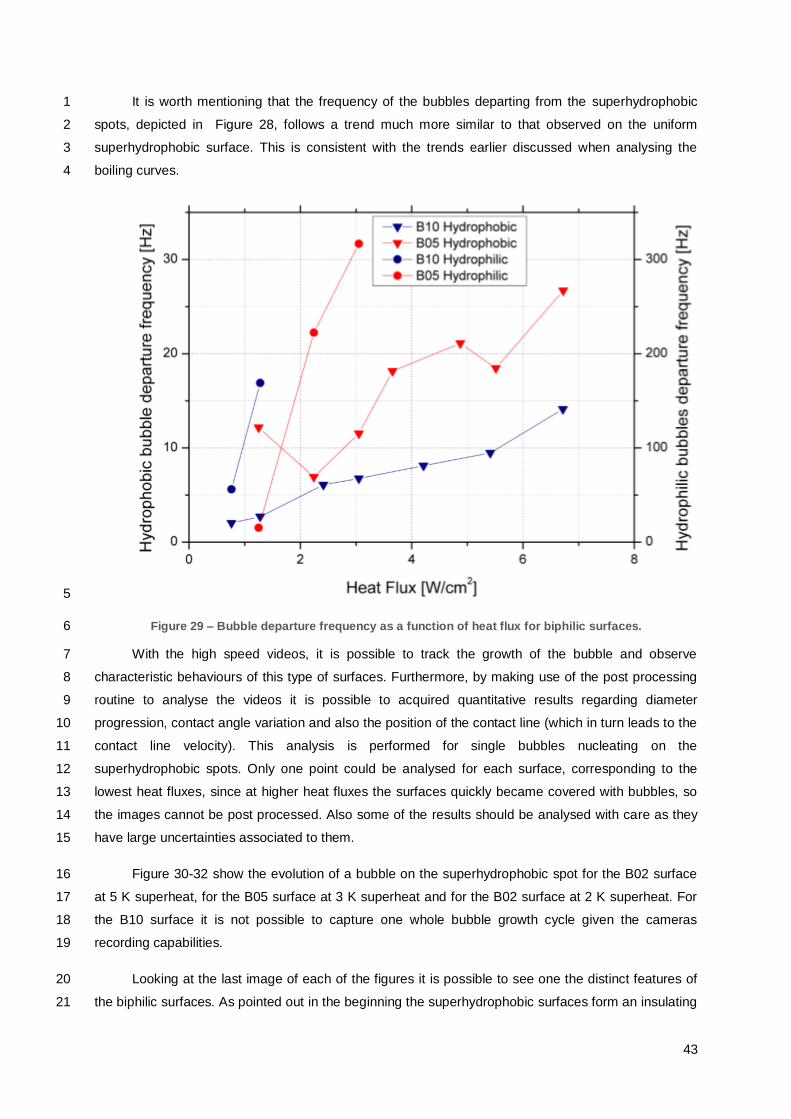
43
It is worth mentioning that the frequency of the bubbles departing from the superhydrophobic 1
spots, depicted in Figure 28, follows a trend much more similar to that observed on the uniform 2
superhydrophobic surface. This is consistent with the trends earlier discussed when analysing the 3
boiling curves. 4
5
Figure 29 – Bubble departure frequency as a function of heat flux for biphilic surfaces. 6
With the high speed videos, it is possible to track the growth of the bubble and observe 7
characteristic behaviours of this type of surfaces. Furthermore, by making use of the post processing 8
routine to analyse the videos it is possible to acquired quantitative results regarding diameter 9
progression, contact angle variation and also the position of the contact line (which in turn leads to the 10
contact line velocity). This analysis is performed for single bubbles nucleating on the 11
superhydrophobic spots. Only one point could be analysed for each surface, corresponding to the 12
lowest heat fluxes, since at higher heat fluxes the surfaces quickly became covered with bubbles, so 13
the images cannot be post processed. Also some of the results should be analysed with care as they 14
have large uncertainties associated to them. 15
Figure 30-32 show the evolution of a bubble on the superhydrophobic spot for the B02 surface 16
at 5 K superheat, for the B05 surface at 3 K superheat and for the B02 surface at 2 K superheat. For 17
the B10 surface it is not possible to capture one whole bubble growth cycle given the cameras 18
recording capabilities. 19
Looking at the last image of each of the figures it is possible to see one the distinct features of 20
the biphilic surfaces. As pointed out in the beginning the superhydrophobic surfaces form an insulating 21
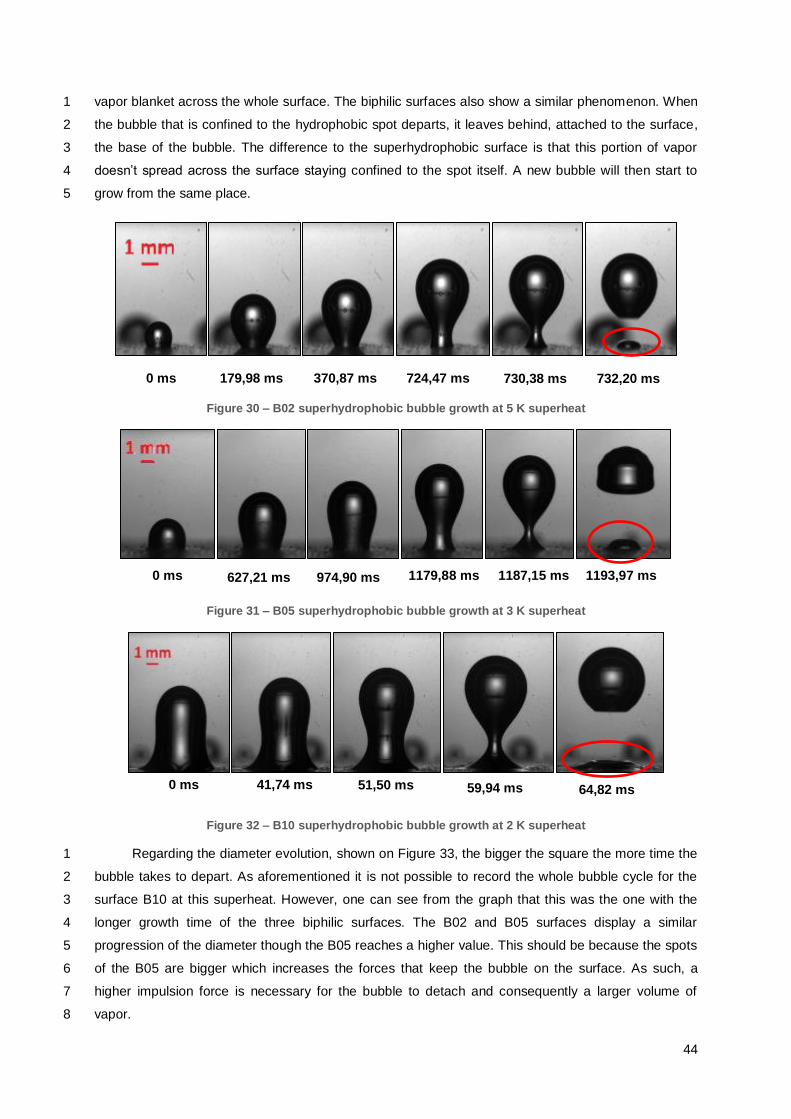
44
vapor blanket across the whole surface. The biphilic surfaces also show a similar phenomenon. When 1
the bubble that is confined to the hydrophobic spot departs, it leaves behind, attached to the surface, 2
the base of the bubble. The difference to the superhydrophobic surface is that this portion of vapor 3
doesn’t spread across the surface staying confined to the spot itself. A new bubble will then start to 4
grow from the same place. 5
Figure 30 – B02 superhydrophobic bubble growth at 5 K superheat
Figure 31 – B05 superhydrophobic bubble growth at 3 K superheat
Figure 32 – B10 superhydrophobic bubble growth at 2 K superheat
Regarding the diameter evolution, shown on Figure 33, the bigger the square the more time the 1
bubble takes to depart. As aforementioned it is not possible to record the whole bubble cycle for the 2
surface B10 at this superheat. However, one can see from the graph that this was the one with the 3
longer growth time of the three biphilic surfaces. The B02 and B05 surfaces display a similar 4
progression of the diameter though the B05 reaches a higher value. This should be because the spots 5
of the B05 are bigger which increases the forces that keep the bubble on the surface. As such, a 6
higher impulsion force is necessary for the bubble to detach and consequently a larger volume of 7
vapor. 8
0 ms 179,98 ms 724,47 ms 730,38 ms 732,20 ms 370,87 ms
0 ms 1179,88 ms 1187,15 ms 1193,97 ms 627,21 ms 974,90 ms
0 ms 51,50 ms 41,74 ms 59,94 ms 64,82 ms

45
The diameter of the base of the bubble was constant for all the surfaces because of the already 1
discussed confinement of the superhydrophobic bubbles. For the B10 the average base diameter was 2
7 mm, for the B05 2,5 mm and for the B02 1,4 mm. This means that the bubble was confined to a 3
smaller area than that of the superhydrophobic spot itself. This may be due to the fact that the 4
superhydrophobic areas are not actually dots but squares as described in the Experimental Method 5
chapter or the fact that the coating doesn’t hold its properties on the borders of the spot. The later 6
would make the area that is actually superhydrophobic smaller than intended. 7
Visual inspection of Figure 30, Figure 31 and Figure 32 and from comparing the values it is 8
verified that that the bubble base diameter is smaller than the bubble departure diameter for all the 9
surfaces (for the B10 surface inly on the first point this does not happen). This is characteristic of 10
bubbles nucleating on uniform hydrophilic surfaces while for uniform superhydrophobic surfaces the 11
opposite is true. After the bubble grows enough for the bubble diameter to surpass the bubble base 12
diameter it starts to elongate vertically. When the impulsion forces are big enough the bubble starts to 13
detach and on the base of the bubble a phenomena called bubble necking takes place (Jo et al., 14
2016). This can be seen on the bubble growth figures displayed above. This behaviour is in line with 15
that observed by (Jo et al., 2016). 16
17
Figure 33 – Superhydrophobic bubble diameter temporal evolution. 18
The following figures shows graphs corresponding to parameters measured on the contact line. 19
As stated in the previous chapter an error on the pixel identified as the one where the contact line is, 20
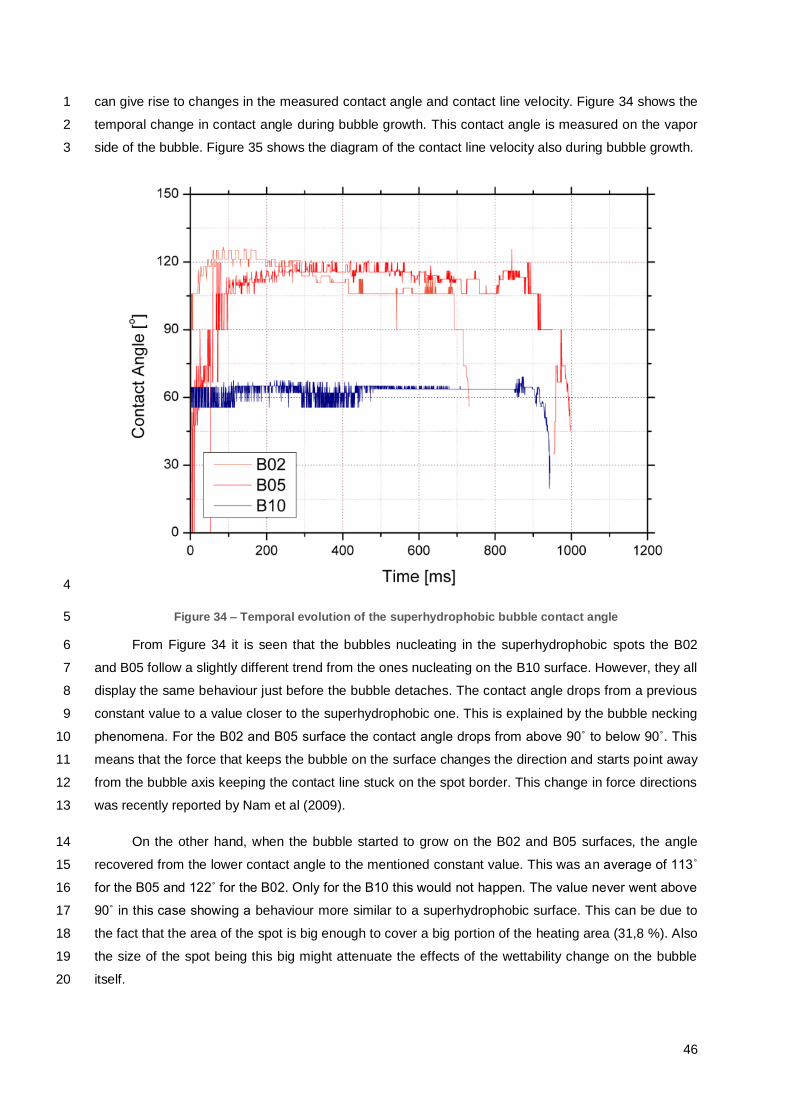
46
can give rise to changes in the measured contact angle and contact line velocity. Figure 34 shows the 1
temporal change in contact angle during bubble growth. This contact angle is measured on the vapor 2
side of the bubble. Figure 35 shows the diagram of the contact line velocity also during bubble growth. 3
4
Figure 34 – Temporal evolution of the superhydrophobic bubble contact angle 5
From Figure 34 it is seen that the bubbles nucleating in the superhydrophobic spots the B02 6
and B05 follow a slightly different trend from the ones nucleating on the B10 surface. However, they all 7
display the same behaviour just before the bubble detaches. The contact angle drops from a previous 8
constant value to a value closer to the superhydrophobic one. This is explained by the bubble necking 9
phenomena. For the B02 and B05 surface the contact angle drops from above 90˚ to below 90˚. This 10
means that the force that keeps the bubble on the surface changes the direction and starts point away 11
from the bubble axis keeping the contact line stuck on the spot border. This change in force directions 12
was recently reported by Nam et al (2009). 13
On the other hand, when the bubble started to grow on the B02 and B05 surfaces, the angle 14
recovered from the lower contact angle to the mentioned constant value. This was an average of 113˚ 15
for the B05 and 122˚ for the B02. Only for the B10 this would not happen. The value never went above 16
90˚ in this case showing a behaviour more similar to a superhydrophobic surface. This can be due to 17
the fact that the area of the spot is big enough to cover a big portion of the heating area (31,8 %). Also 18
the size of the spot being this big might attenuate the effects of the wettability change on the bubble 19
itself. 20

47
Figure 35 shows the contact line velocity of the superhydrophobic bubble. It indicates if the 1
contact line is moving and how much it is moving. To compare the values gathered it is plotted 2
together with the superhydrophobic surface tested by (Valente, 2015). At Annex A, Figure 37 shows 3
the same results but only for the biphilic surfaces. The lines shown there, at a different scale, seem to 4
indicate that the contact line is always moving but this is attributed to errors related to the Matlab 5
routine. It is by comparing with the superhydrophobic surface that it is possible to realize that those 6
variations are negligible. This further confirms the fact that the contact line is pinned at the border of 7
the superhydrophobic spot. 8
9
Figure 35 – Temporal evolution of the superhydrophobic bubble contact line velocity for the biphilic 10 surfaces and of the superhydrophobic surface 11
Returning to the pool boiling curves, of Figure 23 and keeping in mind the bubble dynamics 12
analysis performed, some suppositions can be made. While the B10 surface has superhydrophobic 13
bubbles with a higher diameter than the B05, the frequency of the latter is bigger. Also the hydrophilic 14
bubble frequency is higher on the B05 than on the B10 surface with similar departure diameters. 15
However, the B10, as shown by the boiling curves, is able to reach higher heat fluxes for the same 16
superheat. (J. Kim, 2009) refers that vaporization rate accounts for no more than 25% of total heat 17
transfer while the rest is due to transient conduction enhanced by the rewetting regime and break-up 18
of the superheated layer close to the wall. On uniform superhydrophobic surfaces these last two 19
mechanisms are drastically reduced due to the insulating vapor layer and latent heat accounts for 20
almost all the total heat transferred as shown by (Valente, 2015). 21
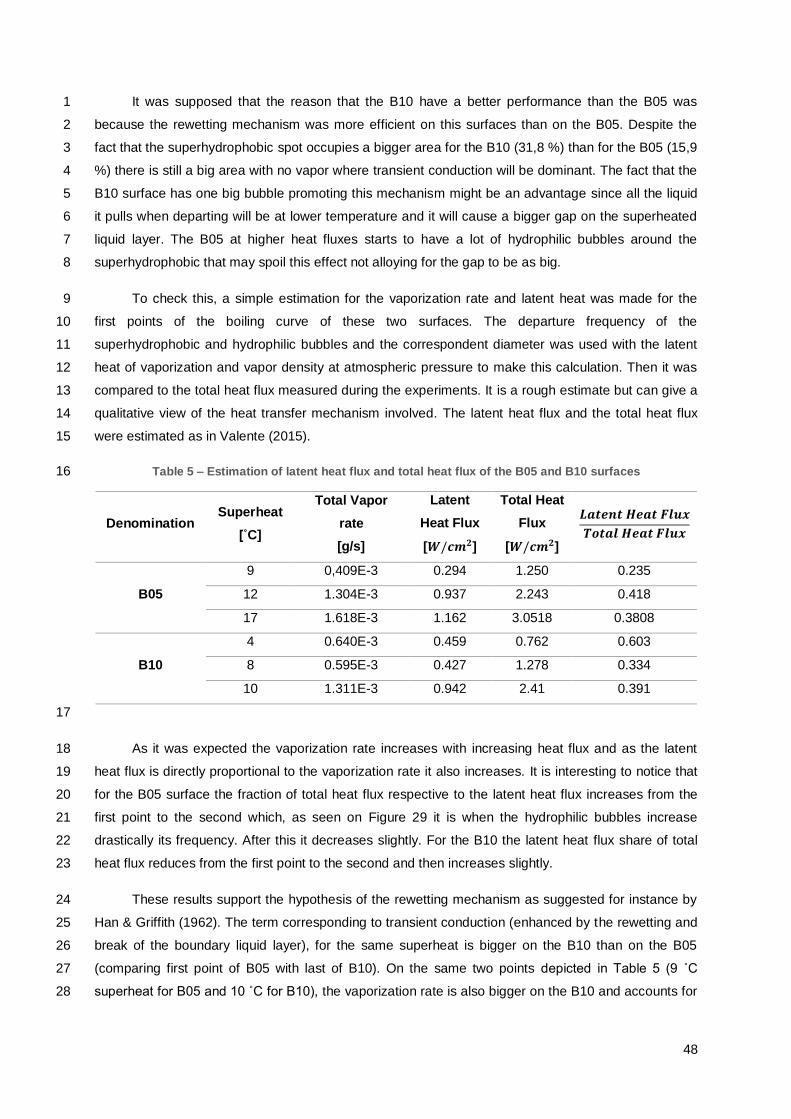
48
It was supposed that the reason that the B10 have a better performance than the B05 was 1
because the rewetting mechanism was more efficient on this surfaces than on the B05. Despite the 2
fact that the superhydrophobic spot occupies a bigger area for the B10 (31,8 %) than for the B05 (15,9 3
%) there is still a big area with no vapor where transient conduction will be dominant. The fact that the 4
B10 surface has one big bubble promoting this mechanism might be an advantage since all the liquid 5
it pulls when departing will be at lower temperature and it will cause a bigger gap on the superheated 6
liquid layer. The B05 at higher heat fluxes starts to have a lot of hydrophilic bubbles around the 7
superhydrophobic that may spoil this effect not alloying for the gap to be as big. 8
To check this, a simple estimation for the vaporization rate and latent heat was made for the 9
first points of the boiling curve of these two surfaces. The departure frequency of the 10
superhydrophobic and hydrophilic bubbles and the correspondent diameter was used with the latent 11
heat of vaporization and vapor density at atmospheric pressure to make this calculation. Then it was 12
compared to the total heat flux measured during the experiments. It is a rough estimate but can give a 13
qualitative view of the heat transfer mechanism involved. The latent heat flux and the total heat flux 14
were estimated as in Valente (2015). 15
Table 5 – Estimation of latent heat flux and total heat flux of the B05 and B10 surfaces 16
Denomination Superheat
[˚C]
Total Vapor
rate
[g/s]
Latent
Heat Flux
[𝑾/𝒄𝒎𝟐]
Total Heat
Flux
[𝑾/𝒄𝒎𝟐]
𝑳𝒂𝒕𝒆𝒏𝒕 𝑯𝒆𝒂𝒕 𝑭𝒍𝒖𝒙
𝑻𝒐𝒕𝒂𝒍 𝑯𝒆𝒂𝒕 𝑭𝒍𝒖𝒙
B05
9 0,409E-3 0.294 1.250 0.235
12 1.304E-3 0.937 2.243 0.418
17 1.618E-3 1.162 3.0518 0.3808
B10
4 0.640E-3 0.459 0.762 0.603
8 0.595E-3 0.427 1.278 0.334
10 1.311E-3 0.942 2.41 0.391
17
As it was expected the vaporization rate increases with increasing heat flux and as the latent 18
heat flux is directly proportional to the vaporization rate it also increases. It is interesting to notice that 19
for the B05 surface the fraction of total heat flux respective to the latent heat flux increases from the 20
first point to the second which, as seen on Figure 29 it is when the hydrophilic bubbles increase 21
drastically its frequency. After this it decreases slightly. For the B10 the latent heat flux share of total 22
heat flux reduces from the first point to the second and then increases slightly. 23
These results support the hypothesis of the rewetting mechanism as suggested for instance by 24
Han & Griffith (1962). The term corresponding to transient conduction (enhanced by the rewetting and 25
break of the boundary liquid layer), for the same superheat is bigger on the B10 than on the B05 26
(comparing first point of B05 with last of B10). On the same two points depicted in Table 5 (9 ˚C 27
superheat for B05 and 10 ˚C for B10), the vaporization rate is also bigger on the B10 and accounts for 28
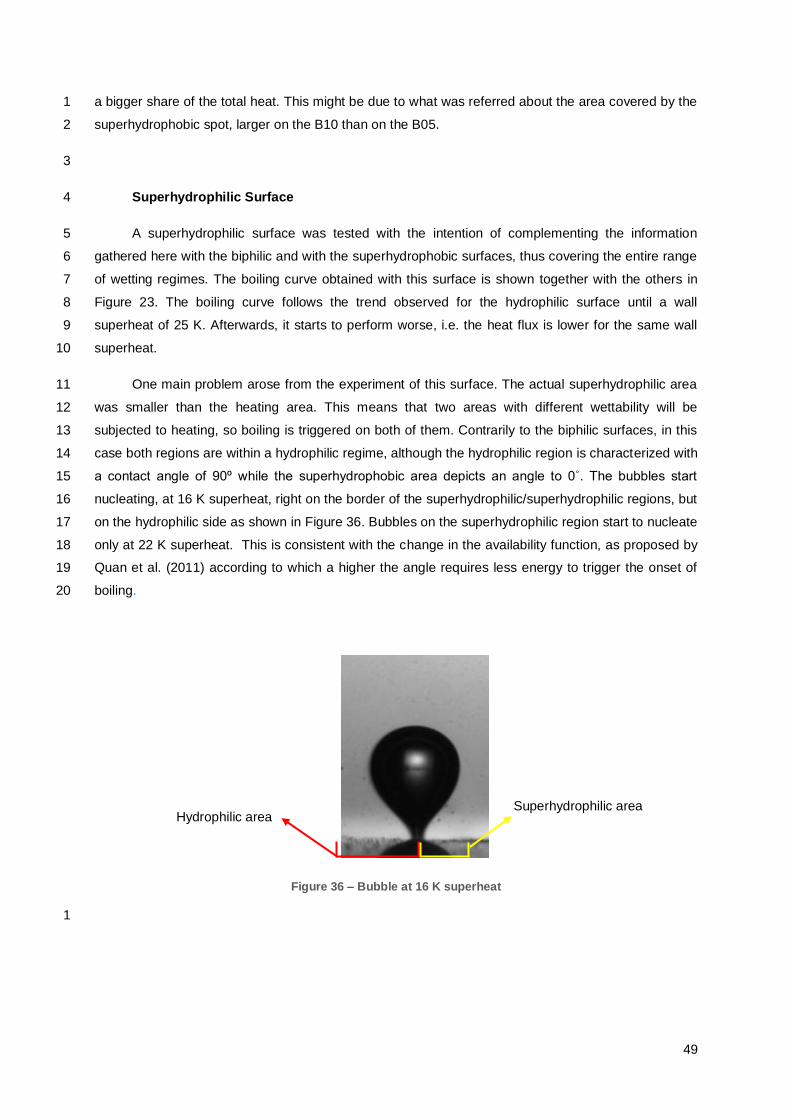
49
a bigger share of the total heat. This might be due to what was referred about the area covered by the 1
superhydrophobic spot, larger on the B10 than on the B05. 2
3
Superhydrophilic Surface 4
A superhydrophilic surface was tested with the intention of complementing the information 5
gathered here with the biphilic and with the superhydrophobic surfaces, thus covering the entire range 6
of wetting regimes. The boiling curve obtained with this surface is shown together with the others in 7
Figure 23. The boiling curve follows the trend observed for the hydrophilic surface until a wall 8
superheat of 25 K. Afterwards, it starts to perform worse, i.e. the heat flux is lower for the same wall 9
superheat. 10
One main problem arose from the experiment of this surface. The actual superhydrophilic area 11
was smaller than the heating area. This means that two areas with different wettability will be 12
subjected to heating, so boiling is triggered on both of them. Contrarily to the biphilic surfaces, in this 13
case both regions are within a hydrophilic regime, although the hydrophilic region is characterized with 14
a contact angle of 90º while the superhydrophobic area depicts an angle to 0˚. The bubbles start 15
nucleating, at 16 K superheat, right on the border of the superhydrophilic/superhydrophilic regions, but 16
on the hydrophilic side as shown in Figure 36. Bubbles on the superhydrophilic region start to nucleate 17
only at 22 K superheat. This is consistent with the change in the availability function, as proposed by 18
Quan et al. (2011) according to which a higher the angle requires less energy to trigger the onset of 19
boiling.20
Figure 36 – Bubble at 16 K superheat
1
Superhydrophilic area Hydrophilic area
50
5 Conclusions
This study follows a previous work developed within the scope of describing the wettability 1
effects on pool boiling. While the previous study, (Valente, 2015), focused on the effect of extreme 2
wetting regimes, namely hydrophilic and superhydrophobic, on surfaces with uniform wettability, here 3
a new type of surfaces is fabricated and tested. These surfaces, called biphilic are composed by 4
hydrophilic regions with superhydrophobic spots and are devised to combine the advantages of the 5
superhydrophobic and hydrophilic surfaces. To fully characterize the pool boiling mechanisms 6
occurring on these surfaces, pool boiling curves were built for the various surfaces. Three different 7
patterns were developed for the biphilic surfaces with increasing dimension of the superhydrophobic 8
spots, while keeping the relation between diameter and pitch constant and equal to 1. The dimension 9
of the spots was 2 mm (B02), 5 mm (B05) and 10 mm (B10). Furthermore, a high speed camera is 10
used to record bubble dynamics. The recorded images are then post processed to evaluate 11
quantitative parameters such as the bubble diameter and frequency, the contact angle and contact 12
line velocity. These parameters allow exploring the heat transfer mechanisms and relate them with the 13
observed bubble dynamics. 14
A peculiar behaviour of the biphilic surfaces was observed when compared to hydrophilic and 15
superhydrophobic surfaces: the onset of nucleation occurred at similar wall superheat than that 16
observed on superhydrophobic surfaces, 1-2 K. However, contrarily to the superhydrophobic surfaces, 17
the biphilic are not entirely covered with an insulating vapor blanket. The wettability contrast on the 18
border of the superhydrophobic spots prevents the vapor from moving further than the border itself. 19
Consequently, the bubbles are confined to the spots, which allows obtaining higher heat fluxes than 20
the superhydrophobic surface, for the same wall superheat. The heat transferred through transient 21
conduction when a bubble departs and breaks the thermal boundary layer plays a vital role here. The 22
flow of the liquid near the biphilic surface is probably similar to that on the superhydrophobic surface, 23
but the absence of the insulating vapor layer allows the liquid to keep flowing within the 24
superhydrophobic spots, so that higher heat fluxes are reached. The biphilic surfaces also display 25
several advantages when compared to the hydrophilic surfaces. This is mainly due to the fact that 26
nucleation on the hydrophilic surfaces starts at a higher wall superheat. This means that while for the 27
boiling on the biphilic surface, for the same initial wall superheat, the heat transfer coefficients HTC 28
are already characteristic of a nucleation regime, the hydrophilic surfaces are still on natural 29
convection regime. It is observed that for the biphilic surfaces the boiling curve follows a trend similar 30
to that of the superhydrophobic surfaces, i.e. it seems that the basic heat transfer mechanism doesn’t 31
change since the line is almost linear (being well described by a quasi-Leidenfrost regime, as reported 32
in the previous work). The slope of the boiling curves for the biphilic surfaces is however much higher, 33
closer to the hydrophilic curve. The biphilic pattern that performs better i.e. allows higher heat fluxes 34
for the same wall superheat is surface B10, being this followed by surface B05 and finally by surface 35
B02. This can be explained analysing bubble dynamics. Hence, the bubbles departing from surface 36
B10 have the highest bubble diameter which associated with its frequency yields the largest 37
vaporization rate, at least when compared to the surface B05. It is also supposed that the B10 surface 38

51
promotes the most efficient rewetting mechanism since the term of heat flux associated with this 1
mechanism is estimated to be the largest. The fact that only one large bubble is present on the 2
superhydrophobic spot may favour the flow of a large amount of liquid, at lower temperature. This 3
would increase the heat transfer rate through transient conduction. 4
It was observed for all the biphilic surfaces that when surface superheat corresponding to ONB 5
of the hydrophilic surfaces was exceeded, bubbles started to nucleate on the border of the 6
superhydrophobic spots and later on the hydrophilic region. The bubbles on the border may merge 7
with those generated at the superhydrophobic spots and decrease its growth time, consequently 8
increasing the departure frequency. The departure frequency of the bubbles generated on the 9
superhydrophobic region was the highest for the surface B02 surfaces, where the growth time is the 10
smallest, while the frequency of the bubbles on surface B10 is the lowest. The contact angle changed 11
during the growth of a bubble. It started close to 60˚ and rose to 113˚ for surface B05 and 122˚ for 12
surface B02. For the B10 surface the contact angle was constant during bubble growth. Just before 13
bubble departure the contact angle would fall again to values below 90˚. The contact line velocity 14
further confirms what was visually observed as the contact line does not move. The non-zero values 15
obtained for the velocity are due to the error associated to the boundary detection in the post 16
processing routine. 17
Aiming at covering all the wetting regimes, superhydrophilic surfaces were also tested. Many 18
problems rose from the use of these surfaces since the superhydrophilic area was not big enough to 19
cover the entire heating area. Boiling would then start at the interface of the superhydrophilic area with 20
the hydrophilic at 16 K of wall superheat, staring on the superhydrophilic area only at 22 K. 21
Many topics remain to be addressed in studies concerning pool boiling under extreme wetting 22
scenarios. Hence, as future work, regarding the biphilic surfaces, the pitch and the diameter of the 23
superhydrophobic spots should be varied independently, to infer on their effect on interference and 24
heat transfer mechanisms. Also the dimensions of the spots should be taken to the micrometre scale, 25
as some studies report huge increases of heat flux when going to this scales. This should be done on 26
a controlled and mechanistic way to control the evolution of bubble dynamics when reducing the scale. 27
Different wettability contrast should also be tested (e.g. superhydrophilic vs. superhydrophobic). The 28
superhydrophilic surfaces should also be further explored, for instance, performing a detailed 29
description of bubble dynamics, after solving the fabrication problem which limits the area of the 30
superhydrophilic surface to be smaller than the total heating area. 31
The quality of the images may also be improved considering illumination with a laser sheet, as 32
the bubbles out of the sheet thickness would not affect the post processing procedure. 33
34
35

52
Bibliography 1
2
Abernethy, R., Benedict, R., & Dowdell, R. (1985). ASME measurements uncertainty. J. Fluids Eng., (107(2)), 3
161–164. 4
Ahn, H. S., Lee, C., Kim, H., Jo, H., Kang, S., Kim, J., … Kim, M. H. (2010). Pool boiling CHF enhancement by 5
micro/nanoscale modification of zircaloy-4 surface. Nuclear Engineering and Design, 240(10), 3350–3360. 6
http://doi.org/10.1016/j.nucengdes.2010.07.006 7
Anderson, T. M., & Mudawar, I. (1989). Microelectronic Cooling by Enhanced Pool Boiling of a Dielectric 8
Fluorocarbon Liquid. Journal of Heat Transfer, 111(3), 752–759. http://doi.org/10.1115/1.3250747 9
Bankoff, S. G. (1957). Ebullition from solid surfaces in the absence of a pre-existing gaseous phase. Trans. Am. 10
Mech. Eng., 79, 735–740. 11
Bankoff, S. G. (1958). Entrapment of gas in the spreading of a liquid over a rough surface. AIChE Journal, 4(1), 12
24–26. http://doi.org/10.1002/aic.690040105 13
Bankoff, S. G., & Mason, J. P. (1962). Heat Transfer from the Surface of a Steam Bubble in Turbulent Subcooled 14
Liquid Stream. AIChE Journal, 8, 30–33. 15
Berenson, P. J. (1960). Transition boiling heat transfer from a horizontal surface, NP-8415. 16
Betz, A. R., Jenkins, J., Kim, C. J., & Attinger, D. (2013). Boiling heat transfer on superhydrophilic, 17
superhydrophobic, and superbiphilic surfaces. International Journal of Heat and Mass Transfer, 57(2), 18
733–741. http://doi.org/10.1016/j.ijheatmasstransfer.2012.10.080 19
Betz, A. R., Xu, J., Qiu, H., & Attinger, D. (2010). Do surfaces with mixed hydrophilic and hydrophobic areas 20
enhance pool boiling? Applied Physics Letters, 97(14), 2012–2015. http://doi.org/10.1063/1.3485057 21
Bhushan, B., & Jung, Y. C. (2011). Natural and biomimetic artificial surfaces for superhydrophobicity, self-22
cleaning, low adhesion, and drag reduction. Progress in Materials Science, 56(1), 1–108. 23
http://doi.org/10.1016/j.pmatsci.2010.04.003 24
Bourdon, B., Di Marco, P., Rioboo, R., Marengo, M., & De Coninck, J. (2013). Enhancing the onset of pool boiling 25
by wettability modification on nanometrically smooth surfaces. International Communications in Heat 26
and Mass Transfer, 45, 11–15. http://doi.org/10.1016/j.icheatmasstransfer.2013.04.009 27
Bourdon, B., Rioboo, R., Marengo, M., Gosselin, E., & De Coninck, J. (2012). Influence of the wettability on the 28
boiling onset. Langmuir, 28(2), 1618–1624. http://doi.org/10.1021/la203636a 29
Cassie, A. B. D., & Baxter, S. (1944). WETTABILITY OF POROUS SURFACES, (5), 546–551. 30
Chen, X., & Qiu, H. (2015). Bubble dynamics and heat transfer on a wettability patterned surface. International 31
Journal of Heat and Mass Transfer, 88, 544–551. 32
http://doi.org/10.1016/j.ijheatmasstransfer.2015.04.086 33
Chi-Yeh, H., & Griffith, P. (1965). The mechanism of heat transfer in nucleate pool boiling—Part I. International 34
Journal of Heat and Mass Transfer, 8(6), 905–914. http://doi.org/10.1016/0017-9310(65)90074-8 35
Cooper, M. G., & Lloyd, A. J. P. (1969). The microlayer in nucleate pool boiling. International Journal of Heat and 36
Mass Transfer, 12(8), 895–913. http://doi.org/10.1016/0017-9310(69)90154-9 37
Corty, C., & Foust, A. S. (1955). Surface variables in nucleate boiling. Preprint I, AIChE, Heat Transfer Ymposium, 38
51(17), 1–12. 39
Decker, E. L., Frank, B., Suo, Y., & Garoff, S. (1999). Physics of contact angle measurement, 156, 177–189. 40
53
Dong, L., Cheng, P., & Quan, X. (2012). Availability analyses for heterogeneous nucleation under steady heating 1
in pool boiling. International Communications in Heat and Mass Transfer, 39(6), 776–780. 2
http://doi.org/10.1016/j.icheatmasstransfer.2012.05.004 3
Forrest, E., Williamson, E., Buongiorno, J., Hu, L. W., Rubner, M., & Cohen, R. (2010). Augmentation of nucleate 4
boiling heat transfer and critical heat flux using nanoparticle thin-film coatings. International Journal of 5
Heat and Mass Transfer, 53(1–3), 58–67. http://doi.org/10.1016/j.ijheatmasstransfer.2009.10.008 6
Forster, H. K., & Zuber, N. (1955). Dynamics of Vapor Bubbles and Boiling Heat Transfer. AIChE Annual Meeting, 7
1(4), 531–535. http://doi.org/10.1002/aic.690010425 8
Fritz, W. (1935). Maximum Volume of Vapour Bubbles. Physik. Zeitshr., 36, 379–388. 9
Fritz, W., & Ende, W. (1936). Uber den verdam-pfungsvorgang nach kinematigraphischen aufnahme an 10
dampfblasenr. Physik. Zeitshr., 37, 391–401. 11
Griffith, P., & Wallis, J. D. (1958). The Role of Surface Conditions in Nucleate Boiling, (14), 1–32. 12
Grundke, K., Pöschel, K., Synytska, A., Frenzel, R., Drechsler, A., Nitschke, M., … Welzel, P. B. (2015). 13
Experimental studies of contact angle hysteresis phenomena on polymer surfaces - Toward the 14
understanding and control of wettability for different applications. Advances in Colloid and Interface 15
Science, 222, 350–376. http://doi.org/10.1016/j.cis.2014.10.012 16
Gunther, F. C., & Kreith, F. (1949). Photographic Study of Bubble Formation in Heat Transfer to Subcooled 17
Water. Heat Transfer and Fluid Mech. Inst., 113. 18
Hamzekhani, S., Falahieh, M. M., Kamalizadeh, M. R., & Nazari, Z. (2015). Experimental study on bubble 19
departure frequency for pool boiling of water/NaCl solutions. Heat and Mass Transfer/Waerme- Und 20
Stoffuebertragung, 51(9), 1313–1320. http://doi.org/10.1007/s00231-015-1502-x 21
Han, C.-Y., & Griffith, P. (1962). The Mechanism of Heat Transfer in Nucleate Pool Boiling. ONR Report No. 22
7673-19, 1–76. 23
Hendricks, R. C., & Sharp, R. R. (1964). Initiation of cooling due to bubble growth on a heating surface. 24
Hiemenz, P. C. H., & Rajagopalan, R. (1997). Principles of Colloid and Surface Chemistry (3rd ed.). Marcel 25
Dekker, Inc. 26
Honda, H., Takamastu, H., & Wei, J. J. (2001). Enhanced Boiling of FC-72 on Silicon Chips With Micro-Pin-Fins 27
and Submicron-Scale Roughness. J. Heat Transfer, 124(2), 383–390. 28
Hsu, Y. Y. (1962). On the Size Range of Active Nucleation Cavities on a Heating Surface. Journal of Heat Transfer, 29
2–8. 30
Hummel, R. L. (1965). Means for increasing the heat transfer coefficient between a wall and a boiling liquid. 31
United States Patent Office. 32
Jakob, M. (1932). Zeits. Zeitschr. D. Ver. Deutsch. Ing., 76, 1161. 33
Jakob, M. (1936). Heat Transfer in Evaporation and Condension. Mech. Engg, 58, 643–660. 34
Jakob, M. (1949). Heat Transfer Vol. I (7th Ed.). John Wiley & Sons, Inc. 35
Jo, H., Kim, H., Seon, H., Kim, S., Ho, S., Kim, J., & Hwan, M. (2009). The nucleate boiling heat transfer by the 36
hydrophobic milli-dot on the silicon surface. Transactions of the Korean Nuclear Society Spring Meeting, 37
567–568. 38
Jo, H., Park, H. S., & Kim, M. H. (2016). Single bubble dynamics on hydrophobic-hydrophilic mixed surfaces. 39
International Journal of Heat and Mass Transfer, 93, 554–565. 40
http://doi.org/10.1016/j.ijheatmasstransfer.2015.09.031 41

54
Jones, B. J., McHale, J. P., & Garimella, S. V. (2009). The Influence of Surface Roughness on Nucleate Pool 1
Boiling Heat Transfer. Journal of Heat Transfer, 131(December 2009), 121009. 2
http://doi.org/10.1115/1.3220144 3
M. Kato , A. Tanaka, M. Sasagawa, H. Adachi (2008) Durable automotive windshield coating and the use thereof 4
US 8043421 B2, Patent US8043421 B2. 5
Kamatchi, R., & Venkatachalapathy, S. (2015). Parametric study of pool boiling heat transfer with nanofluids for 6
the enhancement of critical heat flux: A review. International Journal of Thermal Sciences, 87, 228–240. 7
http://doi.org/10.1155/2012/435873 8
Kandlikar, S. G. (2001). A Theoretical Model to Predict Pool Boiling CHF Incorporating Effects of Contact Angle 9
and Orientation. Journal of Heat Transfer, 123(6), 1071. http://doi.org/10.1115/1.1409265 10
Kim, J. (2009). Review of nucleate pool boiling bubble heat transfer mechanisms. International Journal of 11
Multiphase Flow, 35(12), 1067–1076. http://doi.org/10.1016/j.ijmultiphaseflow.2009.07.008 12
Kim, S. J., Bang, I. C., Buongiorno, J., & Hu, L. W. (2007). Surface wettability change during pool boiling of 13
nanofluids and its effect on critical heat flux. International Journal of Heat and Mass Transfer, 50(19–20), 14
4105–4116. http://doi.org/10.1016/j.ijheatmasstransfer.2007.02.002 15
Kurihara, H. M., & Myers, J. E. (1960). The effects of superheat and surface roughness on boiling coefficients. 16
AIChE Journal, 6(1), 83–91. http://doi.org/10.1002/aic.690060117 17
Kutateladze, S. S. (1951). A Hydrodynamic Theory of Changes in a Boiling Process Under Free Convection. 18
Izvestia Akademia Nauk, S.S.S.R., Otdelenie Tekhnicheski Nauk, (No. 4), 529. 19
Lee, J. S., & Lee, J. S. (2016). Numerical approach to the suppression of film boiling on hot-spots by radial 20
control of patterned wettability. International Journal of Multiphase Flow, 84, 165–175. 21
http://doi.org/10.1016/j.ijmultiphaseflow.2016.04.021 22
Lienhard, J. H., and Dhir, V. K. (1973). Extended Hydrodynamic Theory of the Peak and Minimum Pool Boiling 23
Heat Fluxes. 24
Lorenz, J. J., Mikic, B. B., & Rohsenow, W. M. (1972). The Effects of Surface Conditions on Boiling 25
Characteristics, 1–29. 26
M.Jakob, & Fritz, W. (1931). Versuche uber den Verdampfungsvorgang. Forschungsgebiete Des Ingenieur, 2, 27
435–447. 28
Malavasi, I., Bourdon, B., Di Marco, P., de Coninck, J., & Marengo, M. (2015). Appearance of a low superheat 29
“quasi-Leidenfrost” regime for boiling on superhydrophobic surfaces. International Communications in 30
Heat and Mass Transfer, 63, 1–7. http://doi.org/10.1016/j.icheatmasstransfer.2015.01.012 31
Messina, A. D., & Park, E. L. (1981). Effects of precise arrays of pits on nucleate boiling. International Journal of 32
Heat and Mass Transfer, 24(1), 141–145. http://doi.org/10.1016/0017-9310(81)90102-2 33
Mikic, B. B., & Rohsenow, W. M. (1969). A New Correlation of Pool-Boiling Data Including the Effect of Heating 34
Surface Characteristics. Journal of Heat Transfer, 91(2), 245. http://doi.org/10.1115/1.3580136 35
Nukiyama, S. (1934). The maximum and minimum values of the heat Q transmitted from metal to boiling water 36
under atmospheric pressure. 37
Phan, H. T., Caney, N., Marty, P., Colasson, S., & Gavillet, J. (2009). Surface wettability control by nanocoating: 38
The effects on pool boiling heat transfer and nucleation mechanism. International Journal of Heat and 39
Mass Transfer, 52(23–24), 5459–5471. http://doi.org/10.1016/j.ijheatmasstransfer.2009.06.032 40
Quan, X., Chen, G., & Cheng, P. (2011). A thermodynamic analysis for heterogeneous boiling nucleation on a 41
superheated wall. International Journal of Heat and Mass Transfer, 54(21–22), 4762–4769. 42
http://doi.org/10.1016/j.ijheatmasstransfer.2011.05.026 43
55
Rohsenow, W. M., and Griffith, P. (1956). Correlation of Maximum Heat Transfer Data for Boiling of Saturated 1
Liquids. Chem. Eng. Prog., (52), 47. 2
Rohsenow, W. M. (1951). A method of correlating heat transfer data for surface boiling of liquids. Transactions 3
of the ASME, 74, 969–976. 4
Snyder, N. R., & Edwards, D. K. (1956). Summary of confrence on bubble dynamics and boiling heat transfer . In 5
Jet Propulsion Laboratory, June 14–15 (p. Memo 20-137). 6
Son, G., & Dhir, V. K. (1999). Dynamics and Heat Transfer Associated With a Single Bubble During Nucleate 7
Boiling on a Horizontal Surface, 121(August 1999), 623–631. 8
Stephan, P., & Hammer, J. (1994). A new model for nucleate boiling heat transfer. Heat and Mass 9
Transfer/Waerme-Und Stoffuebertragung, 30(2), 119–125. http://doi.org/10.1007/BF00715018 10
Valente, T. (2015). Study of the effects of wettability on pool boiling conditions in a quiescent medium. MSc 11
Thesis in Mechanical Engineering, Instituto Superior Técnico, Universidade de Lisboa. 12
W. Adamson, A. (1976). Physical Chemistry of Surfaces (3rd ed.). John Wiley & Sons, Inc. 13
Wang, C. H., & Dhir, V. K. (1993). Effect of Surface Wettability on Active Nucleation Site Density During Pool 14
Boiling of Water on a Vertical Surface. Journal of Heat Transfer, 115(August 1993), 659. 15
http://doi.org/10.1115/1.2910737 16
Wei, J. J., & Honda, H. (2003). Effects of fin geometry on boiling heat transfer from silicon chips with micro-pin-17
fins immersed in FC-72. International Journal of Heat and Mass Transfer, 46(21), 4059–4070. 18
http://doi.org/10.1016/S0017-9310(03)00226-6 19
Wenzel, R. N. (1936). Resistance of solid surfaces to wetting by water. Journal of Industrial and Engineering 20
Chemistry (Washington, D. C.), 28, 988–994. http://doi.org/10.1021/ie50320a024 21
Westwater, J. W. (1959). Boiling Heat Transfer. American Scientist, 47, 427–446. 22
Yao, Z., Lu, Y. W., & Kandlikar, S. G. (2011). Effects of nanowire height on pool boiling performance of water on 23
silicon chips. International Journal of Thermal Sciences, 50(11), 2084–2090. 24
http://doi.org/10.1016/j.ijthermalsci.2011.06.009 25
Young, T. (1805). An Essay on the Cohesion of Fluids. Philosophical Transactions of the Royal Society of London, 26
95(0), 65–87. http://doi.org/10.1098/rstl.1805.0005 27
Zuber, N. (1959). Hydrodynamic Aspects of Boiling Heat Transfer. Ph.D. thesis, Research Laboratory, Los Angeles 28
and Ramo-Wooldridge Corporation, University of California, Los Angeles, CA. 29
30
31
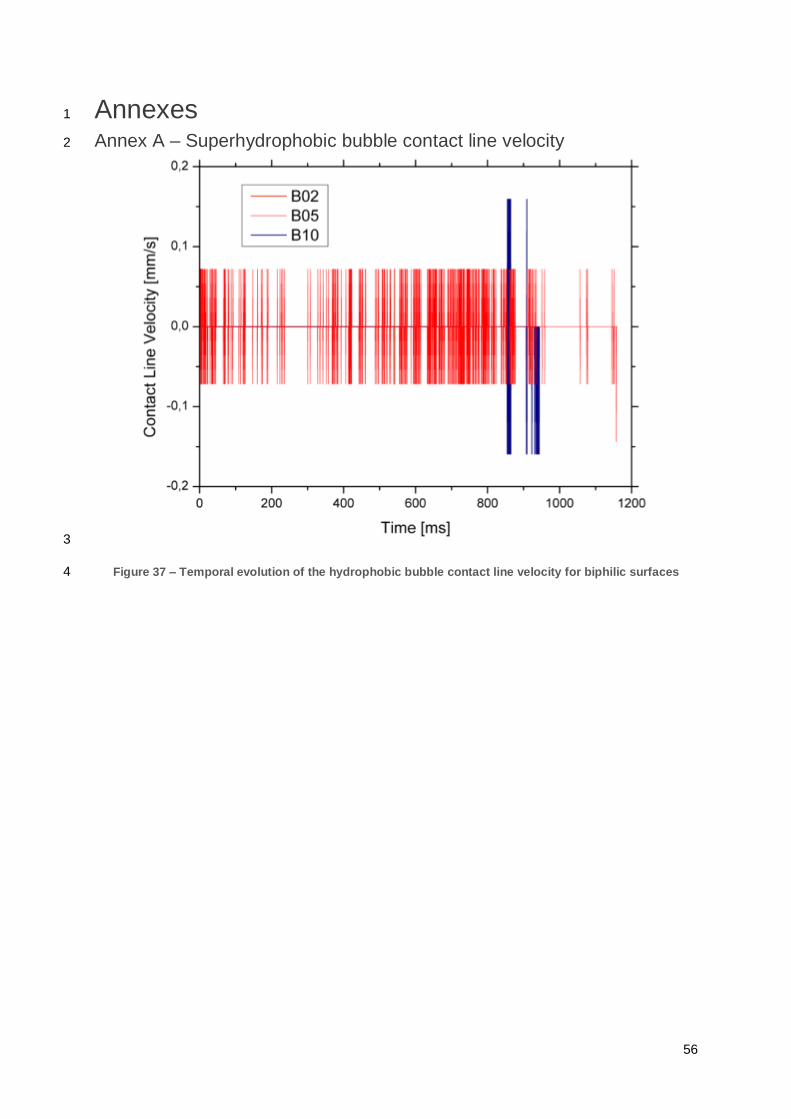
56
Annexes 1
Annex A – Superhydrophobic bubble contact line velocity 2
3
Figure 37 – Temporal evolution of the hydrophobic bubble contact line velocity for biphilic surfaces 4