STRATEGIC RESPONSES TO COMPETITION AMONG LARGE FAST
FOOD RESTAURANTS IN NAIROBI CENTRAL BUSINESS DISTRICT
BY
CATHERINE W. MWANGI
A MANAGEMENT RESEARCH PROJECT SUBMITTED IN PARTIAL
FULFILMENT OF THE REQUIREMENTS FOR THE AWARD OF THE
DEGREE OF MASTER OF BUSINESS ADMINISTRATION (MBA),
SCHOOL OF BUSINESS, UNIVERSITY OF NAIROBI.
NOVEMBER, 2010
DECLARATION
This is my original work and has not been presented for a degree in any other university.
Name: Catherine Wanjugu Mwangi Signature
Registration No.: D61/70056/2008 Date......
ZACK B. AWINO PhD
LECTURER
DEPARTMENT OF BUSINESS MANAGEMENT
SCHOOL OF BUSINESS
COLLEGE OF HUMANITIES AND SOCIAL SCIENCES
UNIVERSITY OF NAIROBI

ACKNOWLEDGEMENTS
I first wish to thank the Almighty God for granting me the opportunity to carry out this project.
I am deeply indebted to all those people who influenced me to successfully complete
this project. My special appreciation goes to my supervisor Dr. Zack B. Awino for his guidance
and direction.
iii

DEDICATION
To my late dad, Francis John Gikibi, my hero, for his upbringing, believing in my capabilities
and a staunch supporter of the girl child education. I miss you greatly and wish you were around
to witness your dreams being fulfilled.
Special thanks to my dear Husband Tony, the rock of my life and children Ian and Ivy, my
special gifts from God, for their warm support and understanding during my period of study.
Deep appreciation goes to my mum, Jerioth Wanjiru and Tata for their continued love, support
and wise counsel. To my Gik sisters, Joyce, Rosemary, Alice and Nancy, I am privileged to be
one of your sisters and treasure your presence in my life.
IV
TABLE OF CONTENTS
DECLARATION.............................................................................................................................ii
ACKNOWLEDGEMENTS........................................................................................................... iii
DEDICATION................................................................................................................................iv
LIST OF TABLES....................................................................................................................... viii
LIST OF FIGURES.................................................................................................................. iix
LIST OF ABBREVIATIONS AND ACRONYMS....................................................................... x
ABSTRACT....................................................................................................................................xi
CHAPTER ONE: INTRODUCTION..........................................................................................1
1.1 Background of the study............................................................................................................1
1.1.1 Strategic response.......................................................................................................2
1.1.2 Competition in the Fast Food industry........................................................................5f
1.1.3 Flospitality Industry in Kenya.....................................................................................6
1.1.4 Fast Food restaurants in Nairobi Central Business District........................................8
1.1.5 Nairobi Central Business District........................................................................ 9
1.2 Statement of the Problem......................................................................................................... 10
1.3 Study Objectives...................................................................................................................... 12
1.4Value of the study..................................................................................................................... 12
CHAPTER TWO: LITERATURE REVIEW...........................................................................13
2.1 Introduction.............................................................................................................................. 13
2.2 Theories and concepts of strategic responses.......................................................................... 13
2.2.1 Strategic response theories........................................................................................13
2.3 Porter’s generic business strategies.........................................................................................15
2.3.1 Criticisms of generic strategies.................................................................................19
2.4 Competitive forces that shape strategy....................................................................................20
2.5 The Environment.....................................................................................................................22
2.6 Empirical evidence and knowledge gap..................................................................................23
CHAPTER THREE: RESEARCH METHODOLOGY..........................................................25
3.1 Introduction........................................................................................................................... 25
3.2 Research design.......................................................................................................................25
3.3 Population of the Study........................................................................................................... 25
3.4 Data Collection........................................................................................................................26
3.5 Data Analysis...........................................................................................................................26
CHAPTER FOUR: DATA ANALYSIS AND INTERPRETATION OF RESULTS......... 27
4.1 Introduction..............................................................................................................................27
4.1.1 Characteristics of the respondents............................................................................27
4.1.2 Respondents gender..................................................................................................28
4.1.3 Age Bracket..............................................................................................................28
4.1.4 Length of continuous service with organization (years)......................................... 29
4.1.5 Duration of fast food existence.................................................................................30
4.1.6 Number of employees...............................................................................................31
4.1.7 Existence of other branches......................................................................................32
4.2 Customers................................................................................................................................32
4.2.1 Target Customers......................................................................................................33
4.2.2 Reasons for customers patronizing an outlet............................................................34
4.2.3 Influence to stock products.......................................................................................35
4.2.4 Importance of outlet branding...................................................................................36
4.2.5 Customers views on prices........................................................................................37
4.2.6 Market served............................................................................................................38
4.2.7 Importance of the goals.............................................................................................38
4.3 Strategic responses...................................................................................................................40
4.3.1 Use of brand name................................................................................................... 40
4.3.2 Use of action plans to beat competition....................................................................41
4.3.3 Importance of factors in response to competition.....................................................42
4.3.4 Cost leadership......................................................................................................... 43
4.3.5 Differentiation...........................................................................................................44
4.4 Action plan implementation challenges...................................................................................45
CHAPTER FIVE: SUMMARY, CONCLUSION AND RECOMMENDATIONS.............. 47
5.1: Conclusion..............................................................................................................................47
vi

5.2 Recommendations 49
5.2.1 Recommendations on Customers............................................................................. 49
5.2.2 Recommendations on strategic Responses...............................................................49
5.2.3 Recommendations on Competitive Challenges...................................................... 49
5.2.4. Recommendations for Further Research..................................................................50
5.3 Limitations of study.................................................................................................................50
5.4 Implication on policy and practice........................................................................................ 50
REFERENCES..............................................................................................................................51
APPENDICES...............................................................................................................................58
APPENDIX I : LETTER OF INTRODUCTION..........................................................................58
APPENDIX II : QUESTIONNAIRE.............................................................................................59
APPENDIX III : FAST FOOD OUTLETS IN NCBD..................................................................66
vii
LIST OF TABLES
Page
Table 4.1: Distribution of respondents by age............................................................. 28
Table 4.2: Length of service with organization (years)................................................ 29
Table 4.3: Target customers..........................................................................................33
Table 4.4: Outlet patronization......................................................................................34
Table 4.5: Importance of outlet branding......................................................................36
Table 4.6: Market served...............................................................................................38
Table 4.7: Importance of the goals................................................................................ 39
Table 4.8: Use of brand name........................................................................................40
Table 4.9: Use of action plans to beat competition.......................................................41
Table 4.10: Importance of factors in response to competition..................................... 42
Table 4.11: Cost leadership.......................................................................................... 43
Table 4.12: Differentiation............................................................................................44
viii
Table 4.13: Challenges 45
LIST OF FIGURES
Page
Figure 4.1: Characteristics of the respondents............................................................27
Figure 4.2: Gender composition..................................................................................28
Figure 4.3: Duration of fast food existence.................................................................30
Figure 4.4: Number of employees...............................................................................31
Figure 4.5: Existence of other branches......................................................................32
Figure 4.6: Influence to stock products.......................................................................35
Figure 4.7: Customers views on prices........................................................................37
IX

LIST OF ABBREVIATIONS AND ACRONYMS
DSTV - Digital Satellite Television
NCBD - Nairobi Central Business District
NCBDA - Nairobi Central Business District Association
SPSS - Statistical Package for Social Sciences
SWOT - Strengths, Weaknesses, Opportunities, Threats
x
ABSTRACT
The fast food industry in Nairobi Central Business District has in the past years witnessed
dramatic changes brought about by competition. The fast food outlets try to outdo each other by
way of differentiation in terms of the food they serve. Consequently, all fast food outlets have to
continuously monitor and adapt to the environmental changes. As a result of this, firms have to
employ various strategies to survive in the industry. The study sought to find and establish the
strategic responses to competition among large fast food restaurants in Nairobi Central Business
District (NCBD). The study also sought to highlight the various challenges these firms have to
contend with. Towards this end, the study collected primary data from the outlets on the strategic
responses they apply. The data was collected through the administration of questionnaires to the
outlets. The study established that the outlets have specific target markets to serve, what they
stock mostly determines the type of customers, branding of an outlet differentiates it from others,
the outlets use brand names in order to cultivate customer loyalty, ensuring high quality of food
and services and entrance into new markets. Increasing number of outlets, security measures,
convenience and ease of accessibility, attractive outlet layout and design, consistency with other
outlets, general cleanliness of outlet and uninterrupted power and water supply were all used by
the outlets to beat competition in the market. The findings also show that the outlets use all the
three strategic options available to a firm that is focus, differentiation and cost leadership. Key
challenges faced by the outlets were identified as financial requirement, competition from
smaller outlets, substitutes, changing consumer tastes and preferences, provision of reliable
utilities by suppliers and ability and skills of staff. The study therefore recommends the use of
market survey before deciding target customers, use of brand name to the satisfaction of
customers and the outlets should factor in competitive challenges faced which have been
highlighted as affecting the customers.
Key Words: Strategic responses, Competition, Large fast food restaurants, Nairobi
Central Business District
XI
CHAPTER ONE: INTRODUCTION
1.1 Background of the study
The service sector is expanding at an increasing rate and is becoming intensely competitive. As
such, every organization needs to adopt some strategies which will enable it to have a
competitive edge over the others. As competition intensifies, many businesses continue to seek
profitable ways in which to differentiate themselves from competitors. Strategies are at ends and
these ends concern the purpose and objectives of the organization. They are the things that
organizations do, the paths they follow and the decisions they take in order to reach certain
points or level of success.
In global and highly competitive markets, organizations strive to be innovative and agile enough
to meet customers’ demands. Competitiveness, based on organizational capabilities and
production strategies, may lead to quality, efficiency and flexibility. In the pursuit of ‘mass
customization’, flexibility and scale economies are followed simultaneously. The search for a
system’s flexibility, responsiveness and reliability on the one hand, and low costs on the other,
has led to the reconfiguration of the design and production activities and thus advocated the
changes in the overall supply chain management (Suri,1998).
In today's world of cut-throat fierce competition, customer satisfaction is very essential for an
organization to not only exist but excel in the market. Today's market is enormously more
complex. Henceforth, to survive in the market, the company not only needs to maximize its
profit but also needs to satisfy its customers and should try to build upon from there. The fast
changing competitive environment and firms' competitive positions are constantly challenged by
the emergence of new technologies, products, markets and competitors. Flexibility and1
adaptability have become key management concepts to develop a sustainable competitive
advantage. Successful firms apply them in new organizational strategies that put into question
many conventional tenets on organizations and their management. These strategies involve a
decentralized and responsive work organization, based on co-operative relations not only within
the firm but also in its relations with customers, suppliers and competitors. However, firms are
also increasingly resorting to traditional market mechanisms through the use of contingent
workers and arms’-length subcontracting relations.
1.1.1 Strategic response
A strategy is a pattern or plan that integrates an organizations major goal, policies and action
sequences into a cohesive whole (Porter, 1980). Strategic management is therefore concerned
with deciding on a strategy and planning how the strategy is to be put into effect through
strategic analysis, strategic choice, strategic implementation and control (Johnson and Scholes,
1993). The strategic management process allows an organization to take advantage of key
environmental opportunities to minimize the impact of external threats, to capitalize upon
internal strengths and overcome weakness. A large number of research studies have concluded
that organization’s that have adopted strategic management are likely to be more profitable and
successful than those that do not (Fred, 1996).
Strategies which are implemented within an organization should support the culture associated
with the firm. The proposed strategy should preserve, emphasize, and enhance the culture, in
accordance with the culture supporting the proposed strategy. The fast food industry has of late
been under intense competition from the other eating points within the town and therefore for
them to sustain the competition they should develop strategies that can enable them to survive.
Environment is a key factor to a firm's success. Environment can be relatively stable or highly2
turbulence. Each level of environmental turbulence; has different characteristics, requires
different strategies and requires different firm capabilities (Ansoff and McDonell, 1990). Thus
there is need for continuous strategic diagnosis. Strategic diagnosis is a systematic approach to
determining the changes that have to be made to a firm’s strategy and internal capability in order
to assure the firm’s success in the future environment. Based on appreciation that periodic
planning systems are not able to perceive and respond to threats and opportunities in a
turbulent/chaotic environment.
One of the most prevalent questions within strategic management is how firms are able to attain
profits that allow them to gain superior competitive performance compared to their competitors.
Porter’s (1980) model of competitive strategy proposed that firm’s position within an industry
was an important factor in attaining competitive advantage. This position is largely influenced by
the firm’s strategic responses to the continuous environmental changes.
»
According to Pearce and Robinson (1988) strategic responses are a set of decisions and actions
that result into formulation and implementation of plans designed to achieve a firm’s objectives.
In order to effectively achieve the firm’s objectives, these set of plans and actions must be
strategically fit to the complexities and dynamism of a rapidly shifting environment. Firms
largely are open systems where there is continuous interaction and interfaces with the external
environment. Strategic responses are the strategies that firms take and largely triggered by
continuous changes in the external environment. Johnson and Scholes (1997) defined strategy as
the direction and scope of an organization over the long term which achieves advantage for the
organization over the long term through its configuration of resources within a changing
environment to meet the needs of the markets and fulfill stakeholders expectations.
3
Ansoff and McDonnel (1990) argued that this can be done by positioning of the firm through
strategy and capability planning in its rightful competitiveness, use of real time response through
issue management and systematic management of resistance to change during strategic
implementation. According to Ross (1996), the firm has to learn, adopt and reorient itself to the
changing environment. He also postulates that when a discontinuity begins to affect a firm in a
turbulent environment, brought about by globalization and trade liberalization for instance, its
impact typically remains hidden within the normal fluctuations in performance. According to
Byar’s (1991) operational responses are concerned with efficiency of operations while strategic
responses affect several areas of operation, require top management decisions and huge financial
commitments, are forward looking and affect long term prosperity of the firm and most critical
are dependent on the environment.
Timely response is critical to avoid adverse effects or missed opportunities. Costs of none
response could be lost accumulative profits and cost of reversing the loss. Strategic response may
include development of new products, new markets, new process, new services, and new
strategies for attaching the market, restructuring, marketing, information technology, leadership
. and culture change. Firms need strategy to sustain and grow profitability, revenues, market share
and most importantly-acceptance. Stand alone strategies are not enough. Competitive strategy is
concerned with how a company competes in a particular business and gains a competitive
advantage through a distinctive way of competing. Business firms need to consider the overall *strategy if a company diversifies. It is concerned with the mix of businesses the company should
compete in, and the ways in which strategies of individual units should be coordinated and
integrated. Competition is at the core of the success or failure of firms. Competition determines
the appropriateness of a firm's activities that cah contribute to its performance, such as4
innovations, a cohesive culture and good implementation. Competitive strategy helps to search
for a favorable competitive position in an industry, aims to establish a profitable and sustainable
position against the forces that determine industry competition. The ability of a company to
capture the opportunity that an industry gives depends on its core competency.
According to Pearce and Robinson, (2002), for organizations to achieve their goals and
objectives, it is necessary for them to adjust to their environment. The dynamism of the
environment implies that the organization has constantly redesigned their strategies in order to
remain competitive. Failure to effectively adapt the organization to its environment leads to a
strategic problem. Such a problem will be evidenced by a mismatch between what the
organization offers and what the market demands. Considering that performance is the major
objective of an organization, it is generally accepted that the structure and decision making in an
organization is influenced by environmental complexity and volatility, Miles and Snow (1978). It
is further argued that the alignment of strategies of organizations with the requirements of their
environment outperform organizations that fail to achieve such an alignment, (Chaganti et al.
1988; Beal 2000). Environment scanning is generally accepted as being the first step in the
process of aligning strategy with environment, (Hambrick 1982; Daft and Weick 1984; Beal
2000). This is because environmental scanning will help the organization to learn more about
opportunities for taking competitive advantage and threats referring to its survival (Dess 1987;
Bourgeois 1980; Lang et al 1984).
1.1.2 Competition in the Fast Food Industry
Competition is a contest between individuals, groups, nations, restaurants and animals for
territory, a niche, or a location of resources. It arises whenever two or more parties strive for a
5
goal which cannot be shared. Competition occurs naturally between living organisms which co
exist in the same environment. Business is often associated with competition as most companies
are in competition with at least one other firm over the same group of customers, Lynch (2003).
According to David (2000), the level of competition a firm faces will depend on a number of
factors which include; the greater the number of firms operating in the industry, the greater will
be the level of competition faced by each firm in that industry, on the extent to which its
products are similar to its competitor’s products. If a firm operates in an industry where its
competitor’s products are an almost perfect substitute for its products, then the firm will
generally face a high level of competition. If however a firm is able to offer a product which is
different from that of its rivals, then the firm will face less competition and the ease with which
competitors can enter or leave the industry. If firms find it difficult or costly to enter the industry,
then existing firms may find that they face limited competition. Whereas if it is relatively easy to
enter an industry, firms will generally find that they face a high level of competition. Generally
speaking, an industry could be described as being highly competitive whenever a large number
of relatively small firms, who offer similar products, operate in the industry. If however the
industry is dominated by a small number of large firms, the industry could be described as being
highly concentrated, Darrow at al., (2001).
1.1.3 Hospitality Industry in Kenya
Kenya lies along the East Coast of Africa covering an area of 586,350 sq. km. with an estimated
population of over 30 million people. Agriculture is the mainstay of the economy. Tourism is
currently the second largest contributor to the economy after agriculture. The Hospitality
industry exists as a subset of the Tourism industry.
6
The Hospitality industry in Kenya dates back to pre-independence days. At that time, there was
already a relatively well developed but limited hospitality infrastructure. The available
restaurants were spartan but ideal for the settler community in Kenya. However, soon after
independence, the Kenya Government realized the enormous potential of the nascent Hospitality
industry and hence undertook to upgrade the existing infrastructure and superstructure as well as
investing in additional facilities. To achieve its goal, the Government encouraged local and
foreign entrepreneurs to invest in the Hospitality industry thus paving the way for the future
development of the sector.
In view of the proven potential of the Hospitality sector, the Government formulated Sessional
Paper No.8 of 1969 of the Development of Tourism in Kenya which defined the growth targets
that it hoped to achieve in the years ahead as well as outline the areas where the Government
would participate jointly with the private investors in developing the Hospitality industry. The
growth in demand for fast food restaurants increased proportionately. Presently we see a
dynamic Hospitality industry where the need to have ready to eat meals has tremendously and
continuously increased. This leaves the Hospitality industry with a lot of opportunities. Strategic
management therefore is inevitable to enable investors, government, industry professionals and
scholars with a duty to spur exploitation of these opportunities for the industry. This is clearly
seen in the government strategic plans like the vision 2030 economic pillar. The Hospitality
industry today covers diverse infrastructural facilities including fast food restaurants of small,
medium and large sizes.
7
1.1.4 Fast Food restaurants in Nairobi Central Business District
The concept of fast food is generally associated with urban development. Fast food restaurants or
outlets in the NCBD are either kiosks or elaborate quick service restaurants. The franchise
operations have generated restaurant chains that offer standardized meals in the NCBD, for
example Galitos, Kenchic, Steers. On account of popularity of fast food, fast food restaurants are
common throughout the NCBD and cater to the dry food demands of the younger generation,
extremely tight adult work schedules and distinct ambiance preferences.
An overview of the fast food restaurants in the NCBD highlights the availability of meals that
suffice the need to eat amidst tight work schedules. This has offered great respite to parents who
shuttle between work and home for major part of the day. Delicacies like fish and chips,
vegetarian and non-vegetarian burgers and pizzas are washed down with great relish, with ales
and aerated drinks served complimentary at many of these fast food restaurants. Though
accompaniments like coleslaw, baked potatoes and mushy peas satisfy the established and
widely accepted compulsion for vegetable-intake, the fried foods are becoming addictive,
depriving the modern child of a balanced diet. There is no dearth with regards to the variety
available at these outlets. Most clientele indulge in the semi-dry and dry meals, to avoid
interruption while working or to fulfill a family commitment that otherwise require a
considerable amount of time to be spent in the kitchen.
This fast food industry now thrives on international appeal promoted by niche chains. The
development of healthier alternatives to the conventional servings at fast food restaurants has
resulted in mass promotion of portable foods that can be put together by the consumers
themselves. At many outlets, the customers can see the food being prepared, thus confirming to
8
advertisements that flaunt hygienic standards. Standardized menus, signage and a unique
ambiance are flaunted at take-away services and sit-ins in the NCBD. The concept of eat-on-the-
go not only eliminates the need for traditional cutlery, but also enables customers to indulge in
foods that are characteristic of certain cultural or ethnic traditions. The common menus include
pitas, fried chicken, nuggets and tacos, served along with complimentary salads and breads. The
fast food restaurants operate out of convenience stores, elaborate restaurants and independent
vendors, who have popularized chant sales-pitches, standardized cooking, and production
methods, and easy availability of low-cost delicacies. The fast food restaurants in the NCBD
have been categorized by the City Council of Nairobi as small, medium or large based on the
area size they occupy.
1.1.5 Nairobi Central Business District
The Nairobi Central Business District is defined by the Nairobi Central Business District
Association (NCBDA) which is a registered society under the Societies Act (Cap 108) and was
formed in May 1997 as a rectangular shape, around the Uhuru Highway, Haille Selassie Avenue,
Moi Avenue and University Way. It includes many of Nairobi's important buildings, including
the City Hall and Parliament Building. The city square is also located within the perimeter.
NCBDA’s mission is to make Nairobi the choice of Africa-Clean, secure, and vibrant-Home for
all. This is supported by their clarion call, “Improvement through Action”. By targeting urban
regeneration, NCBDA is simply investing in the future. Through partnerships, NCBDA hopes to
see significant, visible redevelopment of downtown Nairobi. This will present increasingly more
attractive opportunities for investment. To meet this goal, NCBDA’s objectives are: to eliminate
obstacles to business growth through trouble-shooting and strategic planning of key issues facing
9
the business community i.e. security, traffic management, infrastructure development, informal
traders, street people etc. to analyze trends and key economic indicators critical to the Central
Business District and its environs as a means to maintaining a competitive and comparative
business environment to foster a positive image for Nairobi and to be facilitator and support,
along with other community partners, in driving investment and development and making
Nairobi the regional hub.
1.2 Statement of the Problem
An organization’s strategy must be appropriate for its resources, environment circumstances, and
core objectives. The process involves matching the company’s strategic advantages to the
business environment the organization faces. One objective of an overall corporate strategy is to
put the organization into a position to carry out its mission effectively and efficiently,
Mosskanter (1999). A good corporate strategy should integrate an organization’s goals, policies,
and action sequences (tactics) into a cohesive whole, and must be based on business realities.
Strategy must connect with vision, purpose and likely future trends.
There are many local studies that have been done in Kenya regarding strategic responses to
environment challenges. Some of them include; Kombo (1997) did strategic responses by firms
facing changed environmental conditions in motor vehicle franchise holders and found out that
they made substantial adjustment in their variables in order to survive in a competitive
environment. Sheik (2000) did strategic responses by Kenyan insurance companies following
liberalization and established that firms in Insurance industry in Kenya made moderate
adjustment in their strategic variables in order to cope with increased competition; Kandie (2001)
did strategic responses by Telkom Kenya Ltd in a competitive environment and found out that
10
although Telkom Kenya has responded to its environment, financial constraints and lack of
managerial empowerment considerably limited the organization’s capacity to respond.
Kiptugen (2003) researched on strategic responses by Kenya Commercial Bank to a changing
competitive environment and established that Kenya Commercial Bank responded to its
changing competitive environment through restructuring, marketing, embracing informationV
technology and culture change; Atheru (2007) worked on strategic responses by meteorological
department to the needs of their customers and found out that Kenya Meteorological Department
did not have adequate capacity to respond to the needs of their customers. None of the studies
had covered large fast food chains. Most of the studies also focused on firm’s competitive
environment. No two organizations are perfectly similar and thus whatever works for one
company may not work for the other. This is because the managerial processes at large fast food
restaurants are different from those of industries covered in previous studies due to the difference
in environmental and organizational factors. Thus a gap of knowledge was left in the area of
strategic responses to competition among large fast food restaurants in Nairobi Central Business
District environment.
Organizations have to be able to respond effectively to challenges and opportunities as they
arise. Waverman (2001), the customer has increasing expectations of service standards and
availability. In response, organizations are working towards an outward-focused view of the way
services should be provided-a fundamental shift from the traditional focus on internal concerns.
At the same time, major opportunities for improvement may arise from developments such as
new information and communications technologies, and the availability of additional financial
resources. In many cases the response to the problem or opportunity will require the continuous
11
i O v' ' V NiA!ROB»
riA&ETE LIBRARY
attention of senior management .Thus the study seeks to answer the following question: What are
the strategic responses to competition among large fast food restaurants in Nairobi Central
Business District?
1.3 Study Objectives
The objectives of the study are to:
i) Identify the nature of competition faced by large fast food restaurants at Nairobi Central
Business District.
ii) Determine the strategic responses adopted by large fast food restaurants at Nairobi Central
Business District.
1.4 Value of the study
The study has shown that competition is and shall continue impacting on the performance of
small outlets dealing with fast food products. As such, for a firm to survive in such an
environment it should be able to identify its target market. The research observed that there are
different types of clientele visiting these fast food restaurants and when an outlet identifies its
clientele and tailors its products and service to the same clients, they manage to survive the stiff
competition. In addition, price differentiation during off- peak times can boast the sales of such
outlets. To these end what an outlet needs to do is identify a specific clientele to serve and strive
to meet their unique type of requirement. The research also noted the importance of a firm
anticipating competition in its area of operation, because with such a move, it will provide it with
ammunition to counter any challenge that arises and should initiate strategies that will retain the
existing customers and absorb new ones.
12
CHAPTER TWO: LITERATURE REVIEW
2.1 Introduction
This chapter summarizes the information from other researchers who have carried out their
research in the same field of study. The specific areas covered here are theoretical review,
empirical review. Porter's generic business strategies, competitive forces that shape strategy and
the environment. The scope of this study will be limited to identifying the strategic responses to
competition among large fast food restaurants operating in the NCBD.
2.2 Theories and concepts of strategic responses
Theories of strategic response demonstrate that strategies create a competitive edge for a firm.
While this strategic response might be necessary for optimal strategic use, they are not sufficient
conditions. Elliott, Huffman and Makar (2003), argue that, given these strategies, a firm's
ultimate decision to use a strategy also depends on the level of its competitors. In addition, a
firm's choice to use a certain strategy depends on the costs of strategy formulation and
implementation.
12.1 Strategic response theories
According to Whittington (2002), for classicists profitability is the highest goal of business and
rational planning as the means to attain it. The strategic aim of a business is to earn a return on
capital, and if in any particular case the return in the long run is not satisfactory, the deficiency
should be corrected or the activity abandoned. This theory requires that managers be ready and
capable of adopting profit-maximizing strategies through rational long-term planning.
13
According to the evolutionary theory, its approaches do not rely on top management’s skill to
plan and act rationally. Instead of depending on managers, they believe that markets will
determine profit maximization and not the managers. Whatever methods the managers will
adopt, the best performance will be the ones that survive. Rational methods are not the basis for
this approach because it is ‘evolution that is nature’s cost-benefit analysis’ (Einhorn and Hogarth
1988). Competition is not overcome by detached calculation such as in classical perspective but
by constant struggle for survival in the jungle. The biological principle of natural selection is at
the core of evolutionary theory wherein the most apt strategies often translate in the best
performance allowing them to survive and progress. The weaker performers are driven out of the
market.
Processual approaches does not subscribe to rational strategy-making forwarded by Classical
approach. However they do not either agree with the evolutionary perspective of leaving the
profit-maximizing outcomes to the market. According to McGrea (2005), organizations and
markets are wrought with confusion and mess. The best Processual method is not to strive for the
ideal but to work with what the reality offers. This theory believes that rational economic man is
not possible because we cannot overlook all factors at the same time. Human nature is simply
flawed. Micro-political view implies that firms are not united towards a single goal such as
profit. Instead it is made up of a number of individuals with different interests and brings them to
the organization. The members of the organization bargain between themselves to arrive at a set
of goals that is acceptable to them all. The main strategy for this approach is to simplify complex
processes.
14
This systematic theory believes that the organization is capable of planning and acting
effectively. According to Cox and Dale (2002), economic activity cannot be separated from
social relations such as family, state or religion. These social factors influence the means and
ends of a systemic approach and define what the suitable behavior is for their members. In this
approach, the organization is not just made up of individuals but of social groups with interests.
The variables that Systemic contend with are class and professions, nations and states, families
and gender. The strategy then depends on the social environment of the firm.
2.3 Porter’s generic business strategies
Strategy is an essential part of any effective business plan. By using an effective competitive
strategy, an organization finds its industry niche and learns about its customers (Porter, 1980).
Porter (1985) asserts there are basic businesses strategies differentiation, cost leadership, and
focus and a company performs best by choosing one strategy on which to concentrate. However,
many researchers feel a combination of these strategies may offer a company the best chance to
achieve a competitive advantage (Hlavacka el al., 2001). Whatever strategy a business chooses,
it must fit with the company and its goals and objectives to gain a competitive advantage (Ross,
1999).
According to Suutari, (1999), Porter purports companies must be competitive to become an
industry leader, to be successful both nationally and abroad, and these strategies for gaining
competitive advantage apply to all industries in most nations. While various types of
organizational strategies have been identified over the years, Porter's generic strategies remain
the most commonly supported and identified in key strategic management textbooks and in the
literature (David, 2000). Porter's (1980) generic strategies can yield competitive advantage and
also ensures long-term profitability, the firm must make a choice between one of the generic
strategies rather than end up being “stuck in the middle”.
Differentiation is one of Porter's key business strategies. When using this strategy, a company
focuses its efforts on providing a unique product or service (Hlavacka et al., 2001). Since, the
product or service is unique; this strategy provides high customer loyalty (Porter, 1985). Product
differentiation fulfills a customer need and involves tailoring the product or service to the
customer. This allows organizations to charge a premium price to capture market share.
The differentiation strategy is effectively implemented when the business provides unique or
superior value to the customer through product quality, features, or after-sale support. Firms
following a differentiation strategy can charge a higher price for their products based on the
product characteristics, the delivery system, the quality of service, or the distribution channels.
The quality may be real or perceived based on fashion, brand name, or image. The differentiation
strategy appeals to a sophisticated or knowledgeable consumer interested in a unique or quality
product and willing to pay a higher price.
According to McCracken, (2002) the key step in devising a differentiation strategy is to
determine what makes a company different from a competitor's. Factors including market sector
quality of work, the size of the firm, the image, graphical reach, involvement in client
organizations, product, delivery system, and the marketing approach have been suggested to
differentiate a firm (McCracken, 2002). To be effective, the message of differentiation must
reach the clients, as the customer's perceptions of the company are important (Berthoff, 2002)
suggest bending the customer's will to match the company’s mission through differentiation.
16
When using differentiation, firms must be prepared to add a premium to the cost (Hyatt, 2001).
This is not to suggest costs and prices are not considered; only it is not the main focus (Hlavacka
et al., 2001). However, since customers perceive the product or service as unique, they are loyal
to the company and willing to pay the higher price for its products.
Some key concepts for establishing differentiation include: speaking about the product to select
panels, writing on key topics affecting the company in the association's magazine or newsletter,
becoming involved in the community, being creative when composing the company's portfolio,
offering something the competitor does not or cannot offer, adding flair and drama to the store
layout, providing e-commerce, making access to company information and products both quick
and easy, using company size as an advantage, training employees with in-depth product and
service knowledge, offering improved or innovative products, emphasizing the company's state-
of-the-art technology, quality service, and unique products/services, using photos and renderings
in brochures and selecting products and services for which there is a strong local need (Darrow et
al, 2001).
Variants on the Differentiation Strategy
The shareholder value model holds that the timing of the use of specialized knowledge can
create a differentiation advantage as long as the knowledge remains unique. This model suggests
that customers buy products or services from an organization to have access to its unique
knowledge. The advantage is static, rather than dynamic, because the purchase is a one-time
event.
17
The unlimited resources model utilizes a large base of resources that allows an organization to
outclass competitors by practicing a differentiation strategy. An organization with greater
resources can manage risk and sustain losses more easily than one with fewer resources. This
deep-pocket strategy provides a short-term advantage only. If a firm lacks the capacity for
continual innovation, it will not sustain its competitive position over time.
The cost leadership strategy focuses on gaining competitive advantage by having the lowest cost
in the industry. In order to achieve a low-cost advantage, an organization must have a low-cost
leadership strategy, low-cost manufacturing, and a workforce committed to the low-cost strategy
(Malburg, 2000). The organization must be willing to discontinue any activities in which they do
not have a cost advantage and should consider outsourcing activities to other organizations with
a cost advantage (Malburg, 2000). For an effective cost leadership strategy, a firm must have a
large market share. There are many areas to achieve cost leadership such as mass production,
mass distribution, economies of scale, technology, product design, input cost, capacity utilization
of resources, and access to raw materials (Malburg, 2000). Porter (1985) purports only one firm
in an industry can be the cost leader and if this is the only difference between a firm and
competitors, the best strategic choice is the low cost leadership role.
Lower costs and cost advantages result from process innovations, learning curve benefits, and
economics of scale, product designs reducing manufacturing time and costs, and reengineering
activities. A low-cost or cost leadership strategy is effectively implemented when the business
designs, produces, and markets a comparable product more efficiently than its competitors. The
firm may have access to raw materials or superior proprietary technology which helps to lower
costs.
18
Firms do not have to sacrifice revenue to be the cost leader since high revenue is achieved
through obtaining a large market share (Bauer and Colgan, 2001). Lower prices lead to higher
demand and, therefore, to a larger market share. As a low cost leader, an organization can present
barriers against new market entrants who would need large amounts of capital to enter the
market. The leader then is somewhat insulated from industry wide price reductions (Porter,
1980). The cost leadership strategy does have disadvantages. It creates little customer loyalty and
if a firm lowers prices too much, it may lose revenues.
In the focus strategy, a firm targets a specific segment of the market (Davidson, 2001). The firm
can choose to focus on a select customer group, product range, geographical area, or service line
(McCracken, 2002). Focus also is based on adopting a narrow competitive scope within an
industry. Focus aims at growing market share through operating in a niche market or in markets
either not attractive to, or overlooked by, larger competitors. These niches arise from a number
of factors including geography, buyer characteristics, and product specifications or requirements.
A successful focus strategy depends upon an industry segment large enough to have good growth
potential but not of key importance to other major competitors. Market penetration or market
development can be an important focus strategy. Midsize and large firms use focus-based
strategies but only in conjunction with differentiation or cost leadership generic strategies. But,
focus strategies are most effective when consumers have distinct preferences and when the niche
has not been pursued by rival firms David, (2000).
2.3.1 Criticisms of generic strategies
According to Porter (1980), a firm’s failure to make a choice between cost leadership and
differentiation essentially implies that the company is stuck in the middle. There is no
19
competitive advantage for a company that is stuck in the middle and the result is often poor
financial performance (Porter, 1980). Kay (1993) and Miller (1992) disagreed with this aspect of
the analysis as they cited examples of companies which have become successful after adopting
more than one generic strategy. Both Toyota and Benetton companies used the generic strategies
of differentiation and low cost simultaneously, which led to the success of these companies.
The generic strategies were regarded as fundamental to strategy and the ideas suggested by
Porter (1980) were extensively. It is very difficult for most companies to completely ignore cost,
no matter how different their product offering is. Similarly, most companies will not admit that
their product is essentially the same as that of competitors (Macmillan et al, 2000). It is
important for the analysts therefore to bear in mind that Porter’s (1980) generic strategies should
be considered as a part of a broader strategic analysis. The generic strategies only provide a good
starting point for exploring the concepts of cost leadership and differentiation. Perhaps a major
limitation of the generic strategies is that they may not provide relevant strategic routes in the
case of fast growing markets (Lynch, 2003). It is clear that the competitive environment is
continually changing and such changes have led to increased competition forcing many firms to
respond by adopting strategies to ensure they achieve sustainable competitive advantage.
Sustainable competitive advantage leads to long term success of firms.
2.4 Competitive forces that shape strategy
Understanding the competitive forces, and their underlying causes, reveals the roots of an
industry’s current profitability while providing a framework for anticipating and influencing
competition (and profitability) over time. A healthy structure should be as much a competitive
concern to strategists as their company’s own position. Understanding industry structure is also
20
essential to effective strategic positioning. The configuration of the five forces differs by
industry. The strongest competitive force or forces determine the profitability of an industry and
become the most important to strategy formulation. Industry structure grows out of a set of
economic and technical characteristics that determine the strength of each competitive force
(Porter, 1980).
New entrants to an industry bring new capacity and a desire to gain market share that puts
pressure on prices, costs, and the rate of investment necessary to compete. Particularly when new
entrants are diversifying from other markets, they can leverage existing capabilities and cash
flows to shake up competition. The threat of entry, therefore, puts a cap on the profit potential of
an industry. When the threat is high, incumbents must hold down their prices or boost investment
to deter new competitors. Entry barriers are advantages that incumbents have relative to new
entrants. These include supply-side economies of scale, demand-side benefits of scale, customer
switching costs, capital requirements, incumbency advantages independent of size, unequal
access to distribution channels and restrictive government policy.
Powerful suppliers capture more of the value for themselves by charging higher prices, limiting
quality or services, or shifting costs to industry participants. Powerful suppliers, including
suppliers of labor, can squeeze profitability out of an industry that is unable to pass on cost
increases in its own prices. Powerful customers can capture more value by forcing down prices,
demanding better quality or more service (thereby driving up costs), and generally playing
industry participants off against one another, all at the expense of industry profitability. Buyers
are powerful if they have negotiating leverage relative to industry participants, especially if they
are price sensitive, using their clout primarily to pressure price reductions (Porter, 1980).21
2.5 The Environment
The environment can be classified into internal and external environment. The external
environment refers to those factors outside the organization’s influence but which affect the
organization’s operations. The external environment presents opportunities which the firm can
exploit and poses threats which can hinder the organization’s activities. The internal refers to
factors within the organization which the organization exercises a great deal of control over and
which affect the organization’s operations. This presents the organization’s strengths and
weaknesses. The internal environment therefore constitutes an organization’s internal capability
which is essential in addressing the external environment. Pearce and Robinson (1997) argue that
in order for organizations to achieve their goals and objectives it is necessary for them to adjust
to their environment.
According to Johnson, Scholes and Whittington (2005), an organization exists in the context of a
complex political, economic, social, technological, environmental and legal world. The
environment changes and affects different organizations differently. Burnes (2004) further
argued that there is considerable support for the view that the pace change is accelerating as
never before and organizations have to chart their way through an increasingly complex
environment. Organizations have to cope with pressures of globalization, rapid changes in
technology, rise of e-commerce, situations where customers and suppliers can be both
competitors and allies and a change in emphasis from quantity to quality and from product to
services.
22
2.6 Empirical evidence and knowledge gap
Decisions on competitive factors require a careful evaluation of resources and environmental
variables. Resources include all assets, capabilities, organizational processes, attributes,
information, and knowledge that enable a firm to define and implement strategies to compete,
Porter (1981). Barney (1991) classified these resources into three major categories: physical
capital resources, human capital resources, and organizational capital resources. Because of
resources limitations, Skinner (1974) suggested that it would be difficult to focus on more than
one competitive factor at a time in any particular firm or manufacturing facility. Limiting a firm
to a single competitive factor is similar to Porter’s (1980) assertion that a firm can only choose
either cost or differentiation as a basis for competition. The implication of Porter (1980) is that
any firm attempting to achieve both cost and differentiation as its competitive factors is almost
guaranteed low profitability, Kotha and Orne (1989). However, this proposition has been
challenged by many world-class manufacturing firms as they simultaneously maintain many
competitive factors.
The perception of competitive factors can vary from one level of management to another.
Swamidass (1986) found that while chief executives emphasized quality and technology,
manufacturing managers focused on reducing cost and keeping delivery promises. A mismatch
of competitive factors between chief executives and manufacturing managers in the same firm
could be a potential problem in the effective use of the manufacturing function. Porter’s (1980)
strategic positioning model builds upon the assumption that five forces determine industry
attractiveness, i.e., the potential to earn rents. Three forces represent the “horizontal” competitive
relationships, namely the rivalry among competing firms, the threat of new entrants and the
threat of substitutes. Two other forces reflect the firm’s “vertical” linkages with external actors,23
namely buyer and supplier power. An interesting characteristics of the five forces model is that
industry structure, at least when used for strategy prescription at the firm level, is viewed as
partly endogenous. This means that there is a reciprocal relationship between industry structure
and firm behavior. Entry barriers do not just result from a given industry structure but may be
induced or challenged by firms. In this context, the five forces could be seen as the
“opportunities-threat” component in a conventional SWOT-analysis (strengths, weaknesses,
opportunities and threats).
In contrast, the resource-based view focuses on the “strengths-weaknesses” component of SWOT
analysis. It does this by identifying valuable (as perceived by customers), non-substitutable, non-
imitable, firm-level competences as the basis of superior performance. Industry capabilities
include trust relations, and specific ways of diffusing and sharing technological knowledge, Foss
(1997). An integrative perspective has recently been introduced, Teece and Pisano (1998). In
this, dynamic capabilities include special company strengths to cope with the shifting character
of the environment. More specifically, this approach focuses on the key role of strategic
management in appropriately adapting, integrating and re-configuring company strengths
towards changing environments, Teece and Pisano, (1998). The study therefore tries to find out
the competitive strategies being used by the large fast food restaurants in the NCBD to beat
competition. This results from the gap which existed on whether the fast food restaurants apply
different strategies at the same time or only one strategy at a time to make profits.
24
CHAPTER THREE: RESEARCH METHODOLOGY
3.1 Introduction
This chapter describes the proposed research design, data collection and the techniques for data
analysis that was used.
3.2 Research design
The research design was a cross-sectional survey of the large fast food restaurants operating in
the NCBD. This research design allowed for contact with otherwise inaccessible participants. It
has been observed that a survey is feasible when the population is small and variable. When all
items of the population are covered, no element of chance is left and highest accuracy is
obtained. Cooper and Emory (1985) contend that surveys are more efficient and economical than
observations.
3.3 Population of the Study
The population of the study consisted of all large fast food restaurants operating in the NCBD.
The restaurants have been categorized by the City Council of Nairobi as large restaurants based
on the area size which they occupy (Appendix III). The large fast foods restaurants were chosen
as they are strategically located in the main streets, with more than one outlet offering the same
kind of foods, invested large sums of money in the business, paid goodwill and thus should have
well defined strategic plans in order to counter competition and recover what they have invested.
25
3.4. Data Collection
The study used primary data; these were collected through self-administered questionnaires.
Structured questionnaire consisted of both open ended and closed ended questions designed to
elicit specific responses for qualitative and quantitative analysis respectively. A questionnaire is
a useful tool for collecting data from respondents because of the need to provide a means of
expressing their views more openly and clearly. Respondents were the directors of the chains or
the supervisors. The questionnaire was administered through “drop and pick later" method. The
respondents were expected to give an insight into some of the strategies they have put in place to
ensure that they have a competitive edge over its competitors. These respondents are involved in
formulation and implementation of organization’s strategies.
3.5 Data Analysis
The data was analyzed by the use of descriptive statistics to summarize and relate variables
which were attained from the administered questionnaires. The data was classified, tabulated and
summarized using descriptive measures, percentages and frequency distribution tables while
tables and graphs will be used for presentation of findings. However, before final analysis was
performed, data was cleaned to eliminate discrepancies and thereafter, classified on the basis of
similarity and then tabulated. This method of analysis is most desirable as it enabled the
researcher to have an insight of the most commonly used strategies by the fast food chains. In
accomplishing all analysis details with efficiency and effectiveness, the researcher utilized the
Statistical Package for Social Sciences (SPSS) software.
26
CHAPTER FOUR: DATA ANALYSIS AND INTERPRETATION OFRESULTS
4.1 Introduction
The research objective was to establish the strategic responses to competition among large fast
food restaurants in Nairobi Central Business District. This chapter presents the analysis and
findings with regard to the objective and discussion of the same. The findings are presented in
percentages and frequency distributions, mean and standard deviations.
4.1.1 Characteristics of the respondents
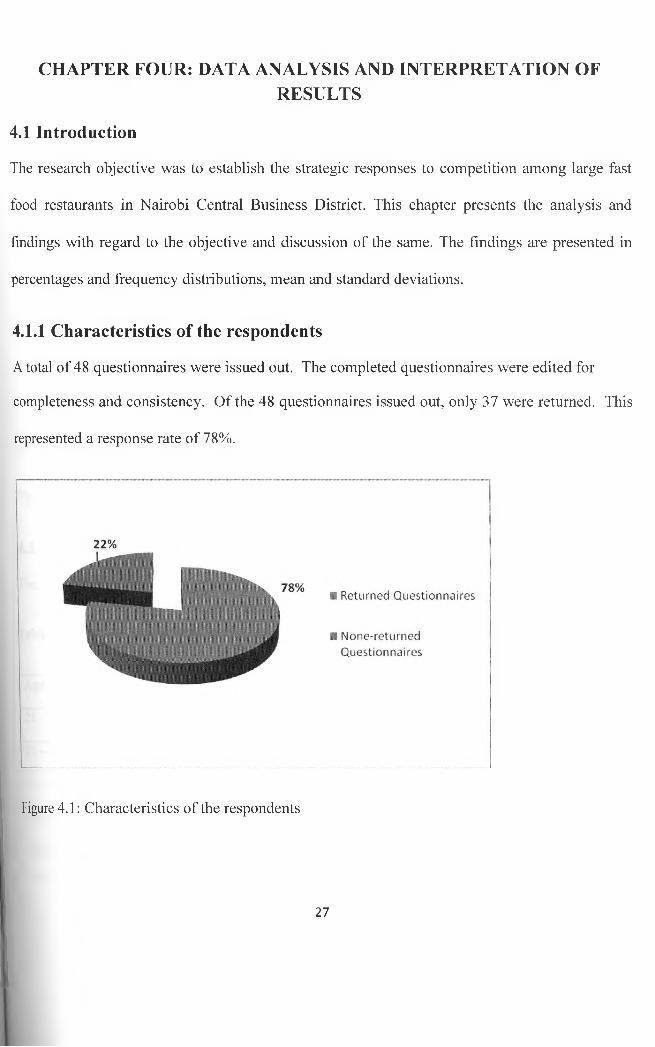
A total of 48 questionnaires were issued out. The completed questionnaires were edited for
completeness and consistency. Of the 48 questionnaires issued out, only 37 were returned. This
represented a response rate of 78%.
Figure 4.1: Characteristics of the respondents
27
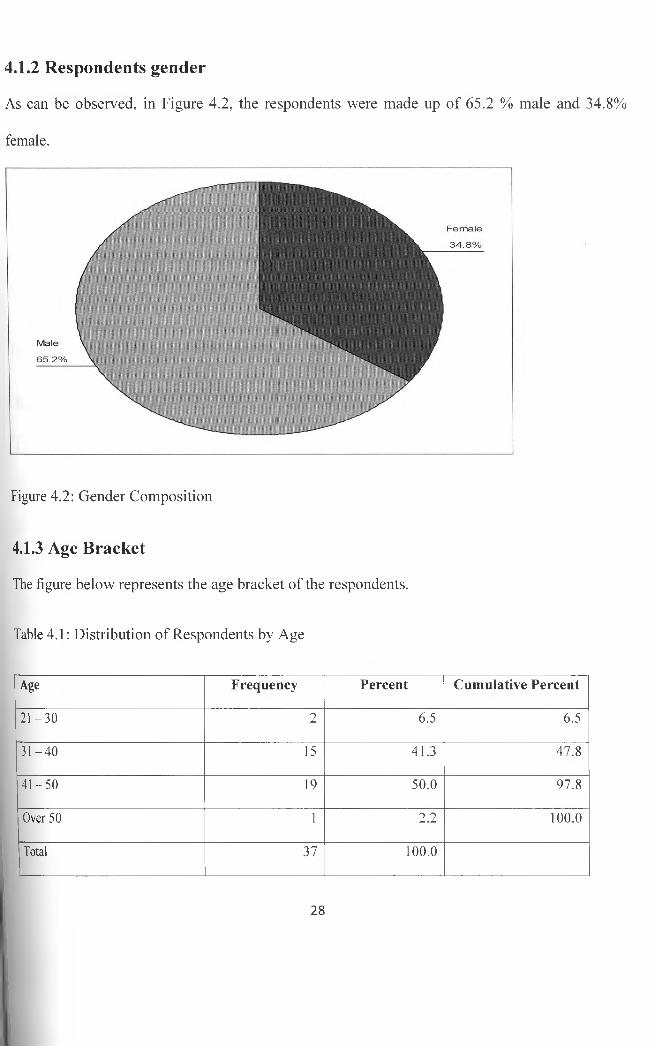
As can be observed, in Figure 4.2, the respondents were made up of 65.2 % male and 34.8%
female.
4.1.2 Respondents gender
Figure 4.2: Gender Composition
4.1.3 Age Bracket
The figure below represents the age bracket of the respondents.
Table 4.1: Distribution of Respondents by Age
Age Frequency Percent Cumulative Percent
21-30 2 6.5 6.5
31-40 15 41.3 47.8
41-50 19 50.0 97.8
Over 50 1 2.2 100.0
Total 37 100.0
28
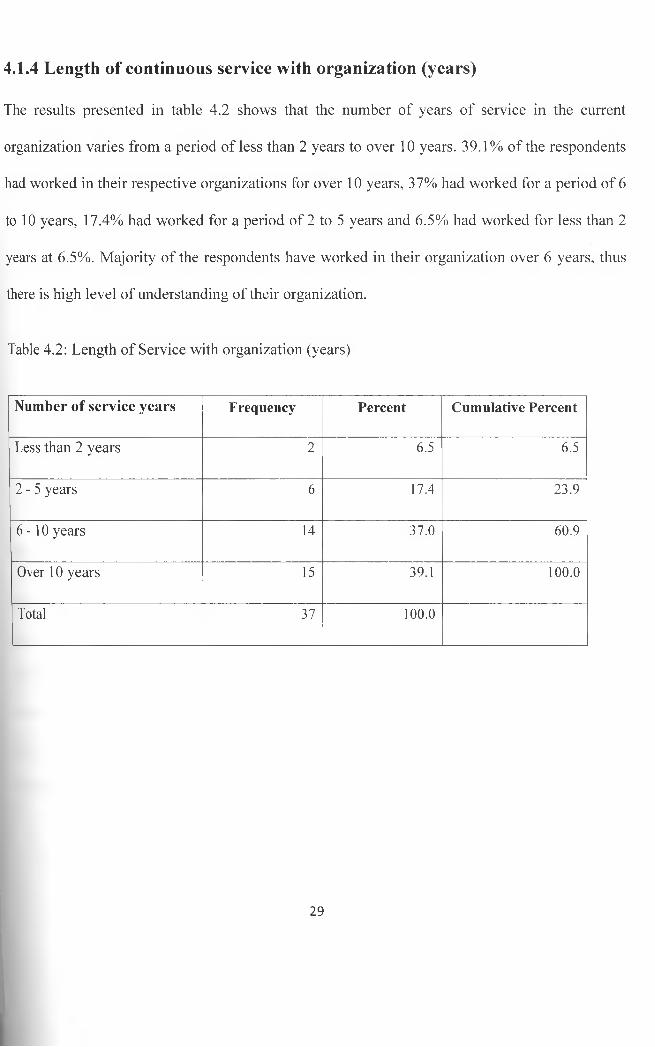
The results presented in table 4.2 shows that the number of years of service in the current
organization varies from a period of less than 2 years to over 10 years. 39.1% of the respondents
had worked in their respective organizations for over 10 years, 37% had worked for a period of 6
to 10 years, 17.4% had worked for a period of 2 to 5 years and 6.5% had worked for less than 2
years at 6.5%. Majority of the respondents have worked in their organization over 6 years, thus
there is high level of understanding of their organization.
Table 4.2: Length of Service with organization (years)
4.1.4 Length of continuous service with organization (years)
Number of service years Frequency Percent Cumulative Percent
Less than 2 years 2 6.5 6.5
2-5 years 6 17.4 23.9
6-10 years 14 37.0 60.9
Over 10 years 15 39.1 100.0
Total 37 100.0
29
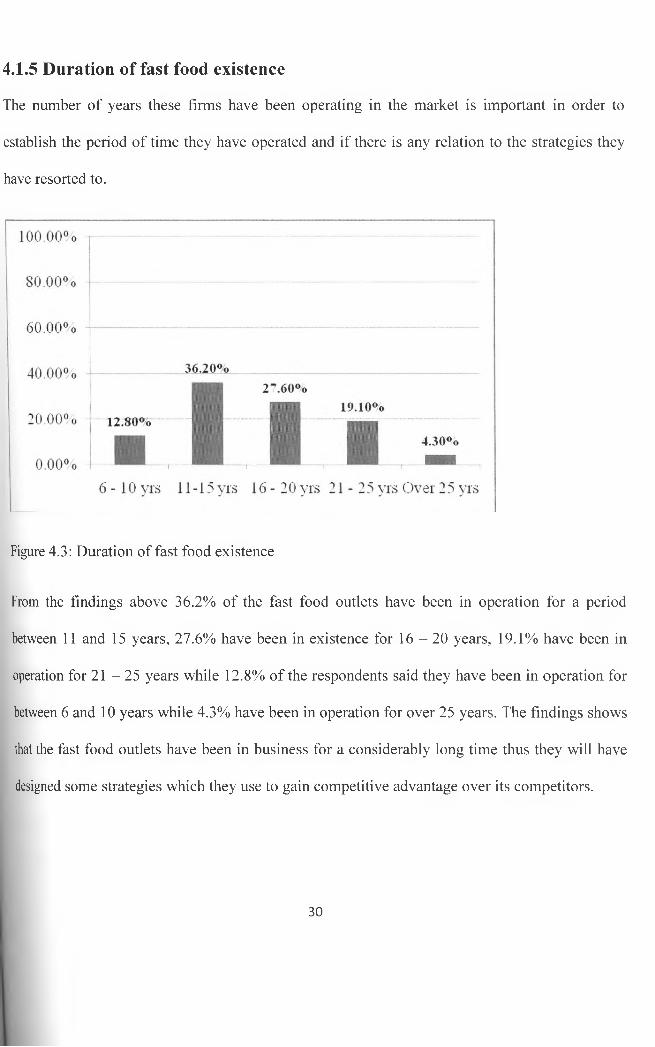
The number of years these firms have been operating in the market is important in order to
establish the period of time they have operated and if there is any relation to the strategies they
have resorted to.
4.1.5 Duration of fast food existence
Figure 4.3: Duration of fast food existence
From the findings above 36.2% of the fast food outlets have been in operation for a period
between 11 and 15 years, 27.6% have been in existence for 16 - 20 years, 19.1% have been in
operation for 21 - 25 years while 12.8% of the respondents said they have been in operation for
between 6 and 10 years while 4.3% have been in operation for over 25 years. The findings shows
that the fast food outlets have been in business for a considerably long time thus they will have
designed some strategies which they use to gain competitive advantage over its competitors.
30
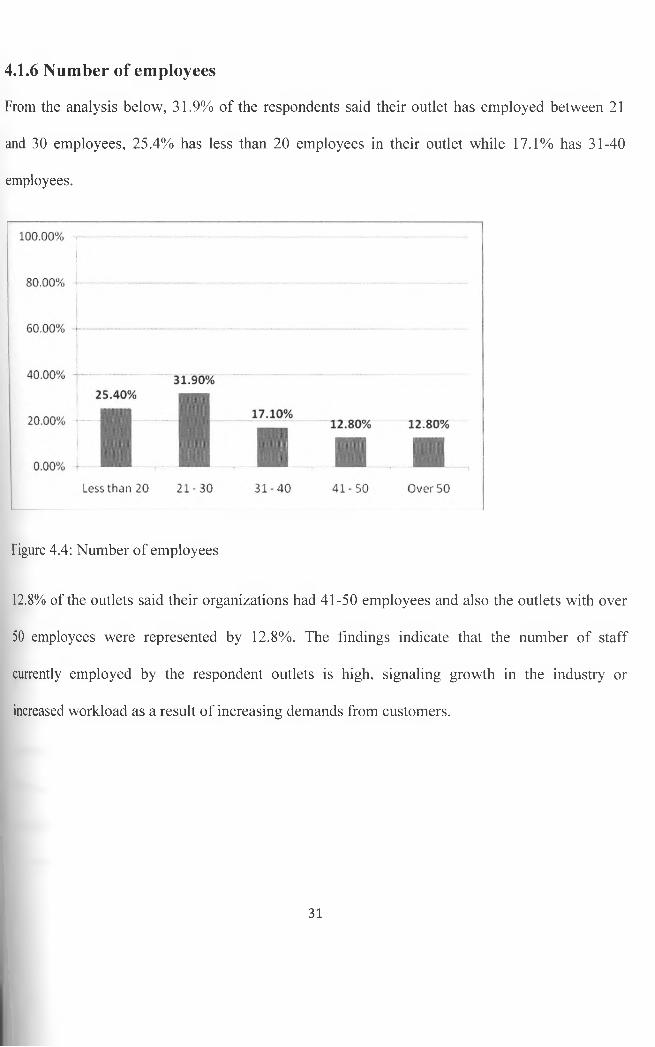
From the analysis below, 31.9% of the respondents said their outlet has employed between 21
and 30 employees, 25.4% has less than 20 employees in their outlet while 17.1% has 31-40
employees.
4.1.6 Number of employees
Figure 4.4: Number of employees
12.8% of the outlets said their organizations had 41-50 employees and also the outlets with over
50 employees were represented by 12.8%. The findings indicate that the number of staff
currently employed by the respondent outlets is high, signaling growth in the industry or
increased workload as a result of increasing demands from customers.
31
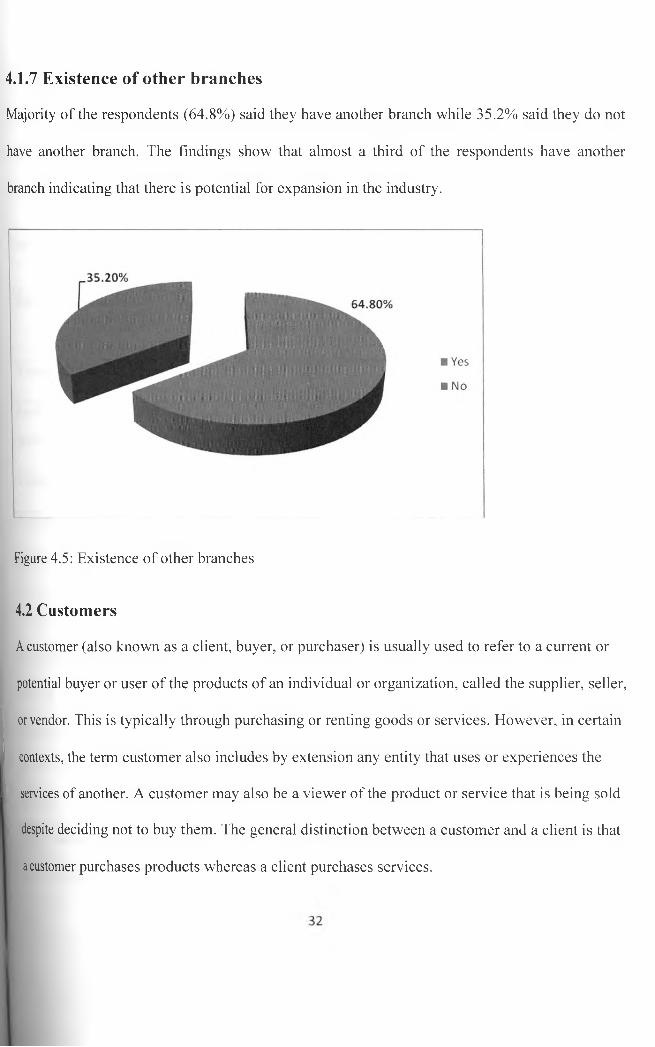
4.1.7 Existence of other branches
Majority of the respondents (64.8%) said they have another branch while 35.2% said they do not
have another branch. The findings show that almost a third of the respondents have another
branch indicating that there is potential for expansion in the industry.
Figure 4.5: Existence of other branches
4.2 Customers
A customer (also known as a client, buyer, or purchaser) is usually used to refer to a current or
potential buyer or user of the products of an individual or organization, called the supplier, seller,
or vendor. This is typically through purchasing or renting goods or services. However, in certain
contexts, the term customer also includes by extension any entity that uses or experiences the
services of another. A customer may also be a viewer of the product or service that is being sold
despite deciding not to buy them. The general distinction between a customer and a client is that
a customer purchases products whereas a client purchases services.
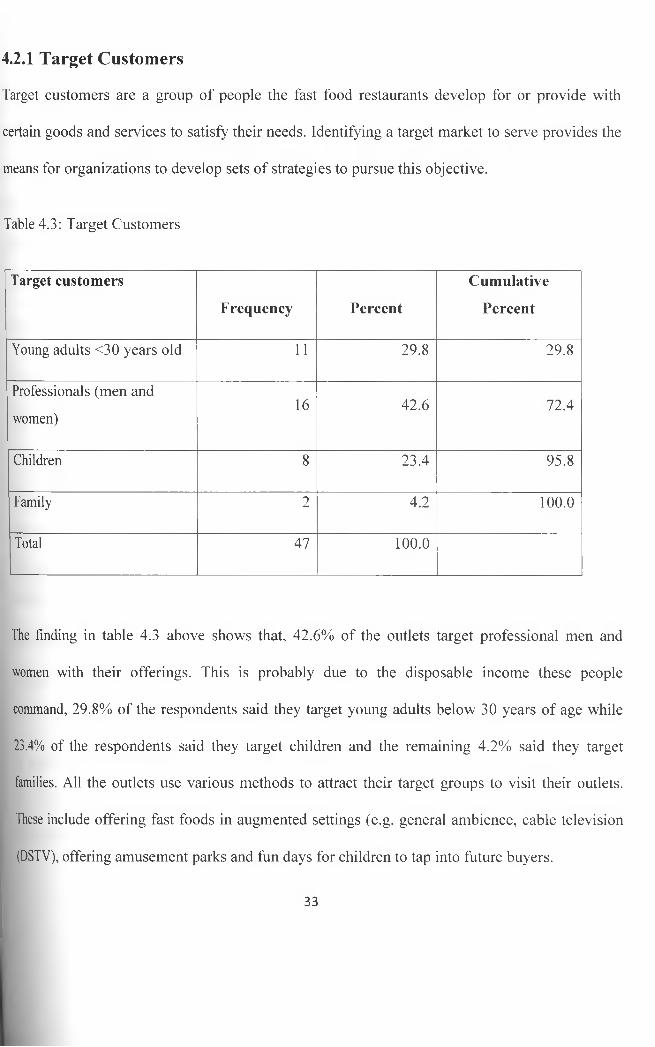
Target customers are a group of people the fast food restaurants develop for or provide with
certain goods and services to satisfy their needs. Identifying a target market to serve provides the
means for organizations to develop sets of strategies to pursue this objective.
Table 4.3: Target Customers
4.2.1 Target Customers
Target customers
Frequency Percent
Cumulative
Percent
Young adults <30 years old 11 29.8 29.8
Professionals (men and
women)16 42.6 72.4
Children 8 23.4 95.8
Family 2 4.2 100.0
Total 47 100.0
The finding in table 4.3 above shows that, 42.6% of the outlets target professional men and
women with their offerings. This is probably due to the disposable income these people
command, 29.8% of the respondents said they target young adults below 30 years of age while
23.4% of the respondents said they target children and the remaining 4.2% said they target
families. All the outlets use various methods to attract their target groups to visit their outlets.
These include offering fast foods in augmented settings (e.g. general ambience, cable television
(DSTV), offering amusement parks and fun days for children to tap into future buyers.
33
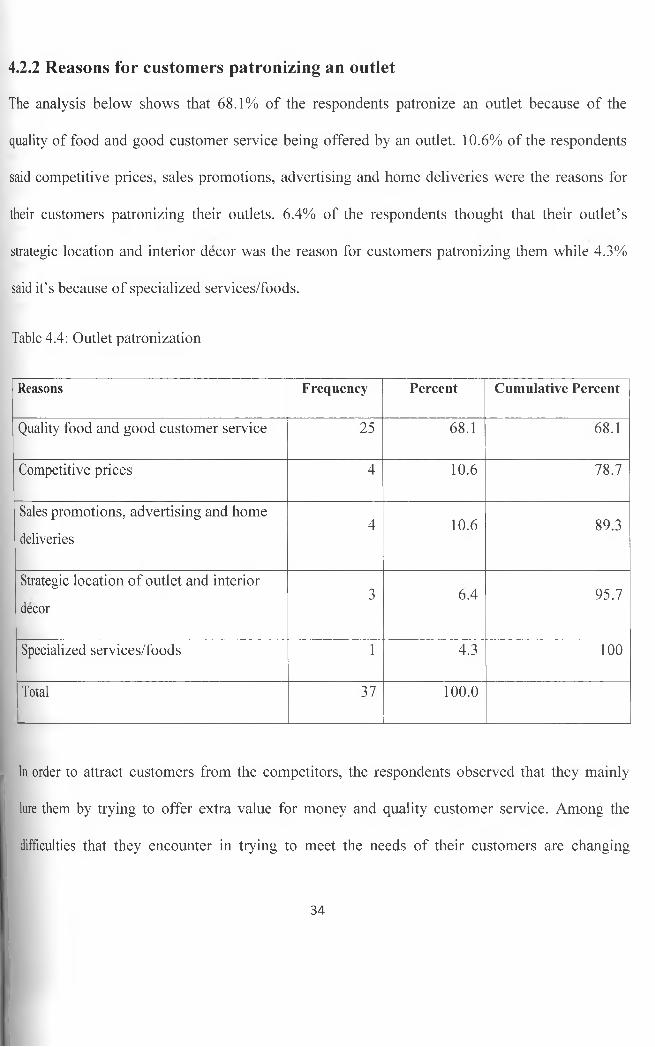
The analysis below shows that 68.1% of the respondents patronize an outlet because of the
quality of food and good customer service being offered by an outlet. 10.6% of the respondents
said competitive prices, sales promotions, advertising and home deliveries were the reasons for
their customers patronizing their outlets. 6.4% of the respondents thought that their outlet’s
strategic location and interior decor was the reason for customers patronizing them while 4.3%
said it’s because of specialized services/foods.
Table 4.4: Outlet patronization
4.2.2 Reasons for customers patronizing an outlet
Reasons Frequency Percent Cumulative Percent
Quality food and good customer service 25 68.1 68.1
Competitive prices 4 10.6 78.7
Sales promotions, advertising and home
deliveries4 10.6 89.3
Strategic location of outlet and interior
decor3 6.4 95.7
Specialized services/foods 1 4.3 100
Total 37 100.0
In order to attract customers from the competitors, the respondents observed that they mainly
lure them by trying to offer extra value for money and quality customer service. Among the
difficulties that they encounter in trying to meet the needs of their customers are changing
34
customer tastes and preferences, price wars from competitors, staff turnover and increasing
overhead costs.
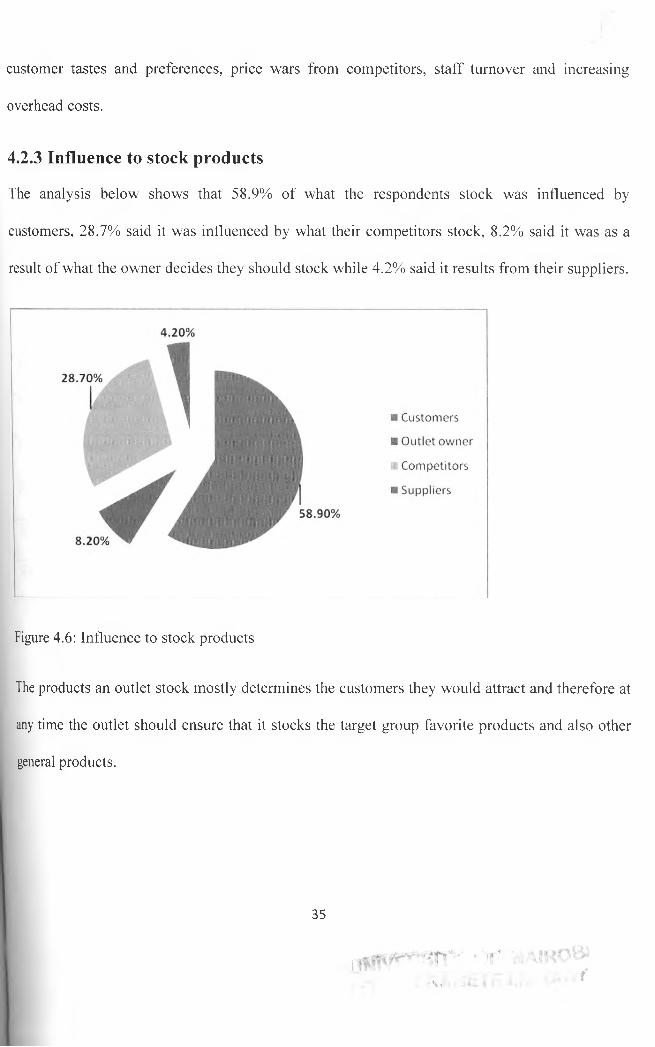
4.2.3 Influence to stock products
The analysis below shows that 58.9% of what the respondents stock was influenced by
customers, 28.7% said it was influenced by what their competitors stock, 8.2% said it was as a
result of what the owner decides they should stock while 4.2% said it results from their suppliers.
Figure 4.6: Influence to stock products
The products an outlet stock mostly determines the customers they would attract and therefore at
any time the outlet should ensure that it stocks the target group favorite products and also other
general products.
35
i Vi t
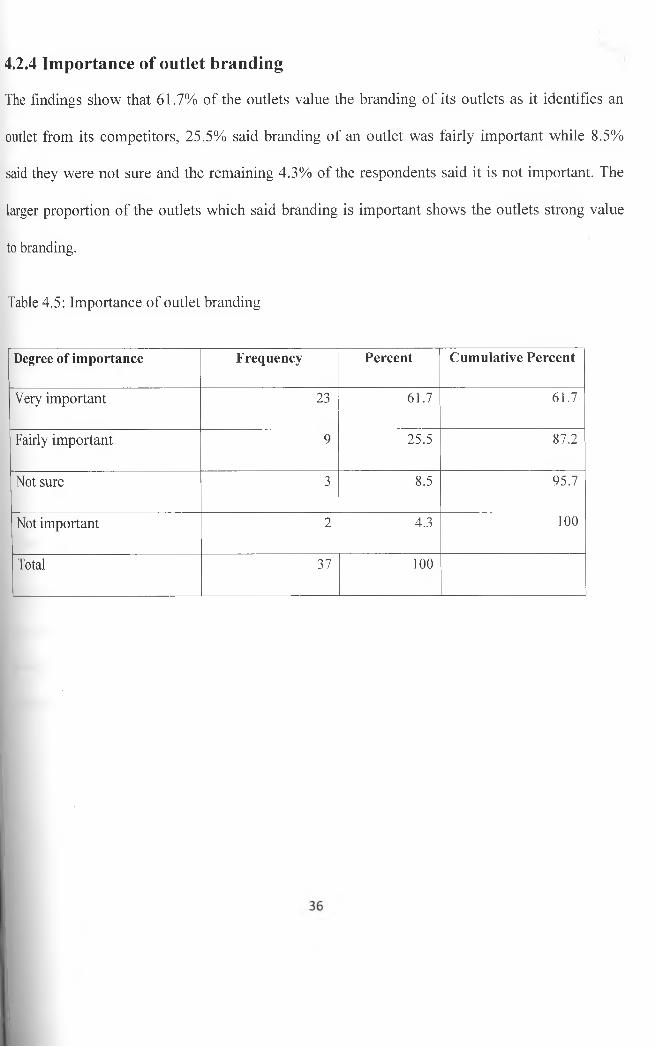
The findings show that 61.7% of the outlets value the branding of its outlets as it identifies an
outlet from its competitors, 25.5% said branding of an outlet was fairly important while 8.5%
said they were not sure and the remaining 4.3% of the respondents said it is not important. The
larger proportion of the outlets which said branding is important shows the outlets strong value
to branding.
Table 4.5: Importance of outlet branding
4.2.4 Importance of outlet branding
Degree of importance Frequency Percent Cumulative Percent
Very important 23 61.7 61.7
Fairly important 9 25.5 87.2
Not sure 3 8.5 95.7
Not important 2 4.3 100
Total 37 100
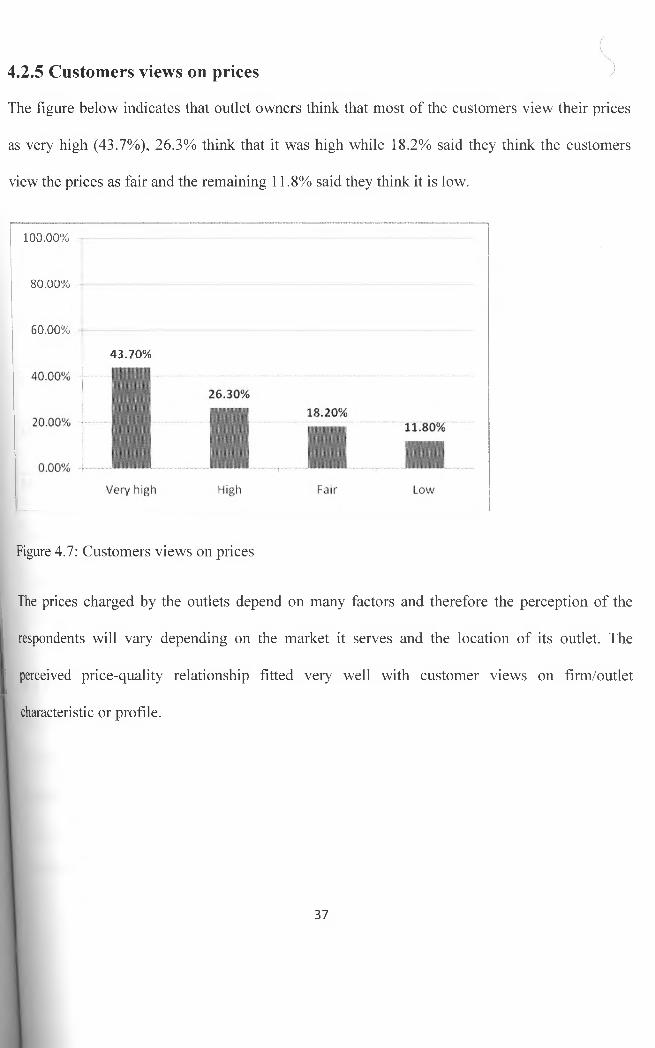
The figure below indicates that outlet owners think that most of the customers view their prices
as very high (43.7%), 26.3% think that it was high while 18.2% said they think the customers
view the prices as fair and the remaining 11.8% said they think it is low.
4.2.5 Customers views on prices
100.00%
80 .00%
60 .00%
43 .70%
Figure 4.7: Customers views on prices
The prices charged by the outlets depend on many factors and therefore the perception of the
respondents will vary depending on the market it serves and the location of its outlet. The
perceived price-quality relationship fitted very well with customer views on firm/outlet
characteristic or profile.
37
4.2.6 Market served
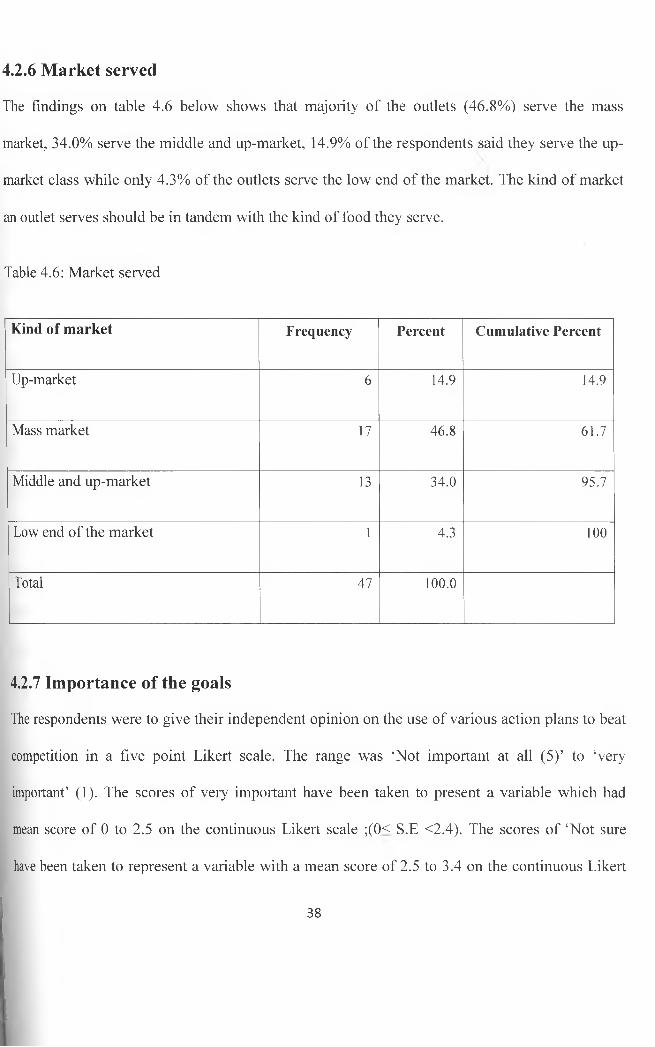
The findings on table 4.6 below shows that majority of the outlets (46.8%) serve the mass
market, 34.0% serve the middle and up-market, 14.9% of the respondents said they serve the up
market class while only 4.3% of the outlets serve the low end of the market. The kind of market
an outlet serves should be in tandem with the kind of food they serve.
Table 4.6: Market served
Kind of market Frequency Percent Cumulative Percent
Up-market 6 14.9 14.9
Mass market 17 46.8 61.7
Middle and up-market 13 34.0 95.7
Low end of the market 1 4.3 too
Total 47 100.0
4.2.7 Importance of the goals
The respondents were to give their independent opinion on the use of various action plans to beat
competition in a five point Likert scale. The range was ‘Not important at all (5)’ to ‘very
important’ (1). The scores of very important have been taken to present a variable which had
mean score of 0 to 2.5 on the continuous Likert scale ;(0< S.E <2.4). The scores of ‘Not sure
have been taken to represent a variable with a mean score of 2.5 to 3.4 on the continuous Likert
38
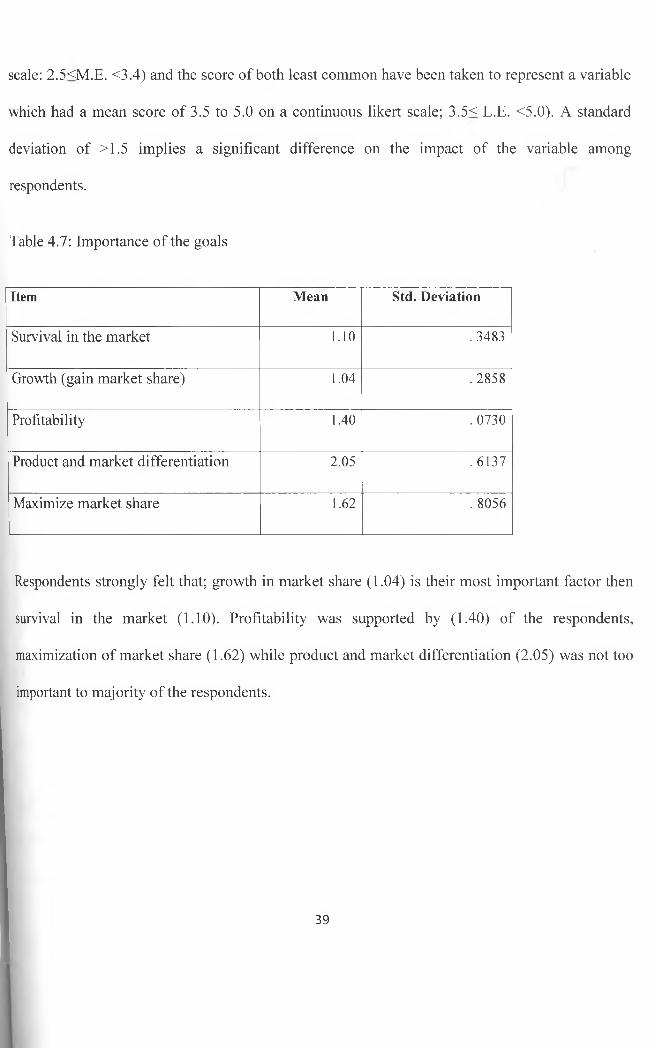
scale: 2.5<M.E. <3.4) and the score of both least common have been taken to represent a variable
which had a mean score of 3.5 to 5.0 on a continuous likert scale; 3.5< L.E. <5.0). A standard
deviation of >1.5 implies a significant difference on the impact of the variable among
respondents.
Table 4.7: Importance of the goals
Item Mean Std. Deviation
Survival in the market 1.10 . 3483
Growth (gain market share) 1.04 .2858
Profitability 1.40 . 0730
Product and market differentiation 2.05 . 6137
Maximize market share 1.62 . 8056
Respondents strongly felt that; growth in market share (1.04) is their most important factor then
survival in the market (1.10). Profitability was supported by (1.40) of the respondents,
maximization of market share (1.62) while product and market differentiation (2.05) was not too
important to majority of the respondents.
39
4.3 Strategic responses
Strategic responses are a set of decisions and actions that result into formulation and
implementation of plans designed to achieve a firm’s objectives.
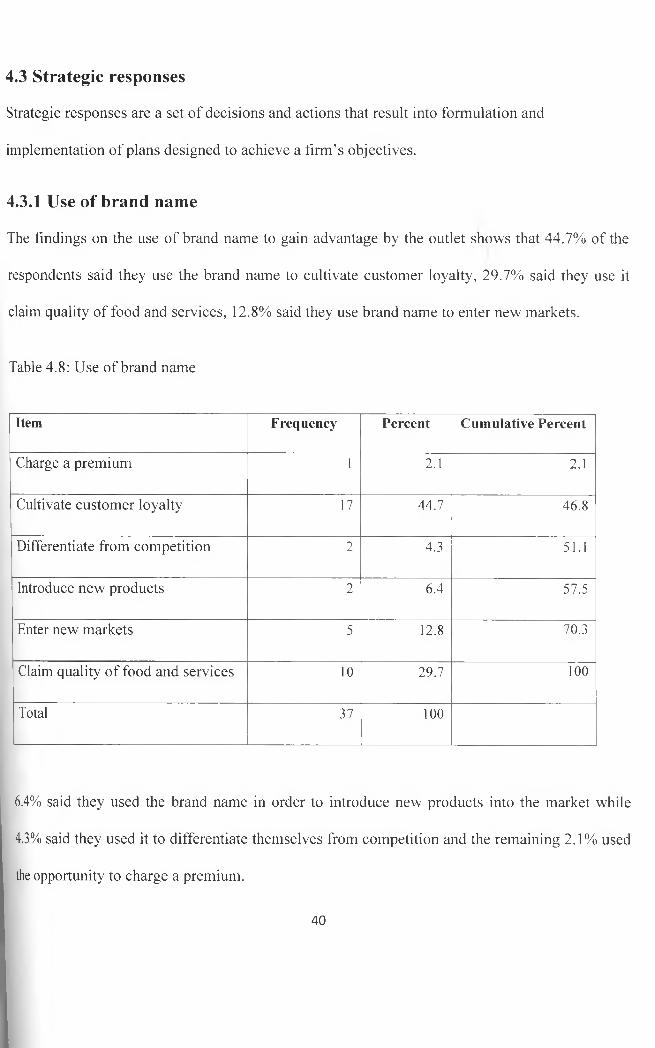
4.3.1 Use of brand name
The findings on the use of brand name to gain advantage by the outlet shows that 44.7% of the
respondents said they use the brand name to cultivate customer loyalty, 29.7% said they use it
claim quality of food and services, 12.8% said they use brand name to enter new markets.
Table 4.8: Use of brand name
Item Frequency Percent Cumulative Percent
Charge a premium 1 2.1 2.1
Cultivate customer loyalty 17 44.7 46.8
Differentiate from competition 2 4.3 51.1
Introduce new products 2 6.4 57.5
Enter new markets 5 12.8 70.3
Claim quality of food and services 10 29.7 100
Total 37 100
6.4% said they used the brand name in order to introduce new products into the market while
4.3% said they used it to differentiate themselves from competition and the remaining 2.1% used
the opportunity to charge a premium.
40
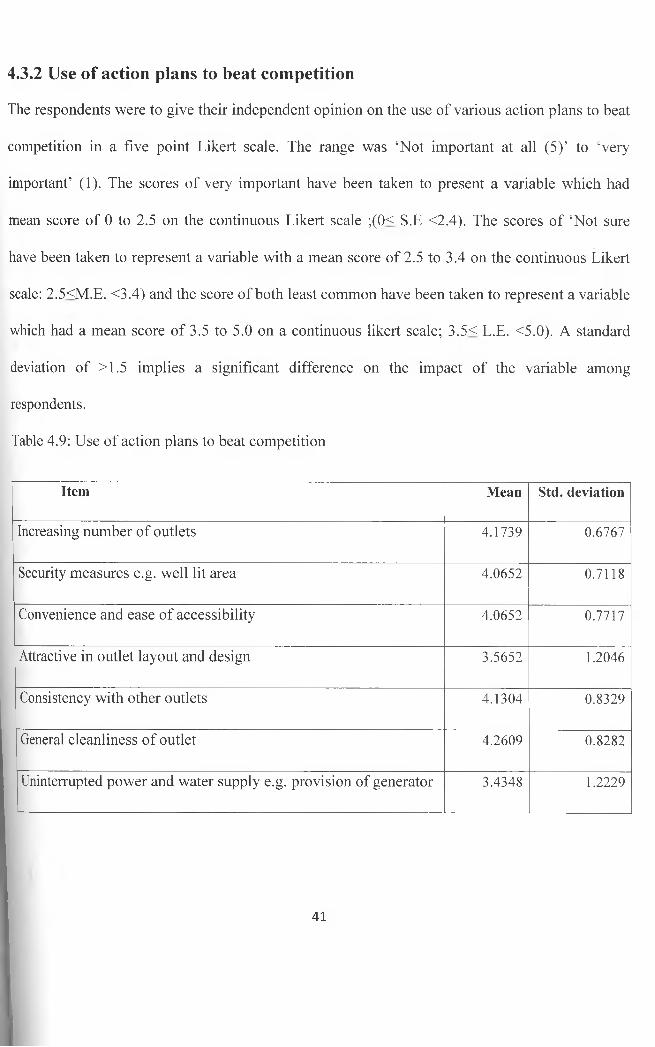
The respondents were to give their independent opinion on the use of various action plans to beat
competition in a five point Likert scale. The range was ‘Not important at all (5)’ to ‘very
important’ (1). The scores of very important have been taken to present a variable which had
mean score of 0 to 2.5 on the continuous Likert scale ;(0< S.E <2.4). The scores of ‘Not sure
have been taken to represent a variable with a mean score of 2.5 to 3.4 on the continuous Likert
scale: 2.5<M.E. <3.4) and the score of both least common have been taken to represent a variable
which had a mean score of 3.5 to 5.0 on a continuous likert scale; 3.5< L.E. <5.0). A standard
deviation of >1.5 implies a significant difference on the impact of the variable among
respondents.
Table 4.9: Use of action plans to beat competition
4.3.2 Use of action plans to beat competition
Item Mean Std. deviation
Increasing number of outlets 4.1739 0.6767
Security measures e.g. well lit area 4.0652 0.7118
Convenience and ease of accessibility 4.0652 0.7717
Attractive in outlet layout and design 3.5652 1.2046
Consistency with other outlets 4.1304 0.8329
General cleanliness of outlet 4.2609 0.8282
Uninterrupted power and water supply e.g. provision of generator 3.4348 1.2229
41
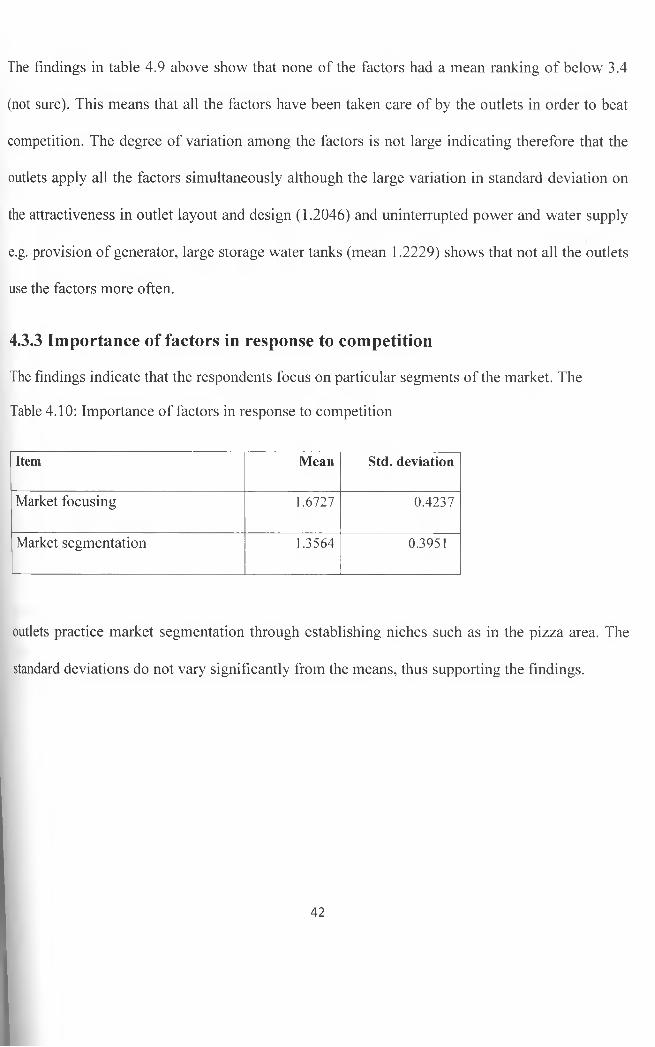
The findings in table 4.9 above show that none of the factors had a mean ranking of below 3.4
(not sure). This means that all the factors have been taken care of by the outlets in order to beat
competition. The degree of variation among the factors is not large indicating therefore that the
outlets apply all the factors simultaneously although the large variation in standard deviation on
the attractiveness in outlet layout and design (1.2046) and uninterrupted power and water supply
e.g. provision of generator, large storage water tanks (mean 1.2229) shows that not all the outlets
use the factors more often.
4.3.3 Importance of factors in response to competition
The findings indicate that the respondents focus on particular segments of the market. The
Table 4.10: Importance of factors in response to competition
Item Mean Std. deviation
Market focusing 1.6727 0.4237
Market segmentation 1.3564 0.3951
outlets practice market segmentation through establishing niches such as in the pizza area. The
standard deviations do not vary significantly from the means, thus supporting the findings.
42
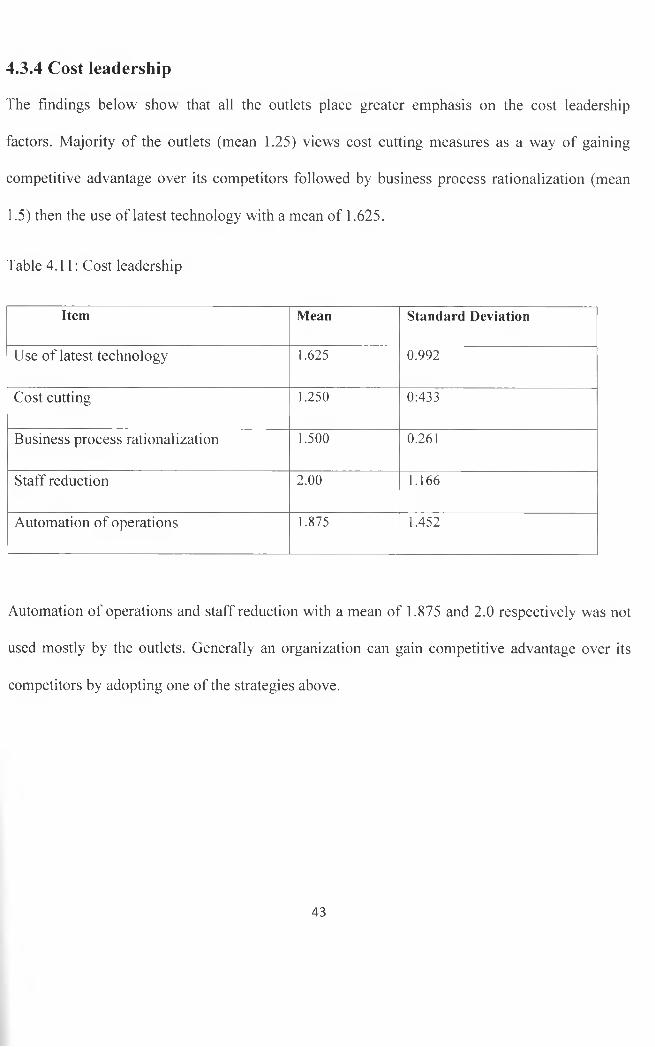
4.3.4 Cost leadership
The findings below show that all the outlets place greater emphasis on the cost leadership
factors. Majority of the outlets (mean 1.25) views cost cutting measures as a way of gaining
competitive advantage over its competitors followed by business process rationalization (mean
1.5) then the use of latest technology with a mean of 1.625.
Table 4.11: Cost leadership
Item Mean Standard Deviation
Use of latest technology 1.625 0.992
Cost cutting 1.250 0:433
Business process rationalization 1.500 0.261
Staff reduction 2.00 1.166
Automation of operations 1.875 1.452
Automation of operations and staff reduction with a mean of 1.875 and 2.0 respectively was not
used mostly by the outlets. Generally an organization can gain competitive advantage over its
competitors by adopting one of the strategies above.
43
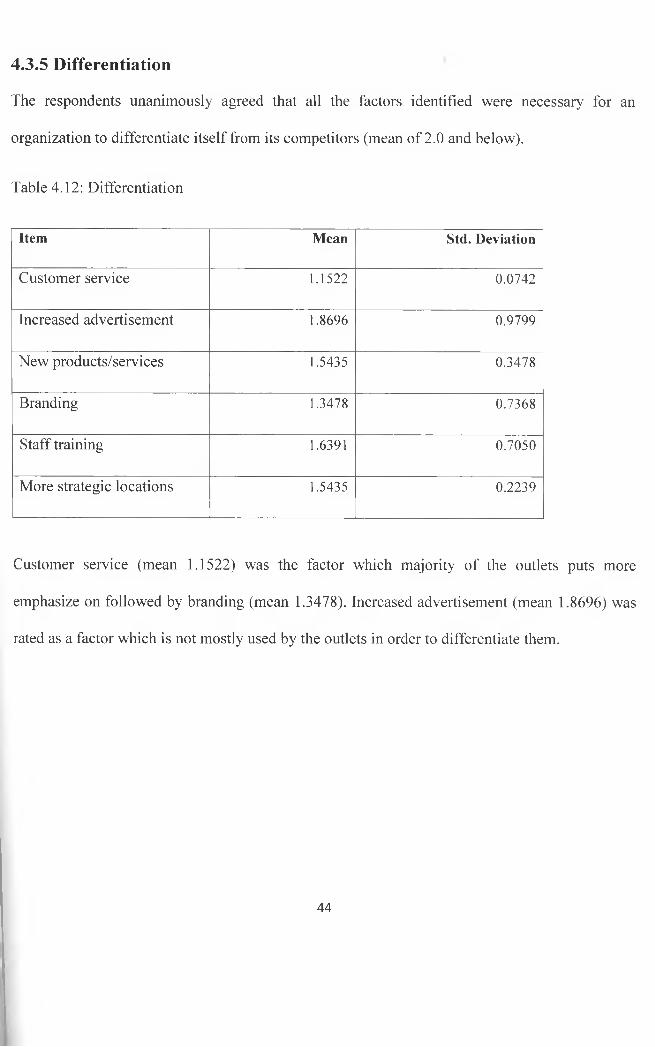
4.3.5 Differentiation
The respondents unanimously agreed that all the factors identified were necessary for an
organization to differentiate itself from its competitors (mean of 2.0 and below).
Table 4.12: Differentiation
Item Mean Std. Deviation
Customer service 1.1522 0.0742
Increased advertisement 1.8696 0.9799
New products/services 1.5435 0.3478
Branding 1.3478 0.7368
Staff training 1.6391 0.7050
More strategic locations 1.5435 0.2239
Customer service (mean 1.1522) was the factor which majority of the outlets puts more
emphasize on followed by branding (mean 1.3478). Increased advertisement (mean 1.8696) was
rated as a factor which is not mostly used by the outlets in order to differentiate them.
44
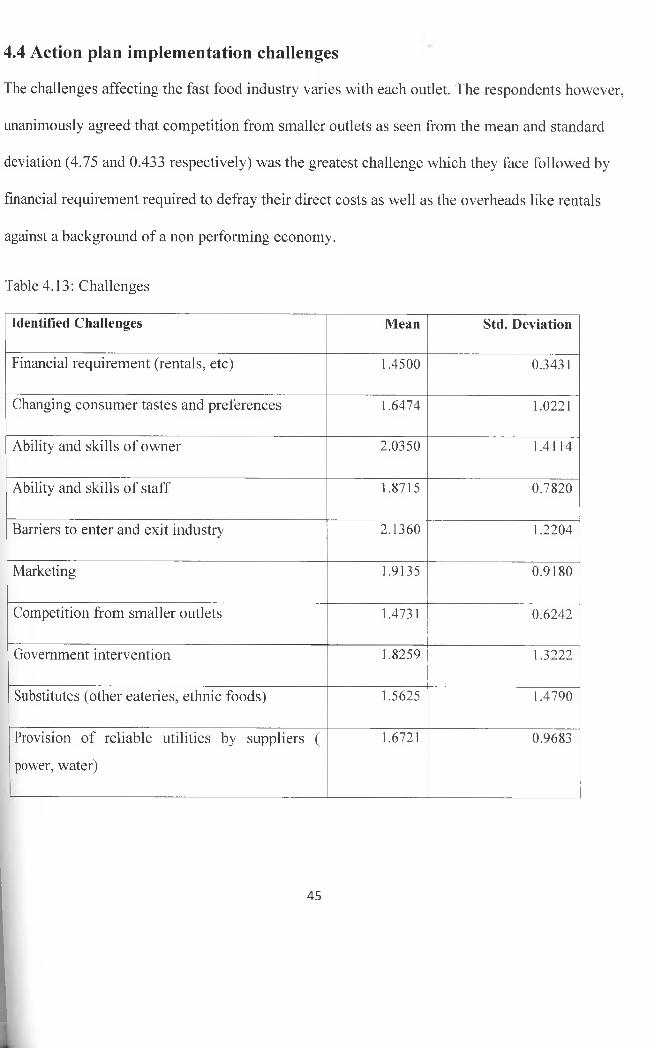
4.4 Action plan implementation challenges
The challenges affecting the fast food industry varies with each outlet. The respondents however,
unanimously agreed that competition from smaller outlets as seen from the mean and standard
deviation (4.75 and 0.433 respectively) was the greatest challenge which they face followed by
financial requirement required to defray their direct costs as well as the overheads like rentals
against a background of a non performing economy.
Table 4.13: Challenges
Identified Challenges Mean Std. Deviation
Financial requirement (rentals, etc) 1.4500 0.3431
Changing consumer tastes and preferences 1.6474 1.0221
Ability and skills of owner 2.0350 1.4114
Ability and skills of staff 1.8715 0.7820
Barriers to enter and exit industry 2.1360 1.2204
Marketing 1.9135 0.9180
Competition from smaller outlets 1.4731 0.6242
Government intervention 1.8259 1.3222
Substitutes (other eateries, ethnic foods) 1.5625 1.4790
Provision of reliable utilities by suppliers (
power, water)
1.6721 0.9683
45
Other notable challenges relate to substitutes (mean 1.5625 and a standard deviation of 1.4790),
enhancing the abilities and skills of staff (mean= 1.8715, standard deviation= 0.7820) and
changing consumer tastes and preferences (mean=1.6474 and standard deviation - 0.0221).
Marketing with a mean of 1.875 and standard deviation of 0.780 is another challenge to the
outlets. However, the degree of variance is high for most of the identified challenges, which
contradict the means. This suggests that different outlets face different challenges posed by the
environment in which they operate.
46
CHAPTER FIVE: SUMMARY, CONCLUSION AND
RECOMMENDATIONS
The aim of this study was to get an insight into the strategic responses adopted by fast food
chains operating in Nairobi Central Business District. This chapter contains a summary of the
results from the study, limitations of the study and suggestions for further research.
5.1 Conclusion
In summary, the study shows that a greater proportion of the respondents have worked for a
longer period of time in the organization and therefore have a lot of experience on the
challenges which the outlet faces and also how over the years they have responded to it. The
findings also indicate that majority of the outlets have operated for more than six years and
therefore this could be a sign that there have been few entrants into the business and these could
be as a result of barriers to entry by the established outlets, lack of space or high capital required.
The findings indicate that the number of staff currently employed by the respondent outlet is
high, signaling growth in the industry or increased workload as a result of increasing demands
from customers. It was also observed that a third of the firms operate other outlets, probably
suggesting that there is potential for market expansion. Inability to expand by some firms could
be attributed to lack of adequate capital, a necessary prerequisite for market expansion and one
of the challenges the study found out to be most commonly mentioned.
The study also revealed that these outlets have specific target markets to serve and use various
methods to attract their target groups to visit their outlets. Majority of the respondents said their
customers patronize their outlets because of the quality of the food and good customer service
47
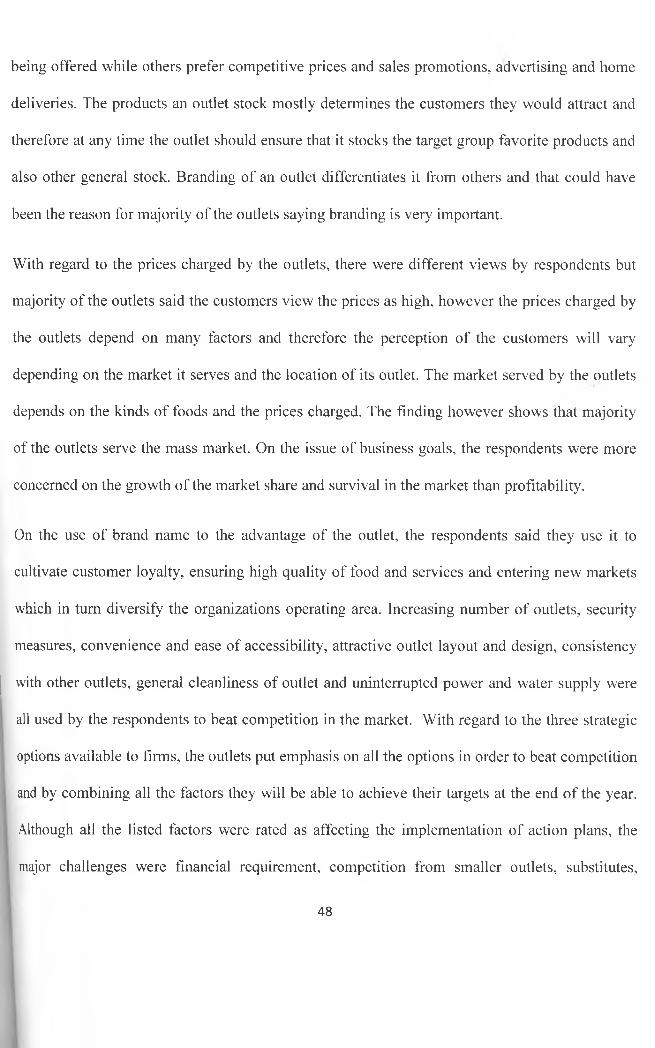
being offered while others prefer competitive prices and sales promotions, advertising and home
deliveries. The products an outlet stock mostly determines the customers they would attract and
therefore at any time the outlet should ensure that it stocks the target group favorite products and
also other general stock. Branding of an outlet differentiates it from others and that could have
been the reason for majority of the outlets saying branding is very important.
With regard to the prices charged by the outlets, there were different views by respondents but
majority of the outlets said the customers view the prices as high, however the prices charged by
the outlets depend on many factors and therefore the perception of the customers will vary
depending on the market it serves and the location of its outlet. The market served by the outlets
depends on the kinds of foods and the prices charged. The finding however shows that majority
of the outlets serve the mass market. On the issue of business goals, the respondents were more
concerned on the growth of the market share and survival in the market than profitability.
On the use of brand name to the advantage of the outlet, the respondents said they use it to
cultivate customer loyalty, ensuring high quality of food and services and entering new markets
which in turn diversify the organizations operating area. Increasing number of outlets, security
measures, convenience and ease of accessibility, attractive outlet layout and design, consistency
with other outlets, general cleanliness of outlet and uninterrupted power and water supply were
all used by the respondents to beat competition in the market. With regard to the three strategic
options available to firms, the outlets put emphasis on all the options in order to beat competition
and by combining all the factors they will be able to achieve their targets at the end of the year.
Although all the listed factors were rated as affecting the implementation of action plans, the
major challenges were financial requirement, competition from smaller outlets, substitutes,
48
changing consumer tastes and preferences, provision of reliable utilities by suppliers and ability
and skills of staff.
5.2 Recommendations
The study recommends the following:
5.2.1 Recommendations on Customers
The outlet should ensure that it does their market survey thoroughly before deciding on their
target customers in order to avoid a situation where they will be targeting the wrong market.
Since the customers patronize the outlets on the basis of the quality food and good customer
service, the outlets should ensure then that they maintain the highest level of quality at all times
and at the same time also they should stock the products which their customers need. The outlet
should never deviate from its main goal which varies with the level of operation of the firm, so
that they can be able to grow systematically.
5.2.2 Recommendations on strategic Responses
In view of the results findings, it is recommended that all the outlets should use their brand name
to the satisfaction of its customers and not exploit them. The use of all the strategic options by
the outlets will ensure that if one option fails then they can use the other to respond to the
changes in the market.
5.2.3 Recommendations on Competitive Challenges
Recommendations regarding the competitive challenges faced by the outlets are that they should
factor in all the factors which have been highlighted as affecting the customers since they are the
ones bringing business to the outlets and therefore seek ways of fulfilling them.
49
5.2.4. Recommendations for Further Research
The study confined itself to large fast food restaurants operating in Nairobi Central Business
District. This research therefore should be replicated in other fast food restaurants operating in
Nairobi and the results be compared so as to establish whether there is consistency among the
fast food restaurants.
5.3 Limitations of study
This study was based on a sample limited to fast food restaurants operating in Nairobi Central
Business District. It did not cover other fast food restaurants operating outside the NCBD. The
scope and depth of study was also limited by the time factor and financial resource constraints.
This put the researcher under immense time pressure. The researcher also encountered immense
problems with the respondents’ unwillingness to complete the questionnaires promptly. Some of
them kept the questionnaires for too long, thus delaying data analysis.
5.4 Implication on policy and practice
The high level of expansion registered in the fast food restaurants in the NCBD is an indication
of a potential capacity in the sector and hence giving a challenge to the policy makers of the need
to develop and implement policies that will foster its growth and also facilitate healthy
competition among the players in the field. The high customer level experienced in the
restaurants necessitates the need to maintain high quality hygiene standards to prevent outbreak
of disease and therefore there is need to maintain vigilance on cleanliness standards in these fast
food restaurants.
50
REFERENCES
Ansoff, H.I and McDonell E (1990). Implanting strategic management, 2nd Edition,
Englewood Cliffs, NJ: Prentice - Hall Europe.
Atheru, K.K. (2007). Strategic responses by Kenya meteorological department to the needs of
their customers. Unpublished MBA project: University of Nairobi.
Barney, J. (1991) Firm Resources and Sustained Competitive Advantage. Journal o f
Management 17(1): 1-15.
Bauer, C., Colgan, J. (2001), "Planning for electronic commerce strategy: an explanatory
study from the financial services sector", Logistics Information Management, Vol. 14
No. 1/2, pp.24-32
Beal, R.W (2000), "An exploratory assessment of situational effects in buyer behavior", Journal
o f Marketing Research.
Berthoff, A. (2002), "Differentiation II", Computer Dealer News., Vol. 18 No.2, pp.20.
Bourgeois, W.K. (1980), "Survival in a hostile environment", in Hammermesh, R.G. (Eds),
Strategic Management, Wiley, New York, NY, pp. 151-69.
Bumes, B. (2004) Managing change: A strategic approach to organizational dynamics, 4th
edition (Harlow: Prentice Hall).
Byar's J.B. (1991), "Types of competition and the theory of strategy: toward an integrated
framework", Academy of Management Review, Vol. 110 pp.791-800.51
Chaganti, M.J., Black, C.D., Hart, S. (1988), "The competitiveness of British industry: what
really makes the difference?", European Journal o f Marketing, Vol. 22 No.2, pp.70-85.
Cooper R.D and Emory C.W (1985), “Business research methods, 5th Edition”, Irwin, Boston.
Cox, R.M. and Dale, R.E., (2002), “Michael Porter’s big ideas”, Fast Company, August 20. pp.
150-6.
Daft, P., and Weick C.L. (1984), "Measures of international competitiveness: a critical
survey", Journal o f Marketing Management, Vol. 4 pp. 175-200.
Darrow, W.P., Algin, B., King, D.H. (2001), "David vs Goliath in the hardware industry:
generic strategies and critical success factors as revealed by business practice", The
Mid-Atlantic Journal o f Business, Vol. 37 No.2/3, pp.97-109.
David, F. (2000), Strategic Management Concepts and Cases, Prentice-Hall, Englewood
Cliffs, NJ.
Davidson, S. (2001), "Seizing the competitive advantage". Community Banker, Vol. 10
No.8, pp.32-4.
Dess, G.G., (1987), “Costs, revenue, and business-level strategy." Academy of Management
Review, 13.
Einhorn, J.A. and Hogarth, P., (1988), “Generic strategy and performance: an empirical test of
the miles and snow typology”, British Journal of Management, Vol. 4 No. 1, pp. 29-36.
52
Elliot, H., Huffman, P., and Makar, S., (2003), Beyond re-engineering: How the process centered
organization is changing our work and our lives. Happer Collins Publishers.
Fred, L. G. (1996). The role of institutionalization in cultural persistence. American
Sociological Review, 42: 726-743.
Foss (1997), “Strategy and industry effects on profitability: evidence from Greece”, Strategic
Management Journal, Vol. 25 No. 2, p. 139.
Hambrick, D.C. (1982), "Strategic awareness within top management teams", Strategic
Management Journal, Vol. 2 No.2, pp.263-79.
Hlavacka, H.T, Dicken, P., Forsgren, M., Malmberg, A. (2001), The local embeddedness of
transnational corporations, in Amin, A., Thrift, N. (eds.) Globalisation, institutions and
regional development in Europe, Oxford: Oxford University Press, 23-45.
Hlavacka, S., Ljuba, B., Viera, R., Robert, W. (2001), "Performance implications of Porter's
generic strategies in Slovak hospitals", Journal o f Management in Medicine, Vol. 15
No.l, pp.44-66.
Hyatt, L. (2001), "A simple guide to strategy", Nursing Homes, Vol. 50 No.l, pp.12-3.
Johnson, G., Scholes, K. (1993), Exploring Corporate Strategy, 3rd ed., Prentice-Hall
International, Hemel Hempstead,.
Johnson, G., Scholes, K. (1997), Fast Food Restaurant Survey. England: Pearson Education
Limited.
53
Johnson, G., Scholes, K. and Whittington, R. (2005). Exploring Corporate Strategy: Text
and Cases. England:Pearson Education Limited.
Kay, N.(1993), "An interview with Michael Porter", Academy o f Management Executive, Vol. 16
No.2, pp.43-52.
Lang, R., Alpert, M.I., Shocker, A.D (1984), "A customer-oriented approach for determining
market structures", Journal o f Marketing,.
Lynch, J. (2003). Strategy Management: Awareness and changes. 3rd edition. Thompson
Business Press, U.K
Macmillan, J. J., Elofer, C. W., and Boulton, W. R. (2000) "Toward a system for classifying
business strategies." Academy of Management Review, 13.
Malburg, C. (2000), "Competing on costs", Industry Week, Vol. 249
McCracken, L. (2002), "Differentiation: win new business with less effort", Principal's Report
Vol. 2No.4, pp.l.
McGrea, J. (2005), "Strategic groups: theory, research and taxonomy", Strategic Management
Journal, Vol. 7 No.l, pp. 141-60
Miles, R. and Snow, C. (1978), Organizations: new concepts for new forms. California
Management Review, 28, 62-73.
54
Miller, D. (1992). Relating Porter’s business strategies to environment and structure:
analysis and performance implications. Academy of Management Journal, 43: 486-501.
Mosskanter, Ross. (1999) Collaborative advantage. Harvard Business Review, 1994, July-
August, 96-108.
Nairobi City Council licensing data, Nairobi City Council offices, Nairobi.
Kandie, P.Y. (2001). A study of strategic responses by Telkom Kenya. Unpublished MBA
Project: University of Nairobi.
Kiptugen E.J. (2003), Strategic responses to a changing competitive environment. The case study
of KCB. Unpublished MBA Project: University of Nairobi.
Kombo, H.K. (1997). Strategic responses by firms facing changed environment conditions: A
study of motor vehicles franchise holders in Kenya. Unpublished MBA project,
University of Nairobi.
Kotha, C. and Orne, L., (1989), "Strategy drives marketing success", Graphic Arts Monthly, Vol.
71 No.2, pp.96.
Pearce, J.and Robinson, R. (1988). Strategy Management: Irwin McGraw-Hill
Pearce, J. and Robinson, R. (1997). Strategy Management. Formulation,
Implementation and control. Irwin McGraw-Hill.
Pearce, J. and Robinson, R. (2002). Strategy Management. Formulation,
Implementation and Control. 6th Edition. Irwin McGraw-Hill.
Porter, M. (1980), Competitive strategy: techniques for analyzing industries and competitors.
New York: The Free Press.
Porter, M.E (1981). Competitive advantage; creating and sustaining superior performance. Free
Press.
Porter, M. (1985), Competitive advantage: creating and sustaining superior performance. New
York: The Free Press.
Ross, D.N. (1996), Meeting the challenges of the supply chain management, “APICS the
performance advantage”.
Ross, D.N. (1999), “Culture as a context for multinational business: a framework for assessing
the strategy-culture ‘fit’”, Multinational Business Review, Vol. 7 No. 1, pp. 13-9.
Sheik, O. (2000). A study of the strategic responses by kenyan insurance companies
following liberalization. Unpublished MBA Project, University of Nairobi.
Skinner, W (1974), "The focused factory", Harvard Business Review>, Vol. 52 No.3, pp.l 13-21.
Suri, M. (1998), “Strategic development related to Europeanization of UK logistics and
distribution service suppliers”, European Business Review, Vol. 95 No. 5, pp. 9-14.
Suutari.R.S. (1999). "New emerging challenges and opportunities for small and medium
enterprises through technological upgradation and better financial management" in Small
Industry Bulletin for Asia and Pacific, No. 29, United Nations, New York.
56
Swamidass, P.M. Newell, W.T (1986), "Manufacturing strategy, environmental uncertainty, and
performance: a path analytic model’", Management Science, Vol. 33 No.4, pp.509-24.
Teece, D. J. and Pisano, G., (1998), Competition, co-operation and innovation: organizational
arrangements for regimes of rapid technological progress. Journal o f Economic Behavior
and Organization, 18, 1-25.
Waverman, L (2001), Strategy Management: Awareness and changes.3rd edition. Thompson
Business Press, U.K
Whittington R.E. (2002), “Theory and research in strategic management: swings of a pendulum”,
Journal of Management, Vol. 25 No. 3, pp. 417-56.
57
APPENDICES
APPENDIX I: LETTER OF INTRODUCTION
University of Nairobi
School of Business
Department of Strategic Management
P.O.Box 30197
Nairobi
16 July 2010
Dear Respondent,
I am a postgraduate student at the University of Nairobi, at the School of Business. In order to
fulfill the degree requirement, 1 am undertaking a management research project on strategic
responses to competition. The study is entitled:
“Strategic responses to competition among large fast food restaurants in Nairobi Central
Business District”
You have been selected to form part of this study. This is to kindly request you to assist
me collect the data by filling out the accompanying questionnaire. The information/ data you
provide will be exclusively for academic purposes. My supervisor and I assure you that the
information you give will be treated with strict confidence. At no time will you or your
organization’s name appear in my report.
Catherine Wanjugu Mwangi Dr. Zack B. Awino
Student no: D61/70056/2008 Supervisor
58

U JU VfeR SnY O F NAIROBISCHOOL OF BUSINESS
PROGRAM - LOtffefi. KABETE CAMPUS
i B^x 30JUT Nairobi. Konva
DATE.
Tdcpn.'inc 'O h-2i >5̂ 11-0 Telegrams: ”\ arsny”. \u;r- r. lelev 2»i.|U5 Varsny
TO WHOM IT MAY CONCERN
The bearer of this ietter ....V A . V. .vrv. .'V:...... h.lV ::!.\A .v :>....... xYVvA .A 'A \
Registration Nc: .S'N V.A..171.o . .v .« L I . r ! ..................................................
is a Master of Business Administration (MBA) student of the University of Nairobi.
h'e/she is required to suomit as oart of h;s/her coursework assessment a research project report on a management proolem. We would like the students to do their projects on real problems affecting firms in Kenya. We would, therefore, appreciate if you assist him/her by allowing him/her to collect data in your organization for the research.
The results of the report will be used solely for academic purposes and a copy of the same will be availed to the interviewed organizations on request.
Thank you.
s c < %Mqa
DR. W.N. IRAKI CO-ORDINATOR,
O.
MBA PROGRAM
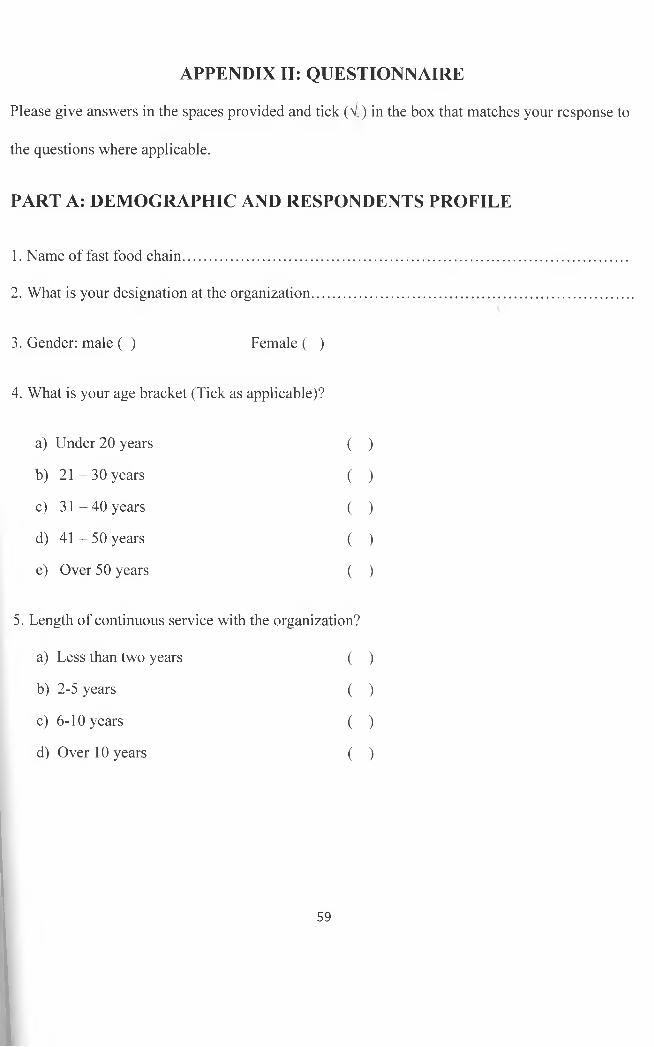
APPENDIX II: QUESTIONNAIRE
Please give answers in the spaces provided and tick (V„) in the box that matches your response to
PART A: DEMOGRAPHIC AND RESPONDENTS PROFILE
the questions where applicable.
PART A: DEMOGRAPHIC AND RESPONDENTS PROFIL
1. Name of fast food chain...............................................................................
2. What is your designation at the organization...............................................
3. Gender: male ( ) Female ( )
4. What is your age bracket (Tick as applicable)?
a) Under 20 years ( )
b) 2 1 -3 0 years ( )
c) 3 1 -4 0 years ( )
d) 4 1 -5 0 years ( )
e) Over 50 years ( )
5. Length of continuous service with the organization?
a) Less than two years ( )
b) 2-5 years ( )
c) 6-10 years ( )
d) Over 10 years ( )
59
6. For how long has your fast food chain been in existence?
a) Under 5 years ( )
b) 6 - 10 years ( )
c) 11 - 15 years ( )
d) 16-20 years ( )
e) 21-25 years ( )
f) Over 25 years ( )
7. How many employees do you currently have?
a) Less than 20 ( )
b) 21 -3 0 ( )
c) 31 -40 r ( )
d) 41 -5 0 ( )
e) Over 50 ( )
8. Do you have any other branch? Yes ( ) No ( )
If yes, please give the actual number
PART B: CUSTOMERS
1. Please indicate, which of the following groups is your target customers?
i. Young adults <30 years old ( )
ii. Professionals (men and women) ( )
iii. Children ( )
iv. Family ( )
60
2. Why do you think these customers patronize your outlet? Because of:
i. Quality food and good customer service ( )
ii. Competitive prices ( )
iii. Sales promotions, advertising and home deliveries ( )
iv. Strategic location of outlet and interior decor ( )
v. Specialized services/foods ( )
3. Please indicate some of the difficulties you encounter in trying to meet the needs of these
customers?....................................................................................................................................
4. Who influences the decision to stock the products (foods) and services you offer at your
outlet?
Customers ( ) Outlet owner ( ) Competitors ( ) Suppliers ( )
5. In your opinion, how important is it to brand your outlets?
i. Very important ( )
ii. Fairly important ( )
iii. Not sure ( )
iv. Not important ( )
V. Not important at all ( )
6. How do your customers view the prices you charge for the foods and services?
Very high ( ) High ( ) Fair ( ) Low ( ) Very low ( )
61
7. What is the customer’s perception of the market you serve?
Up-market ( )
Mass market ( )
Middle and up-market ( )
Low end of the market ( )
8. In your opinion, how important are the following goals in your business? Responses are in a
scale of 1 - 5 defined as; 1 - Very important, 2 - Fairly important, 3 - Not sure, 4 - Not
important and 5 - Not important at all.
FACTORS 1 2 3 4 5
Survival in the market
Growth (gain market share)
Profitability
Product and market differentiation
Maximize market share
PART C: STRATEGIC RESPONSES
1. How have you used your brand name to your advantage?
Charge a premium ( )
Cultivate customer loyalty ( )
Differentiate from competition ( )
Introduce new products ( )
Enter new markets ( )
Claim quality of food and services ( )
62
2. Please indicate the extent to which you have used the following action plans to beat
competition in the market? Use a scale of 1 - 5 with; 1 - Very important, 2 - Fairly important,
3 - Not sure, 4 - Not important and 5 - Not important at all.
FACTORS 1 2 3 4 5
Increasing number of outlets
Security measures e.g. well lit area
Convenience and ease of accessibility
Attractive in outlet layout and design
Consistency with other outlets
General cleanliness of outlet
Uninterrupted power and water supply e.g. provision of generator, large storage water tanks
3. How important has each of the following strategic options been to your firm in response to
changes in the market? Use a scale of 1 - 5 with; 1- Very important, 2 - Fairly important, 3 -
Not sure, 4 - Not important and 5 - Not important at all.
a) Focus
FACTORS 1 2 3 4 5
Market focusing
Market segmentation
63
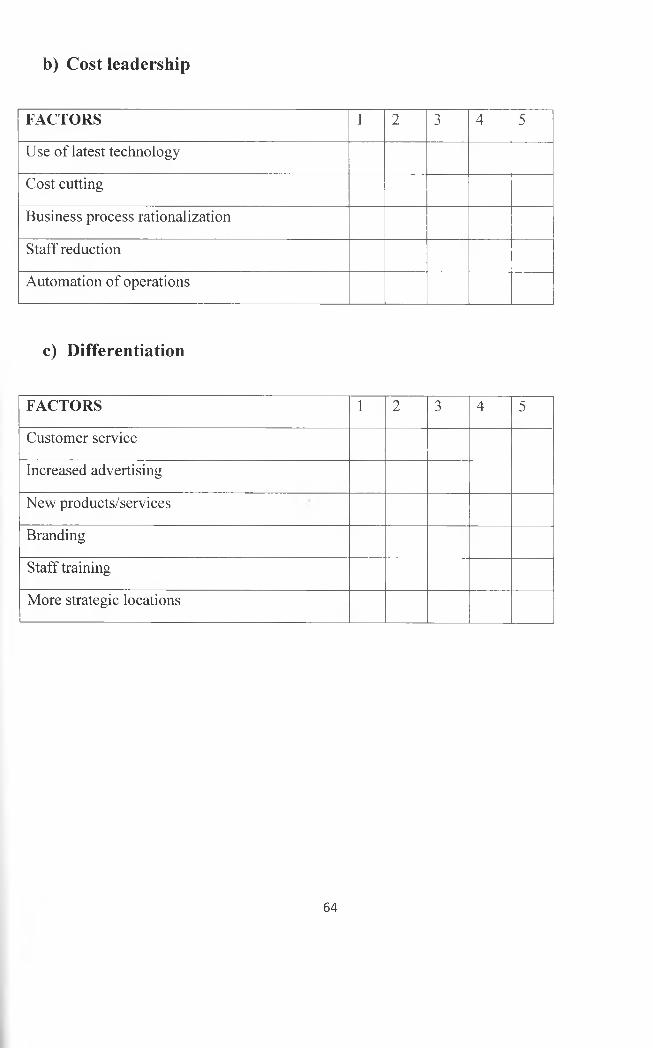
b) Cost leadership
FACTORS 1 2 3 4 5
Use of latest technology
Cost cutting
Business process rationalization
Staff reduction
Automation of operations
c) Differentiation
FACTORS 1 2 3 4 5
Customer service
Increased advertising
New products/services
Branding
Staff training
More strategic locations
64
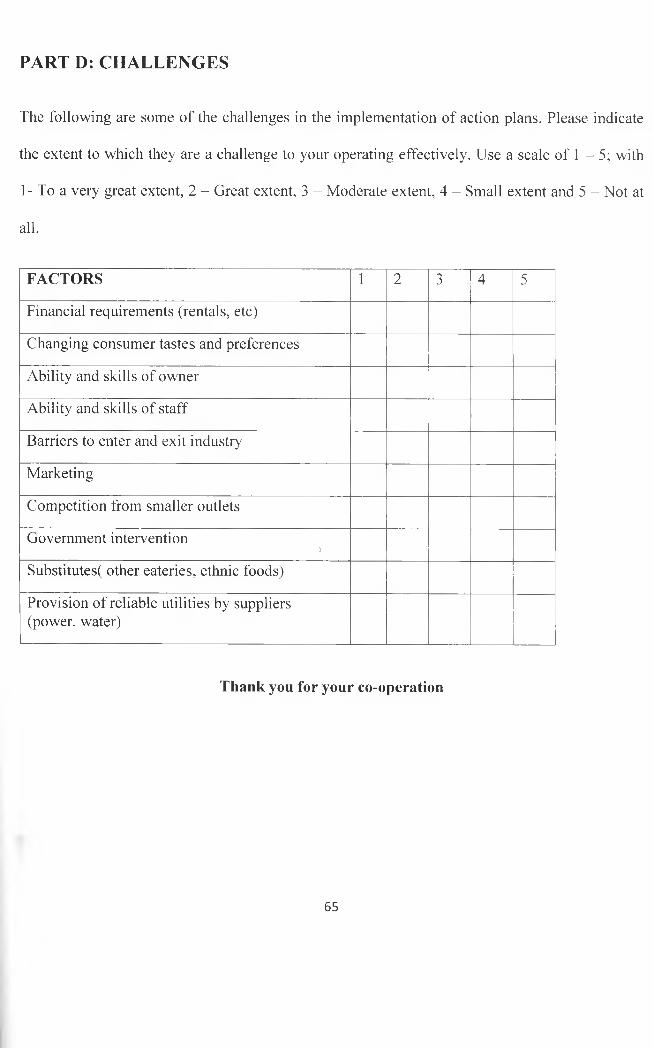
PART D: CHALLENGES
The following are some of the challenges in the implementation of action plans. Please indicate
the extent to which they are a challenge to your operating effectively. Use a scale of 1 - 5; with
1 - To a very great extent, 2 - Great extent, 3 - Moderate extent, 4 - Small extent and 5 - Not at
all.
FACTORS 1 2 3 4 5
Financial requirements (rentals, etc)
Changing consumer tastes and preferences
Ability and skills of owner
Ability and skills of staff
Barriers to enter and exit industry
Marketing
Competition from smaller outlets
Government intervention >Substitutes( other eateries, ethnic foods)
Provision of reliable utilities by suppliers (power, water)
Thank you for your co-operation
65
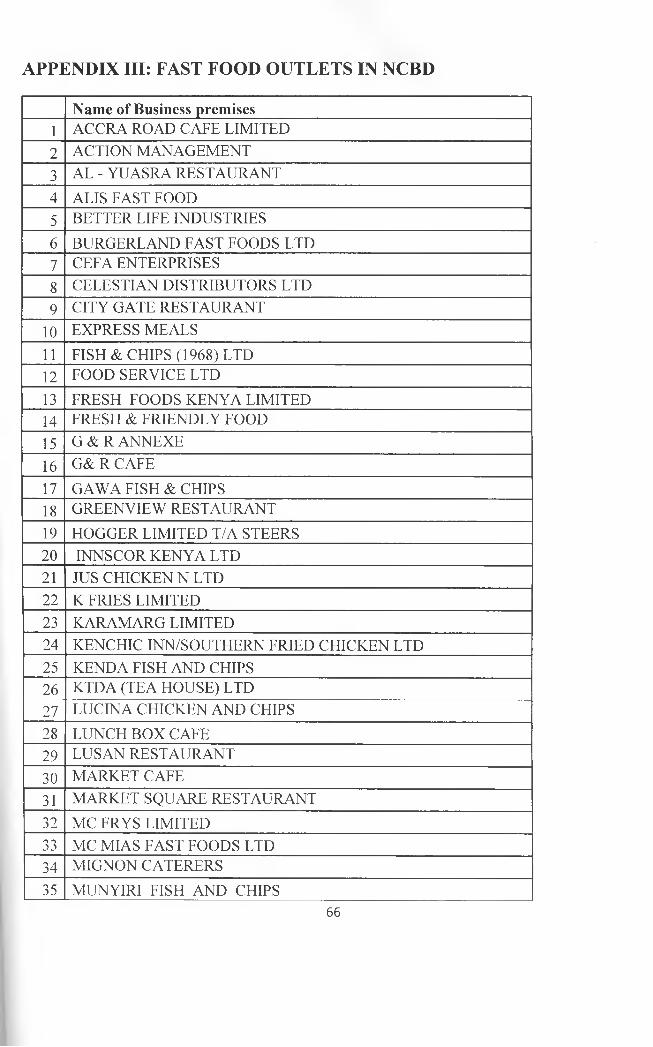
APPENDIX III: FAST FOOD OUTLETS IN NCBD
Name of Business premises1 ACCRA ROAD CAFE LIMITED2 ACTION MANAGEMENT3 AL - YUASRA RESTAURANT4 ALIS FAST FOOD5 BETTER LIFE INDUSTRIES6 BURGERLAND FAST FOODS LTD7 CEFA ENTERPRISES8 CELESTIAN DISTRIBUTORS LTD9 CITY GATE RESTAURANT
10 EXPRESS MEALS11 FISH & CHIPS (1968) LTD12 FOOD SERVICE LTD13 FRESH FOODS KENYA LIMITED14 FRESH & FRIENDLY FOOD15 G & R ANNEXE16 G& R CAFE17 GAWA FISH & CHIPS18 GREENVIEW RESTAURANT19 HOGGER LIMITED T/A STEERS20 INNSCOR KENYA LTD21 JUS CHICKEN N LTD22 K FRIES LIMITED23 KARAMARG LIMITED24 KENCHIC INN/SOUTHERN FRIED CHICKEN LTD25 KENDA FISH AND CHIPS26 KTDA (TEA HOUSE) LTD27 LUCINA CHICKEN AND CHIPS28 LUNCH BOX CAFE29 LUSAN RESTAURANT30 MARKET CAFE31 MARKET SQUARE RESTAURANT32 MC FRYS LIMITED33 MC MIAS FAST FOODS LTD34 MIGNON CATERERS35 MUNYIRI FISH AND CHIPS
66
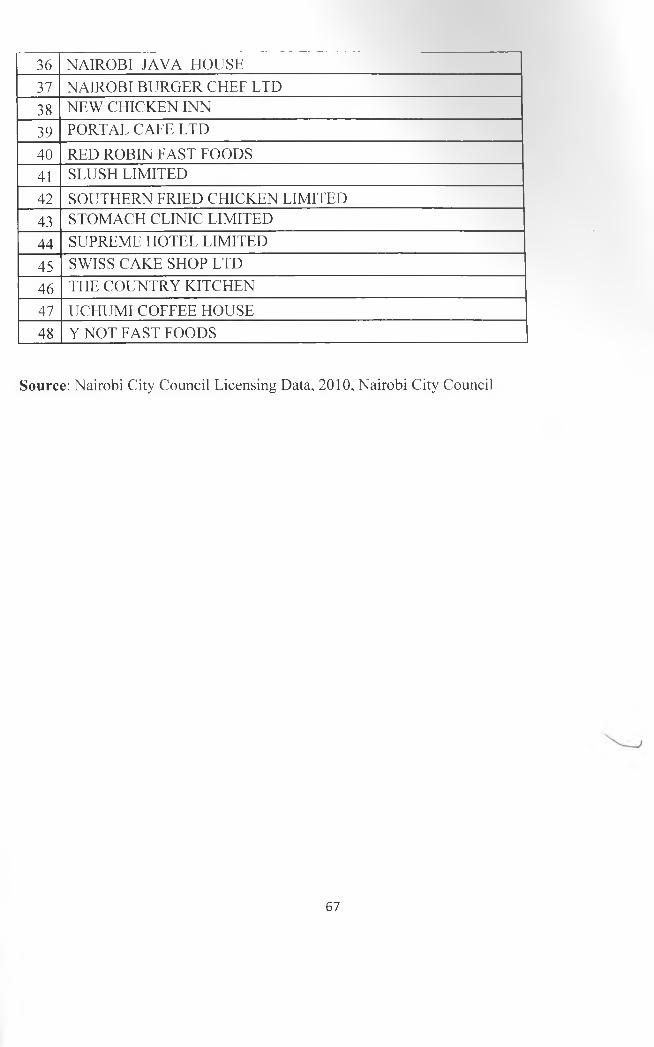
36 NAIROBI JAVA HOUSE37 NAIROBI BURGER CHEF LTD38 NEW CHICKEN INN39 PORTAL CAFE LTD40 RED ROBIN FAST FOODS41 SLUSH LIMITED42 SOUTHERN FRIED CHICKEN LIMITED43 STOMACH CLINIC LIMITED44 SUPREME HOTEL LIMITED45 SWISS CAKE SHOP LTD46 THE COUNTRY KITCHEN47 UCHUMI COFFEE HOUSE48 Y NOT FAST FOODS
Source: Nairobi City Council Licensing Data, 2010, Nairobi City Council
67
Recommended