Strategic Long Range Planning Overview
Board of Trustees Meeting
College of DuPage
2014 Richard Goodman Strategic Planning Award Winner

Strategic Planning • A systematic process of envisioning a desired
future, and translating that vision into broadly defined goals and a sequence of steps (tasks) to achieve them.
4
Why Plan? • Set priorities.
4
Why Plan? • Set priorities.
• Focus energy and resources.
4

Why Plan? • Set priorities.
• Focus energy and resources.
• Provide common direction.
4
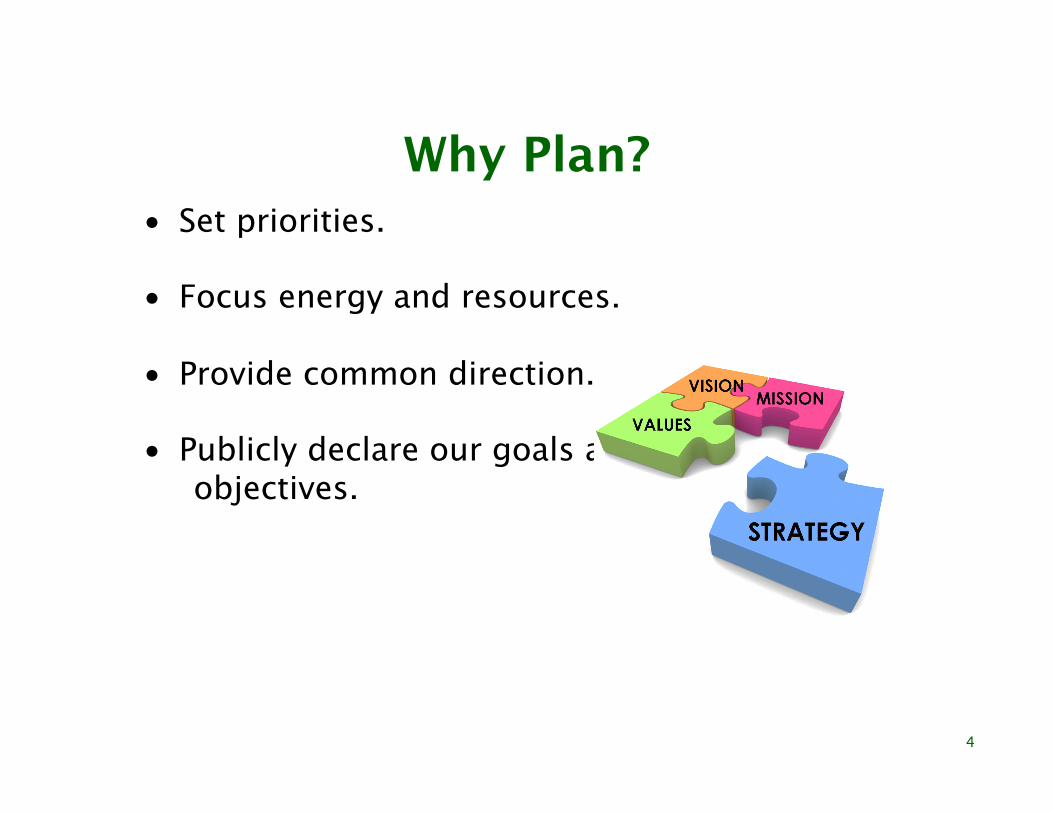
Why Plan? • Set priorities.
• Focus energy and resources.
• Provide common direction.
• Publicly declare our goals and objectives.
4
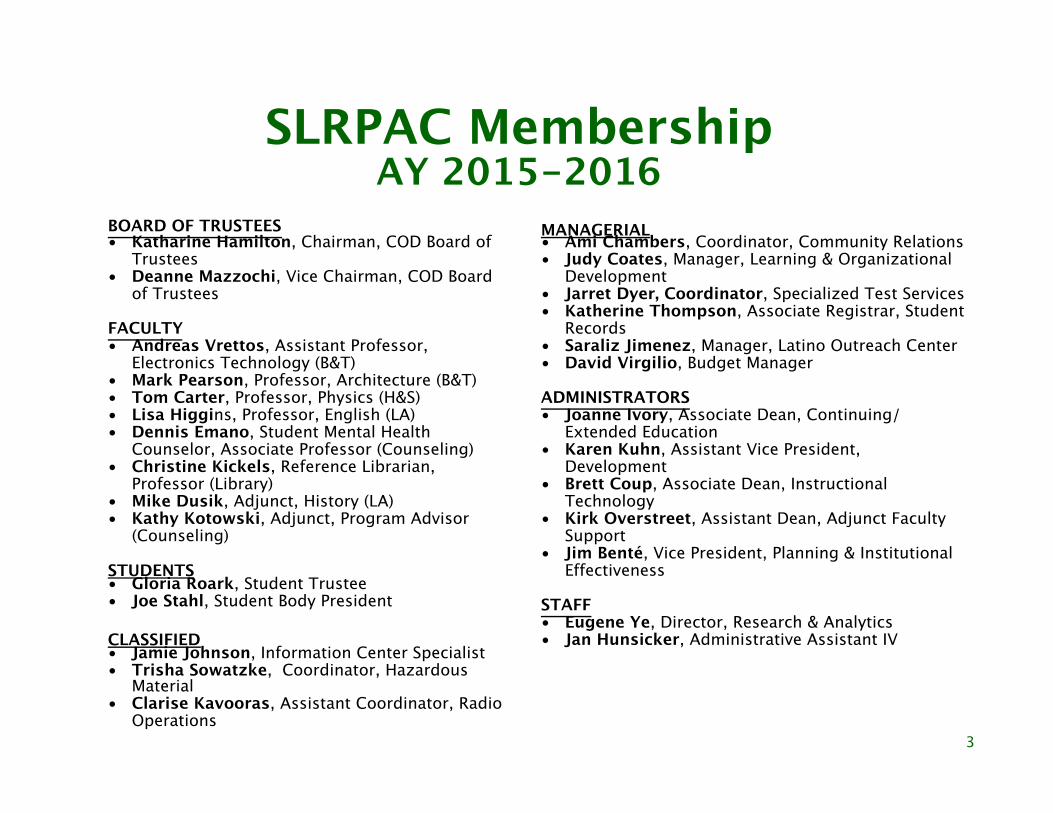
SLRPAC MembershipAY 2015-2016
BOARD OF TRUSTEES• Katharine Hamilton, Chairman, COD Board of
Trustees • Deanne Mazzochi, Vice Chairman, COD Board
of Trustees
FACULTY• Andreas Vrettos, Assistant Professor,
Electronics Technology (B&T)• Mark Pearson, Professor, Architecture (B&T)• Tom Carter, Professor, Physics (H&S)• Lisa Higgins, Professor, English (LA)• Dennis Emano, Student Mental Health
Counselor, Associate Professor (Counseling) • Christine Kickels, Reference Librarian,
Professor (Library) • Mike Dusik, Adjunct, History (LA)• Kathy Kotowski, Adjunct, Program Advisor
(Counseling)
STUDENTS• Gloria Roark, Student Trustee• Joe Stahl, Student Body President
CLASSIFIED• Jamie Johnson, Information Center Specialist • Trisha Sowatzke, Coordinator, Hazardous
Material• Clarise Kavooras, Assistant Coordinator, Radio
Operations
MANAGERIAL• Ami Chambers, Coordinator, Community Relations• Judy Coates, Manager, Learning & Organizational
Development• Jarret Dyer, Coordinator, Specialized Test Services• Katherine Thompson, Associate Registrar, Student
Records• Saraliz Jimenez, Manager, Latino Outreach Center• David Virgilio, Budget Manager
ADMINISTRATORS• Joanne Ivory, Associate Dean, Continuing/
Extended Education• Karen Kuhn, Assistant Vice President,
Development• Brett Coup, Associate Dean, Instructional
Technology• Kirk Overstreet, Assistant Dean, Adjunct Faculty
Support • Jim Benté, Vice President, Planning & Institutional
Effectiveness
STAFF• Eugene Ye, Director, Research & Analytics• Jan Hunsicker, Administrative Assistant IV
3
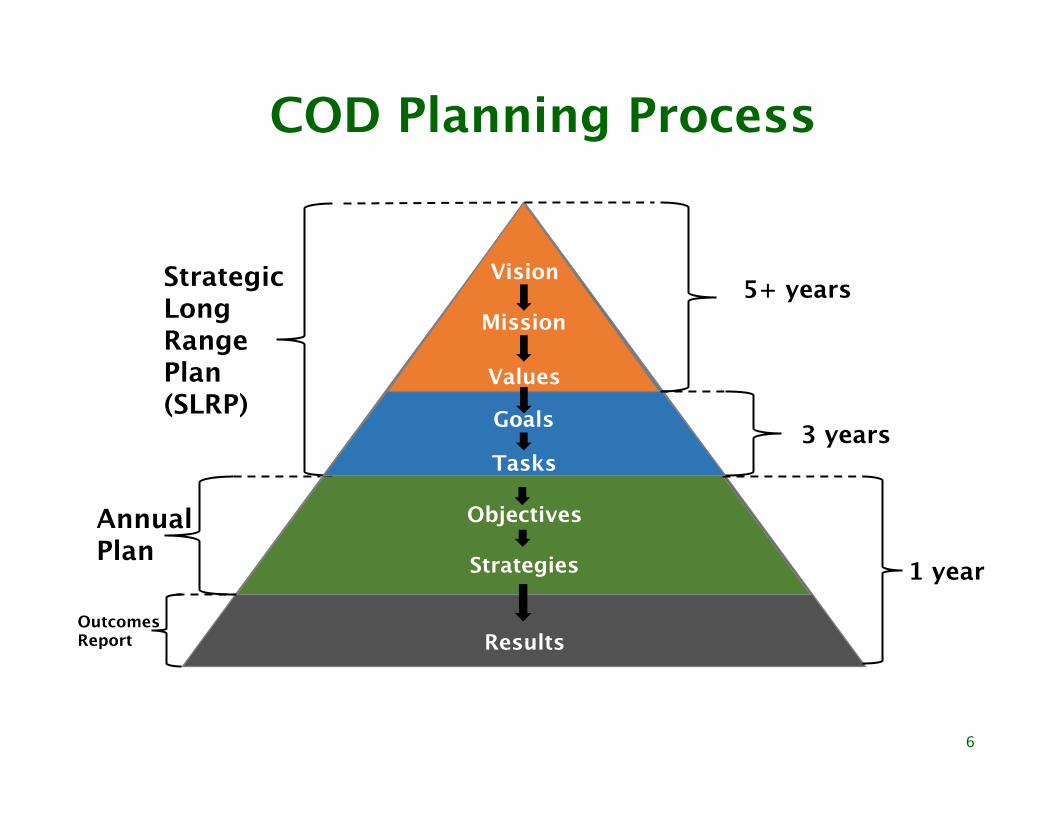
Objectives
Strategies
Results
1 year
AnnualPlan
OutcomesReport
COD Planning Process
5+ years
3 years
StrategicLongRange Plan (SLRP)
Vision
Mission
Values
Goals
Tasks
6
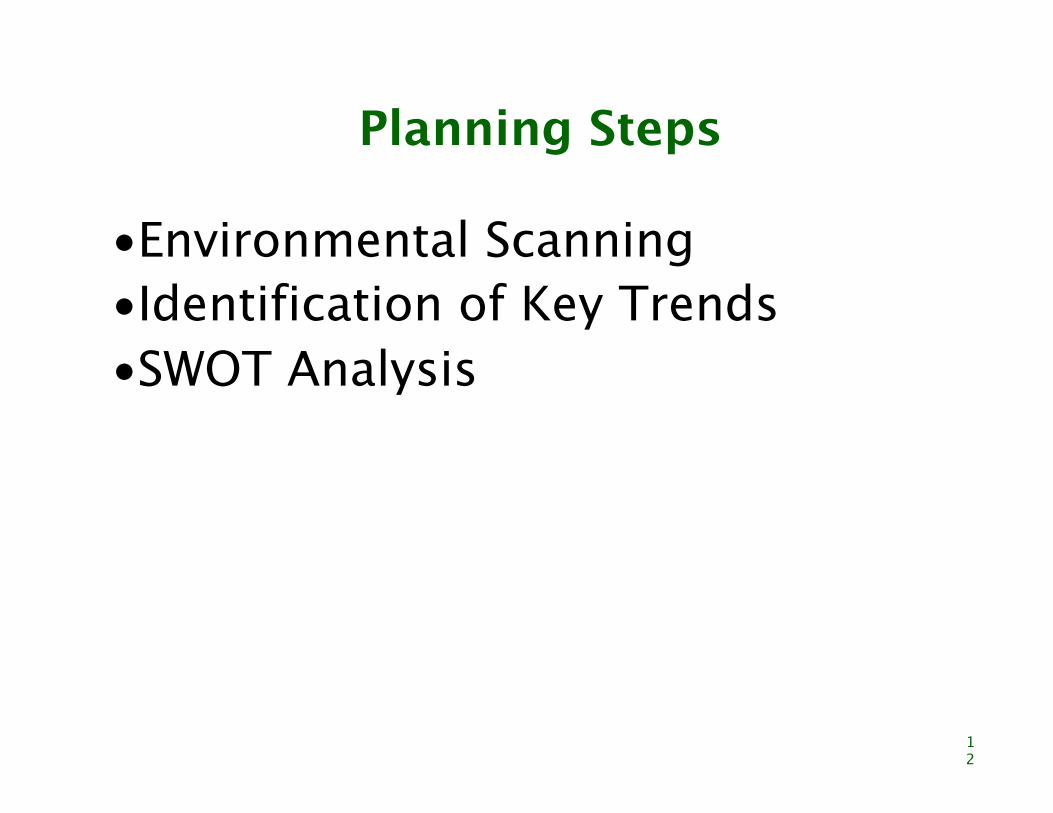
Planning Steps
• Environmental Scanning
12

Planning Steps
• Environmental Scanning• Identification of Key Trends
12
Planning Steps
• Environmental Scanning• Identification of Key Trends• SWOT Analysis
12
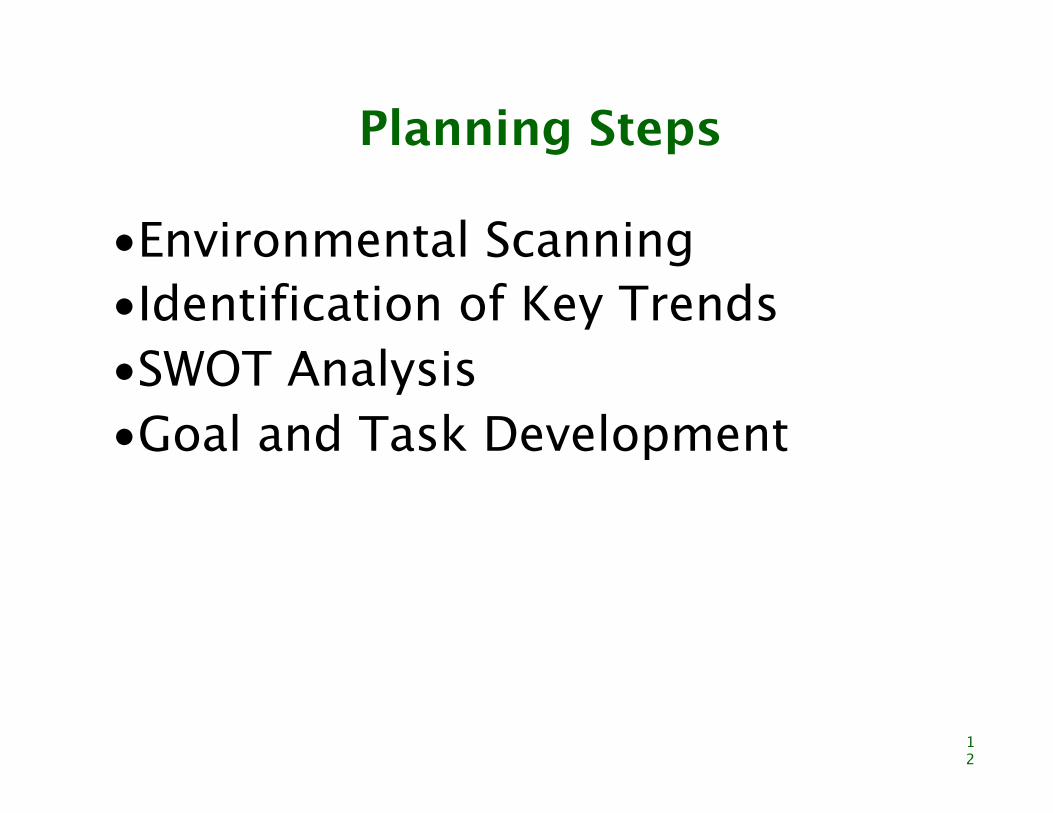
Planning Steps
• Environmental Scanning• Identification of Key Trends• SWOT Analysis• Goal and Task Development
12

Goals & TasksGoals• Broad statements of expected outcomes that are
long-term in nature (3+ years). • Not directly measurable.
Tasks• Specific areas of action necessary for the
accomplishment of a goal.• Are developed and/or updated as appropriate.• Serves as a bridge between the SLRP and the
Annual Plan.
8
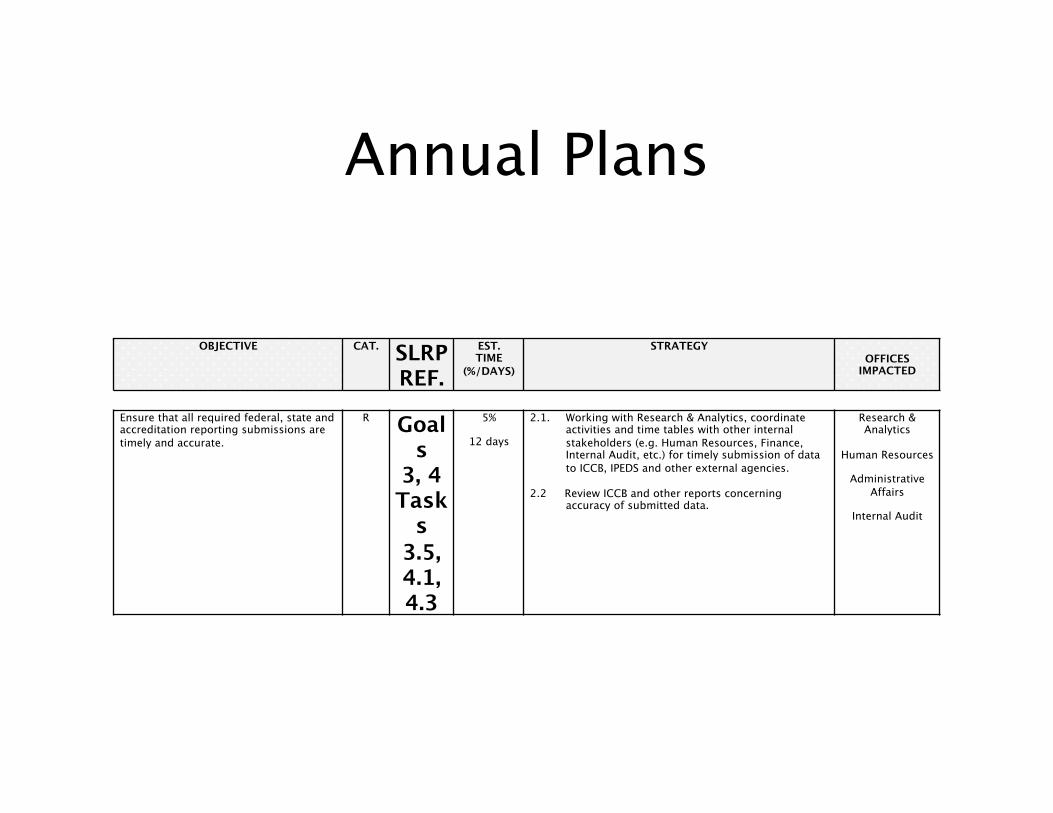
Annual Plans
Ensure that all required federal, state and accreditation reporting submissions are timely and accurate.
R Goals
3, 4 Task
s 3.5, 4.1, 4.3
5%
12 days
2.1. Working with Research & Analytics, coordinate activities and time tables with other internal stakeholders (e.g. Human Resources, Finance, Internal Audit, etc.) for timely submission of data to ICCB, IPEDS and other external agencies.
2.2 Review ICCB and other reports concerning accuracy of submitted data.
Research & Analytics
Human Resources
Administrative Affairs
Internal Audit
OBJECTIVE CAT. SLRP REF.
EST. TIME
(%/DAYS)
STRATEGY OFFICES
IMPACTED
2014 Richard GoodmanStrategic Planning Award
Non-Profit Category
28
College of DuPage2014 Richard Goodman
Strategic Planning Award Winner

Academically Enriched Students
0
100
200
300
400
500
600
2010FA 2011FA 2012FA 2013FA 2014FAHS GPA 3.75 or Greater ACT 27 or Greater
Num
ber
of S
tude
nts
Linear Trend Line
GOOD
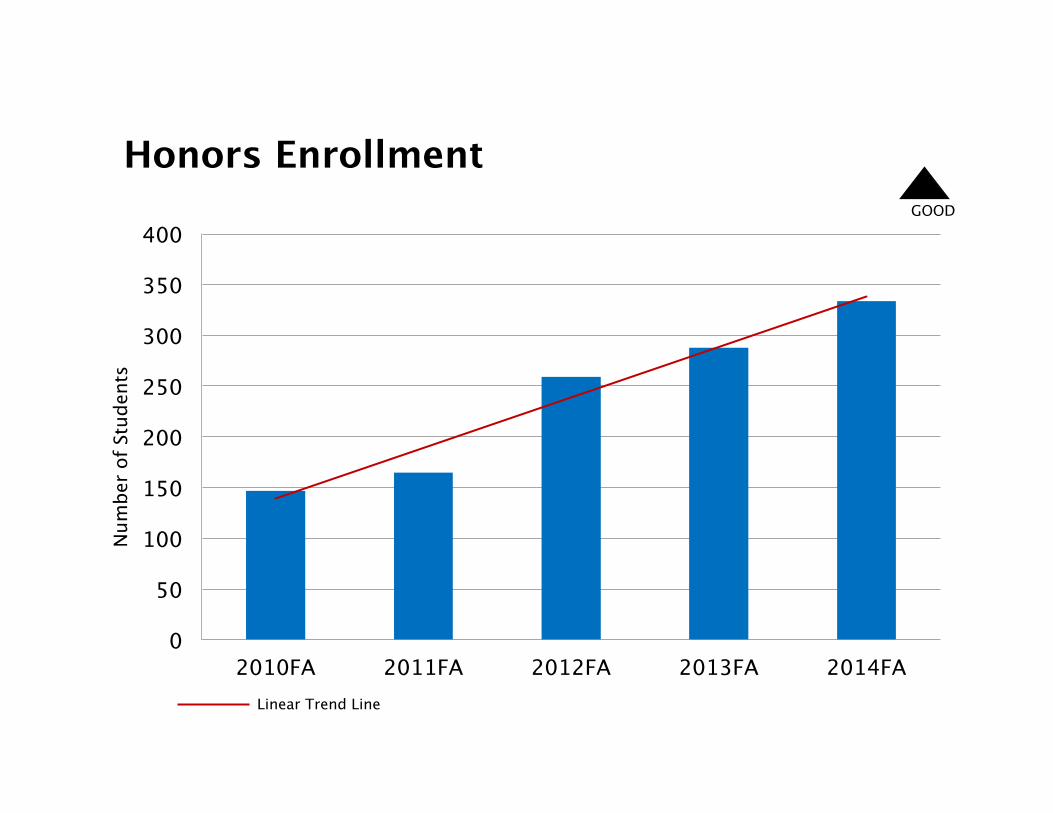
Honors Enrollment
0
50
100
150
200
250
300
350
400
2010FA 2011FA 2012FA 2013FA 2014FA
Num
ber
of S
tude
nts
Linear Trend Line
GOOD
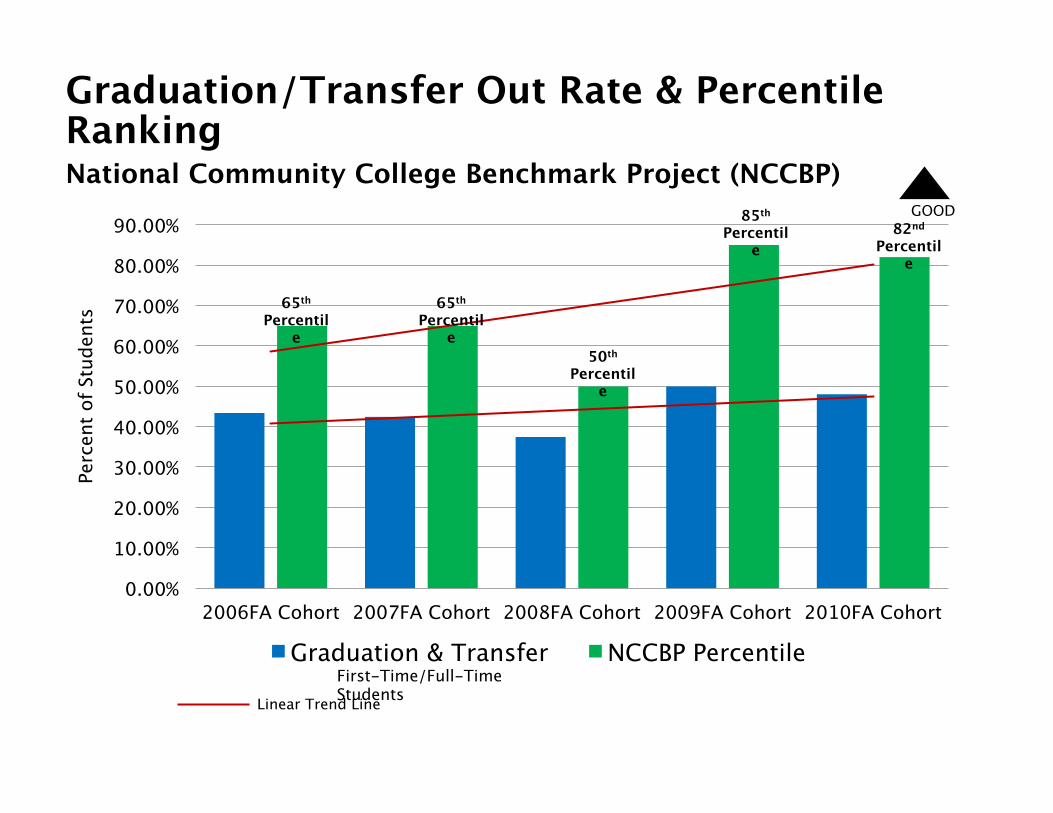
Graduation/Transfer Out Rate & Percentile Ranking National Community College Benchmark Project (NCCBP)
0.00%
10.00%
20.00%
30.00%
40.00%
50.00%
60.00%
70.00%
80.00%
90.00%
2006FA Cohort 2007FA Cohort 2008FA Cohort 2009FA Cohort 2010FA Cohort
Graduation & Transfer NCCBP PercentileFirst-Time/Full-Time StudentsLinear Trend Line
GOOD
Perc
ent o
f Stu
dent
s 65th Percentil
e
65th Percentil
e50th
Percentile
85th Percentil
e82nd
Percentile
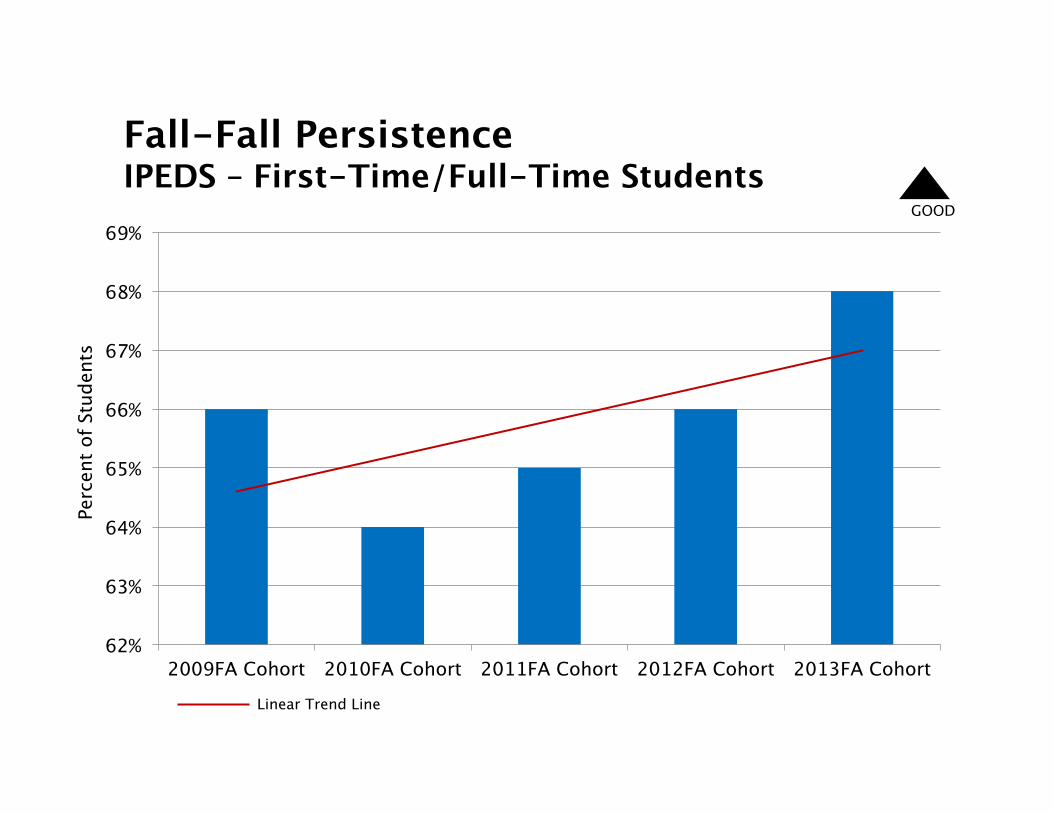
Fall-Fall Persistence IPEDS – First-Time/Full-Time Students
62%
63%
64%
65%
66%
67%
68%
69%
2009FA Cohort 2010FA Cohort 2011FA Cohort 2012FA Cohort 2013FA Cohort
Linear Trend Line
GOOD
Perc
ent o
f Stu
dent
s

Noel-Levitz Summary Questions Student Satisfaction Survey
00.5
11.5
22.5
33.5
44.5
55.5
Met your expectations
Overall satisfaction Would enroll here again
200720102014
GOOD
Linear Trend Line
Ratin
g
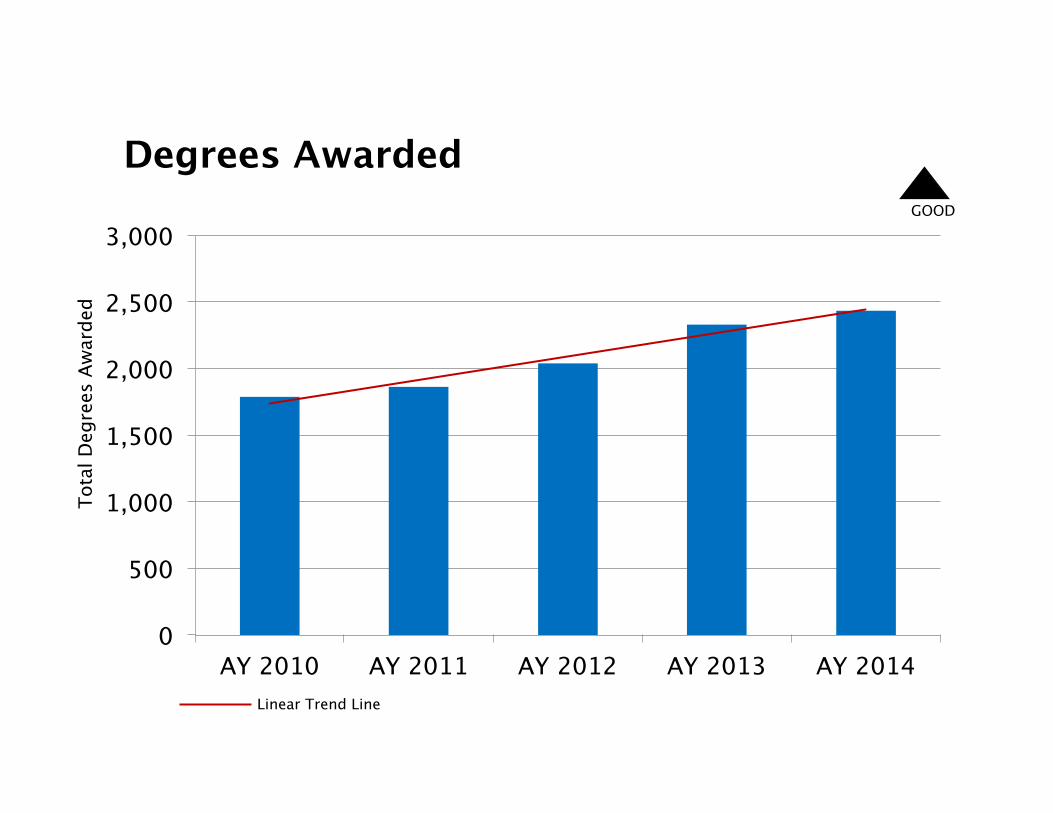
Degrees Awarded
0
500
1,000
1,500
2,000
2,500
3,000
AY 2010 AY 2011 AY 2012 AY 2013 AY 2014Linear Trend Line
GOOD
Tota
l Deg
rees
Aw
arde
d
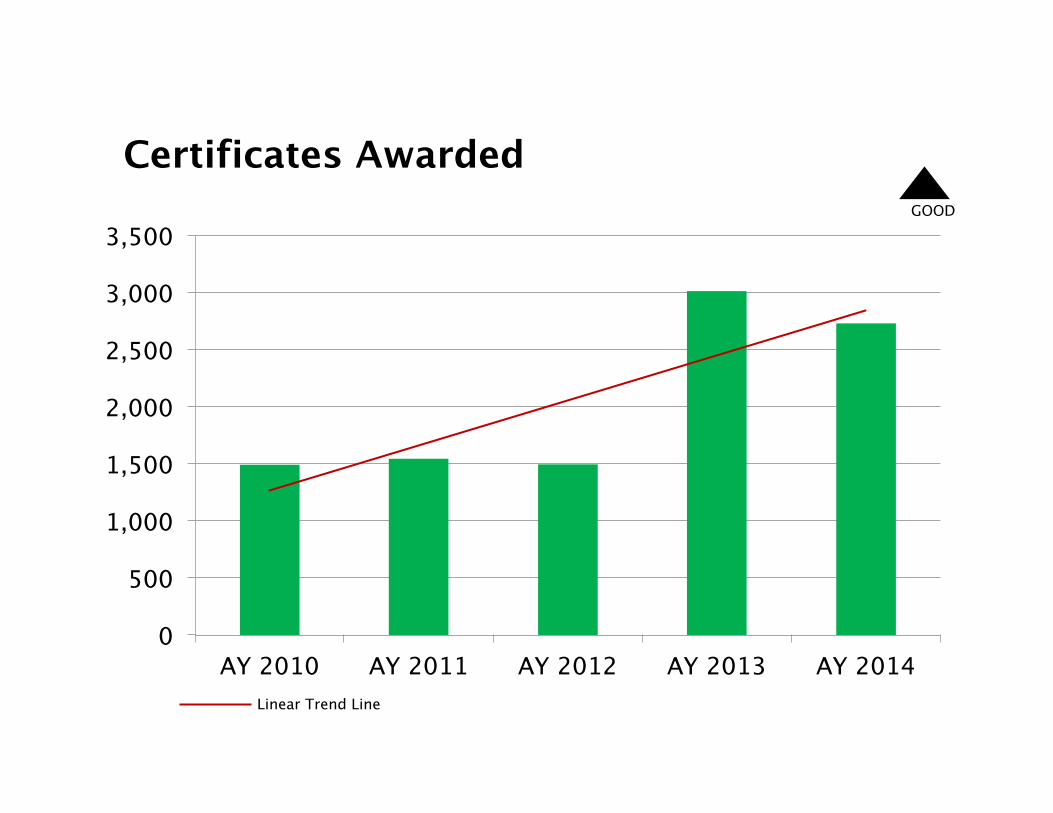
Certificates Awarded
0
500
1,000
1,500
2,000
2,500
3,000
3,500
AY 2010 AY 2011 AY 2012 AY 2013 AY 2014Linear Trend Line
GOOD
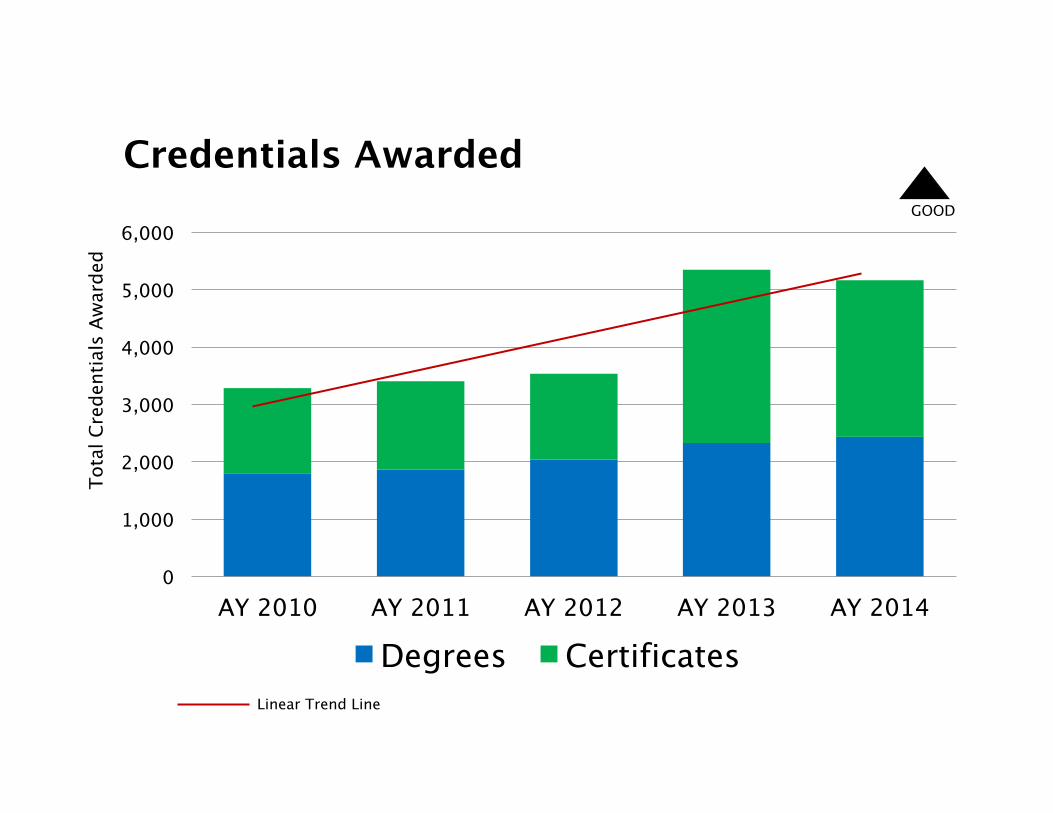
Credentials Awarded
0
1,000
2,000
3,000
4,000
5,000
6,000
AY 2010 AY 2011 AY 2012 AY 2013 AY 2014
Degrees Certificates
Tota
l Cre
dent
ials
Aw
arde
d
Linear Trend Line
GOOD
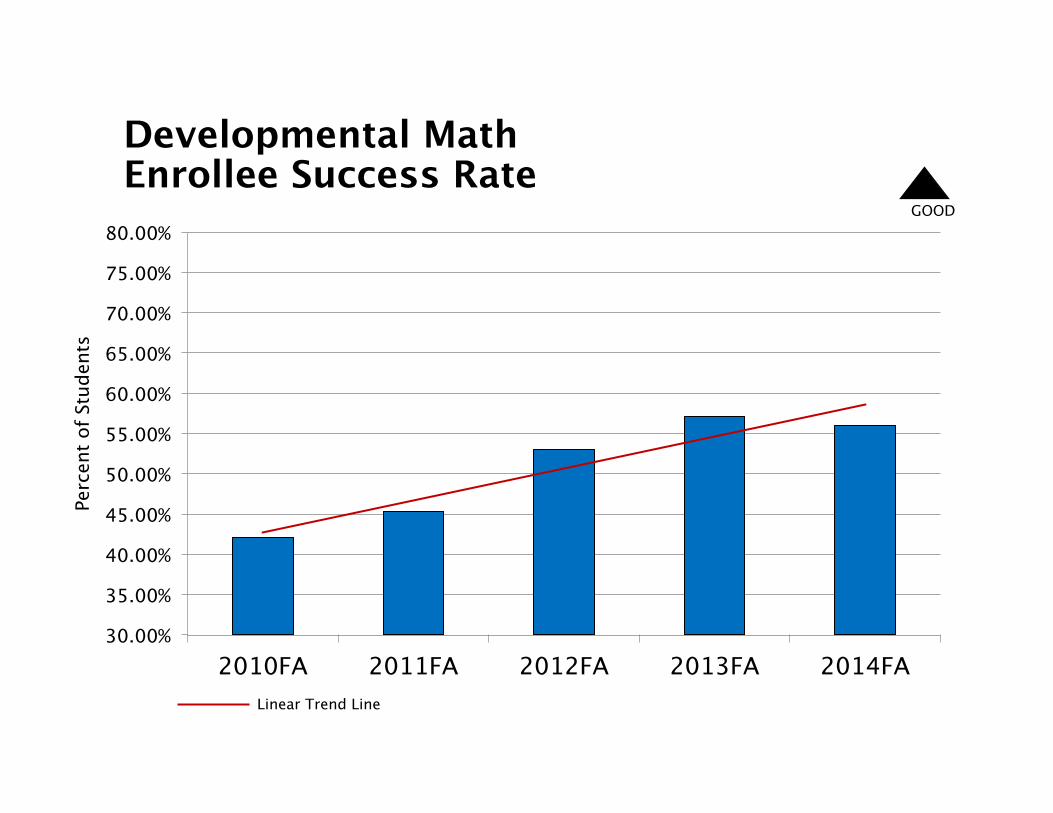
Developmental MathEnrollee Success Rate
30.00%
35.00%
40.00%
45.00%
50.00%
55.00%
60.00%
65.00%
70.00%
75.00%
80.00%
2010FA 2011FA 2012FA 2013FA 2014FA
GOOD
Linear Trend Line
Perc
ent o
f Stu
dent
s
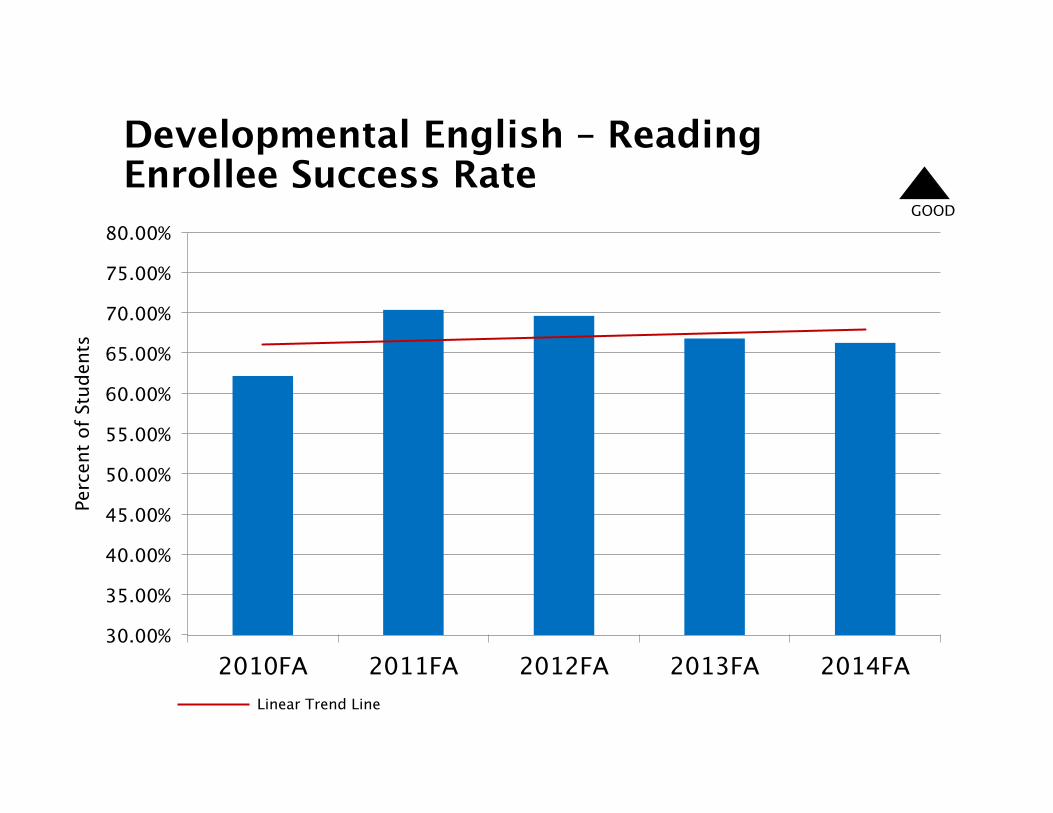
Developmental English – ReadingEnrollee Success Rate
30.00%
35.00%
40.00%
45.00%
50.00%
55.00%
60.00%
65.00%
70.00%
75.00%
80.00%
2010FA 2011FA 2012FA 2013FA 2014FA
GOOD
Linear Trend Line
Perc
ent o
f Stu
dent
s
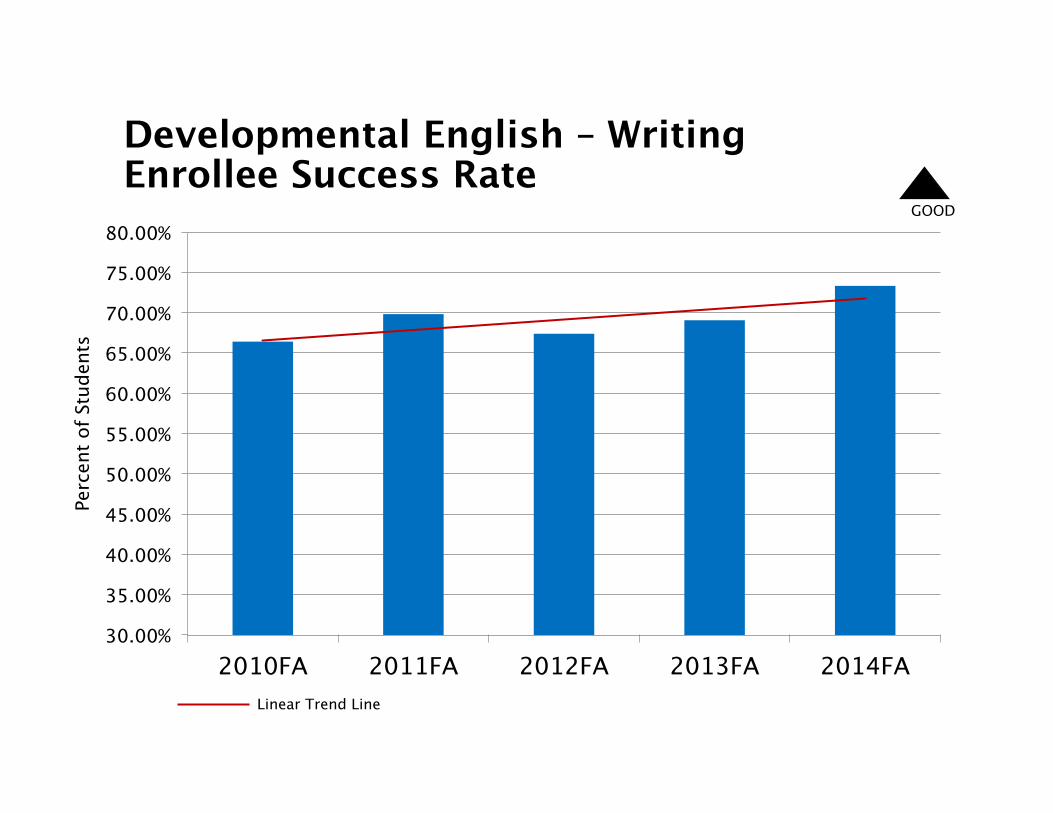
Developmental English – WritingEnrollee Success Rate
30.00%
35.00%
40.00%
45.00%
50.00%
55.00%
60.00%
65.00%
70.00%
75.00%
80.00%
2010FA 2011FA 2012FA 2013FA 2014FA
GOOD
Linear Trend Line
Perc
ent o
f Stu
dent
s
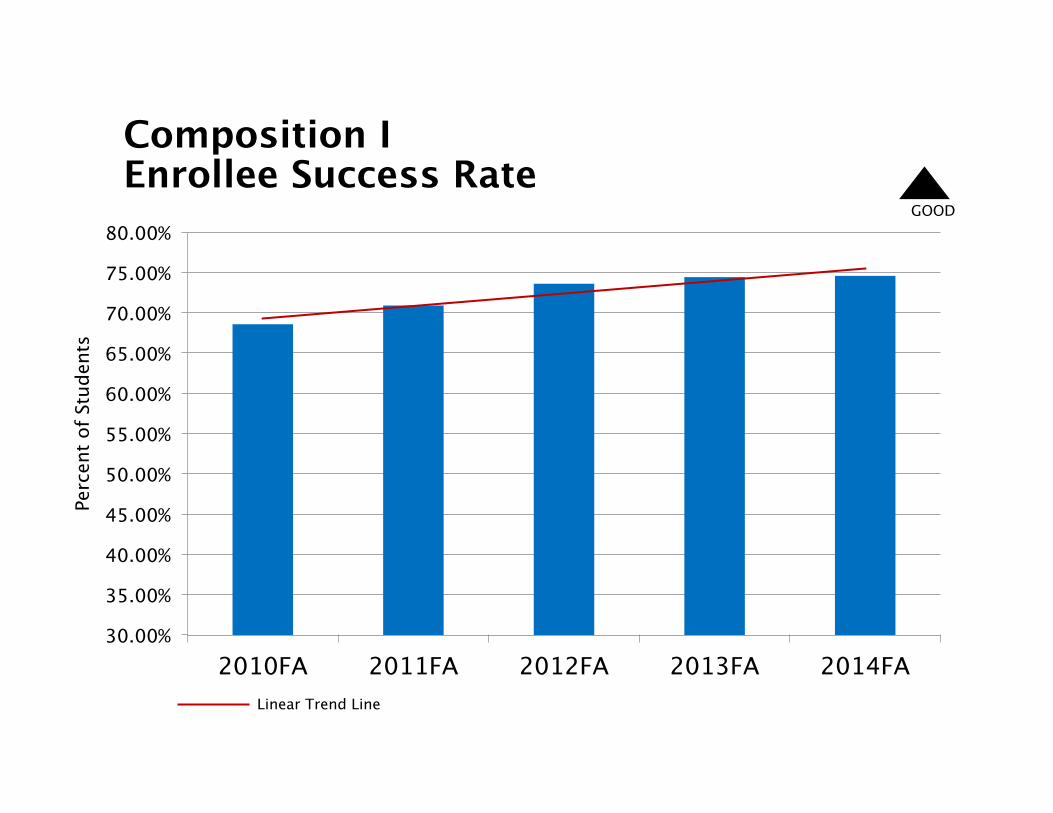
Composition IEnrollee Success Rate
30.00%
35.00%
40.00%
45.00%
50.00%
55.00%
60.00%
65.00%
70.00%
75.00%
80.00%
2010FA 2011FA 2012FA 2013FA 2014FA
GOOD
Linear Trend Line
Perc
ent o
f Stu
dent
s
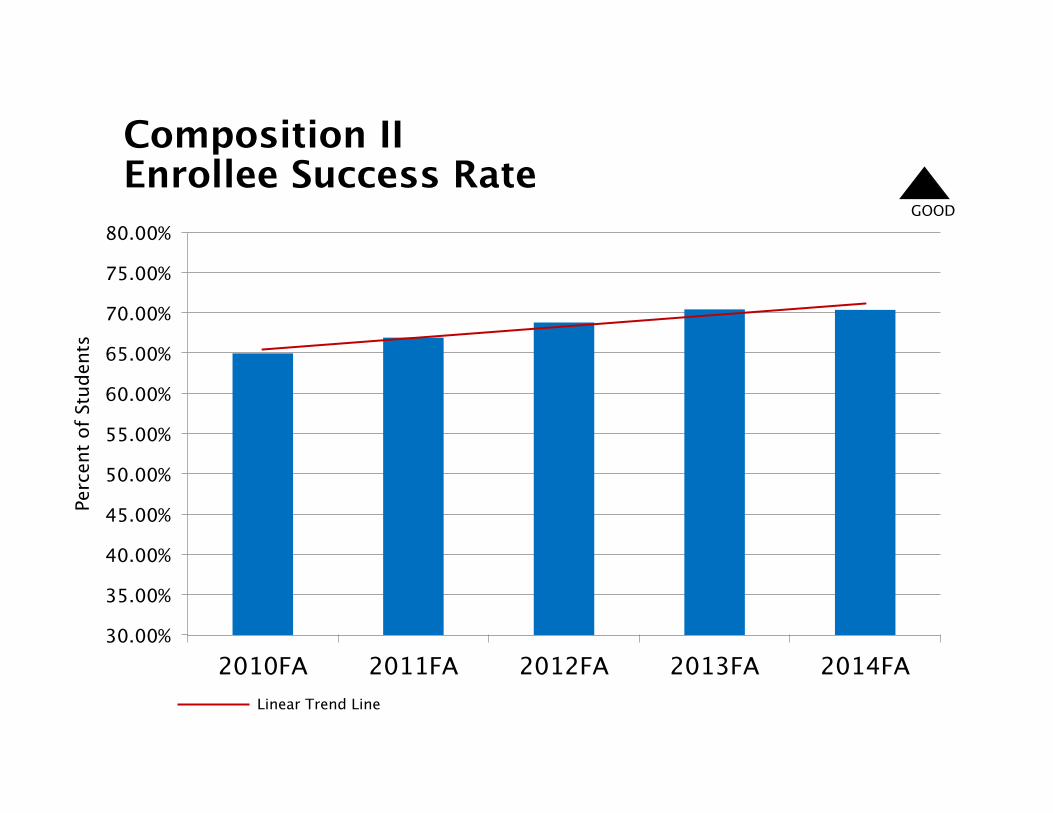
Composition IIEnrollee Success Rate
30.00%
35.00%
40.00%
45.00%
50.00%
55.00%
60.00%
65.00%
70.00%
75.00%
80.00%
2010FA 2011FA 2012FA 2013FA 2014FA
GOOD
Linear Trend Line
Perc
ent o
f Stu
dent
s
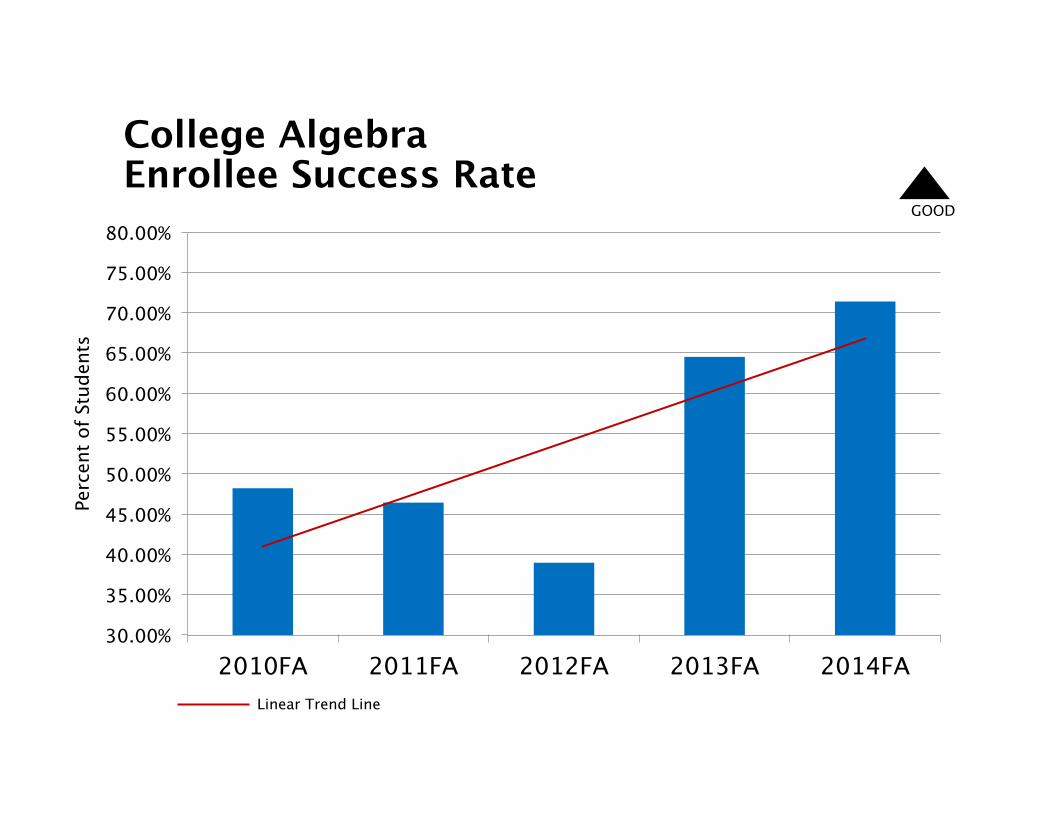
College AlgebraEnrollee Success Rate
30.00%
35.00%
40.00%
45.00%
50.00%
55.00%
60.00%
65.00%
70.00%
75.00%
80.00%
2010FA 2011FA 2012FA 2013FA 2014FA
GOOD
Linear Trend Line
Perc
ent o
f Stu
dent
s
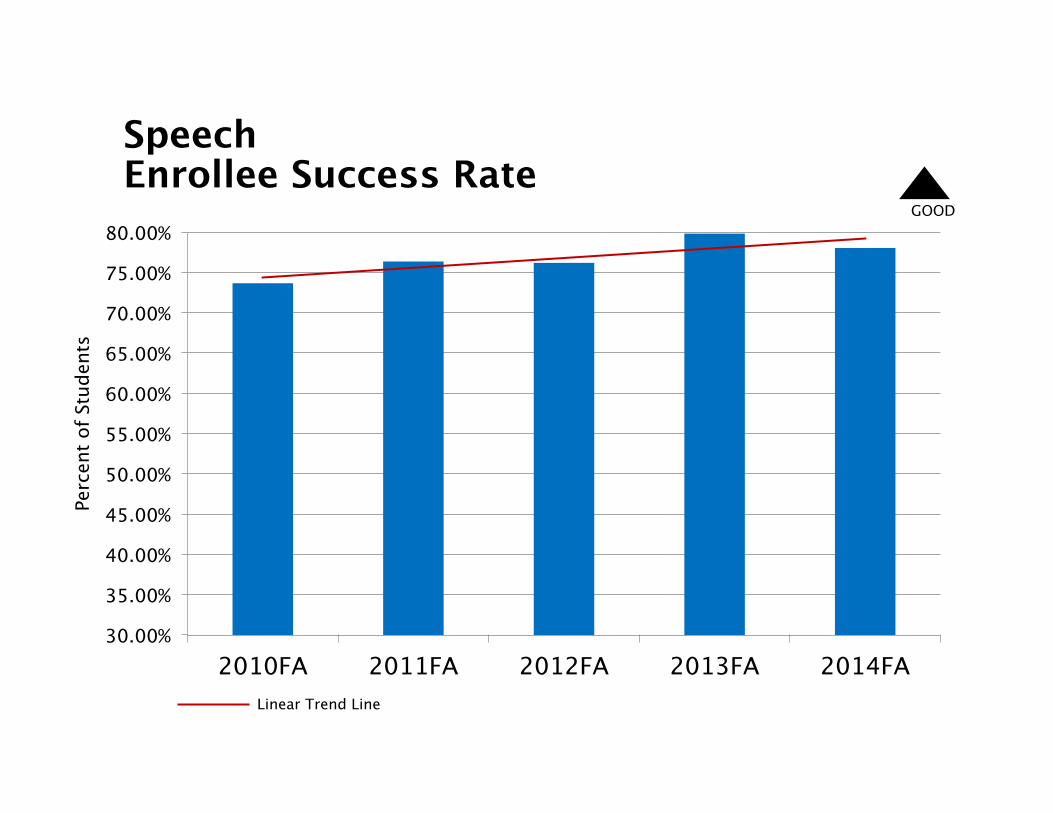
SpeechEnrollee Success Rate
30.00%
35.00%
40.00%
45.00%
50.00%
55.00%
60.00%
65.00%
70.00%
75.00%
80.00%
2010FA 2011FA 2012FA 2013FA 2014FA
GOOD
Linear Trend Line
Perc
ent o
f Stu
dent
s
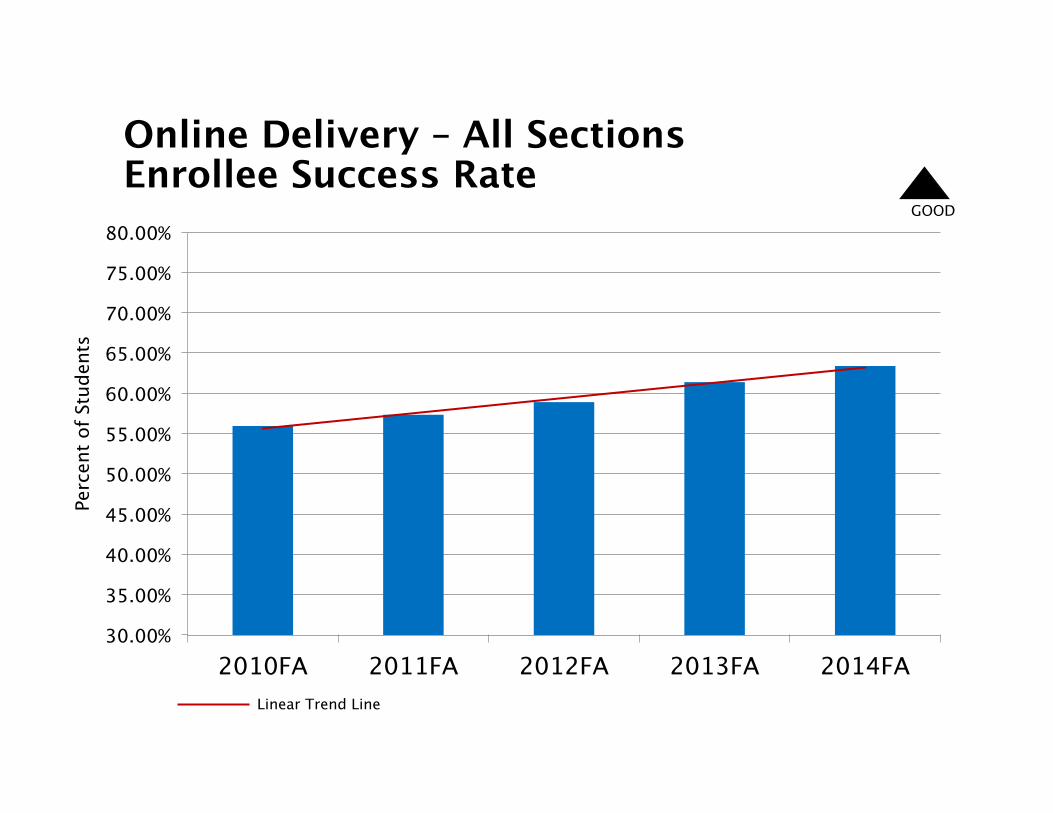
Online Delivery – All Sections Enrollee Success Rate
30.00%
35.00%
40.00%
45.00%
50.00%
55.00%
60.00%
65.00%
70.00%
75.00%
80.00%
2010FA 2011FA 2012FA 2013FA 2014FA
GOOD
Linear Trend Line
Perc
ent o
f Stu
dent
s
QUESTIONS
28
College of DuPage2014 Richard Goodman
Strategic Planning Award Winner
Recommended