State Activities and Emerging Trendsto Advance the Employment of
Adults with Disabilities
New Jersey Adults with Autism Task Force
September 24, 2008
Kathy Krepcio, Executive Director
John J. Heldrich Center for Workforce Development

2
John J. Heldrich Center for Workforce Development
US Employment Rates in 2005 and 2006
Employment Rate for Non-Institutionalized Working Age Adults
(Age 21-64) by Disability Status - 2005 and 2006
Disability Disability
No Disability No Disability
0
20
40
60
80
100
2005 2006
Year
Pe
rc
en
t
Cornell University, RRTC, Disability Statistics 2005, 2006

3
John J. Heldrich Center for Workforce Development
What US Employers Report as Barriers to Employment
Barriers to Employers Hiring People with Disabilities
32
10
1054
12
5
23 Nature of Work
Employer Discomfort
Fear of Cost of Accommodation
Actual Cost of Accommodation
Fear of ADA Litigation
Other
None
Don't Know
Work Trends: Restricted Access 2005
4
John J. Heldrich Center for Workforce Development
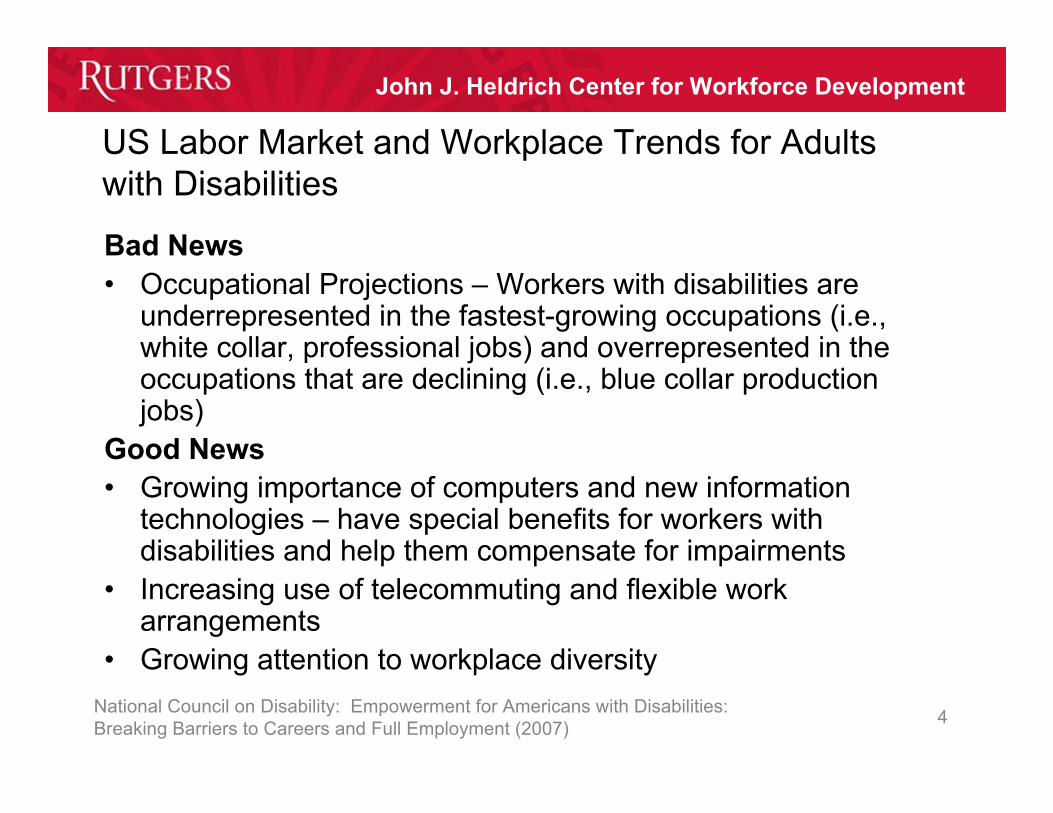
US Labor Market and Workplace Trends for Adultswith Disabilities
Bad News• Occupational Projections – Workers with disabilities are
underrepresented in the fastest-growing occupations (i.e.,white collar, professional jobs) and overrepresented in theoccupations that are declining (i.e., blue collar productionjobs)
Good News• Growing importance of computers and new information
technologies – have special benefits for workers withdisabilities and help them compensate for impairments
• Increasing use of telecommuting and flexible workarrangements
• Growing attention to workplace diversityNational Council on Disability: Empowerment for Americans with Disabilities:Breaking Barriers to Careers and Full Employment (2007)

5
John J. Heldrich Center for Workforce Development
National Systems Change Efforts• Centers for Medicare and Medicaid (CMS)
– Support systems change in Medicaid agencies to improve employment supports• Medicaid Buy Ins (allows states to expand Medicaid coverage to working individuals with disabilities
whose income and assets would otherwise make them ineligible)• Personal Assistance Services• Comprehensive Employment Supports (MIG)
– 41 States currently have a Medicaid Buy-In program (90,000 participants nationally)– 20 states have expanded personal assistance services since 2001– 40 States currently have a Medicaid Infrastructure Grant (MIG) program– Comprehensive MIG grants are intended to connect broader employment services and
supports with Medicaid– Examples of Activities:
• Engaging private businesses and employers• Supporting coordination between public agencies• Benefits and work incentive planning• Education, outreach and training about employment• Research and data gathering and publication
• For more Information: www.cms.hhs.gov/TWWIIA
Center for Workers with Disabilities, 2008

6
John J. Heldrich Center for Workforce Development
National System Change Efforts
• Social Security Administration– Ticket to Work Program
• An employment program that is available to most Social Securitybeneficiaries with disabilities who meet certain criteria
• Goal is to increase opportunities and choices for Social Security disabilitybeneficiaries to obtain employment, vocational rehabilitation and othersupport services from a network of public and private providers, employersand other organizations
• Services are provided to beneficiaries through an Employment Network (EN)provider
• Ticket currently has about 213,000 participants or about 2% of the totaleligible population of beneficiaries (Source: ETR 9-22-08)
• For more information:www.socialsecurity.gov/work/aboutticket.htmlwww.yourtickettowork.com

7
John J. Heldrich Center for Workforce Development
National Systems Change Efforts
• Substance Abuse and Mental Health Services Administration(SAMHSA)– Evidence Based Practices – Helping to Shape Mental Health Services
Toward Recovery• Supported Employment
• For more information: www.mentalhealth.samhsa.gov

8
John J. Heldrich Center for Workforce Development
National Systems Change Efforts
• US Department of Labor– Employment and Training Administration (ETA)
• Disability Program Navigators in State One Stop Centers• Disability Perspective in Regional WIRED Economic Development and
Workforce Development Collaborations– Office of Disability Employment Policy (ODEP)
• Pilots with States on Customized Employment Activities and Self-Employment Activities
• NTAR Leadership Center – pilot State Leaders Innovation Institute (3 states)and State Peer Leaders Network (16 states) – located at the Heldrich Center
• For more information: www.doleta.gov ~ www.dol.gov/odep

9
John J. Heldrich Center for Workforce Development
State Activities and Efforts – Emerging Trends
• Employment First Policies – making integrated employmentthe preferred outcome in DD/MR systems
• Financial Incentives and Funding Diversions to SupportIntegrated Employment
• Engagement with Workforce Development and EconomicDevelopment
• Industry-focused Skills Training and Placement• Customized Employment and Supported Employment• Asset Building and Development• State (and County) as Model Employer• Self Employment and Entrepreneurship Initiatives• Socially Responsive Business Ventures

10
John J. Heldrich Center for Workforce Development
New Jersey Labor Market and Trends• Overall employment has grown by only 2.5%
– Jobs in manufacturing continues to decline (-11% from 2002-2006)– Jobs in knowledge industries continues to increase (+9.2% in professional,
scientific and technical services; +14% in management of companies; and +4in financial services from 2002-2006)
– Service industry jobs are playing a more significant role in NJ’s economy
• Largest employment sectors in NJ (2006)• Health Care and Social Assistance (+ 509,000)• Retail (+465,000)• Educational Services (+343,000)• Manufacturing (+332,000)
• NJ LWD projects that three industry sectors will account for nearly70% of job growth in NJ between 2004 and 2014 – health careand social assistance; professional, scientific and businessservices; and leisure and hospitality.
DiscoverAbility NJ (2007)

11
John J. Heldrich Center for Workforce Development
Employment Rates for Non-Institutionalized WorkingAge Adults (Age 21-64) by Disability Status – RegionalComparison - 2006
77.9%33.5%New York
80.5%34.9%Pennsylvania
79.7%37.7%United States
80.0%38.1%New Jersey
80.6%38.7%Delaware
81.5%42.3%Connecticut
82.9%43.5%Maryland
No DisabilityDisability
Percentage (%)
Cornell University RRTC 2006 Disability Status Report - NJ

12
John J. Heldrich Center for Workforce Development
New Jersey Efforts
• “DiscoverAbility: New Jersey’s Strategic Plan for Creating aComprehensive Employment System for People with Disabilities(www.dhs.state.nj.us/humanservices) ~ New Jersey’s MIG Effort
• Forthcoming COSAC-Heldrich Center “Employment Guide for Adultswith Autism Spectrum Disorder”
• Major Public Employment Programs and Funding Streams– State Vocational Rehabilitation (NJ LWD and NJDHS/CBVI)– NJ’s Medicaid Buy-In Program ~ NJ WorkAbility– One Stop Career Centers and Disability Program Navigators (NJ LWD)– Employment Services and Training through the NJ Department of Human
Services (NJDHS)• Developmental Disabilities• Mental Health Services• Disability Services• Commission for the Blind and Visually Impaired

13
John J. Heldrich Center for Workforce Development
Questions
Recommended