Spatially Separated Markets
AG BM 102
Introduction
• Interregional competition is an important part of agriculture
• How can they afford to ship those potatoes all the way from Idaho? Can’t we compete with our potatoes?
• If energy prices rise, will our peach industry be more competitive?
• Why isn’t Pennsylvania more self-sufficient in food production?
Basic situation
• Two regions – west & east
• Each has a supply, each has a demand
• With no trade, each would be self-sufficient in this crop – potatoes
• With trade, part of the eastern market is served by western potatoes.
Some Intuition
• Potato price in west without trade is $5/cwt.
• Potato price in east without trade is $11/cwt.
• Costs $1 per cwt to ship potatoes across country – either way.
• Could you buy potatoes in east and sell them in west?
Intuition (cont.)
• How much would you make?
• Could you buy potatoes in west and sell them in the east?
• How much would you make?
• If you did, what would happen to the price in the east?
• What would happen to the price in the west?
Intuition (cont.)
• At what point would you quit shipping potatoes?
• Why?
• America now has one big potato market
• P east = P west + freight
• Total Quantity Demanded = Total Quantity Supplied
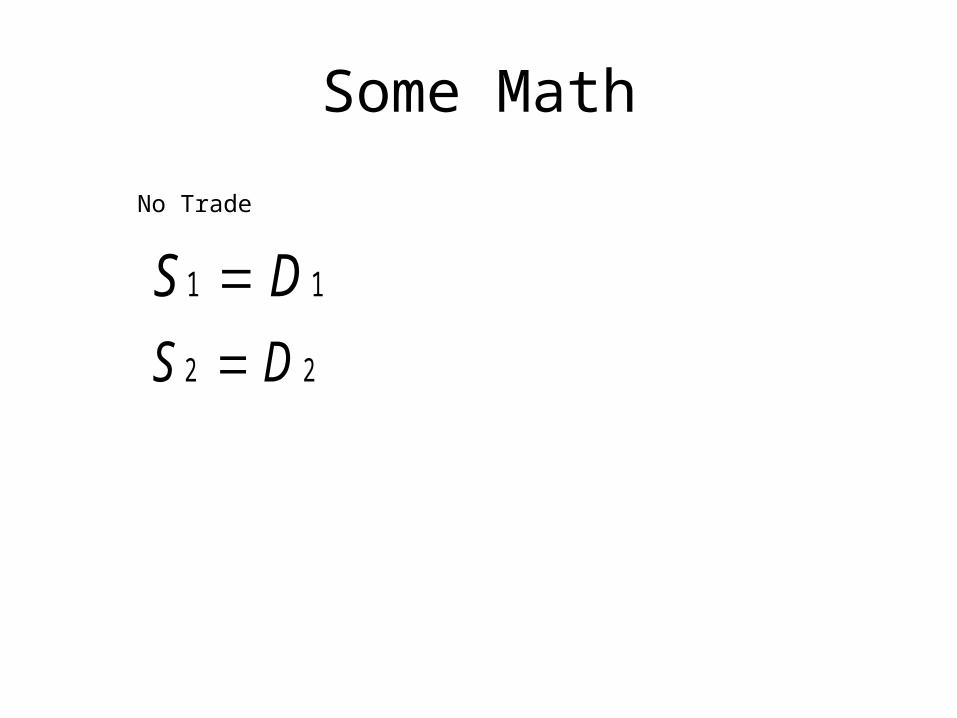
Some Math
S D1 1S D2 2
No Trade
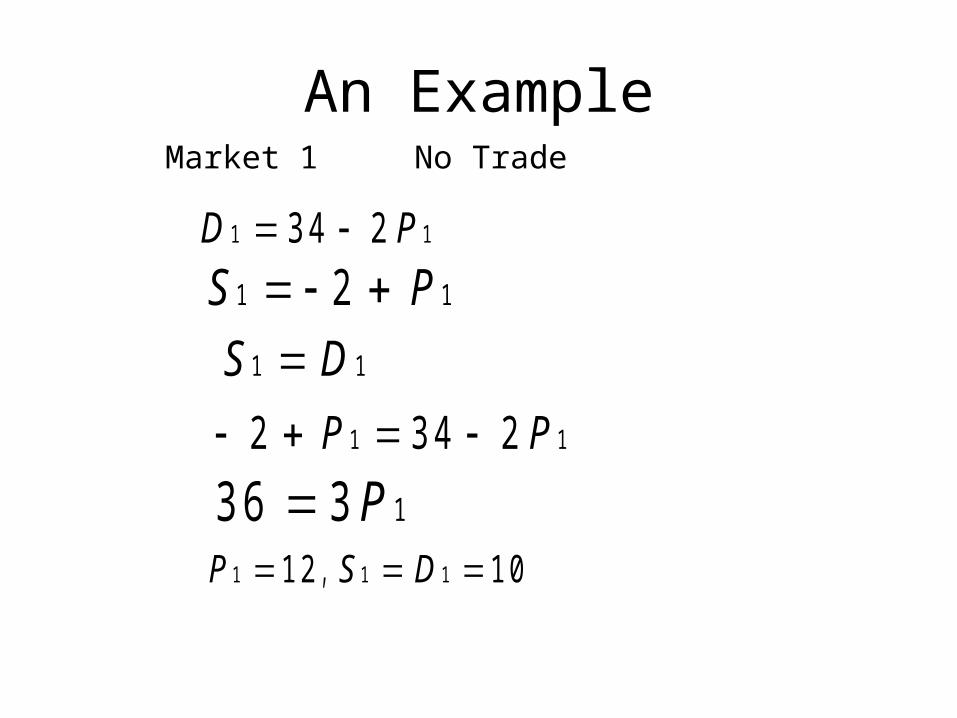
An Example
D P1 13 4 2 S P1 12 S D1 1
3 6 3 1 PP S D1 1 11 2 1 0 ,
Market 1 No Trade
2 3 4 21 1P P
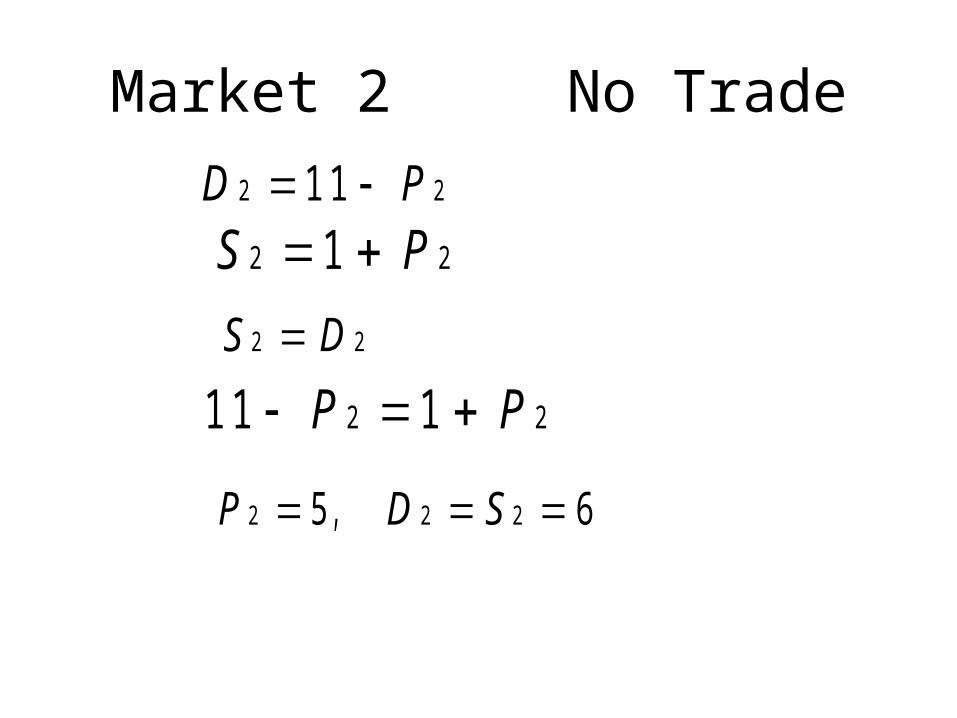
Market 2 No Trade
P D S2 2 25 6 ,
11 12 2 P P
S P2 21 D P2 211
S D2 2
Things to Notice
• Market 1 has a higher price than market 2
• The price difference is greater than the transport price, which is $2
• So, someone could buy in market 2 at $5, ship to market 1 at a cost of $2, and sell it for $12 and make money
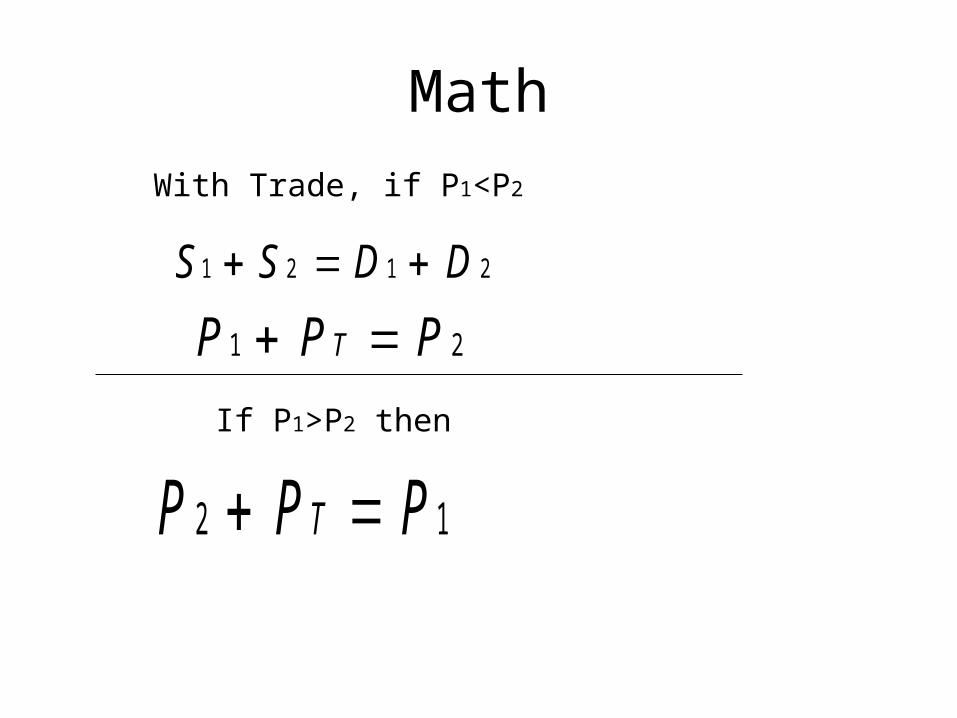
Math
S S D D1 2 1 2
P P PT1 2
With Trade, if P1<P2
P P PT2 1 If P1>P2 then
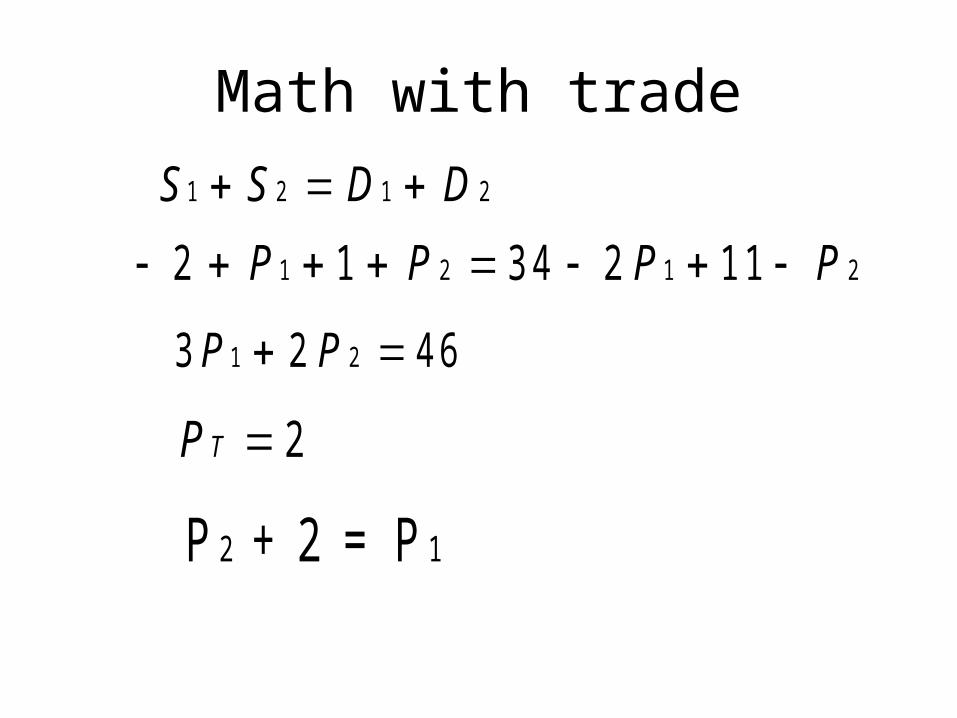
Math with trade
S S D D1 2 1 2
2 1 3 4 2 111 2 1 2P P P P
P T 2
P + 2 = P2 1
3 2 4 61 2P P
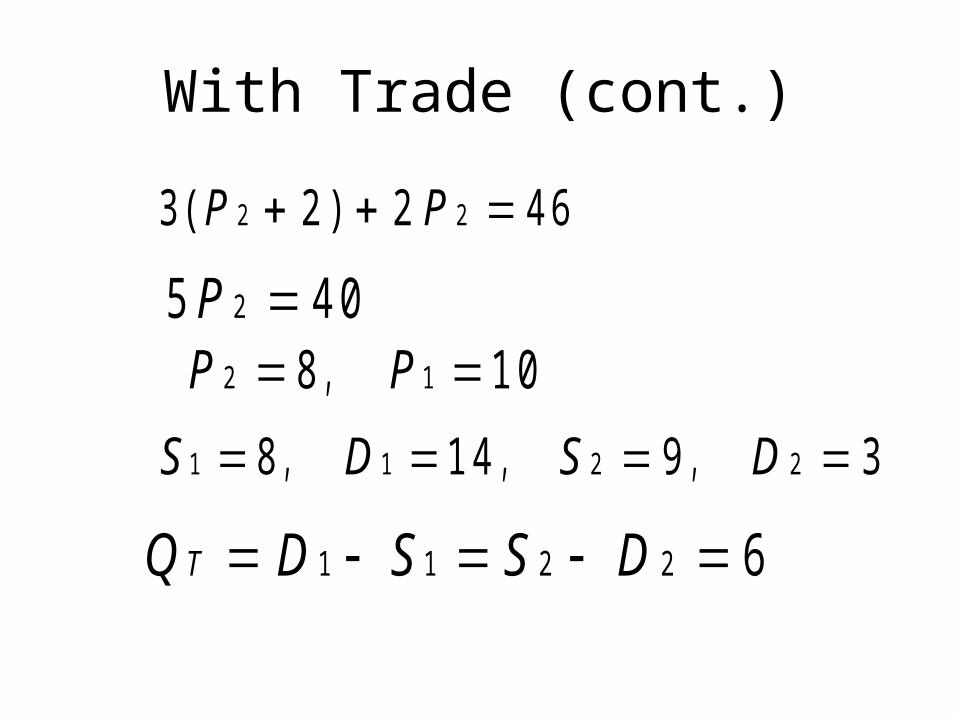
With Trade (cont.)
3 2 2 4 62 2( )P P
5 4 02P P P2 18 1 0 ,
S D S D1 1 2 28 1 4 9 3 , , ,
Q D S S DT 1 1 2 2 6
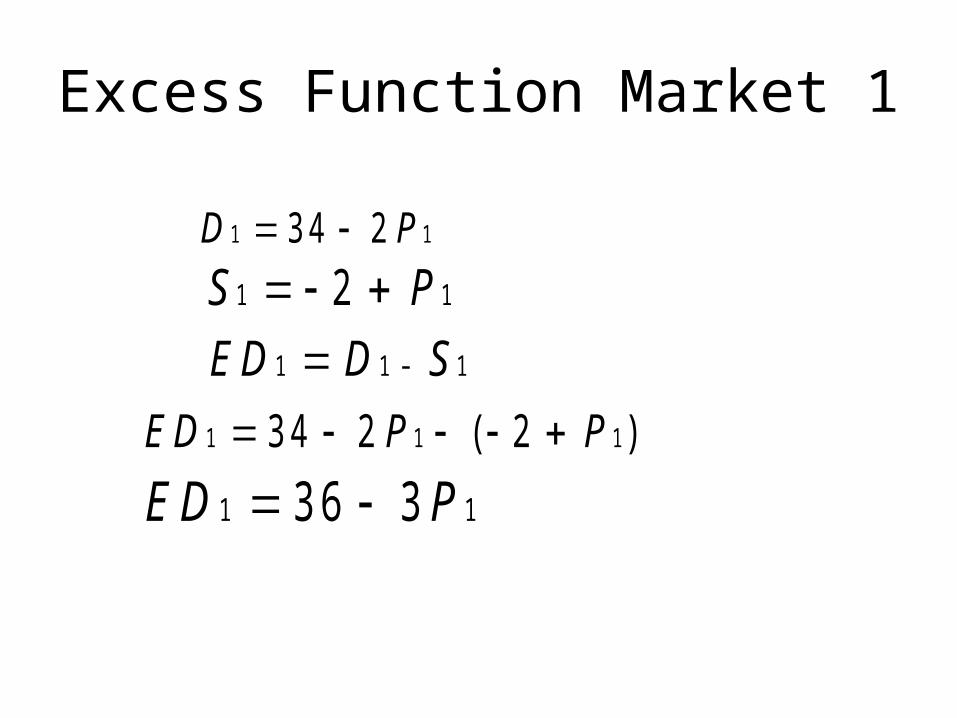
Excess Function Market 1
D P1 13 4 2 S P1 12 ED D S1 1 1
ED P1 13 6 3 ED P P1 1 13 4 2 2 ( )
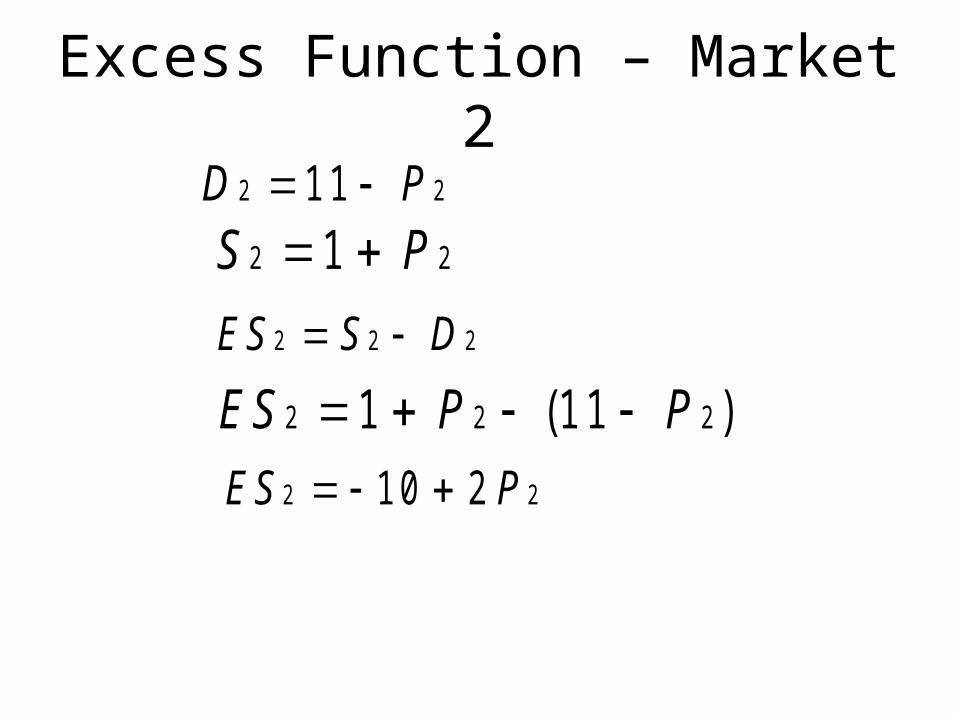
Excess Function – Market 2
ES P P2 2 21 11 ( )
S P2 21 D P2 211
ES S D2 2 2
ES P2 21 0 2
Steps for solving
• Solve without trade
• Find high-priced market (h) and low priced market (l)
• Ph = Pl + Pt
• Sh + Sl = Dh + Dl
• Substitute in values and solve for Prices and quantities
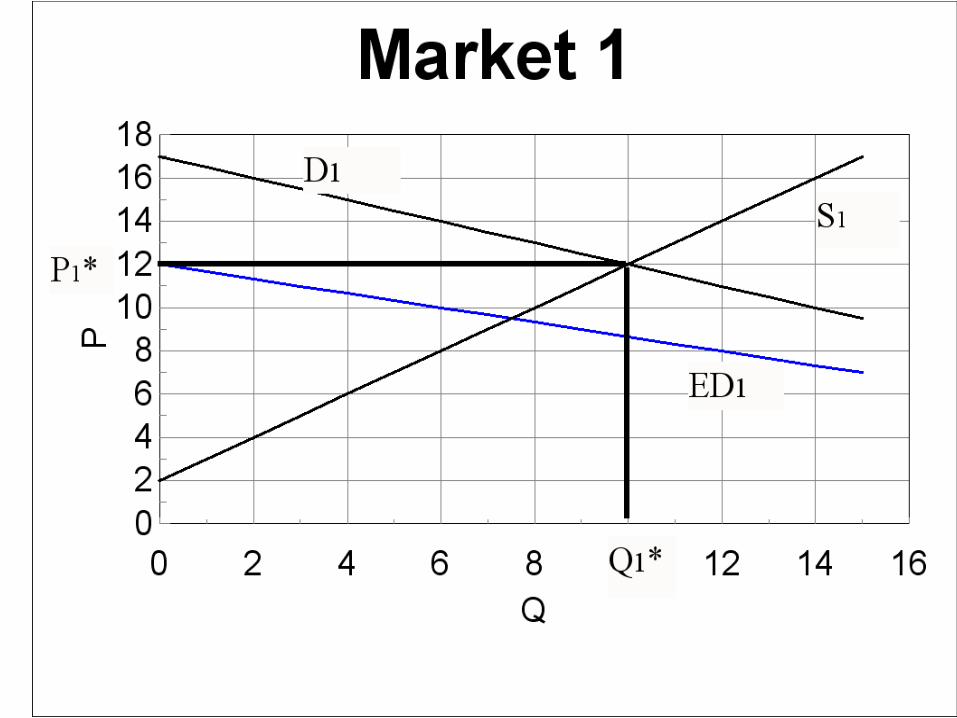
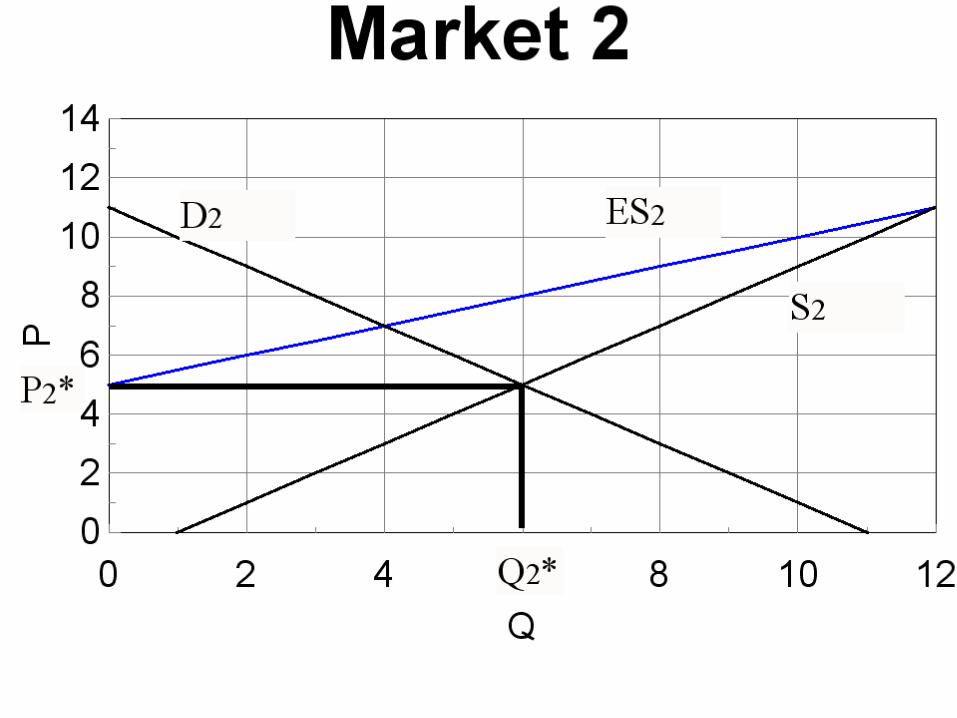
How to do graphs
• You need three graphs: market 1, market 2, and trade
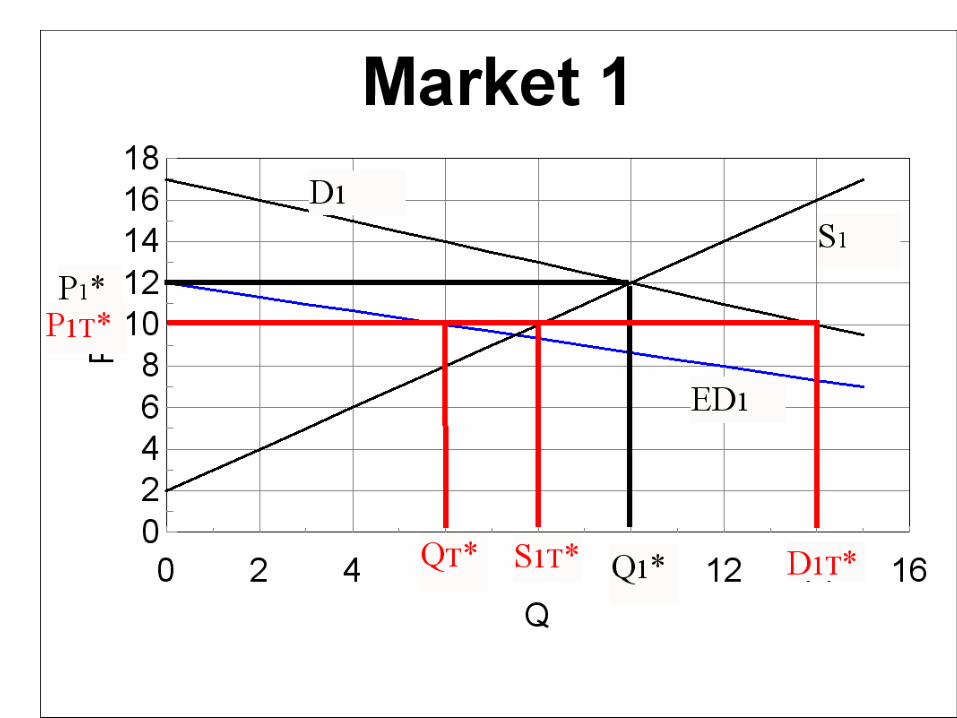
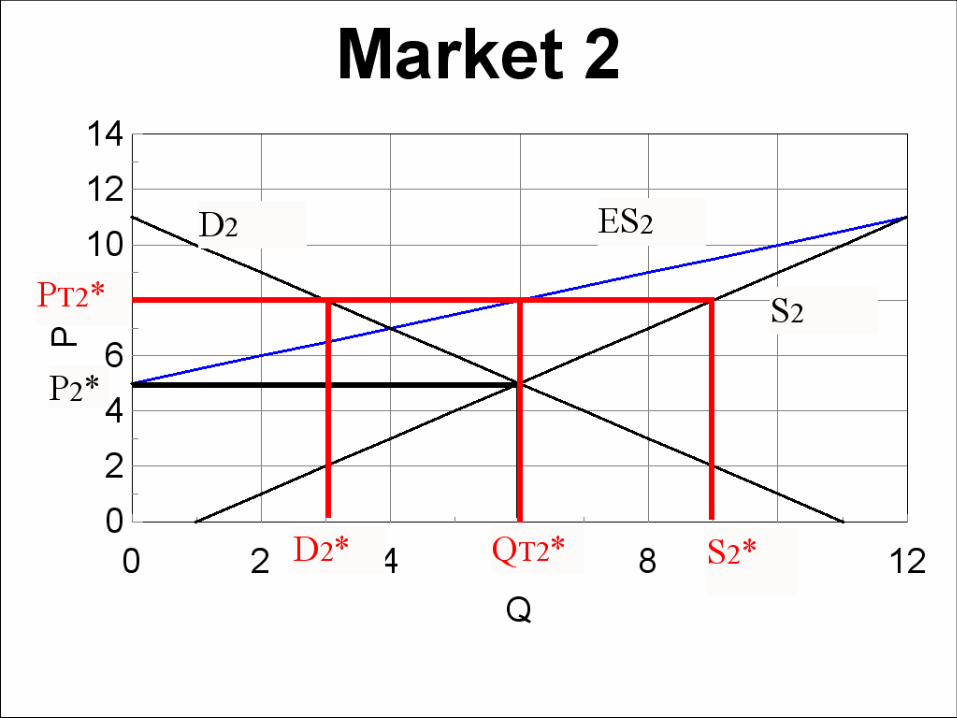
• Put the supply and demand curves on market 1 & 2 graphs
• Put excess demand on the graph for the high priced market
• Put excess supply on the graph for the low priced market
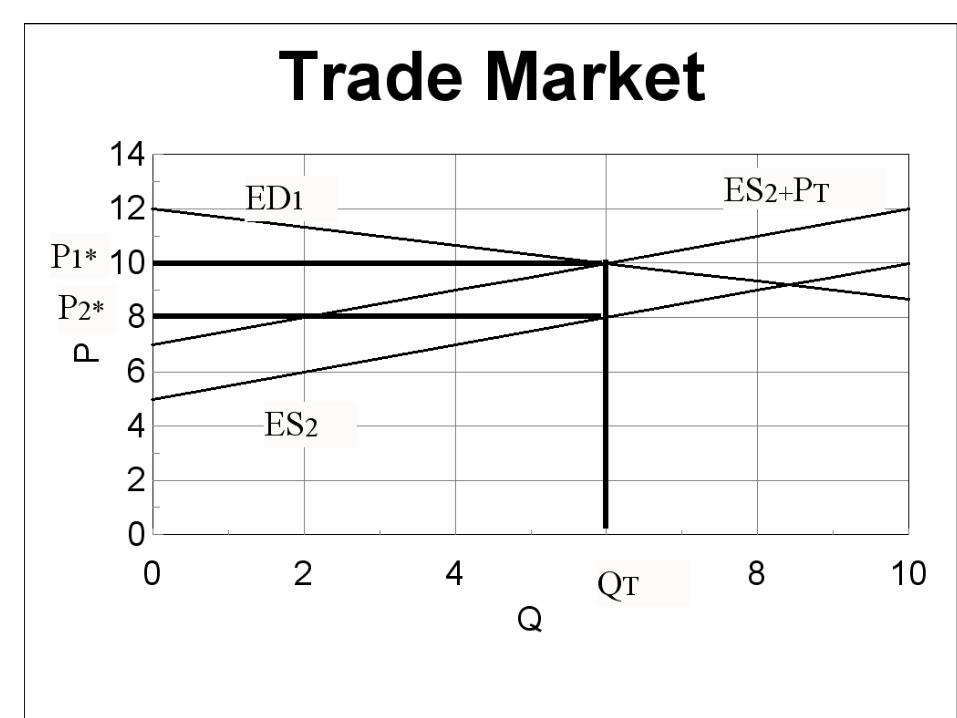
• Put excess demand and excess supply on the trade graph
• Add the transportation cost to the excess supply curve
• Where this line crossed excess demand determines the price in the high priced market with trade and the quantity traded
• At that quantity, the price in the low priced market is where it crosses excess supply
• Plot the with trade prices on each market’s graph and identify quantity supplied, quantity demanded and quantity traded
Remember the excess demand is always the high priced market
and excess supply the low prices market
Concluding Comments
• Concept is easy – Price differences encourage trade
• Trade pushes prices closer together- until price difference equals transport costs
• Math and graphs are more complicated
• Our whole economy depends on this
• Every meal we eat reflects it
Recommended