Wednesday, 15th Dec'10Wednesday, 15th Dec'10Social impacts of using Social impacts of using
Internet among the adults Internet among the adults
Social impacts of using Social impacts of using Internet among the adults Internet among the adults
Group Members:Group Members:1.1.Md. Habibur Rahman Md. Habibur Rahman BIT 02 16BIT 02 16
2.2.Md. Shahriar ShaonMd. Shahriar Shaon BIT 02 19BIT 02 19
3.3.Md. Mahmudul HasanMd. Mahmudul HasanBIT 02 23BIT 02 23
4.4.Md. Rayhan HossainMd. Rayhan Hossain BIT 02 26BIT 02 26
11 of 49 of 49

Wednesday, 15th Wednesday, 15th Dec'10Dec'10
Social impacts of using Social impacts of using Internet among the adults Internet among the adults
Topics to be discussed:Topics to be discussed: What is SPSS?What is SPSS? About our topic About our topic About Variables About Variables Case Analysis and Interpretation Case Analysis and Interpretation ConclusionConclusion
22 of 49 of 49

Wednesday, 15th Wednesday, 15th Dec'10Dec'10
Social impacts of using Social impacts of using Internet among the adults Internet among the adults
What is SPSS?What is SPSS?
SPSS (Statistical Package for the Social Science)SPSS (Statistical Package for the Social Science)
SPSSSPSS is a computer program used for statistical is a computer program used for statistical
analysisanalysis SPSS for windows is a computer package that will SPSS for windows is a computer package that will
perform a wide variety of statistical procedures.perform a wide variety of statistical procedures. Data management and analysis can be handled well Data management and analysis can be handled well
with SPSS.with SPSS. Using SPSS we can manipulate data, make graphs Using SPSS we can manipulate data, make graphs
and perform statistical techniques varying from and perform statistical techniques varying from means to regressionmeans to regression
33 of 49 of 49

Wednesday, 15th Wednesday, 15th Dec'10Dec'10
Social impacts of using Social impacts of using Internet among the adults Internet among the adults
Working procedure for Analysis:Working procedure for Analysis:
Taking raw data
Summarizing the data
Presenting the data
Taking the data to SPSS format file
Analyzing the data
Getting output
44 of 49 of 49

About our topic About our topic
Wednesday, 15th Wednesday, 15th Dec'10Dec'10
Social impacts of using Social impacts of using Internet among the adults Internet among the adults
GSSNET – Study of use of internet and its effects on adults
55 of 49 of 49

Why this topicWhy this topic
--This is an era of internet & information This is an era of internet & information technologytechnology
--In order to have statistically analyzed data about In order to have statistically analyzed data about the use of internetthe use of internet
-In order to analyze the impacts for using -In order to analyze the impacts for using internet with different statistical test.internet with different statistical test.
Wednesday, 15th Wednesday, 15th Dec'10Dec'10
Social impacts of using Social impacts of using Internet among the adults Internet among the adults 66 of 49 of 49

Variable Analysis Variable Analysis
AndAnd
InterpretationInterpretationWednesday, 15th Wednesday, 15th Dec'10Dec'10
Social impacts of using Social impacts of using Internet among the adults Internet among the adults 77 of 49 of 49

Name of the variables and their Name of the variables and their typestypes
Variable Name Type
Age Quantitative
Age category Categorical
Sex Qualitative
Search engine name Categorical
Hours of TV Watching Quantitative
Usenet? Categorical
Happiness of marriage Qualitative
General happiness Qualitative
Respondents income Categorical
Marital status Categorical
Belief in post life Categorical
Vote in election in 1996 Categorical
Educational status Qualitative
Wednesday, 15th Wednesday, 15th Dec'10Dec'10
Social impacts of using Social impacts of using Internet among the adults Internet among the adults 88 of 49 of 49

UnivariateUnivariate
AnalysisAnalysis
Wednesday, 15th Wednesday, 15th Dec'10Dec'10
Social impacts of using Social impacts of using Internet among the adults Internet among the adults 99 of 49 of 49

Age of the Age of the respondents(age)respondents(age)
Wednesday, 15th Wednesday, 15th Dec'10Dec'10
Social impacts of using Social impacts of using Internet among the adults Internet among the adults
Statistics
Age of respondent1417
2
Valid
Missing
N
Case Processing Summary
Case Summaries
Age of respondent
1417 46.56 44.00 18 89 17.330 300.341N Mean Median Minimum Maximum Std. Deviation Variance
1010 of 49 of 49

Age categoriesAge categories( )agecat( )agecat
Wednesday, 15th Wednesday, 15th Dec'10Dec'10
Social impacts of using Social impacts of using Internet among the adults Internet among the adults
23.7%
14.9%
21.6%
21.9%
17.7%
.1%
60-89
50-59
40-49
30-39
18-29
Missing
1111 of 49 of 49

Respondent’s GenderRespondent’s Gender( )sex( )sex
Wednesday, 15th Wednesday, 15th Dec'10Dec'10
Social impacts of using Social impacts of using Internet among the adults Internet among the adults
56.2%
43.8%
Female
Male
1212 of 49 of 49

Educational levelEducational level( )degree( )degree
Wednesday, 15th Wednesday, 15th Dec'10Dec'10
Social impacts of using Social impacts of using Internet among the adults Internet among the adults
7.5%
16.6%
7.1%
51.1%
17.1%
.6%Graduate
Bachelor
Junior college
High school
Less than HS
Missing
1313 of 49 of 49

Internet Usage CategoryInternet Usage Category
Wednesday, 15th Wednesday, 15th Dec'10Dec'10
Social impacts of using Social impacts of using Internet among the adults Internet among the adults
Internet usage category
More than 10
4+ to 10 hours
1+ to 4 hours
One hour or less
Missing
Pe
rce
nt
60
50
40
30
20
10
0
1414 of 49 of 49

Uses Internet or not?Uses Internet or not?
Wednesday, 15th Wednesday, 15th Dec'10Dec'10
Social impacts of using Social impacts of using Internet among the adults Internet among the adults
46.1%
51.7%
2.2%
Yes
No
Missing
1515 of 49 of 49

Search Engines Search Engines NameName( 2)srch( 2)srch
Wednesday, 15th Wednesday, 15th Dec'10Dec'10
Social impacts of using Social impacts of using Internet among the adults Internet among the adults
5.8%
1.1%
1.2%
1.8%
16.2%
73.9%
Other
Excite
Altavista
Lycos
Yahoo
Missing
1616 of 49 of 49

Hours per day watching Hours per day watching TV?(tvhrs)TV?(tvhrs)
Wednesday, 15th Wednesday, 15th Dec'10Dec'10
Social impacts of using Social impacts of using Internet among the adults Internet among the adults
Statistics
Hours per day watching TV906
513
3.00
2.00
2
0
24
Valid
Missing
N
Mean
Median
Mode
Minimum
Maximum
Hours per day watching TV
25.022.520.017.515.012.510.07.55.02.50.0
500
400
300
200
100
0
Std. Dev = 2.56
Mean = 3.0
N = 906.00
1717 of 49 of 49

Respondent’s income for Respondent’s income for last year(rincome)last year(rincome)
Wednesday, 15th Wednesday, 15th Dec'10Dec'10
Social impacts of using Social impacts of using Internet among the adults Internet among the adults
45.9%
5.1%
7.3%
6.6%
5.1%
30.0%
Other
REFUSED
$40000 TO 49999
$30000 TO 34999
$25000 TO 29999
Missing
1818 of 49 of 49

Marital statusMarital status( )marital( )marital
Wednesday, 15th Wednesday, 15th Dec'10Dec'10
Social impacts of using Social impacts of using Internet among the adults Internet among the adults
25.4%
4.0%
16.2%
9.9%
44.5%
NEVER MARRIED
SEPARATED
DIVORCED
WIDOWED
MARRIED
1919 of 49 of 49

Belief in life after Belief in life after deathdeath( )postlife( )postlife
Wednesday, 15th Wednesday, 15th Dec'10Dec'10
Social impacts of using Social impacts of using Internet among the adults Internet among the adults
NO
YES
Missing
2020 of 49 of 49

Voted in 1996 or not?Voted in 1996 or not?( 96)vote( 96)vote
Wednesday, 15th Wednesday, 15th Dec'10Dec'10
Social impacts of using Social impacts of using Internet among the adults Internet among the adults
3.2%
6.5%
27.8%
62.5%
Other
INELIGIBLE
DID NOT VOTE
VOTED
2121 of 49 of 49

BivariateBivariate
AnalysesAnalyses
Wednesday, 15th Wednesday, 15th Dec'10Dec'10
Social impacts of using Social impacts of using Internet among the adults Internet among the adults 2222 of 49 of 49

Any relationship between Any relationship between Age category and using Age category and using
netnetBoth the variables are Both the variables are
categorical. categorical.
Cross tabsCross tabs
Wednesday, 15th Wednesday, 15th Dec'10Dec'10
Social impacts of using Social impacts of using Internet among the adults Internet among the adults
Age category * Use Internet? Crosstabulation
Count
100 144 244
121 186 307
133 162 295
105 104 209
275 57 332
734 653 1387
18-29
30-39
40-49
50-59
60-89
Agecategory
Total
No Yes
Use Internet?
Total
Chi-Square Tests
163.524a 4 .000
175.744 4 .000
122.059 1 .000
1387
Pearson Chi-Square
Likelihood Ratio
Linear-by-LinearAssociation
N of Valid Cases
Value dfAsymp. Sig.
(2-sided)
0 cells (.0%) have expected count less than 5. Theminimum expected count is 98.40.
a.
2323 of 49 of 49
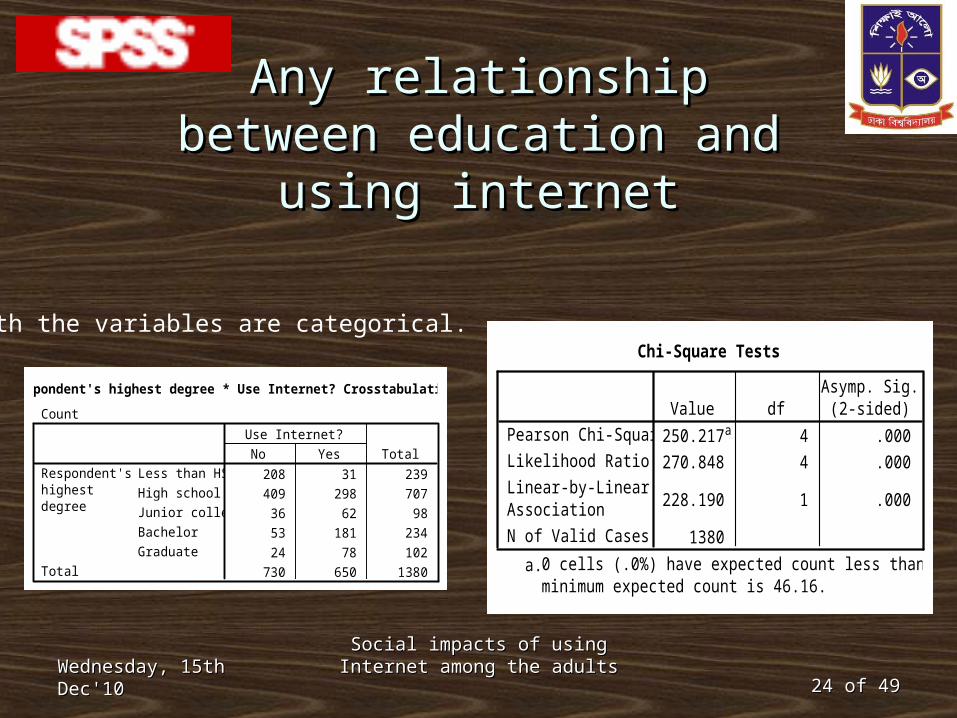
Any relationship between Any relationship between education and using education and using
internetinternet
Wednesday, 15th Wednesday, 15th Dec'10Dec'10
Social impacts of using Social impacts of using Internet among the adults Internet among the adults
Respondent's highest degree * Use Internet? Crosstabulation
Count
208 31 239
409 298 707
36 62 98
53 181 234
24 78 102
730 650 1380
Less than HS
High school
Junior college
Bachelor
Graduate
Respondent'shighestdegree
Total
No Yes
Use Internet?
Total
Chi-Square Tests
250.217a 4 .000
270.848 4 .000
228.190 1 .000
1380
Pearson Chi-Square
Likelihood Ratio
Linear-by-LinearAssociation
N of Valid Cases
Value dfAsymp. Sig.
(2-sided)
0 cells (.0%) have expected count less than 5. Theminimum expected count is 46.16.
a.
Both the variables are categorical.
2424 of 49 of 49

Pearson’s Chi square test’s p-value is less Pearson’s Chi square test’s p-value is less than level of significance(0.025). So there than level of significance(0.025). So there exists significant relationship between exists significant relationship between them. them.
Wednesday, 15th Wednesday, 15th Dec'10Dec'10
Social impacts of using Social impacts of using Internet among the adults Internet among the adults 2525 of 49 of 49

Relationship between Relationship between Gender and using netGender and using net
Both the variables are categorical. Both the variables are categorical.
Crosstabs-Crosstabs-
Wednesday, 15th Wednesday, 15th Dec'10Dec'10
Social impacts of using Social impacts of using Internet among the adults Internet among the adults
Respondent's sex * Use Internet? Crosstabulation
Count
303 306 609
431 348 779
734 654 1388
Male
Female
Respondent'ssex
Total
No Yes
Use Internet?
Total
2626 of 49 of 49

(Continued)(Continued)
Wednesday, 15th Wednesday, 15th Dec'10Dec'10
Social impacts of using Social impacts of using Internet among the adults Internet among the adults
Chi-Square Tests
4.261b 1 .039
4.041 1 .044
4.261 1 .039
.040 .022
4.258 1 .039
1388
Pearson Chi-Square
Continuity Correctiona
Likelihood Ratio
Fisher's Exact Test
Linear-by-LinearAssociation
N of Valid Cases
Value dfAsymp. Sig.
(2-sided)Exact Sig.(2-sided)
Exact Sig.(1-sided)
Computed only for a 2x2 tablea.
0 cells (.0%) have expected count less than 5. The minimum expected count is286.95.
b.
2727 of 49 of 49

(Continued)(Continued)
Logistic regression analysisLogistic regression analysis
We decide- the usage of internet among the male is .8 times We decide- the usage of internet among the male is .8 times than the female.than the female.
Wednesday, 15th Wednesday, 15th Dec'10Dec'10
Social impacts of using Social impacts of using Internet among the adults Internet among the adults
Variables in the Equation
-.224 .108 4.257 1 .039 .800
.010 .081 .015 1 .903 1.010
SEX(1)
Constant
Step1
a
B S.E. Wald df Sig. Exp(B)
Variable(s) entered on step 1: SEX.a.
2828 of 49 of 49

Marital status vs. using Marital status vs. using internetinternet
Both the variables Both the variables are categorical.are categorical.
Wednesday, 15th Wednesday, 15th Dec'10Dec'10
Social impacts of using Social impacts of using Internet among the adults Internet among the adults
MARITAL STATUS * Use Internet? Crosstabulation
Count
303 316 619
116 20 136
112 112 224
42 15 57
161 191 352
734 654 1388
MARRIED
WIDOWED
DIVORCED
SEPARATED
NEVER MARRIED
MARITALSTATUS
Total
No Yes
Use Internet?
Total
Chi-Square Tests
79.036a 4 .000
86.492 4 .000
1.206 1 .272
1388
Pearson Chi-Square
Likelihood Ratio
Linear-by-LinearAssociation
N of Valid Cases
Value dfAsymp. Sig.
(2-sided)
0 cells (.0%) have expected count less than 5. Theminimum expected count is 26.86.
a.
2929 of 49 of 49

(Continued)(Continued)
Wednesday, 15th Wednesday, 15th Dec'10Dec'10
Social impacts of using Social impacts of using Internet among the adults Internet among the adults
we decide- the internet use of unmarried guys we decide- the internet use of unmarried guys are 33% more than the married. are 33% more than the married.
Variables in the Equation
.285 .108 6.920 1 .009 1.330
-.243 .073 11.192 1 .001 .784
MARRIED(1)
Constant
Step1
a
B S.E. Wald df Sig. Exp(B)
Variable(s) entered on step 1: MARRIED.a.
3030 of 49 of 49

Age category vs. net usage Age category vs. net usage categorycategory
Wednesday, 15th Wednesday, 15th Dec'10Dec'10
Social impacts of using Social impacts of using Internet among the adults Internet among the adults
Chi-Square Tests
21.787a 12 .040
22.024 12 .037
.040 1 .842
648
Pearson Chi-Square
Likelihood Ratio
Linear-by-LinearAssociation
N of Valid Cases
Value dfAsymp. Sig.
(2-sided)
0 cells (.0%) have expected count less than 5. Theminimum expected count is 9.24.
a.
3131 of 49 of 49

Pearson’s Chi square test’s p-value is Pearson’s Chi square test’s p-value is more than level of significance(0.025). So more than level of significance(0.025). So there exists no significant relationship there exists no significant relationship between them. between them.
Wednesday, 15th Wednesday, 15th Dec'10Dec'10
Social impacts of using Social impacts of using Internet among the adults Internet among the adults 3232 of 49 of 49

Respondent’s highest Respondent’s highest degree vs. net usage degree vs. net usage
categorycategory
Wednesday, 15th Wednesday, 15th Dec'10Dec'10
Social impacts of using Social impacts of using Internet among the adults Internet among the adults
Chi-Square Tests
22.208a 12 .035
22.681 12 .031
10.566 1 .001
645
Pearson Chi-Square
Likelihood Ratio
Linear-by-LinearAssociation
N of Valid Cases
Value dfAsymp. Sig.
(2-sided)
1 cells (5.0%) have expected count less than 5. Theminimum expected count is 4.95.
a.
3333 of 49 of 49

Pearson’s Chi square test’s p-value is Pearson’s Chi square test’s p-value is more than level of significance(0.025). So more than level of significance(0.025). So there exists no significant relationship there exists no significant relationship between them. between them.
Wednesday, 15th Wednesday, 15th Dec'10Dec'10
Social impacts of using Social impacts of using Internet among the adults Internet among the adults 3434 of 49 of 49

Sex vs. net usage categorySex vs. net usage category
Wednesday, 15th Wednesday, 15th Dec'10Dec'10
Social impacts of using Social impacts of using Internet among the adults Internet among the adults
Chi-Square Tests
8.716a 3 .033
8.720 3 .033
2.870 1 .090
649
Pearson Chi-Square
Likelihood Ratio
Linear-by-LinearAssociation
N of Valid Cases
Value dfAsymp. Sig.
(2-sided)
0 cells (.0%) have expected count less than 5. Theminimum expected count is 49.65.
a.
3535 of 49 of 49

Pearson’s Chi square test’s p-value is Pearson’s Chi square test’s p-value is more than level of significance(0.025). So more than level of significance(0.025). So there exists no significant relationship there exists no significant relationship between them. between them.
Wednesday, 15th Wednesday, 15th Dec'10Dec'10
Social impacts of using Social impacts of using Internet among the adults Internet among the adults 3636 of 49 of 49

Using net vs. happiness of Using net vs. happiness of marriagemarriage
Wednesday, 15th Wednesday, 15th Dec'10Dec'10
Social impacts of using Social impacts of using Internet among the adults Internet among the adults
Chi-Square Tests
7.055a 2 .029
7.068 2 .029
5.926 1 .015
612
Pearson Chi-Square
Likelihood Ratio
Linear-by-LinearAssociation
N of Valid Cases
Value dfAsymp. Sig.
(2-sided)
0 cells (.0%) have expected count less than 5. Theminimum expected count is 11.80.
a.
3737 of 49 of 49

Pearson’s Chi square test’s p-value is Pearson’s Chi square test’s p-value is more than level of significance(0.025). So more than level of significance(0.025). So there exists no significant relationship there exists no significant relationship between them. between them.
Wednesday, 15th Wednesday, 15th Dec'10Dec'10
Social impacts of using Social impacts of using Internet among the adults Internet among the adults 3838 of 49 of 49

Using net vs. happiness of Using net vs. happiness of life life
Wednesday, 15th Wednesday, 15th Dec'10Dec'10
Social impacts of using Social impacts of using Internet among the adults Internet among the adults
Chi-Square Tests
28.707a 2 .000
29.898 2 .000
14.668 1 .000
1360
Pearson Chi-Square
Likelihood Ratio
Linear-by-LinearAssociation
N of Valid Cases
Value dfAsymp. Sig.
(2-sided)
0 cells (.0%) have expected count less than 5. Theminimum expected count is 73.41.
a.
3939 of 49 of 49

Pearson’s Chi square test’s p-value is less Pearson’s Chi square test’s p-value is less than level of significance(0.025). So there than level of significance(0.025). So there exists significant relationship between exists significant relationship between them. them.
Wednesday, 15th Wednesday, 15th Dec'10Dec'10
Social impacts of using Social impacts of using Internet among the adults Internet among the adults 4040 of 49 of 49
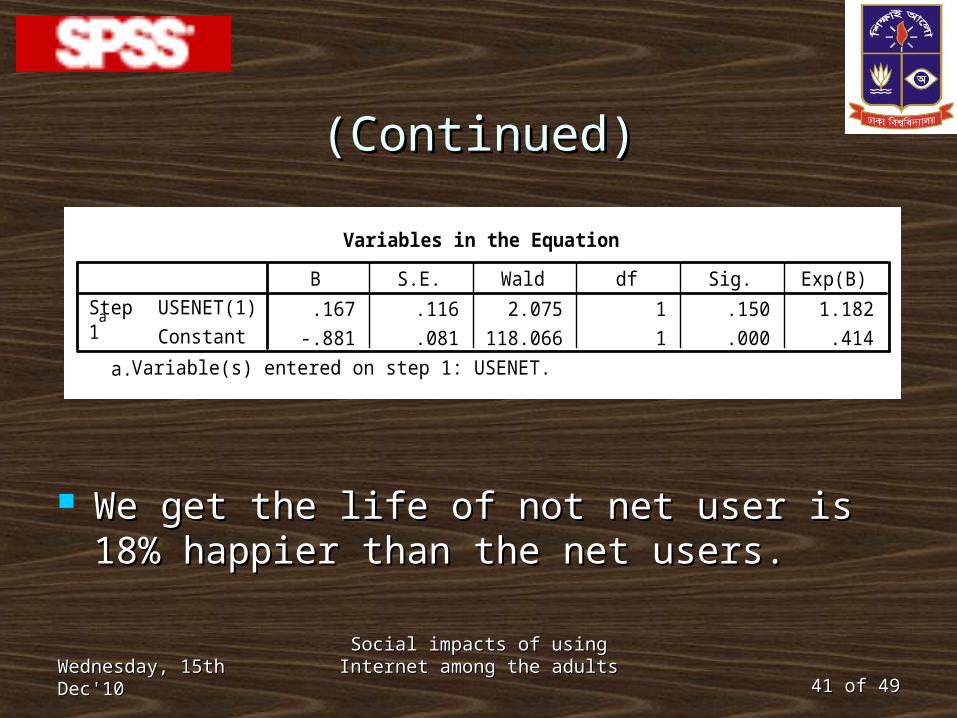
(Continued)(Continued)
Wednesday, 15th Wednesday, 15th Dec'10Dec'10
Social impacts of using Social impacts of using Internet among the adults Internet among the adults
We get the life of not net user is 18% We get the life of not net user is 18% happier than the net users.happier than the net users.
Variables in the Equation
.167 .116 2.075 1 .150 1.182
-.881 .081 118.066 1 .000 .414
USENET(1)
Constant
Step1
a
B S.E. Wald df Sig. Exp(B)
Variable(s) entered on step 1: USENET.a.
4141 of 49 of 49

Using net vs. belief in life Using net vs. belief in life after deathafter death
Wednesday, 15th Wednesday, 15th Dec'10Dec'10
Social impacts of using Social impacts of using Internet among the adults Internet among the adults
Chi-Square Tests
1.800b 1 .180
1.560 1 .212
1.808 1 .179
.196 .106
1.798 1 .180
815
Pearson Chi-Square
Continuity Correctiona
Likelihood Ratio
Fisher's Exact Test
Linear-by-LinearAssociation
N of Valid Cases
Value dfAsymp. Sig.
(2-sided)Exact Sig.(2-sided)
Exact Sig.(1-sided)
Computed only for a 2x2 tablea.
0 cells (.0%) have expected count less than 5. The minimum expected count is67.25.
b.
4242 of 49 of 49

Pearson’s Chi square test’s p-value is Pearson’s Chi square test’s p-value is more than level of significance(0.025). So more than level of significance(0.025). So there exists no significant relationship there exists no significant relationship between them. between them.
Wednesday, 15th Wednesday, 15th Dec'10Dec'10
Social impacts of using Social impacts of using Internet among the adults Internet among the adults 4343 of 49 of 49

Using net vs. voted in Using net vs. voted in election in 1996election in 1996
Wednesday, 15th Wednesday, 15th Dec'10Dec'10
Social impacts of using Social impacts of using Internet among the adults Internet among the adults
Chi-Square Tests
35.044a 3 .000
35.495 3 .000
11.538 1 .001
1348
Pearson Chi-Square
Likelihood Ratio
Linear-by-LinearAssociation
N of Valid Cases
Value dfAsymp. Sig.
(2-sided)
2 cells (25.0%) have expected count less than 5. Theminimum expected count is 1.43.
a.
4444 of 49 of 49

(Continued)(Continued)
Wednesday, 15th Wednesday, 15th Dec'10Dec'10
Social impacts of using Social impacts of using Internet among the adults Internet among the adults
We decide- those who don’t use net vote We decide- those who don’t use net vote 85% more than the net user85% more than the net user
Variables in the Equation
.617 .113 29.792 1 .000 1.854
.224 .074 9.122 1 .003 1.252
USENET(1)
Constant
Step1
a
B S.E. Wald df Sig. Exp(B)
Variable(s) entered on step 1: USENET.a.
4545 of 49 of 49

Using internet vs. TV Using internet vs. TV watching hours per day watching hours per day
Wednesday, 15th Wednesday, 15th Dec'10Dec'10
Social impacts of using Social impacts of using Internet among the adults Internet among the adults
Independent Samples Test
20.261 .000 6.455 884 .000 1.09 .169 .760 1.424
6.569 870.228 .000 1.09 .166 .766 1.418
Equal variancesassumed
Equal variancesnot assumed
Hours per daywatching TV
F Sig.
Levene's Test forEquality of Variances
t df Sig. (2-tailed)Mean
DifferenceStd. ErrorDifference Lower Upper
95% ConfidenceInterval of the
Difference
t-test for Equality of Means
Group Statistics
473 3.52 2.793 .128
413 2.42 2.146 .106
Use Internet?No
Yes
Hours per daywatching TV
N Mean Std. DeviationStd. Error
Mean
4646 of 49 of 49

We get- their exists difference of We get- their exists difference of television watching between the net users television watching between the net users and the not users. and the not users.
Wednesday, 15th Wednesday, 15th Dec'10Dec'10
Social impacts of using Social impacts of using Internet among the adults Internet among the adults 4747 of 48 of 48

Any Any Question Question
??????Wednesday, 15th Wednesday, 15th Dec'10Dec'10
Social impacts of using Social impacts of using Internet among the adults Internet among the adults 4848 of 49 of 49

Thank Thank you allyou all
Wednesday, 15th Wednesday, 15th Dec'10Dec'10
Social impacts of using Social impacts of using Internet among the adults Internet among the adults 4949 of 49 of 49
Recommended