Embed Size (px)
Citation preview
Number 333 + May 14, 2003
Physical Activity Among Adults: United States, 2000by Patricia M. Barnes, M.A., and Charlotte A. Schoenborn, M.P.H., Division of Health Interview Statistics
AbstractObjective—This report presents selected prevalence estimates for overall
physical activity among U.S. adults, using data from the 2000 National HealthInterview Survey (NHIS), conducted by the Centers for Disease Control andPrevention’s (CDC) National Center for Health Statistics (NCHS).
Methods—Data for the U.S. civilian noninstitutionalized population werecollected using computer-assisted personal interviews (CAPI). This report is basedon 32,374 interviews that were completed by a sample of adults aged 18 years andover. Data from questions on usual daily activity were combined with data fromquestions on leisure-time physical activity to get a more complete picture of theoverall physical activity level of U.S. adults. Statistics shown in this report were ageadjusted to the 2000 U.S. standard population.
Results—About one-fifth of adults (19.0%) engaged in a high level ofoverall physical activity and about one-quarter of adults (23.5%) engaged in amedium-high level of overall physical activity. Men (21.3%) were more likelythan women (16.9%) to engage in a high level of overall physical activity. Men(23.3%) and women (23.8%) were about equally likely to engage in a medium-high level of overall physical activity. The rate of engaging in a high ormedium-high level of overall physical activity was lower for Hispanic adultsand single-race Black or African American adults who were not Hispanic thansingle-race white adults who were not Hispanic, declined with age, increasedwith education and income, and was lower for adults living in the South thanthose living in the Northeast, Midwest, or West. Adults who walked during theirusual daily activity (36.6%) were more likely than adults who sat during theirusual daily activity (27.7%) to engage in regular leisure-time physical activity.Adults who lifted or carried moderate or heavy loads during their usual dailyactivities were more likely than adults who did not do any lifting or who liftedlight loads to engage in regular leisure-time physicial activity.
Keywords: leisure-time physical activity c usual daily activity c overall physicalactivity c National Health Interview Survey
IntroductionRecent studies of the association
between physical activity and healthcontinue to confirm the positive
U.S. DEPARTMENT OF Centers for Disease CoNational Center for Hea
influence physical activity has on health.Among adults, regular physical activityhas been associated with decreased riskof coronary heart disease (1), obesity
HEALTH AND HUMAN SERVICESntrol and Preventionlth Statistics
(2), noninsulin-dependent diabetes mel-litus (3), osteoporosis (4), and post-menopausal endometrial cancer (5).Physical activity has also been associ-ated with increased longevity (6,7) and alower rate of disability (8). Many ques-tionnaires designed to measure the rela-tionship between physical activity andhealth include only leisure-time physicalactivity or only occupational physicalactivity (9). Studies that use onlyleisure-time physical activity may under-estimate a person’s overall physicalactivity level, especially for persons whoare employed in physically demandingjobs (10). Studies that use only occupa-tional physical activity may not accu-rately reflect the activity level ofhousewives and retired persons becausethese people are not formally employed.To obtain a better estimate of a person’sphysical activity level, both usual dailyactivity (which includes occupationalactivity, if employed) and leisure-timephysical activity should be considered.
The National Health InterviewSurvey (NHIS), one of the major datacollection systems of the Centers forDisease Control and Prevention’sNational Center for Health Statistics, isa large, population-based survey of theU.S. civilian noninstitutionalizedpopulation. Information on leisure-timephysical activity among adults wascollected in the NHIS in selected years
2 Advance Data No. 333 + May 14, 2003
between 1975 and 1995 (11–19). Beginning in 1997, data on leisure-time physical activity have been collected annually in the NHIS Sample Adult questionnaire. In 1985 and 1990, information was collected about the amount (a great deal, a moderate amount, a little, or none) and hours of hard physical work required on a person’s job and the amount and hours of hard physical work required in the person’s main daily activity (14,16). Questions on usual daily activity related to moving around (sitting, standing, and walking) and lifting and carrying things were included in the Cancer Control Module of the 2000 NHIS.
The current NHIS core questions about leisure-time physical activity were designed to assess general levels of leisure-time physical activity among adults 18 years of age and over and will be used to monitor progress toward achieving the 2010 national health objectives for adult physical activity (20). Annual prevalence estimates of leisure-time physical activity for various population subgroups also can be used to identify the appropriate target groups for health promotion and education campaigns and to evaluate the success of such programs. The questions about usual daily activity asked in the 2000 questionnaire were designed to assess general levels of activity during nonleisure time. In this report, data from the questions on usual daily activity were combined with data from the questions about leisure-time physical activity to provide an indicator of the overall physical activity of adults 18 years of age and over.
Methods
Data source
The statistics shown in this report are based on data from the Sample Adult component and the Cancer Control Module of the 2000 National Health Interview Survey (21). The National Health Interview Survey is a survey of a nationally representative sample of the civilian noninstitutionalized household population of the United States. Basic health and demographic information are
collected on all household members. Additional information is collected on one randomly selected adult (the ‘‘sample adult’’) aged 18 years or over and one randomly selected child (the ‘‘sample child’’) aged 0–17 years per family. Information on the sample adult is self-reported, although proxy responses are accepted in rare instances where the sample adult is unable to communicate.
Measurement of usual daily activity and leisure-time physical activity
This report presents prevalence estimates for U.S. adults for several indicators of physical activity. The indicators are based on four questions about participation in leisure-time physical activity and two questions about usual daily activity related to moving around and lifting or carrying things.
The current NHIS core leisure-time physical activity questions include frequency and duration of light or moderate activity and frequency and duration of vigorous activity. Light or moderate activity was defined as activity lasting at least 10 minutes that caused light sweating or a slight to moderate increase in breathing or heart rate. Vigorous activity was defined as activity lasting at least 10 minutes that caused heavy sweating or large increases in breathing or heart rate. The leisure-time physical activity indicator used in this report is briefly described below, with additional detail and question wording available in the Technical Notes.
Regular leisure-time physical activity combines frequency and duration of activity. It is defined as engaging in light or moderate activity five times or more per week for 30 minutes or more each time and/or engaging in vigorous activity three times or more per week for 20 minutes or more each time.
The 2000 NHIS Cancer Control Module contains questions about usual daily activity related to moving around and lifting or carrying things. The tables included in this report show usual daily activity and leisure-time physical activity separately as indicators of
physical activity and combined into an overall indicator of physical activity termed ‘‘overall physical activity level.’’ Table 1 shows the percent distribution of usual daily activity for adults who spent most of the day sitting, standing, or walking, and table 2 shows the percent distribution of level of usual daily lifting activity for adults who lifted or carried various loads. Table 3 shows the percent of adults who engaged in regular leisure-time physical activity according to their usual daily activities. Table 4 shows the percent distribution of overall physical activity level among all adults based on a combination of usual daily activity and leisure-time physical activity. A detailed description of how the responses to the activity questions were combined to create an overall physical activity indicator is available in the Technical Notes.
For all questions concerning physical activity except the question that was asked about daily activities related to moving around, respondents were given the opportunity to volunteer that they were ‘‘unable to engage in the activity.’’ In this report, individuals who said they were unable to engage in the activity were combined with persons who said they never engaged in the activity.
Item nonresponse in classification of activity levels
Estimates shown in this report were generally calculated excluding unknowns (i.e., refused, not ascertained, or don’t know) (See ‘‘Item nonresponse’’ section in the Technical Notes for specific numbers.) For tables showing activity related to moving around (tables 1,3) and activity related to lifting or carrying things (tables 2,3), the exclusion of missing data from the analysis was straightforward. Responses of ‘‘refused,’’ ‘‘not ascertained,’’ and ‘‘don’t know’’ were excluded from the denominators used to calculate the percent distribution of adults who engaged in an activity. However, classification of ‘‘regular leisure-time physical activity’’ (table 3) and of the activity levels for the variables used to create the overall physical activity level variables used in table 4 required
Advance Data No. 333 + May 14, 2003 3
decisions concerning treatment of missing data. Two options were available for handling missing data under these circumstances: (a) exclude all respondents who were missing any of the relevant information, or (b) classify respondents based on sufficient information. The second option was selected. It should be noted that the criteria for sufficient differed according to the variable of interest.
To classify a person as ‘‘engaging in regular leisure-time physical activity,’’ it was deemed sufficient to know that the person engaged in either light or moderate or vigorous physical activity regularly; the absence of information concerning either one of these two types of activity could reasonably be ignored. Persons who engaged in light or moderate or vigorous leisure-time activity on a regular basis were included in the denominator for calculating rates of being ‘‘engaged in regular leisure-time physical activity,’’ even if information about one of these types of activity was missing. Respondents with missing information about both light or moderate and vigorous activity and those who responded ‘‘never’’ or ‘‘unable to do’’ to one of the activities and provided no information about the other were excluded from the analysis.
Multiple episodes of activity per day
Classification of respondents in terms of regular leisure-time physical activity (table 3) involved estimates of frequency and duration of activity. The criterion for duration of activity was restricted to usual duration when the respondent engaged in a single episode of activity. Duration of the activity was not summed for persons who engaged in multiple episodes of leisure-time activity within a day. Thus, persons who engaged in an activity episode for less than the specified number of minutes were not included in a category even if, when summed, their total daily activity would have met or exceeded the duration criterion for that category. Approximately 1% of the sample (329 of 32,374 respondents) reported multiple episodes of leisure-time activity per day
that did not meet the duration criterion. Estimates of activity would have been essentially unaffected by inclusion of these 329 individuals.
Strengths and limitations of the data
The NHIS questions on leisure-time physical activity have both strengths and limitations. They can be used as an indicator of overall levels of leisure-time physical activity among U.S. adults, and their inclusion in the survey every year makes it possible to produce annual estimates and look at time trends for leisure-time physical activity. These questions have limitations because some respondents may have failed to pay attention to the limited scope of the questions and included nonleisure-time activities when responding. Also, the questions require respondents to mentally and quickly calculate average frequency and duration as well as assess the level of intensity for all of their leisure-time physical activities. More detailed information about these strengths and limitations are found elsewhere (22).
The usual daily activity questions also have both strengths and limitations. They give an indication of the activity level among U.S. adults during their nonleisure time. Respondents were instructed to not include activities done in their leisure time when choosing the best description of their usual daily activities related to moving around and lifting or carrying things. Information about nonleisure-time activities had not been collected by the NHIS since 1990. During that survey, questions about the amount (a great deal, a moderate amount, a little, or none) and hours of hard physical work required on a person’s job and required in the person’s main daily activity were included in the NHIS Health Promotion and Disease Prevention supplement. The NHIS 2000 questions on usual daily activity, when combined with the questions on leisure-time physical activity, can be used to obtain a more complete picture of the activity level of U.S. adults.
The usual daily activity questions have limitations because they are
general and nonquantitative (23). Interviewers asked respondents if they spend most of the day sitting, standing, or walking around and then asked if they carry light, moderate, or heavy loads. For each of the questions, respondents were asked to select the activity they did most often. Due to the wording of the question and the way the survey was designed, it is very difficult to determine whether respondents were referring to a job when they described their usual daily activities. Thus, inferences about occupational activity are hampered. Although the interviewer asked the respondent not to include exercises, sports, or physically active hobbies done in his/her leisure time when answering the questions about usual daily activities, some respondents may have failed to pay attention to the limited scope of the questions and included leisure-time physical activities. This may be particularly true for the nonworking population, especially the elderly, where the line between leisure-time activity and nonleisure-time activity is blurred.
Statistical analysis
This report is based on data from 32,374 completed interviews of sample adults aged 18 years and over. The overall sample adult response rate was 72.1%. All estimates and associated standard errors in this report were generated using SUDAAN, a software package designed to handle complex sample designs such as that of the NHIS (24). All estimates were weighted to reflect the U.S. civilian noninstitutionalized population aged 18 years and over. Because of the level of detail shown, the standard errors for some subgroups are quite large. In tables 1–5, estimates with a relative standard error of more than 30% are identified with an asterisk. The reader should exercise caution when interpreting these statistics.
Most estimates presented in tables 1–5 were age adjusted to the 2000 U.S. standard population aged 18 years and over, using SUDAAN’s PROC DESCRIPT procedure (24,25). Age adjustment was used to allow comparison among various
4 Advance Data No. 333 + May 14, 2003
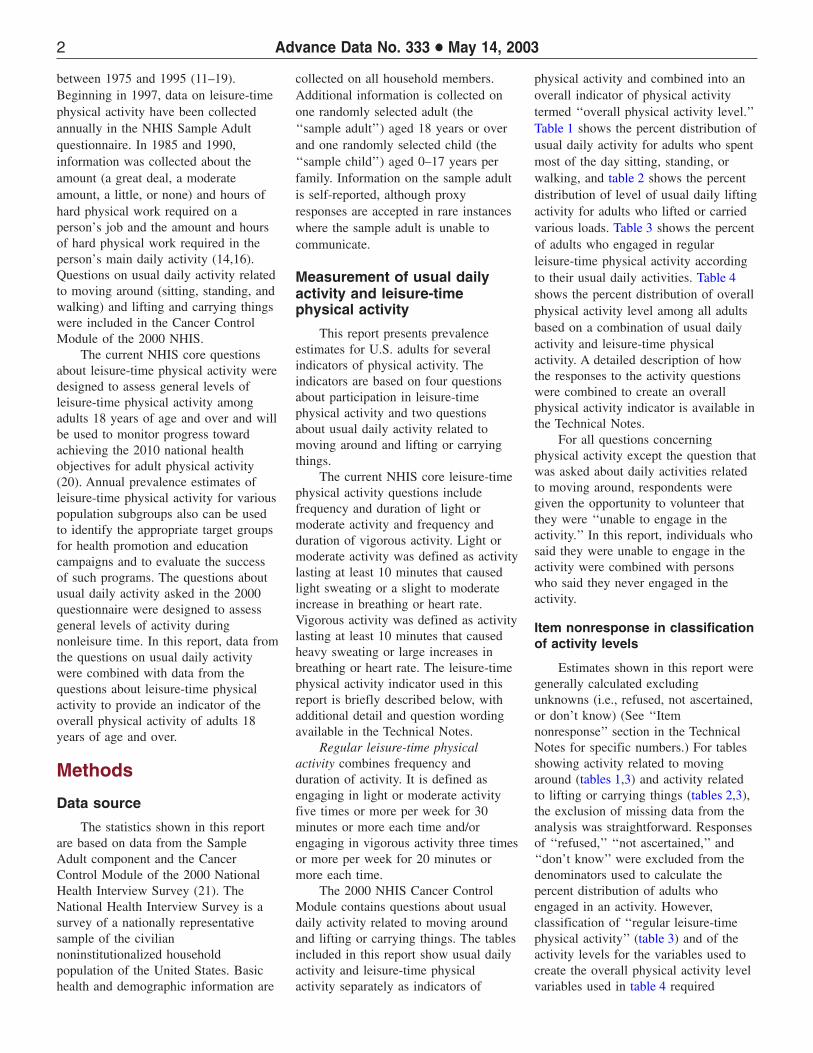
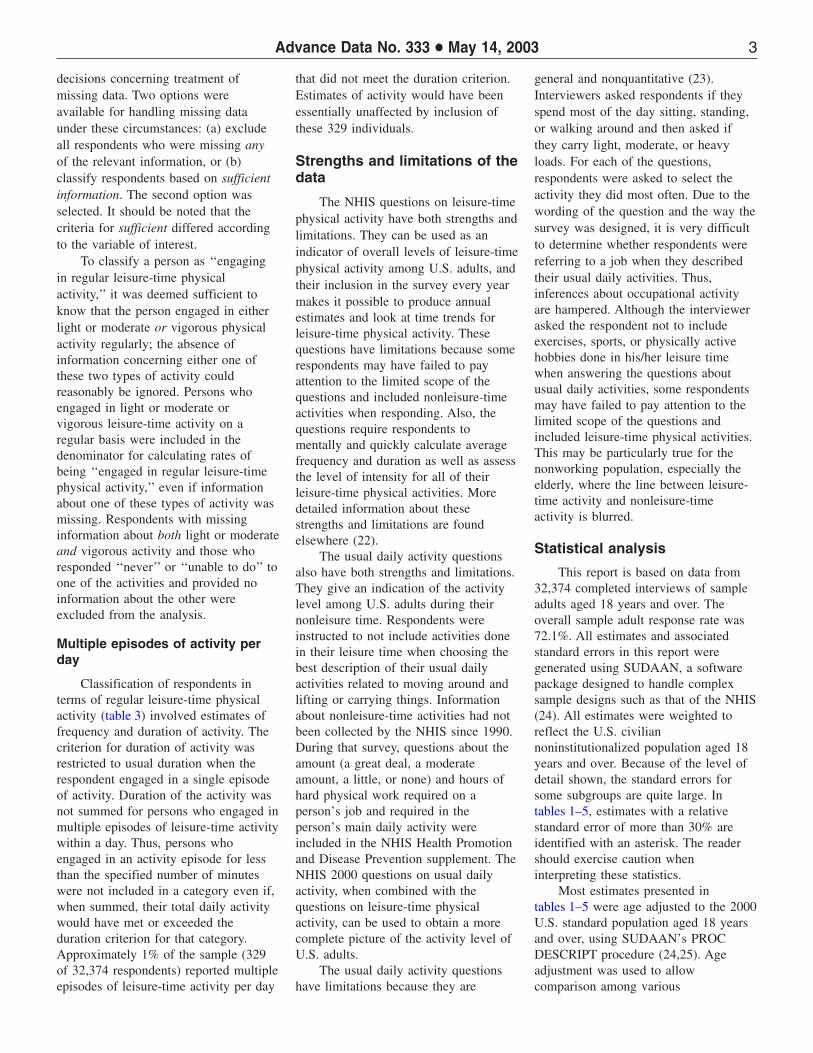
Figure 1. Percent of adults who engaged in regular leisure-time physical activity by type of usual daily activity related to moving around and by sex: United States, 2000
sociodemographic subgroups that have different age structures. (See ‘‘Technical Notes’’ for details.) The age-adjusted and unadjusted estimates were similar for the population totals as well as for many of the sociodemographic subgroups. Tables showing unadjusted estimates by race, Hispanic origin and race, education, poverty status, marital status, and geographic region are available on the NCHS Web site (26).
Age-adjusted estimates were compared using two-tailed t-tests at the 0.05 level. No adjustments were made for multiple comparisons. Terms such as ‘‘more likely’’ and ‘‘less likely’’ indicate a statistically significant difference. Terms such as ‘‘similar’’ or ‘‘no difference’’ indicate that the statistics being compared were not significantly different. Lack of comment regarding the difference between any two statistics does not mean that the difference was tested and found to be not significant.
With the exception of some of the more detailed information on race (i.e., Native Hawaiian and Other Pacific Islander only, two or more races, black or African American and white, and American Indian and Alaskan Native and white), which is not available to the public for reasons of confidentiality, all statistics presented in this report can be replicated using NHIS public use data files and accompanying documentation available for downloading from the NCHS Web site at www.cdc.gov/nchs.
Results Findings from tables 1–4 are
summarized below in bulleted highlights, organized according to population characteristics. The number of the table in which the data are presented is shown at the end of each bulleted item. Statistics are cited in the bullets whenever their mention will enhance understanding. In some instances, especially when more general interpretations of the findings are presented, the reader will need to refer to the table for the exact estimates. With the exception of the section describing findings by age, all descriptions refer to age-adjusted estimates.
Several of the race categories shown in tables 1–4 have small sample
sizes and associated large standard errors that make it difficult to interpret findings for these groups. The categories for race shown in this report were selected to meet the 1997 Office of Management and Budget (OMB) Federal guidelines for reporting of race and ethnicity. Although persons of Hispanic or Latino origin can be of any race, there is insufficient sample size to produce reliable estimates by race for the Hispanic or Latino population. Data for persons who were not Hispanic or Latino are provided for single-race white and single-race black or African American, but sample sizes are too small and associated standard errors too large for other race groups who were not Hispanic or Latino.
This report highlights estimates for all adults and the most striking subgroup differences. The tables contain much more information beyond that described. Readers with interests in particular subgroups or aspects of the study of total physical activity are encouraged to examine the tables for findings pertinent to their interests.
All adults
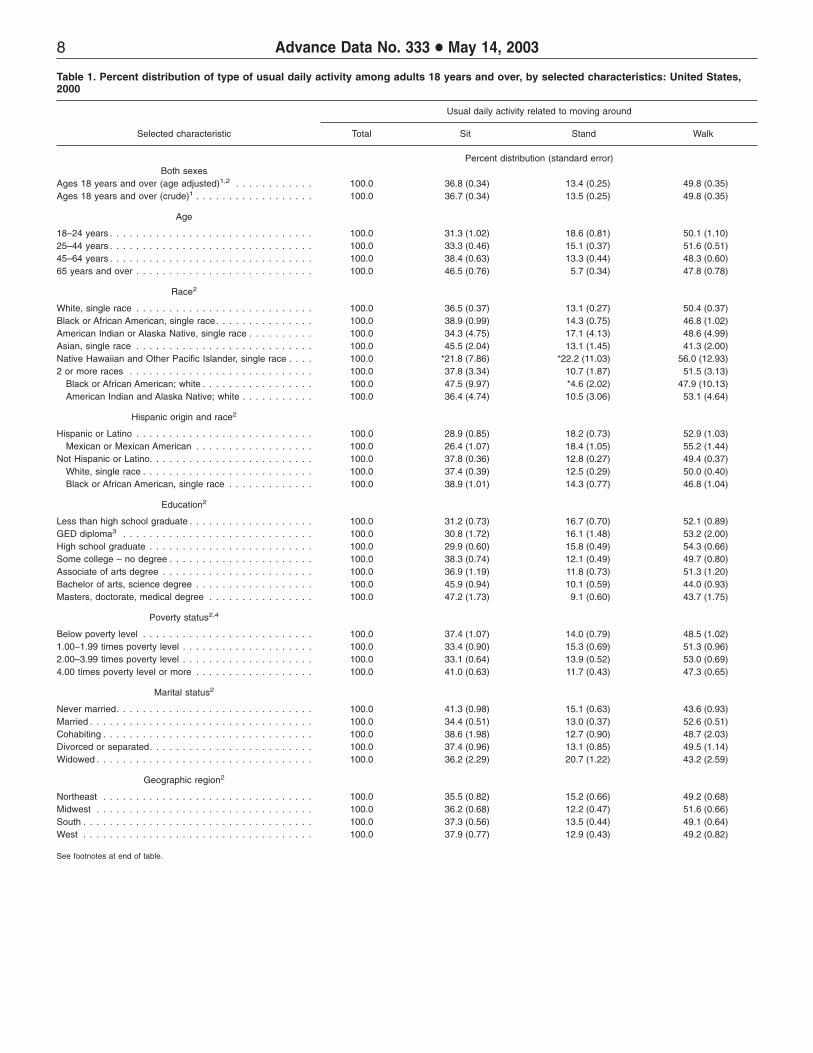
+ About one-half (49.8%) of adults walked during their usual daily activities, and more than one-third(36.8%) of adults sat during these activities (table 1).
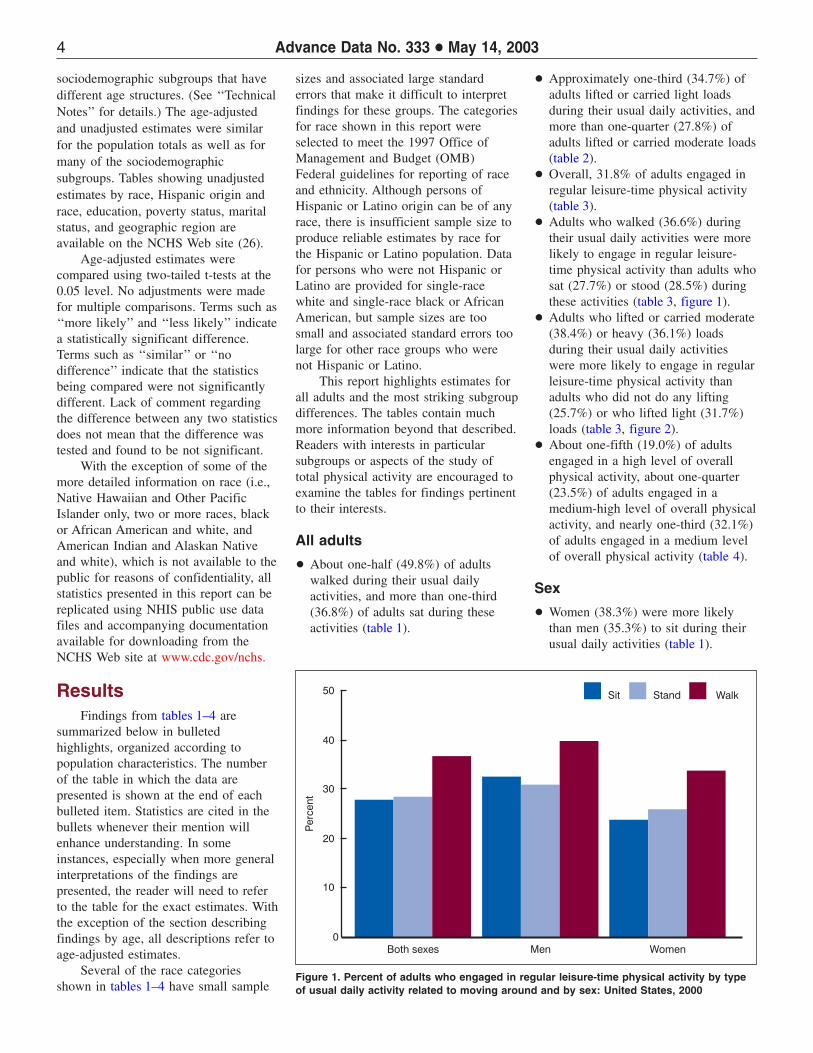
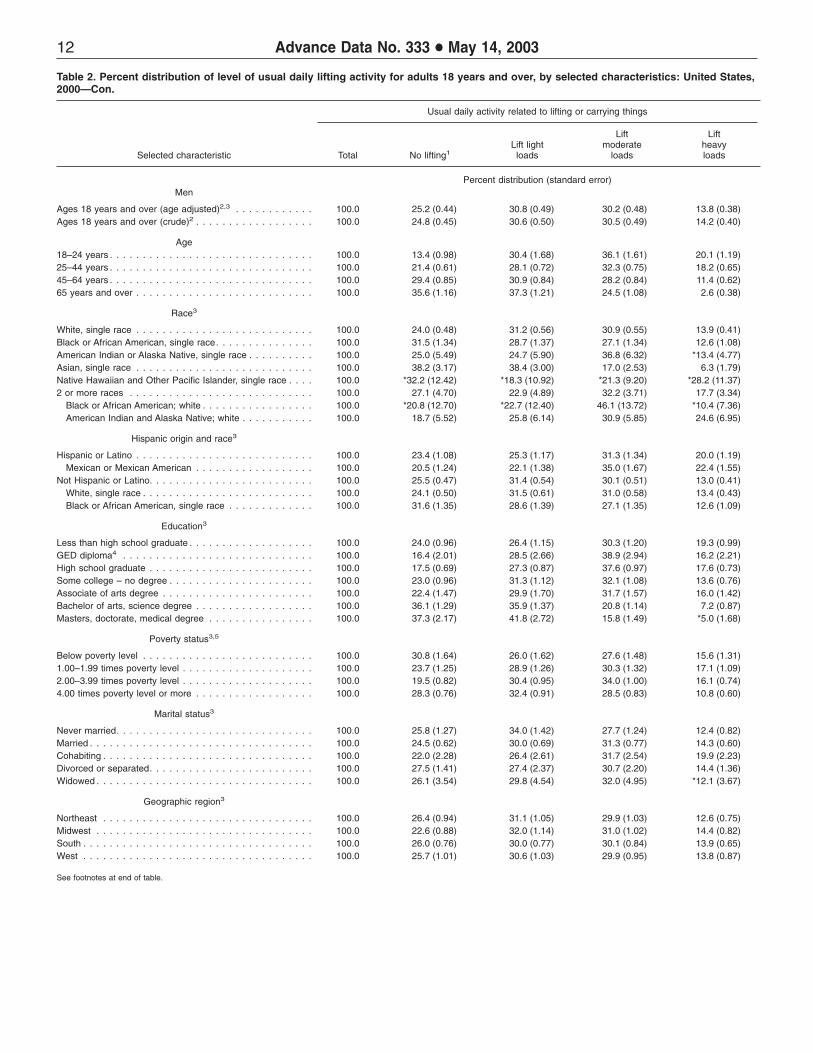
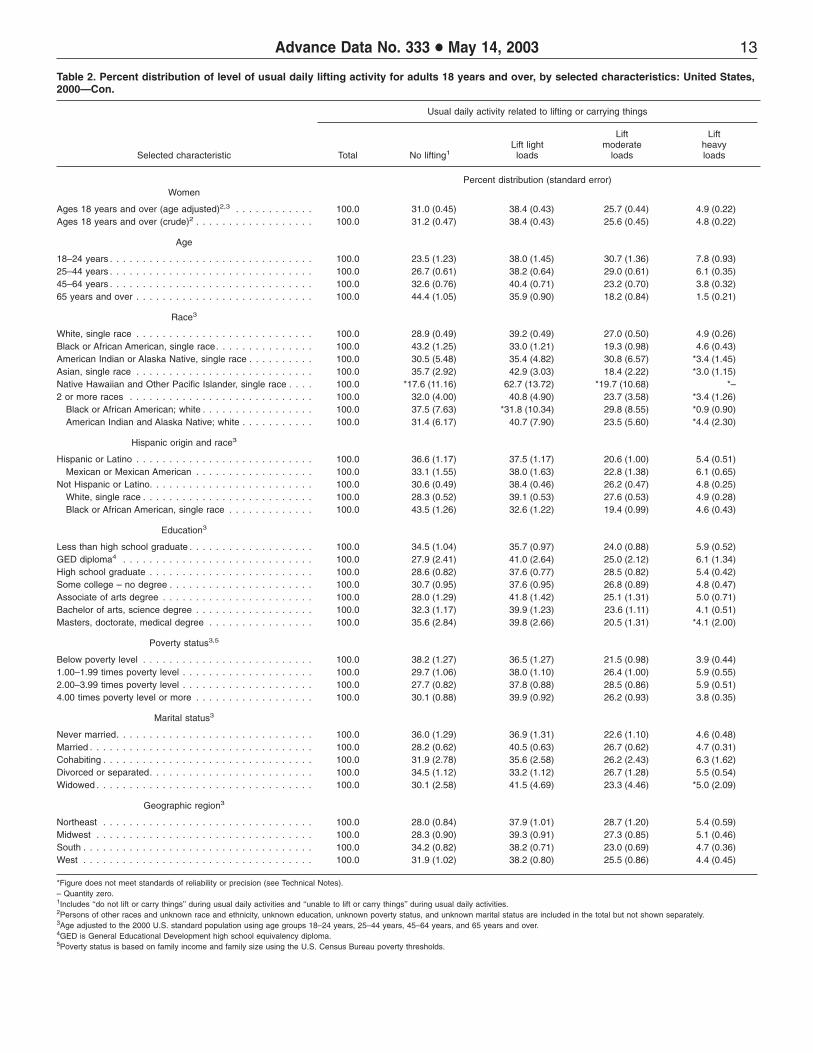
+ Approximately one-third (34.7%) ofadults lifted or carried light loadsduring their usual daily activities, andmore than one-quarter (27.8%) ofadults lifted or carried moderate loads(table 2).
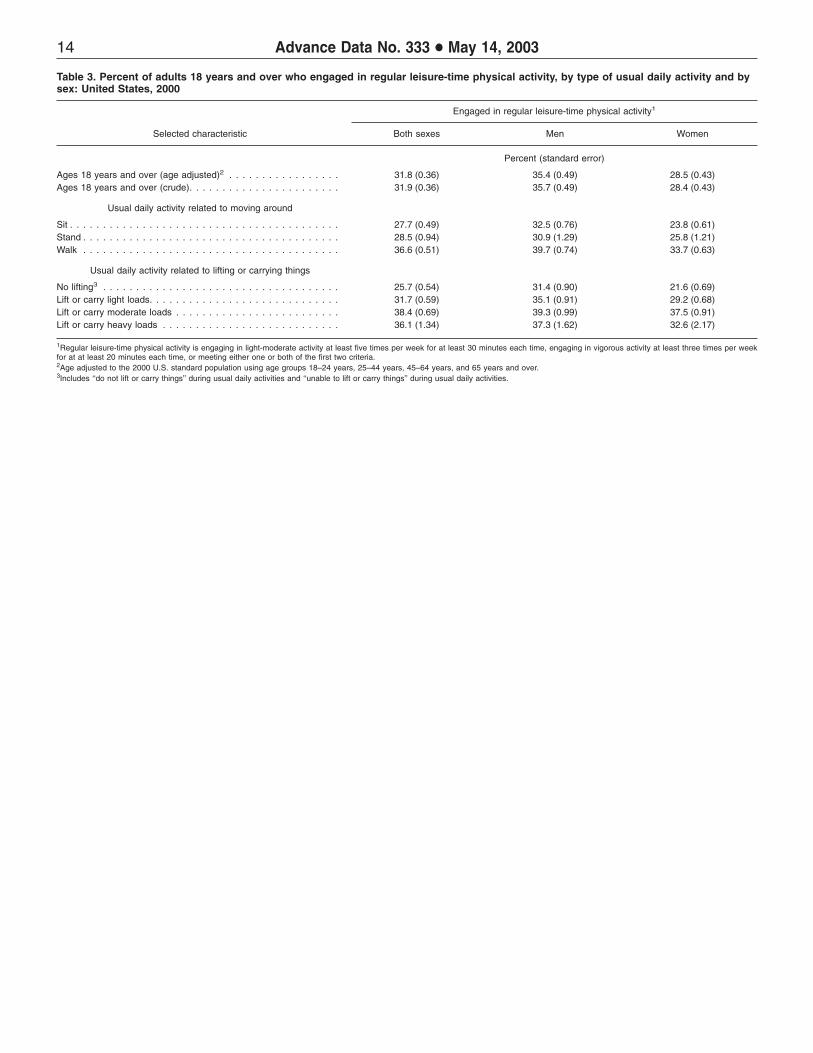
+ Overall, 31.8% of adults engaged inregular leisure-time physical activity(table 3).
+ Adults who walked (36.6%) duringtheir usual daily activities were morelikely to engage in regular leisure-time physical activity than adults whosat (27.7%) or stood (28.5%) duringthese activities (table 3, figure 1).
+ Adults who lifted or carried moderate(38.4%) or heavy (36.1%) loadsduring their usual daily activitieswere more likely to engage in regularleisure-time physical activity than adults who did not do any lifting (25.7%) or who lifted light (31.7%) loads (table 3, figure 2).
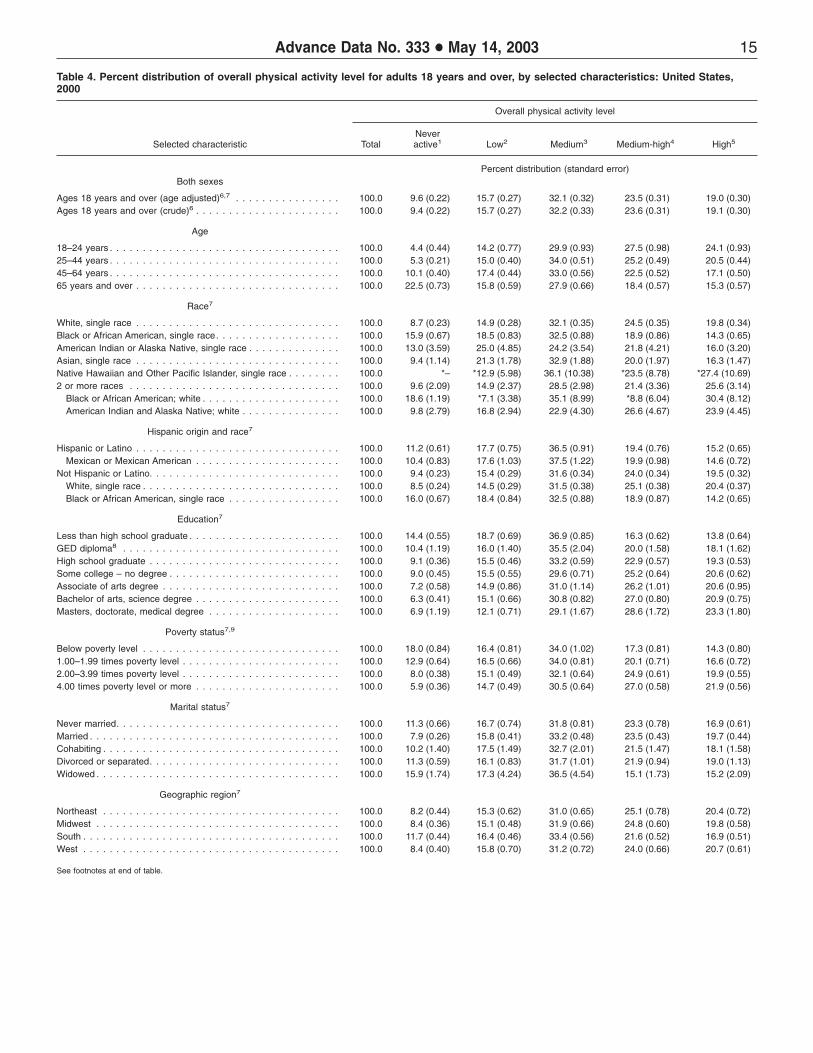
+ About one-fifth (19.0%) of adults engaged in a high level of overall physical activity, about one-quarter (23.5%) of adults engaged in a medium-high level of overall physical activity, and nearly one-third (32.1%) of adults engaged in a medium level of overall physical activity (table 4).
Sex
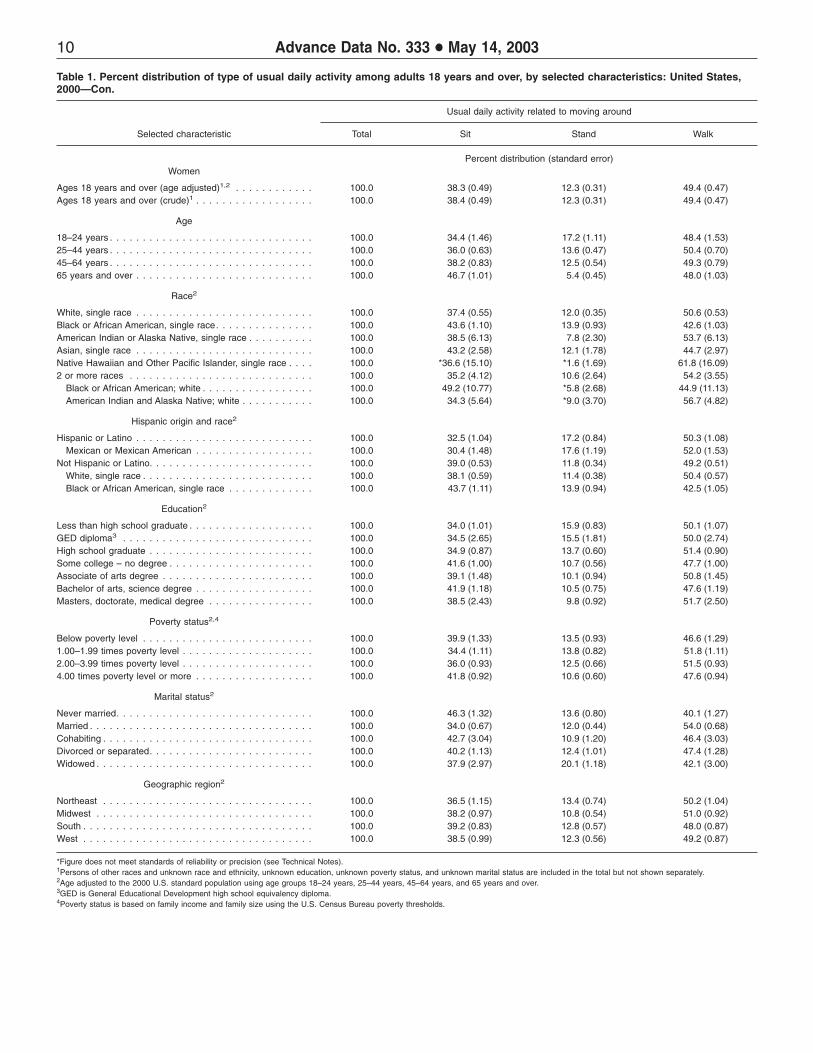
+ Women (38.3%) were more likelythan men (35.3%) to sit during theirusual daily activities (table 1).
Figure 2. Percent of adults who engaged in regular leisure-time physical activity by typeof usual daily activity related to lifting and carrying things and by sex: United States, 2000
Advance Data No. 333 + May 14, 2003 5
+ Men (14.6%) were more likely thanwomen (12.3%) to stand during theirusual daily activities (table 1).
+ Men (50.1%) and women (49.4%)were about equally likely to walkduring their usual daily activities(table 1).
+ Men were more likely than women tolift moderate or heavy loads duringtheir usual daily activities (table 2).
+ Men (35.4%) were more likely thanwomen (28.5%) to engage in regularleisure-time physical activity(table 3).
+ Women (11.6%) were more likelythan men (7.3%) to never engage inany physical activity (table 4).
+ Men (21.3%) were more likely thanwomen (16.9%) to engage in a highlevel of overall physical activity(table 4).
Age
+ The percent of adults who sat duringtheir usual daily activities increasedwith age from 31.3% at ages 18–24years to 46.5% at ages 65 years andover (table 1).
+ Adults in the youngest age groupwere much more likely than adults inthe oldest age group to lift or carrymoderate or heavy loads during theirusual daily activities (table 2).
+ Adults in the oldest age group(22.5%) were about five times as
likely as adults in the youngest agegroup (4.4%) to never be physicallyactive (table 4).
Race
+ Single-race white men (50.2%) andsingle-race black or African Americanmen (52.2%) were more likely thansingle-race Asian men (38.7%) towalk during their usual dailyactivities (table 1).
+ Single-race white men and single-raceblack or African American men wereapproximately twice as likely assingle-race Asian men to lift or carrymoderate or heavy loads during theirusual daily activities (table 2).
+ Single-race black or AfricanAmerican men (11.4%) were almosttwice as likely as single-race whitemen (6.8%) and single-race Asianmen (6.6%) to never be physicallyactive (table 4).
Hispanic or Latino origin andrace
+ Single-race white adults who werenot Hispanic or Latino (37.4%) andsingle-race black or African Americanadults who were not Hispanic orLatino (38.9%) were more likely thanHispanic or Latino adults (28.9%) tosit during their usual daily activities(table 1).
+ Hispanic or Latino men (20.0%) weremore likely than single-race whitemen who were not Hispanic or Latino(13.4%) or single-race black orAfrican American men who were notHispanic or Latino (12.6%) to liftheavy loads during their usual dailyactivities (table 2).
+ Single-race white adults who werenot Hispanic or Latino (20.4%) weremore likely than Hispanic or Latinoadults (15.2%) or single-race black orAfrican American adults who werenot Hispanic or Latino (14.2%) toengage in a high level of overallphysical activity (table 4).
Education
+ Adults with a bachelor’s degree(45.9%) and those with an advanceddegree (47.2%) were more likely thanadults with a high school diploma(29.9%), a GED diploma (30.8%), orthose who did not graduate from highschool (31.2%) to sit during theirusual daily activities (table 1).
+ Adults with a high school diploma(11.5%) or a GED diploma (11.0%)were approximately twice as likely asadults with an advanced degree(4.7%) to lift or carry heavy loadsduring their usual daily activities(table 2).
+ Adults who did not graduate fromhigh school (14.4%) were twice aslikely as adults with an advanceddegree (6.9%) to never be physicallyactive (table 4).
+ Women with an advanced degree(26.8%) were more than twice aslikely as women who did notgraduate from high school (11.2%) toengage in a high level of overallphysical activity (table 4).
Poverty status
+ Adults in the lowest income groupand the highest income group weremore likely than adults in the othertwo income groups to sit during theirusual daily activities (table 1).
+ Adults in the lowest income groupand the highest income group wereless likely than adults in the othertwo income groups to lift or carryheavy loads during their usual dailyactivities (table 2).
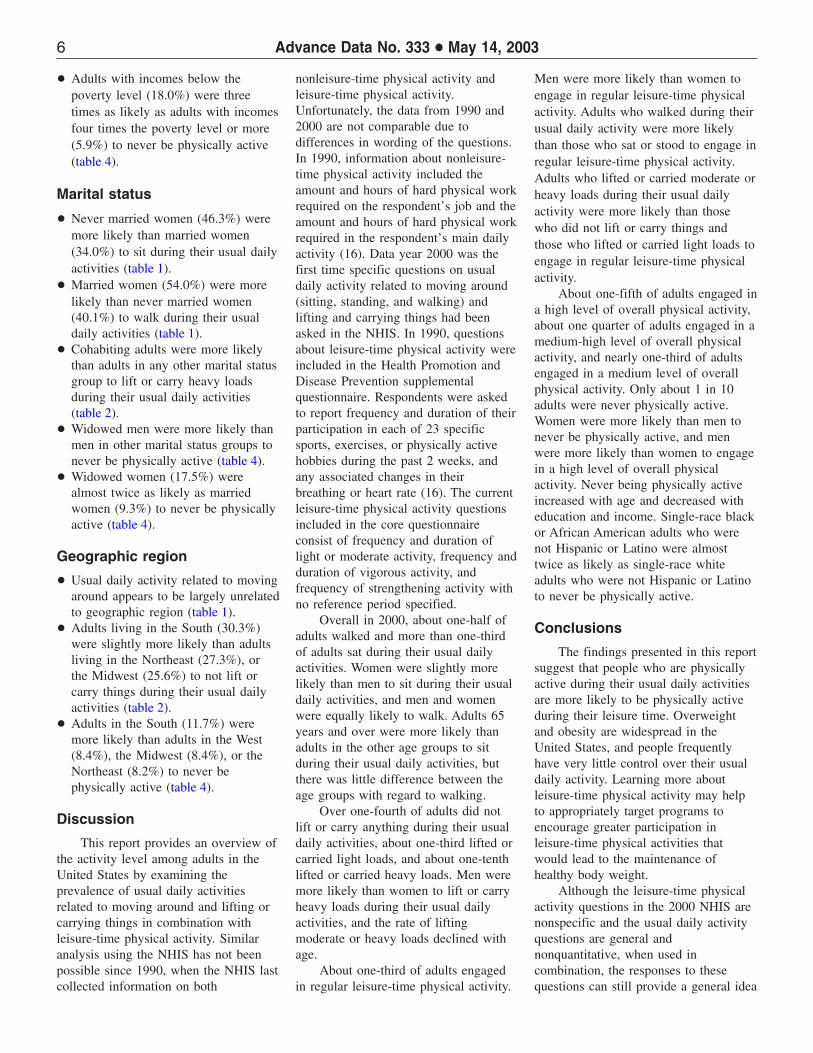
6 Advance Data No. 333 + May 14, 2003
+ Adults with incomes below the poverty level (18.0%) were three times as likely as adults with incomes four times the poverty level or more (5.9%) to never be physically active (table 4).
Marital status
+ Never married women (46.3%) were more likely than married women (34.0%) to sit during their usual daily activities (table 1).
+ Married women (54.0%) were more likely than never married women (40.1%) to walk during their usual daily activities (table 1).
+ Cohabiting adults were more likely than adults in any other marital status group to lift or carry heavy loads during their usual daily activities (table 2).
+ Widowed men were more likely than men in other marital status groups to never be physically active (table 4).
+ Widowed women (17.5%) were almost twice as likely as married women (9.3%) to never be physically active (table 4).
Geographic region
+ Usual daily activity related to moving around appears to be largely unrelated to geographic region (table 1).
+ Adults living in the South (30.3%) were slightly more likely than adults living in the Northeast (27.3%), or the Midwest (25.6%) to not lift or carry things during their usual daily activities (table 2).
+ Adults in the South (11.7%) were more likely than adults in the West (8.4%), the Midwest (8.4%), or the Northeast (8.2%) to never be physically active (table 4).
Discussion
This report provides an overview of the activity level among adults in the United States by examining the prevalence of usual daily activities related to moving around and lifting or carrying things in combination with leisure-time physical activity. Similar analysis using the NHIS has not been possible since 1990, when the NHIS last collected information on both
nonleisure-time physical activity and leisure-time physical activity. Unfortunately, the data from 1990 and 2000 are not comparable due to differences in wording of the questions. In 1990, information about nonleisuretime physical activity included the amount and hours of hard physical work required on the respondent’s job and the amount and hours of hard physical work required in the respondent’s main daily activity (16). Data year 2000 was the first time specific questions on usual daily activity related to moving around (sitting, standing, and walking) and lifting and carrying things had been asked in the NHIS. In 1990, questions about leisure-time physical activity were included in the Health Promotion and Disease Prevention supplemental questionnaire. Respondents were asked to report frequency and duration of their participation in each of 23 specific sports, exercises, or physically active hobbies during the past 2 weeks, and any associated changes in their breathing or heart rate (16). The current leisure-time physical activity questions included in the core questionnaire consist of frequency and duration of light or moderate activity, frequency and duration of vigorous activity, and frequency of strengthening activity with no reference period specified.
Overall in 2000, about one-half of adults walked and more than one-third of adults sat during their usual daily activities. Women were slightly more likely than men to sit during their usual daily activities, and men and women were equally likely to walk. Adults 65 years and over were more likely than adults in the other age groups to sit during their usual daily activities, but there was little difference between the age groups with regard to walking.
Over one-fourth of adults did not lift or carry anything during their usual daily activities, about one-third lifted or carried light loads, and about one-tenth lifted or carried heavy loads. Men were more likely than women to lift or carry heavy loads during their usual daily activities, and the rate of lifting moderate or heavy loads declined with age.
About one-third of adults engaged in regular leisure-time physical activity.
Men were more likely than women to engage in regular leisure-time physical activity. Adults who walked during their usual daily activity were more likely than those who sat or stood to engage in regular leisure-time physical activity. Adults who lifted or carried moderate or heavy loads during their usual daily activity were more likely than those who did not lift or carry things and those who lifted or carried light loads to engage in regular leisure-time physical activity.
About one-fifth of adults engaged in a high level of overall physical activity, about one quarter of adults engaged in a medium-high level of overall physical activity, and nearly one-third of adults engaged in a medium level of overall physical activity. Only about 1 in 10 adults were never physically active. Women were more likely than men to never be physically active, and men were more likely than women to engage in a high level of overall physical activity. Never being physically active increased with age and decreased with education and income. Single-race black or African American adults who were not Hispanic or Latino were almost twice as likely as single-race white adults who were not Hispanic or Latino to never be physically active.
Conclusions
The findings presented in this report suggest that people who are physically active during their usual daily activities are more likely to be physically active during their leisure time. Overweight and obesity are widespread in the United States, and people frequently have very little control over their usual daily activity. Learning more about leisure-time physical activity may help to appropriately target programs to encourage greater participation in leisure-time physical activities that would lead to the maintenance of healthy body weight.
Although the leisure-time physical activity questions in the 2000 NHIS are nonspecific and the usual daily activity questions are general and nonquantitative, when used in combination, the responses to these questions can still provide a general idea
Advance Data No. 333 + May 14, 2003 7
of the overall activity level of U.S. adults. The descriptive statistics and highlights presented in this report can be used as a foundation for future studies that examine overall activity level in a more specific and quantitative way.
References 1. Manson JE, Hu FB, Rich-Edwards
JW, et al. A prospective study of walking as compared with vigorous exercise in the prevention of coronary heart disease in women. N Engl J Med 341:650–8. 1999.
2. King GA, Fitzhugh EC, Bassett DR Jr, et al. Relationship of leisure-time physical activity and occupational activity to the prevalence of obesity. Int J Obes 25:606–12. 2001.
3. Paffenbarger RS Jr, Lee IM, Kampert JB. Physical activity in the prevention of non-insulin-dependent diabetes mellitus. World Rev Nutr Die 82:210–8. 1997.
4. Branca F. Physical activity, diet and skeletal health. Public Health Nutr 2:391–6. 1999.
5. Moradi T, Weiderpass E, Signorello L, et al. Physical activity and postmenopausal endometrial cancer risk (Sweden). Cancer Causes and Control 11:829–37. 2000.
6. Lee IM, Paffenbarger RS. Associations of light, moderate, and vigorous intensity physical activity with longevity. Am J Epidemiol 151: 293–9. 2000.
7. Lissner L, Bengtsson C, Bjorkelund C, Wedel H. Physical activity levels and changes in relation to longevity. A prospective study Swedish women. Am J Epidemiol 143:54–62. 1996.
8. Westerterp KR. Daily physical activity and aging. Curr Opin Clin Nutr & Metab Care 3:485–8. 2000.
9. Norman A, Bellocco R, Bergstrom A, Wolk A. Validity and reproducibility of self-reported total physical activity—differences by relative weight. Int J Obes 25:682–8. 2001.
10. U.S. Department of Health and Human Services. Physical activity and health: A report of the Surgeon General. Atlanta, GA: U.S. Department of Health and Human Services, Centers for Disease Control and Prevention, National Center for Chronic Disease Prevention and Health Promotion, 1996.
11. Drury TF. Current estimates from the Health Interview Survey: United
States, 1975. Vital Health Stat 10(115). DHEW Publication No. (PHS) 77–1543. Rockville, Maryland. March 1977.
12. Howie LJ, Drury TF. Current estimates from the Health Interview Survey: United States, 1977. Vital Health Stat 10(126). DHEW Publication No. (PHS) 78–1554. Hyattsville, Maryland. Sept. 1978.
13. National Center for Health Statistics. Current estimates from the National Health Interview Survey: United States, 1983. Vital Health Stat 10(154). DHHS Pub. No. (PHS) 86–1582. June 1986.
14. Moss AJ, Parsons VL. Current estimates from the National Health Interview Survey: United States, 1985. National Center for Health Statistics. Vital Health Stat 10(160). DHHS Pub. No. (PHS) 86–1588. Public Health Service. Washington. U.S. Government Printing Office, Sept. 1986.
15. Schoenborn CA. Health promotion and disease prevention: United States, 1985. Vital and Health Statistics. Series 10, No. 163. DHHS Pub. No. (PHS) 88–1591. Public Health Service. Washington. U.S. Government Printing Office. 1988.
16. Adams PF, Benson V. Current estimates from the National Health Interview Survey: United States, 1990. National Center for Health Statistics. Vital Health Stat 10(181). Dec. 1991.
17. Piani A, Schoenborn CA. Health promotion and disease prevention: United States, 1990. Vital Health Stat 10(185). DHHS Pub. No. (PHS) 88–1591. Public Health Service. Washington. U.S. Government Printing Office. 1993.
18. Adams PF, Benson V. Current estimates from the National Health Interview Survey: United States, 1991. National Center for Health Statistics. Vital Health Stat 10(184). DHHS Pub. No. (PHS) 93–1512. Public Health Service. Washington. U.S. Government Printing Office. 1992.
19. Benson V, Marano MA. Current estimates from the National Health Interview Survey, 1995. National Center for Health Statistics. Vital Health Stat 10(199). 1998.
20. U.S. Department of Health and Human Services. Healthy People 2010. 2nd ed. With Understanding and Improving Health and Objectives
for Improving Health. 2 vols. Washington: U.S. Government Printing Office, Nov 2000.
21. National Center for Health Statistics. 2000 National Health Interview Survey (NHIS). Public Use Data Release. NHIS Survey Description. ftp://ftp.cdc.gov/pub/ Health_Statistics/NCHS/ Dataset_Documentation/NHIS/2000/ srvydesc.pdf.
22. Schoenborn CA, Barnes PM. Leisure-time physical activity among adults: United States, 1997–1998. Advance data from vital and health statistics; no. 325. Hyattsville, Maryland: National Center for Health Statistics. 2002.
23. Troiano R. Personal communication. June 2002.
24. Shah BV, Barnwell BG, Bieler GS. SUDAAN, Software for the Statistical Analysis of Correlated Data. SUDAAN User’s Manual, Release 7.5. Research Triangle Park, N.C. Research Triangle Institute. 1997.
25. Day JC. Population projections of the United States by age, sex, race, and Hispanic origin: 1995 to 2050, U.S. Bureau of the Census, Current Population Reports, P25–1130, U.S. Government Printing Office, Washington. 1996. (www.census.gov/ prod/1/pop/p25–1130/)
26. National Center for Health Statistics. www.cdc.gov/nchs.
27. Klein RJ, Schoenborn CA. Age adjustment using the 2000 projected U.S. population. Healthy People Statistical Notes, no. 20. Hyattsville, Maryland. National Center for Health Statistics. Jan. 2001.
28. Department of Commerce, U.S. Bureau of the Census. Poverty in the United States, 1999. Washington. U.S. Department of Commerce. U.S. Bureau of the Census. 2000.
2000
8 Advance Data No. 333 + May 14, 2003
Table 1. Percent distribution of type of usual daily activity among adults 18 years and over, by selected characteristics: United States,
Usual daily activity related to moving around
Selected characteristic Total Sit Stand Walk
Percent distribution (standard error) Both sexes
Ages 18 years and over (age adjusted)1,2 . . . . . . . . . . . . 100.0 36.8 (0.34) 13.4 (0.25) 49.8 (0.35) Ages 18 years and over (crude)1 . . . . . . . . . . . . . . . . . . 100.0 36.7 (0.34) 13.5 (0.25) 49.8 (0.35)
Age
18–24 years . . . . . . . . . . . . . . . . . . . . . . . . . . . . . . . 100.0 31.3 (1.02) 18.6 (0.81) 50.1 (1.10) 25–44 years . . . . . . . . . . . . . . . . . . . . . . . . . . . . . . . 100.0 33.3 (0.46) 15.1 (0.37) 51.6 (0.51) 45–64 years . . . . . . . . . . . . . . . . . . . . . . . . . . . . . . . 100.0 38.4 (0.63) 13.3 (0.44) 48.3 (0.60) 65 years and over . . . . . . . . . . . . . . . . . . . . . . . . . . . 100.0 46.5 (0.76) 5.7 (0.34) 47.8 (0.78)
Race2
White, single race . . . . . . . . . . . . . . . . . . . . . . . . . . . 100.0 36.5 (0.37) 13.1 (0.27) 50.4 (0.37) Black or African American, single race. . . . . . . . . . . . . . . 100.0 38.9 (0.99) 14.3 (0.75) 46.8 (1.02) American Indian or Alaska Native, single race . . . . . . . . . . 100.0 34.3 (4.75) 17.1 (4.13) 48.6 (4.99) Asian, single race . . . . . . . . . . . . . . . . . . . . . . . . . . . 100.0 45.5 (2.04) 13.1 (1.45) 41.3 (2.00) Native Hawaiian and Other Pacific Islander, single race . . . . 100.0 *21.8 (7.86) *22.2 (11.03) 56.0 (12.93) 2 or more races . . . . . . . . . . . . . . . . . . . . . . . . . . . . 100.0 37.8 (3.34) 10.7 (1.87) 51.5 (3.13)
Black or African American; white . . . . . . . . . . . . . . . . . 100.0 47.5 (9.97) *4.6 (2.02) 47.9 (10.13) American Indian and Alaska Native; white . . . . . . . . . . . 100.0 36.4 (4.74) 10.5 (3.06) 53.1 (4.64)
Hispanic origin and race2
Hispanic or Latino . . . . . . . . . . . . . . . . . . . . . . . . . . . 100.0 28.9 (0.85) 18.2 (0.73) 52.9 (1.03) Mexican or Mexican American . . . . . . . . . . . . . . . . . . 100.0 26.4 (1.07) 18.4 (1.05) 55.2 (1.44)
Not Hispanic or Latino. . . . . . . . . . . . . . . . . . . . . . . . . 100.0 37.8 (0.36) 12.8 (0.27) 49.4 (0.37) White, single race . . . . . . . . . . . . . . . . . . . . . . . . . . 100.0 37.4 (0.39) 12.5 (0.29) 50.0 (0.40) Black or African American, single race . . . . . . . . . . . . . 100.0 38.9 (1.01) 14.3 (0.77) 46.8 (1.04)
Education2
Less than high school graduate . . . . . . . . . . . . . . . . . . . 100.0 31.2 (0.73) 16.7 (0.70) 52.1 (0.89) GED diploma3 . . . . . . . . . . . . . . . . . . . . . . . . . . . . . 100.0 30.8 (1.72) 16.1 (1.48) 53.2 (2.00) High school graduate . . . . . . . . . . . . . . . . . . . . . . . . . 100.0 29.9 (0.60) 15.8 (0.49) 54.3 (0.66) Some college – no degree . . . . . . . . . . . . . . . . . . . . . . 100.0 38.3 (0.74) 12.1 (0.49) 49.7 (0.80) Associate of arts degree . . . . . . . . . . . . . . . . . . . . . . . 100.0 36.9 (1.19) 11.8 (0.73) 51.3 (1.20) Bachelor of arts, science degree . . . . . . . . . . . . . . . . . . 100.0 45.9 (0.94) 10.1 (0.59) 44.0 (0.93) Masters, doctorate, medical degree . . . . . . . . . . . . . . . . 100.0 47.2 (1.73) 9.1 (0.60) 43.7 (1.75)
Poverty status2,4
Below poverty level . . . . . . . . . . . . . . . . . . . . . . . . . . 100.0 37.4 (1.07) 14.0 (0.79) 48.5 (1.02) 1.00–1.99 times poverty level . . . . . . . . . . . . . . . . . . . . 100.0 33.4 (0.90) 15.3 (0.69) 51.3 (0.96) 2.00–3.99 times poverty level . . . . . . . . . . . . . . . . . . . . 100.0 33.1 (0.64) 13.9 (0.52) 53.0 (0.69) 4.00 times poverty level or more . . . . . . . . . . . . . . . . . . 100.0 41.0 (0.63) 11.7 (0.43) 47.3 (0.65)
Marital status2
Never married. . . . . . . . . . . . . . . . . . . . . . . . . . . . . . 100.0 41.3 (0.98) 15.1 (0.63) 43.6 (0.93) Married . . . . . . . . . . . . . . . . . . . . . . . . . . . . . . . . . . 100.0 34.4 (0.51) 13.0 (0.37) 52.6 (0.51) Cohabiting . . . . . . . . . . . . . . . . . . . . . . . . . . . . . . . . 100.0 38.6 (1.98) 12.7 (0.90) 48.7 (2.03) Divorced or separated. . . . . . . . . . . . . . . . . . . . . . . . . 100.0 37.4 (0.96) 13.1 (0.85) 49.5 (1.14) Widowed . . . . . . . . . . . . . . . . . . . . . . . . . . . . . . . . . 100.0 36.2 (2.29) 20.7 (1.22) 43.2 (2.59)
Geographic region2
Northeast . . . . . . . . . . . . . . . . . . . . . . . . . . . . . . . . 100.0 35.5 (0.82) 15.2 (0.66) 49.2 (0.68) Midwest . . . . . . . . . . . . . . . . . . . . . . . . . . . . . . . . . 100.0 36.2 (0.68) 12.2 (0.47) 51.6 (0.66) South . . . . . . . . . . . . . . . . . . . . . . . . . . . . . . . . . . . 100.0 37.3 (0.56) 13.5 (0.44) 49.1 (0.64) West . . . . . . . . . . . . . . . . . . . . . . . . . . . . . . . . . . . 100.0 37.9 (0.77) 12.9 (0.43) 49.2 (0.82)
See footnotes at end of table.

Advance Data No. 333 + May 14, 2003 9
Table 1. Percent distribution of type of usual daily activity among adults 18 years and over, by selected characteristics: United States, 2000—Con.
Usual daily activity related to moving around
Selected characteristic Total Sit Stand Walk
Percent distribution (standard error) Men
Ages 18 years and over (age adjusted)1,2 . . . . . . . . . . . . 100.0 35.3 (0.46) 14.6 (0.37) 50.1 (0.49) Ages 18 years and over (crude)1 . . . . . . . . . . . . . . . . . . 100.0 34.9 (0.47) 14.9 (0.38) 50.3 (0.50)
Age
18–24 years . . . . . . . . . . . . . . . . . . . . . . . . . . . . . . . 100.0 28.2 (1.47) 20.0 (1.23) 51.8 (1.58) 25–44 years . . . . . . . . . . . . . . . . . . . . . . . . . . . . . . . 100.0 30.5 (0.67) 16.7 (0.54) 52.8 (0.74) 45–64 years . . . . . . . . . . . . . . . . . . . . . . . . . . . . . . . 100.0 38.6 (0.92) 14.1 (0.69) 47.4 (0.90) 65 years and over . . . . . . . . . . . . . . . . . . . . . . . . . . . 100.0 46.4 (1.14) 6.2 (0.58) 47.5 (1.15)
Race2
White, single race . . . . . . . . . . . . . . . . . . . . . . . . . . . 100.0 35.6 (0.50) 14.3 (0.41) 50.2 (0.53) Black or African American, single race. . . . . . . . . . . . . . . 100.0 32.9 (1.51) 14.9 (1.10) 52.2 (1.61) American Indian or Alaska Native, single race . . . . . . . . . . 100.0 29.8 (5.96) 25.8 (6.69) 44.4 (6.13) Asian, single race . . . . . . . . . . . . . . . . . . . . . . . . . . . 100.0 47.3 (2.97) 14.0 (2.08) 38.7 (2.61) Native Hawaiian and Other Pacific Islander, single race . . . . 100.0 *17.4 (8.02) *29.7 (14.46) 52.9 (15.56) 2 or more races . . . . . . . . . . . . . . . . . . . . . . . . . . . . 100.0 39.9 (4.21) 11.1 (2.60) 49.0 (4.47)
Black or African American; white . . . . . . . . . . . . . . . . . 100.0 *27.5 (13.92) *5.6 (5.57) 66.9 (14.34) American Indian and Alaska Native; white . . . . . . . . . . . 100.0 40.7 (6.52) *10.6 (4.04) 48.7 (7.27)
Hispanic origin and race2
Hispanic or Latino . . . . . . . . . . . . . . . . . . . . . . . . . . . 100.0 25.2 (1.33) 19.1 (1.08) 55.7 (1.59) Mexican or Mexican American . . . . . . . . . . . . . . . . . . 100.0 22.5 (1.41) 19.1 (1.45) 58.5 (1.91)
Not Hispanic or Latino. . . . . . . . . . . . . . . . . . . . . . . . . 100.0 36.6 (0.48) 13.9 (0.39) 49.5 (0.52) White, single race . . . . . . . . . . . . . . . . . . . . . . . . . . 100.0 36.7 (0.53) 13.7 (0.44) 49.6 (0.57) Black or African American, single race . . . . . . . . . . . . . 100.0 32.8 (1.52) 14.9 (1.12) 52.3 (1.62)
Education2
Less than high school graduate . . . . . . . . . . . . . . . . . . . 100.0 28.4 (1.05) 17.5 (0.98) 54.1 (1.29) GED diploma3 . . . . . . . . . . . . . . . . . . . . . . . . . . . . . 100.0 26.7 (2.36) 16.5 (2.39) 56.7 (3.12) High school graduate . . . . . . . . . . . . . . . . . . . . . . . . . 100.0 24.9 (0.81) 18.1 (0.80) 57.0 (0.98) Some college – no degree . . . . . . . . . . . . . . . . . . . . . . 100.0 34.4 (1.05) 13.6 (0.83) 52.0 (1.17) Associate of arts degree . . . . . . . . . . . . . . . . . . . . . . . 100.0 34.1 (1.73) 13.7 (1.13) 52.1 (1.85) Bachelor of arts, science degree . . . . . . . . . . . . . . . . . . 100.0 50.0 (1.36) 9.5 (0.87) 40.5 (1.29) Masters, doctorate, medical degree . . . . . . . . . . . . . . . . 100.0 56.0 (2.65) 8.4 (0.83) 35.6 (2.59)
Poverty status2,4
Below poverty level . . . . . . . . . . . . . . . . . . . . . . . . . . 100.0 33.7 (1.53) 14.9 (1.22) 51.4 (1.71) 1.00–1.99 times poverty level . . . . . . . . . . . . . . . . . . . . 100.0 32.3 (1.36) 17.0 (1.04) 50.7 (1.51) 2.00–3.99 times poverty level . . . . . . . . . . . . . . . . . . . . 100.0 30.3 (0.94) 15.4 (0.72) 54.4 (1.05) 4.00 times poverty level or more . . . . . . . . . . . . . . . . . . 100.0 40.4 (0.85) 12.7 (0.67) 46.9 (0.86)
Marital status2
Never married. . . . . . . . . . . . . . . . . . . . . . . . . . . . . . 100.0 37.1 (1.48) 16.4 (0.95) 46.6 (1.44) Married . . . . . . . . . . . . . . . . . . . . . . . . . . . . . . . . . . 100.0 34.4 (0.69) 14.2 (0.57) 51.4 (0.73) Cohabiting . . . . . . . . . . . . . . . . . . . . . . . . . . . . . . . . 100.0 34.3 (2.82) 14.5 (1.35) 51.3 (2.96) Divorced or separated. . . . . . . . . . . . . . . . . . . . . . . . . 100.0 33.4 (1.57) 14.4 (1.64) 52.2 (2.19) Widowed . . . . . . . . . . . . . . . . . . . . . . . . . . . . . . . . . 100.0 39.1 (4.39) *9.0 (2.96) 51.9 (5.01)
Geographic region2
Northeast . . . . . . . . . . . . . . . . . . . . . . . . . . . . . . . . 100.0 34.5 (1.13) 17.3 (1.03) 48.1 (1.10) Midwest . . . . . . . . . . . . . . . . . . . . . . . . . . . . . . . . . 100.0 34.2 (0.80) 13.6 (0.74) 52.2 (0.92) South . . . . . . . . . . . . . . . . . . . . . . . . . . . . . . . . . . . 100.0 35.4 (0.75) 14.3 (0.61) 50.3 (0.83) West . . . . . . . . . . . . . . . . . . . . . . . . . . . . . . . . . . . 100.0 37.2 (1.18) 13.6 (0.64) 49.2 (1.21)
See footnotes at end of table.
10 Advance Data No. 333 + May 14, 2003
Table 1. Percent distribution of type of usual daily activity among adults 18 years and over, by selected characteristics: United States, 2000—Con.
Usual daily activity related to moving around
Selected characteristic Total Sit Stand Walk
Percent distribution (standard error) Women
Ages 18 years and over (age adjusted)1,2 . . . . . . . . . . . . 100.0 38.3 (0.49) 12.3 (0.31) 49.4 (0.47) Ages 18 years and over (crude)1 . . . . . . . . . . . . . . . . . . 100.0 38.4 (0.49) 12.3 (0.31) 49.4 (0.47)
Age
18–24 years . . . . . . . . . . . . . . . . . . . . . . . . . . . . . . . 100.0 34.4 (1.46) 17.2 (1.11) 48.4 (1.53) 25–44 years . . . . . . . . . . . . . . . . . . . . . . . . . . . . . . . 100.0 36.0 (0.63) 13.6 (0.47) 50.4 (0.70) 45–64 years . . . . . . . . . . . . . . . . . . . . . . . . . . . . . . . 100.0 38.2 (0.83) 12.5 (0.54) 49.3 (0.79) 65 years and over . . . . . . . . . . . . . . . . . . . . . . . . . . . 100.0 46.7 (1.01) 5.4 (0.45) 48.0 (1.03)
Race2
White, single race . . . . . . . . . . . . . . . . . . . . . . . . . . . 100.0 37.4 (0.55) 12.0 (0.35) 50.6 (0.53) Black or African American, single race. . . . . . . . . . . . . . . 100.0 43.6 (1.10) 13.9 (0.93) 42.6 (1.03) American Indian or Alaska Native, single race . . . . . . . . . . 100.0 38.5 (6.13) 7.8 (2.30) 53.7 (6.13) Asian, single race . . . . . . . . . . . . . . . . . . . . . . . . . . . 100.0 43.2 (2.58) 12.1 (1.78) 44.7 (2.97) Native Hawaiian and Other Pacific Islander, single race . . . . 100.0 *36.6 (15.10) *1.6 (1.69) 61.8 (16.09) 2 or more races . . . . . . . . . . . . . . . . . . . . . . . . . . . . 100.0 35.2 (4.12) 10.6 (2.64) 54.2 (3.55)
Black or African American; white . . . . . . . . . . . . . . . . . 100.0 49.2 (10.77) *5.8 (2.68) 44.9 (11.13) American Indian and Alaska Native; white . . . . . . . . . . . 100.0 34.3 (5.64) *9.0 (3.70) 56.7 (4.82)
Hispanic origin and race2
Hispanic or Latino . . . . . . . . . . . . . . . . . . . . . . . . . . . 100.0 32.5 (1.04) 17.2 (0.84) 50.3 (1.08) Mexican or Mexican American . . . . . . . . . . . . . . . . . . 100.0 30.4 (1.48) 17.6 (1.19) 52.0 (1.53)
Not Hispanic or Latino. . . . . . . . . . . . . . . . . . . . . . . . . 100.0 39.0 (0.53) 11.8 (0.34) 49.2 (0.51) White, single race . . . . . . . . . . . . . . . . . . . . . . . . . . 100.0 38.1 (0.59) 11.4 (0.38) 50.4 (0.57) Black or African American, single race . . . . . . . . . . . . . 100.0 43.7 (1.11) 13.9 (0.94) 42.5 (1.05)
Education2
Less than high school graduate . . . . . . . . . . . . . . . . . . . 100.0 34.0 (1.01) 15.9 (0.83) 50.1 (1.07) GED diploma3 . . . . . . . . . . . . . . . . . . . . . . . . . . . . . 100.0 34.5 (2.65) 15.5 (1.81) 50.0 (2.74) High school graduate . . . . . . . . . . . . . . . . . . . . . . . . . 100.0 34.9 (0.87) 13.7 (0.60) 51.4 (0.90) Some college – no degree . . . . . . . . . . . . . . . . . . . . . . 100.0 41.6 (1.00) 10.7 (0.56) 47.7 (1.00) Associate of arts degree . . . . . . . . . . . . . . . . . . . . . . . 100.0 39.1 (1.48) 10.1 (0.94) 50.8 (1.45) Bachelor of arts, science degree . . . . . . . . . . . . . . . . . . 100.0 41.9 (1.18) 10.5 (0.75) 47.6 (1.19) Masters, doctorate, medical degree . . . . . . . . . . . . . . . . 100.0 38.5 (2.43) 9.8 (0.92) 51.7 (2.50)
Poverty status2,4
Below poverty level . . . . . . . . . . . . . . . . . . . . . . . . . . 100.0 39.9 (1.33) 13.5 (0.93) 46.6 (1.29) 1.00–1.99 times poverty level . . . . . . . . . . . . . . . . . . . . 100.0 34.4 (1.11) 13.8 (0.82) 51.8 (1.11) 2.00–3.99 times poverty level . . . . . . . . . . . . . . . . . . . . 100.0 36.0 (0.93) 12.5 (0.66) 51.5 (0.93) 4.00 times poverty level or more . . . . . . . . . . . . . . . . . . 100.0 41.8 (0.92) 10.6 (0.60) 47.6 (0.94)
Marital status2
Never married. . . . . . . . . . . . . . . . . . . . . . . . . . . . . . 100.0 46.3 (1.32) 13.6 (0.80) 40.1 (1.27) Married . . . . . . . . . . . . . . . . . . . . . . . . . . . . . . . . . . 100.0 34.0 (0.67) 12.0 (0.44) 54.0 (0.68) Cohabiting . . . . . . . . . . . . . . . . . . . . . . . . . . . . . . . . 100.0 42.7 (3.04) 10.9 (1.20) 46.4 (3.03) Divorced or separated. . . . . . . . . . . . . . . . . . . . . . . . . 100.0 40.2 (1.13) 12.4 (1.01) 47.4 (1.28) Widowed . . . . . . . . . . . . . . . . . . . . . . . . . . . . . . . . . 100.0 37.9 (2.97) 20.1 (1.18) 42.1 (3.00)
Geographic region2
Northeast . . . . . . . . . . . . . . . . . . . . . . . . . . . . . . . . 100.0 36.5 (1.15) 13.4 (0.74) 50.2 (1.04) Midwest . . . . . . . . . . . . . . . . . . . . . . . . . . . . . . . . . 100.0 38.2 (0.97) 10.8 (0.54) 51.0 (0.92) South . . . . . . . . . . . . . . . . . . . . . . . . . . . . . . . . . . . 100.0 39.2 (0.83) 12.8 (0.57) 48.0 (0.87) West . . . . . . . . . . . . . . . . . . . . . . . . . . . . . . . . . . . 100.0 38.5 (0.99) 12.3 (0.56) 49.2 (0.87)
*Figure does not meet standards of reliability or precision (see Technical Notes).1Persons of other races and unknown race and ethnicity, unknown education, unknown poverty status, and unknown marital status are included in the total but not shown separately.2Age adjusted to the 2000 U.S. standard population using age groups 18–24 years, 25–44 years, 45–64 years, and 65 years and over.3GED is General Educational Development high school equivalency diploma.4Poverty status is based on family income and family size using the U.S. Census Bureau poverty thresholds.

2000
Advance Data No. 333 + May 14, 2003 11
Table 2. Percent distribution of level of usual daily lifting activity for adults 18 years and over, by selected characteristics: United States,
Usual daily activity related to lifting or carrying things
Lift Lift Lift light moderate heavy
Selected characteristic Total No lifting1 loads loads loads
Percent distribution (standard error) Both sexes
Ages 18 years and over (age adjusted)2,3 . . . . . . . . . . . . 100.0 28.3 (0.34) 34.7 (0.35) 27.8 (0.35) 9.2 (0.23) Ages 18 years and over (crude)2 . . . . . . . . . . . . . . . . . . 100.0 28.1 (0.35) 34.7 (0.35) 27.9 (0.35) 9.3 (0.24)
Age
18–24 years . . . . . . . . . . . . . . . . . . . . . . . . . . . . . . . 100.0 18.5 (0.86) 34.2 (1.08) 33.4 (1.04) 13.9 (0.74) 25–44 years . . . . . . . . . . . . . . . . . . . . . . . . . . . . . . . 100.0 24.1 (0.44) 33.2 (0.50) 30.6 (0.51) 12.0 (0.37) 45–64 years . . . . . . . . . . . . . . . . . . . . . . . . . . . . . . . 100.0 31.0 (0.55) 35.8 (0.57) 25.7 (0.53) 7.5 (0.36) 65 years and over . . . . . . . . . . . . . . . . . . . . . . . . . . . 100.0 40.7 (0.83) 36.5 (0.75) 20.9 (0.72) 2.0 (0.21)
Race3
White, single race . . . . . . . . . . . . . . . . . . . . . . . . . . . 100.0 26.6 (0.35) 35.3 (0.40) 28.8 (0.39) 9.3 (0.25) Black or African American, single race. . . . . . . . . . . . . . . 100.0 38.0 (0.99) 31.0 (0.88) 22.8 (0.88) 8.2 (0.53) American Indian or Alaska Native, single race . . . . . . . . . . 100.0 27.3 (4.06) 31.7 (5.02) 33.0 (4.81) *7.9 (2.43) Asian, single race . . . . . . . . . . . . . . . . . . . . . . . . . . . 100.0 37.0 (2.19) 40.7 (2.17) 17.7 (1.90) 4.6 (1.09) Native Hawaiian and Other Pacific Islander, single race . . . . 100.0 *25.9 (10.15) *31.9 (10.78) *20.8 (7.89) *21.5 (9.26) 2 or more races . . . . . . . . . . . . . . . . . . . . . . . . . . . . 100.0 29.9 (3.04) 32.1 (3.29) 27.8 (2.73) 10.2 (1.78)
Black or African American; white . . . . . . . . . . . . . . . . . 100.0 36.1 (7.12) *29.8 (9.80) 30.9 (8.24) *3.2 (1.93) American Indian and Alaska Native; white . . . . . . . . . . . 100.0 24.9 (4.12) 33.4 (5.75) 28.0 (4.41) 13.7 (3.53)
Hispanic origin and race3
Hispanic or Latino . . . . . . . . . . . . . . . . . . . . . . . . . . . 100.0 30.2 (0.84) 31.4 (0.84) 25.7 (0.85) 12.6 (0.66) Mexican or Mexican American . . . . . . . . . . . . . . . . . . 100.0 26.8 (1.08) 29.9 (1.08) 28.8 (1.15) 14.4 (0.89)
Not Hispanic or Latino. . . . . . . . . . . . . . . . . . . . . . . . . 100.0 28.2 (0.36) 35.0 (0.38) 28.1 (0.37) 8.8 (0.25) White, single race . . . . . . . . . . . . . . . . . . . . . . . . . . 100.0 26.3 (0.37) 35.4 (0.43) 29.2 (0.41) 9.1 (0.27) Black or African American, single race . . . . . . . . . . . . . 100.0 38.2 (1.00) 30.7 (0.89) 22.8 (0.89) 8.2 (0.54)
Education3
Less than high school graduate . . . . . . . . . . . . . . . . . . . 100.0 29.3 (0.72) 30.8 (0.76) 27.2 (0.77) 12.7 (0.59) GED diploma4 . . . . . . . . . . . . . . . . . . . . . . . . . . . . . 100.0 22.2 (1.64) 34.8 (1.93) 32.0 (1.74) 11.0 (1.27) High school graduate . . . . . . . . . . . . . . . . . . . . . . . . . 100.0 23.3 (0.53) 32.5 (0.60) 32.7 (0.66) 11.5 (0.44) Some college – no degree . . . . . . . . . . . . . . . . . . . . . . 100.0 27.1 (0.70) 34.7 (0.77) 29.3 (0.70) 8.9 (0.46) Associate of arts degree . . . . . . . . . . . . . . . . . . . . . . . 100.0 25.6 (0.99) 36.4 (1.07) 28.0 (0.98) 9.9 (0.79) Bachelor of arts, science degree . . . . . . . . . . . . . . . . . . 100.0 34.1 (0.91) 38.0 (0.91) 22.3 (0.83) 5.6 (0.51) Masters, doctorate, medical degree . . . . . . . . . . . . . . . . 100.0 36.8 (1.96) 40.6 (1.98) 17.9 (0.92) 4.7 (1.41)
Poverty status3,5
Below poverty level . . . . . . . . . . . . . . . . . . . . . . . . . . 100.0 35.3 (1.07) 32.0 (1.02) 23.9 (0.83) 8.8 (0.63) 1.00–1.99 times poverty level . . . . . . . . . . . . . . . . . . . . 100.0 27.0 (0.81) 33.6 (0.86) 28.2 (0.81) 11.2 (0.63) 2.00–3.99 times poverty level . . . . . . . . . . . . . . . . . . . . 100.0 23.7 (0.61) 34.2 (0.65) 31.2 (0.67) 10.9 (0.43) 4.00 times poverty level or more . . . . . . . . . . . . . . . . . . 100.0 29.1 (0.58) 36.0 (0.65) 27.4 (0.64) 7.5 (0.37)
Marital status3
Never married. . . . . . . . . . . . . . . . . . . . . . . . . . . . . . 100.0 30.7 (0.93) 35.2 (0.97) 25.3 (0.80) 8.9 (0.48) Married . . . . . . . . . . . . . . . . . . . . . . . . . . . . . . . . . . 100.0 26.5 (0.46) 35.6 (0.50) 28.8 (0.51) 9.1 (0.34) Cohabiting . . . . . . . . . . . . . . . . . . . . . . . . . . . . . . . . 100.0 26.6 (1.80) 31.1 (1.85) 29.0 (1.78) 13.2 (1.52) Divorced or separated. . . . . . . . . . . . . . . . . . . . . . . . . 100.0 31.6 (0.88) 30.7 (1.09) 28.5 (1.11) 9.2 (0.63) Widowed . . . . . . . . . . . . . . . . . . . . . . . . . . . . . . . . . 100.0 27.7 (1.90) 39.1 (4.49) 26.3 (4.38) 6.8 (1.78)
Geographic region3
Northeast . . . . . . . . . . . . . . . . . . . . . . . . . . . . . . . . 100.0 27.3 (0.56) 34.7 (0.79) 29.2 (0.82) 8.8 (0.50) Midwest . . . . . . . . . . . . . . . . . . . . . . . . . . . . . . . . . 100.0 25.6 (0.65) 35.7 (0.79) 29.0 (0.71) 9.6 (0.49) South . . . . . . . . . . . . . . . . . . . . . . . . . . . . . . . . . . . 100.0 30.3 (0.63) 34.2 (0.56) 26.3 (0.56) 9.2 (0.39) West . . . . . . . . . . . . . . . . . . . . . . . . . . . . . . . . . . . 100.0 28.9 (0.81) 34.2 (0.65) 27.7 (0.72) 9.2 (0.51)
See footnotes at end of table.
12 Advance Data No. 333 + May 14, 2003
Table 2. Percent distribution of level of usual daily lifting activity for adults 18 years and over, by selected characteristics: United States, 2000—Con.
Usual daily activity related to lifting or carrying things
Lift Lift Lift light moderate heavy
Selected characteristic Total No lifting1 loads loads loads
Percent distribution (standard error) Men
Ages 18 years and over (age adjusted)2,3 . . . . . . . . . . . . 100.0 25.2 (0.44) 30.8 (0.49) 30.2 (0.48) 13.8 (0.38) Ages 18 years and over (crude)2 . . . . . . . . . . . . . . . . . . 100.0 24.8 (0.45) 30.6 (0.50) 30.5 (0.49) 14.2 (0.40)
Age 18–24 years . . . . . . . . . . . . . . . . . . . . . . . . . . . . . . . 100.0 13.4 (0.98) 30.4 (1.68) 36.1 (1.61) 20.1 (1.19) 25–44 years . . . . . . . . . . . . . . . . . . . . . . . . . . . . . . . 100.0 21.4 (0.61) 28.1 (0.72) 32.3 (0.75) 18.2 (0.65) 45–64 years . . . . . . . . . . . . . . . . . . . . . . . . . . . . . . . 100.0 29.4 (0.85) 30.9 (0.84) 28.2 (0.84) 11.4 (0.62) 65 years and over . . . . . . . . . . . . . . . . . . . . . . . . . . . 100.0 35.6 (1.16) 37.3 (1.21) 24.5 (1.08) 2.6 (0.38)
Race3
White, single race . . . . . . . . . . . . . . . . . . . . . . . . . . . 100.0 24.0 (0.48) 31.2 (0.56) 30.9 (0.55) 13.9 (0.41) Black or African American, single race. . . . . . . . . . . . . . . 100.0 31.5 (1.34) 28.7 (1.37) 27.1 (1.34) 12.6 (1.08) American Indian or Alaska Native, single race . . . . . . . . . . 100.0 25.0 (5.49) 24.7 (5.90) 36.8 (6.32) *13.4 (4.77) Asian, single race . . . . . . . . . . . . . . . . . . . . . . . . . . . 100.0 38.2 (3.17) 38.4 (3.00) 17.0 (2.53) 6.3 (1.79) Native Hawaiian and Other Pacific Islander, single race . . . . 100.0 *32.2 (12.42) *18.3 (10.92) *21.3 (9.20) *28.2 (11.37) 2 or more races . . . . . . . . . . . . . . . . . . . . . . . . . . . . 100.0 27.1 (4.70) 22.9 (4.89) 32.2 (3.71) 17.7 (3.34)
Black or African American; white . . . . . . . . . . . . . . . . . 100.0 *20.8 (12.70) *22.7 (12.40) 46.1 (13.72) *10.4 (7.36) American Indian and Alaska Native; white . . . . . . . . . . . 100.0 18.7 (5.52) 25.8 (6.14) 30.9 (5.85) 24.6 (6.95)
Hispanic origin and race3
Hispanic or Latino . . . . . . . . . . . . . . . . . . . . . . . . . . . 100.0 23.4 (1.08) 25.3 (1.17) 31.3 (1.34) 20.0 (1.19) Mexican or Mexican American . . . . . . . . . . . . . . . . . . 100.0 20.5 (1.24) 22.1 (1.38) 35.0 (1.67) 22.4 (1.55)
Not Hispanic or Latino. . . . . . . . . . . . . . . . . . . . . . . . . 100.0 25.5 (0.47) 31.4 (0.54) 30.1 (0.51) 13.0 (0.41) White, single race . . . . . . . . . . . . . . . . . . . . . . . . . . 100.0 24.1 (0.50) 31.5 (0.61) 31.0 (0.58) 13.4 (0.43) Black or African American, single race . . . . . . . . . . . . . 100.0 31.6 (1.35) 28.6 (1.39) 27.1 (1.35) 12.6 (1.09)
Education3
Less than high school graduate . . . . . . . . . . . . . . . . . . . 100.0 24.0 (0.96) 26.4 (1.15) 30.3 (1.20) 19.3 (0.99) GED diploma4 . . . . . . . . . . . . . . . . . . . . . . . . . . . . . 100.0 16.4 (2.01) 28.5 (2.66) 38.9 (2.94) 16.2 (2.21) High school graduate . . . . . . . . . . . . . . . . . . . . . . . . . 100.0 17.5 (0.69) 27.3 (0.87) 37.6 (0.97) 17.6 (0.73) Some college – no degree . . . . . . . . . . . . . . . . . . . . . . 100.0 23.0 (0.96) 31.3 (1.12) 32.1 (1.08) 13.6 (0.76) Associate of arts degree . . . . . . . . . . . . . . . . . . . . . . . 100.0 22.4 (1.47) 29.9 (1.70) 31.7 (1.57) 16.0 (1.42) Bachelor of arts, science degree . . . . . . . . . . . . . . . . . . 100.0 36.1 (1.29) 35.9 (1.37) 20.8 (1.14) 7.2 (0.87) Masters, doctorate, medical degree . . . . . . . . . . . . . . . . 100.0 37.3 (2.17) 41.8 (2.72) 15.8 (1.49) *5.0 (1.68)
Poverty status3,5
Below poverty level . . . . . . . . . . . . . . . . . . . . . . . . . . 100.0 30.8 (1.64) 26.0 (1.62) 27.6 (1.48) 15.6 (1.31) 1.00–1.99 times poverty level . . . . . . . . . . . . . . . . . . . . 100.0 23.7 (1.25) 28.9 (1.26) 30.3 (1.32) 17.1 (1.09) 2.00–3.99 times poverty level . . . . . . . . . . . . . . . . . . . . 100.0 19.5 (0.82) 30.4 (0.95) 34.0 (1.00) 16.1 (0.74) 4.00 times poverty level or more . . . . . . . . . . . . . . . . . . 100.0 28.3 (0.76) 32.4 (0.91) 28.5 (0.83) 10.8 (0.60)
Marital status3
Never married. . . . . . . . . . . . . . . . . . . . . . . . . . . . . . 100.0 25.8 (1.27) 34.0 (1.42) 27.7 (1.24) 12.4 (0.82) Married . . . . . . . . . . . . . . . . . . . . . . . . . . . . . . . . . . 100.0 24.5 (0.62) 30.0 (0.69) 31.3 (0.77) 14.3 (0.60) Cohabiting . . . . . . . . . . . . . . . . . . . . . . . . . . . . . . . . 100.0 22.0 (2.28) 26.4 (2.61) 31.7 (2.54) 19.9 (2.23) Divorced or separated. . . . . . . . . . . . . . . . . . . . . . . . . 100.0 27.5 (1.41) 27.4 (2.37) 30.7 (2.20) 14.4 (1.36) Widowed . . . . . . . . . . . . . . . . . . . . . . . . . . . . . . . . . 100.0 26.1 (3.54) 29.8 (4.54) 32.0 (4.95) *12.1 (3.67)
Geographic region3
Northeast . . . . . . . . . . . . . . . . . . . . . . . . . . . . . . . . 100.0 26.4 (0.94) 31.1 (1.05) 29.9 (1.03) 12.6 (0.75) Midwest . . . . . . . . . . . . . . . . . . . . . . . . . . . . . . . . . 100.0 22.6 (0.88) 32.0 (1.14) 31.0 (1.02) 14.4 (0.82) South . . . . . . . . . . . . . . . . . . . . . . . . . . . . . . . . . . . 100.0 26.0 (0.76) 30.0 (0.77) 30.1 (0.84) 13.9 (0.65) West . . . . . . . . . . . . . . . . . . . . . . . . . . . . . . . . . . . 100.0 25.7 (1.01) 30.6 (1.03) 29.9 (0.95) 13.8 (0.87)
See footnotes at end of table.
Advance Data No. 333 + May 14, 2003 13
Table 2. Percent distribution of level of usual daily lifting activity for adults 18 years and over, by selected characteristics: United States, 2000—Con.
Usual daily activity related to lifting or carrying things
Lift Lift Lift light moderate heavy
Selected characteristic Total No lifting1 loads loads loads
Percent distribution (standard error) Women
Ages 18 years and over (age adjusted)2,3 . . . . . . . . . . . . 100.0 31.0 (0.45) 38.4 (0.43) 25.7 (0.44) 4.9 (0.22) Ages 18 years and over (crude)2 . . . . . . . . . . . . . . . . . . 100.0 31.2 (0.47) 38.4 (0.43) 25.6 (0.45) 4.8 (0.22)
Age
18–24 years . . . . . . . . . . . . . . . . . . . . . . . . . . . . . . . 100.0 23.5 (1.23) 38.0 (1.45) 30.7 (1.36) 7.8 (0.93) 25–44 years . . . . . . . . . . . . . . . . . . . . . . . . . . . . . . . 100.0 26.7 (0.61) 38.2 (0.64) 29.0 (0.61) 6.1 (0.35) 45–64 years . . . . . . . . . . . . . . . . . . . . . . . . . . . . . . . 100.0 32.6 (0.76) 40.4 (0.71) 23.2 (0.70) 3.8 (0.32) 65 years and over . . . . . . . . . . . . . . . . . . . . . . . . . . . 100.0 44.4 (1.05) 35.9 (0.90) 18.2 (0.84) 1.5 (0.21)
Race3
White, single race . . . . . . . . . . . . . . . . . . . . . . . . . . . 100.0 28.9 (0.49) 39.2 (0.49) 27.0 (0.50) 4.9 (0.26) Black or African American, single race. . . . . . . . . . . . . . . 100.0 43.2 (1.25) 33.0 (1.21) 19.3 (0.98) 4.6 (0.43) American Indian or Alaska Native, single race . . . . . . . . . . 100.0 30.5 (5.48) 35.4 (4.82) 30.8 (6.57) *3.4 (1.45) Asian, single race . . . . . . . . . . . . . . . . . . . . . . . . . . . 100.0 35.7 (2.92) 42.9 (3.03) 18.4 (2.22) *3.0 (1.15) Native Hawaiian and Other Pacific Islander, single race . . . . 100.0 *17.6 (11.16) 62.7 (13.72) *19.7 (10.68) *– 2 or more races . . . . . . . . . . . . . . . . . . . . . . . . . . . . 100.0 32.0 (4.00) 40.8 (4.90) 23.7 (3.58) *3.4 (1.26)
Black or African American; white . . . . . . . . . . . . . . . . . 100.0 37.5 (7.63) *31.8 (10.34) 29.8 (8.55) *0.9 (0.90) American Indian and Alaska Native; white . . . . . . . . . . . 100.0 31.4 (6.17) 40.7 (7.90) 23.5 (5.60) *4.4 (2.30)
Hispanic origin and race3
Hispanic or Latino . . . . . . . . . . . . . . . . . . . . . . . . . . . 100.0 36.6 (1.17) 37.5 (1.17) 20.6 (1.00) 5.4 (0.51) Mexican or Mexican American . . . . . . . . . . . . . . . . . . 100.0 33.1 (1.55) 38.0 (1.63) 22.8 (1.38) 6.1 (0.65)
Not Hispanic or Latino. . . . . . . . . . . . . . . . . . . . . . . . . 100.0 30.6 (0.49) 38.4 (0.46) 26.2 (0.47) 4.8 (0.25) White, single race . . . . . . . . . . . . . . . . . . . . . . . . . . 100.0 28.3 (0.52) 39.1 (0.53) 27.6 (0.53) 4.9 (0.28) Black or African American, single race . . . . . . . . . . . . . 100.0 43.5 (1.26) 32.6 (1.22) 19.4 (0.99) 4.6 (0.43)
Education3
Less than high school graduate . . . . . . . . . . . . . . . . . . . 100.0 34.5 (1.04) 35.7 (0.97) 24.0 (0.88) 5.9 (0.52) GED diploma4 . . . . . . . . . . . . . . . . . . . . . . . . . . . . . 100.0 27.9 (2.41) 41.0 (2.64) 25.0 (2.12) 6.1 (1.34) High school graduate . . . . . . . . . . . . . . . . . . . . . . . . . 100.0 28.6 (0.82) 37.6 (0.77) 28.5 (0.82) 5.4 (0.42) Some college – no degree . . . . . . . . . . . . . . . . . . . . . . 100.0 30.7 (0.95) 37.6 (0.95) 26.8 (0.89) 4.8 (0.47) Associate of arts degree . . . . . . . . . . . . . . . . . . . . . . . 100.0 28.0 (1.29) 41.8 (1.42) 25.1 (1.31) 5.0 (0.71) Bachelor of arts, science degree . . . . . . . . . . . . . . . . . . 100.0 32.3 (1.17) 39.9 (1.23) 23.6 (1.11) 4.1 (0.51) Masters, doctorate, medical degree . . . . . . . . . . . . . . . . 100.0 35.6 (2.84) 39.8 (2.66) 20.5 (1.31) *4.1 (2.00)
Poverty status3,5
Below poverty level . . . . . . . . . . . . . . . . . . . . . . . . . . 100.0 38.2 (1.27) 36.5 (1.27) 21.5 (0.98) 3.9 (0.44) 1.00–1.99 times poverty level . . . . . . . . . . . . . . . . . . . . 100.0 29.7 (1.06) 38.0 (1.10) 26.4 (1.00) 5.9 (0.55) 2.00–3.99 times poverty level . . . . . . . . . . . . . . . . . . . . 100.0 27.7 (0.82) 37.8 (0.88) 28.5 (0.86) 5.9 (0.51) 4.00 times poverty level or more . . . . . . . . . . . . . . . . . . 100.0 30.1 (0.88) 39.9 (0.92) 26.2 (0.93) 3.8 (0.35)
Marital status3
Never married. . . . . . . . . . . . . . . . . . . . . . . . . . . . . . 100.0 36.0 (1.29) 36.9 (1.31) 22.6 (1.10) 4.6 (0.48) Married . . . . . . . . . . . . . . . . . . . . . . . . . . . . . . . . . . 100.0 28.2 (0.62) 40.5 (0.63) 26.7 (0.62) 4.7 (0.31) Cohabiting . . . . . . . . . . . . . . . . . . . . . . . . . . . . . . . . 100.0 31.9 (2.78) 35.6 (2.58) 26.2 (2.43) 6.3 (1.62) Divorced or separated. . . . . . . . . . . . . . . . . . . . . . . . . 100.0 34.5 (1.12) 33.2 (1.12) 26.7 (1.28) 5.5 (0.54) Widowed . . . . . . . . . . . . . . . . . . . . . . . . . . . . . . . . . 100.0 30.1 (2.58) 41.5 (4.69) 23.3 (4.46) *5.0 (2.09)
Geographic region3
Northeast . . . . . . . . . . . . . . . . . . . . . . . . . . . . . . . . 100.0 28.0 (0.84) 37.9 (1.01) 28.7 (1.20) 5.4 (0.59) Midwest . . . . . . . . . . . . . . . . . . . . . . . . . . . . . . . . . 100.0 28.3 (0.90) 39.3 (0.91) 27.3 (0.85) 5.1 (0.46) South . . . . . . . . . . . . . . . . . . . . . . . . . . . . . . . . . . . 100.0 34.2 (0.82) 38.2 (0.71) 23.0 (0.69) 4.7 (0.36) West . . . . . . . . . . . . . . . . . . . . . . . . . . . . . . . . . . . 100.0 31.9 (1.02) 38.2 (0.80) 25.5 (0.86) 4.4 (0.45)
*Figure does not meet standards of reliability or precision (see Technical Notes). – Quantity zero.1Includes ‘‘do not lift or carry things’’ during usual daily activities and ‘‘unable to lift or carry things’’ during usual daily activities.2Persons of other races and unknown race and ethnicity, unknown education, unknown poverty status, and unknown marital status are included in the total but not shown separately.3Age adjusted to the 2000 U.S. standard population using age groups 18–24 years, 25–44 years, 45–64 years, and 65 years and over.4GED is General Educational Development high school equivalency diploma.5Poverty status is based on family income and family size using the U.S. Census Bureau poverty thresholds.
14 Advance Data No. 333 + May 14, 2003
Table 3. Percent of adults 18 years and over who engaged in regular leisure-time physical activity, by type of usual daily activity and by sex: United States, 2000
Engaged in regular leisure-time physical activity1
Selected characteristic Both sexes Men Women
Percent (standard error)
Ages 18 years and over (age adjusted)2 . . . . . . . . . . . . . . . . . 31.8 (0.36) 35.4 (0.49) 28.5 (0.43) Ages 18 years and over (crude). . . . . . . . . . . . . . . . . . . . . . . 31.9 (0.36) 35.7 (0.49) 28.4 (0.43)
Usual daily activity related to moving around
Sit . . . . . . . . . . . . . . . . . . . . . . . . . . . . . . . . . . . . . . . . . 27.7 (0.49) 32.5 (0.76) 23.8 (0.61) Stand . . . . . . . . . . . . . . . . . . . . . . . . . . . . . . . . . . . . . . . 28.5 (0.94) 30.9 (1.29) 25.8 (1.21) Walk . . . . . . . . . . . . . . . . . . . . . . . . . . . . . . . . . . . . . . . 36.6 (0.51) 39.7 (0.74) 33.7 (0.63)
Usual daily activity related to lifting or carrying things
No lifting3 . . . . . . . . . . . . . . . . . . . . . . . . . . . . . . . . . . . . 25.7 (0.54) 31.4 (0.90) 21.6 (0.69) Lift or carry light loads. . . . . . . . . . . . . . . . . . . . . . . . . . . . . 31.7 (0.59) 35.1 (0.91) 29.2 (0.68) Lift or carry moderate loads . . . . . . . . . . . . . . . . . . . . . . . . . 38.4 (0.69) 39.3 (0.99) 37.5 (0.91) Lift or carry heavy loads . . . . . . . . . . . . . . . . . . . . . . . . . . . 36.1 (1.34) 37.3 (1.62) 32.6 (2.17)
1Regular leisure-time physical activity is engaging in light-moderate activity at least five times per week for at least 30 minutes each time, engaging in vigorous activity at least three times per week for at at least 20 minutes each time, or meeting either one or both of the first two criteria. 2Age adjusted to the 2000 U.S. standard population using age groups 18–24 years, 25–44 years, 45–64 years, and 65 years and over. 3Includes ‘‘do not lift or carry things’’ during usual daily activities and ‘‘unable to lift or carry things’’ during usual daily activities.
2000
Advance Data No. 333 + May 14, 2003 15
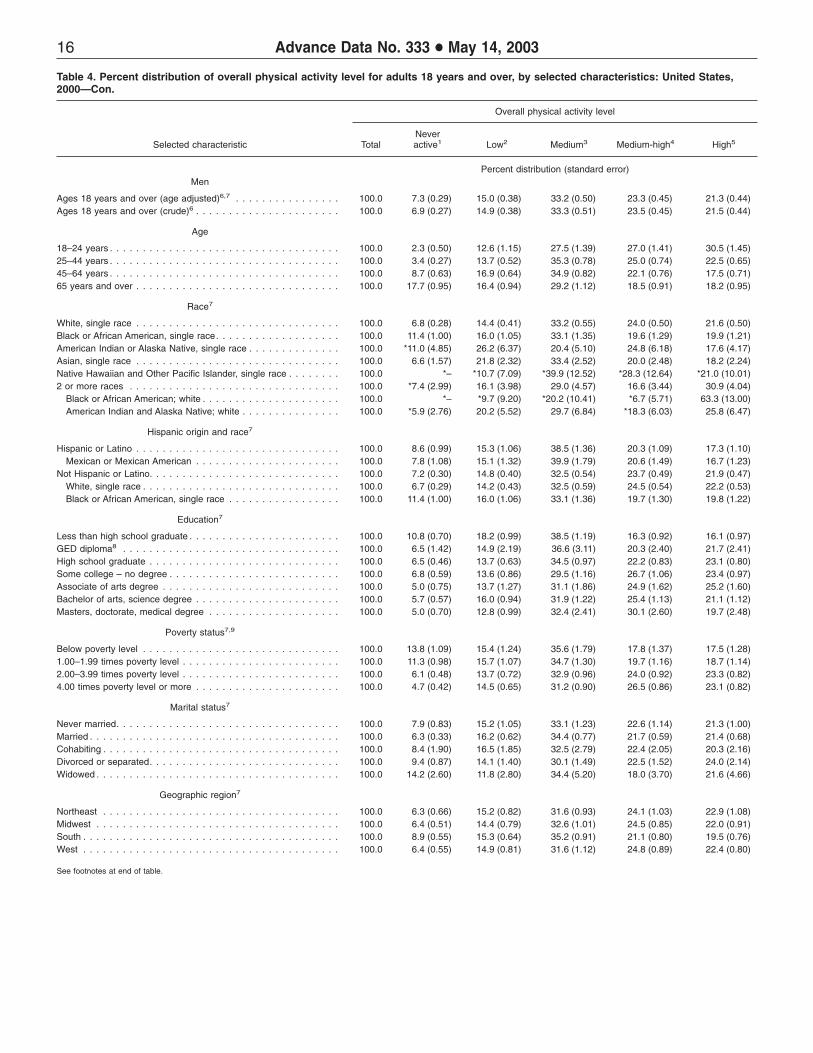
Table 4. Percent distribution of overall physical activity level for adults 18 years and over, by selected characteristics: United States,
Overall physical activity level
Never Selected characteristic Total active1 Low2 Medium3 Medium-high4 High5
Percent distribution (standard error) Both sexes
Ages 18 years and over (age adjusted)6,7 . . . . . . . . . . . . . . . . 100.0 9.6 (0.22) 15.7 (0.27) 32.1 (0.32) 23.5 (0.31) 19.0 (0.30) Ages 18 years and over (crude)6 . . . . . . . . . . . . . . . . . . . . . . 100.0 9.4 (0.22) 15.7 (0.27) 32.2 (0.33) 23.6 (0.31) 19.1 (0.30)
Age
18–24 years . . . . . . . . . . . . . . . . . . . . . . . . . . . . . . . . . . . 100.0 4.4 (0.44) 14.2 (0.77) 29.9 (0.93) 27.5 (0.98) 24.1 (0.93) 25–44 years . . . . . . . . . . . . . . . . . . . . . . . . . . . . . . . . . . . 100.0 5.3 (0.21) 15.0 (0.40) 34.0 (0.51) 25.2 (0.49) 20.5 (0.44) 45–64 years . . . . . . . . . . . . . . . . . . . . . . . . . . . . . . . . . . . 100.0 10.1 (0.40) 17.4 (0.44) 33.0 (0.56) 22.5 (0.52) 17.1 (0.50) 65 years and over . . . . . . . . . . . . . . . . . . . . . . . . . . . . . . . 100.0 22.5 (0.73) 15.8 (0.59) 27.9 (0.66) 18.4 (0.57) 15.3 (0.57)
Race7
White, single race . . . . . . . . . . . . . . . . . . . . . . . . . . . . . . . 100.0 8.7 (0.23) 14.9 (0.28) 32.1 (0.35) 24.5 (0.35) 19.8 (0.34) Black or African American, single race. . . . . . . . . . . . . . . . . . . 100.0 15.9 (0.67) 18.5 (0.83) 32.5 (0.88) 18.9 (0.86) 14.3 (0.65) American Indian or Alaska Native, single race . . . . . . . . . . . . . . 100.0 13.0 (3.59) 25.0 (4.85) 24.2 (3.54) 21.8 (4.21) 16.0 (3.20) Asian, single race . . . . . . . . . . . . . . . . . . . . . . . . . . . . . . . 100.0 9.4 (1.14) 21.3 (1.78) 32.9 (1.88) 20.0 (1.97) 16.3 (1.47) Native Hawaiian and Other Pacific Islander, single race . . . . . . . . 100.0 *– *12.9 (5.98) 36.1 (10.38) *23.5 (8.78) *27.4 (10.69) 2 or more races . . . . . . . . . . . . . . . . . . . . . . . . . . . . . . . . 100.0 9.6 (2.09) 14.9 (2.37) 28.5 (2.98) 21.4 (3.36) 25.6 (3.14)
Black or African American; white . . . . . . . . . . . . . . . . . . . . . 100.0 18.6 (1.19) *7.1 (3.38) 35.1 (8.99) *8.8 (6.04) 30.4 (8.12) American Indian and Alaska Native; white . . . . . . . . . . . . . . . 100.0 9.8 (2.79) 16.8 (2.94) 22.9 (4.30) 26.6 (4.67) 23.9 (4.45)
Hispanic origin and race7
Hispanic or Latino . . . . . . . . . . . . . . . . . . . . . . . . . . . . . . . 100.0 11.2 (0.61) 17.7 (0.75) 36.5 (0.91) 19.4 (0.76) 15.2 (0.65) Mexican or Mexican American . . . . . . . . . . . . . . . . . . . . . . 100.0 10.4 (0.83) 17.6 (1.03) 37.5 (1.22) 19.9 (0.98) 14.6 (0.72)
Not Hispanic or Latino. . . . . . . . . . . . . . . . . . . . . . . . . . . . . 100.0 9.4 (0.23) 15.4 (0.29) 31.6 (0.34) 24.0 (0.34) 19.5 (0.32) White, single race . . . . . . . . . . . . . . . . . . . . . . . . . . . . . . 100.0 8.5 (0.24) 14.5 (0.29) 31.5 (0.38) 25.1 (0.38) 20.4 (0.37) Black or African American, single race . . . . . . . . . . . . . . . . . 100.0 16.0 (0.67) 18.4 (0.84) 32.5 (0.88) 18.9 (0.87) 14.2 (0.65)
Education7
Less than high school graduate . . . . . . . . . . . . . . . . . . . . . . . 100.0 14.4 (0.55) 18.7 (0.69) 36.9 (0.85) 16.3 (0.62) 13.8 (0.64) GED diploma8 . . . . . . . . . . . . . . . . . . . . . . . . . . . . . . . . . 100.0 10.4 (1.19) 16.0 (1.40) 35.5 (2.04) 20.0 (1.58) 18.1 (1.62) High school graduate . . . . . . . . . . . . . . . . . . . . . . . . . . . . . 100.0 9.1 (0.36) 15.5 (0.46) 33.2 (0.59) 22.9 (0.57) 19.3 (0.53) Some college – no degree . . . . . . . . . . . . . . . . . . . . . . . . . . 100.0 9.0 (0.45) 15.5 (0.55) 29.6 (0.71) 25.2 (0.64) 20.6 (0.62) Associate of arts degree . . . . . . . . . . . . . . . . . . . . . . . . . . . 100.0 7.2 (0.58) 14.9 (0.86) 31.0 (1.14) 26.2 (1.01) 20.6 (0.95) Bachelor of arts, science degree . . . . . . . . . . . . . . . . . . . . . . 100.0 6.3 (0.41) 15.1 (0.66) 30.8 (0.82) 27.0 (0.80) 20.9 (0.75) Masters, doctorate, medical degree . . . . . . . . . . . . . . . . . . . . 100.0 6.9 (1.19) 12.1 (0.71) 29.1 (1.67) 28.6 (1.72) 23.3 (1.80)
Poverty status7,9
Below poverty level . . . . . . . . . . . . . . . . . . . . . . . . . . . . . . 100.0 18.0 (0.84) 16.4 (0.81) 34.0 (1.02) 17.3 (0.81) 14.3 (0.80) 1.00–1.99 times poverty level . . . . . . . . . . . . . . . . . . . . . . . . 100.0 12.9 (0.64) 16.5 (0.66) 34.0 (0.81) 20.1 (0.71) 16.6 (0.72) 2.00–3.99 times poverty level . . . . . . . . . . . . . . . . . . . . . . . . 100.0 8.0 (0.38) 15.1 (0.49) 32.1 (0.64) 24.9 (0.61) 19.9 (0.55) 4.00 times poverty level or more . . . . . . . . . . . . . . . . . . . . . . 100.0 5.9 (0.36) 14.7 (0.49) 30.5 (0.64) 27.0 (0.58) 21.9 (0.56)
Marital status7
Never married. . . . . . . . . . . . . . . . . . . . . . . . . . . . . . . . . . 100.0 11.3 (0.66) 16.7 (0.74) 31.8 (0.81) 23.3 (0.78) 16.9 (0.61) Married . . . . . . . . . . . . . . . . . . . . . . . . . . . . . . . . . . . . . . 100.0 7.9 (0.26) 15.8 (0.41) 33.2 (0.48) 23.5 (0.43) 19.7 (0.44) Cohabiting . . . . . . . . . . . . . . . . . . . . . . . . . . . . . . . . . . . . 100.0 10.2 (1.40) 17.5 (1.49) 32.7 (2.01) 21.5 (1.47) 18.1 (1.58) Divorced or separated. . . . . . . . . . . . . . . . . . . . . . . . . . . . . 100.0 11.3 (0.59) 16.1 (0.83) 31.7 (1.01) 21.9 (0.94) 19.0 (1.13) Widowed . . . . . . . . . . . . . . . . . . . . . . . . . . . . . . . . . . . . . 100.0 15.9 (1.74) 17.3 (4.24) 36.5 (4.54) 15.1 (1.73) 15.2 (2.09)
Geographic region7
Northeast . . . . . . . . . . . . . . . . . . . . . . . . . . . . . . . . . . . . 100.0 8.2 (0.44) 15.3 (0.62) 31.0 (0.65) 25.1 (0.78) 20.4 (0.72) Midwest . . . . . . . . . . . . . . . . . . . . . . . . . . . . . . . . . . . . . 100.0 8.4 (0.36) 15.1 (0.48) 31.9 (0.66) 24.8 (0.60) 19.8 (0.58) South . . . . . . . . . . . . . . . . . . . . . . . . . . . . . . . . . . . . . . . 100.0 11.7 (0.44) 16.4 (0.46) 33.4 (0.56) 21.6 (0.52) 16.9 (0.51) West . . . . . . . . . . . . . . . . . . . . . . . . . . . . . . . . . . . . . . . 100.0 8.4 (0.40) 15.8 (0.70) 31.2 (0.72) 24.0 (0.66) 20.7 (0.61)
See footnotes at end of table.
16 Advance Data No. 333 + May 14, 2003
Table 4. Percent distribution of overall physical activity level for adults 18 years and over, by selected characteristics: United States, 2000—Con.
Overall physical activity level
Never Selected characteristic Total active1 Low2 Medium3 Medium-high4 High5
Percent distribution (standard error) Men
Ages 18 years and over (age adjusted)6,7 . . . . . . . . . . . . . . . . 100.0 7.3 (0.29) 15.0 (0.38) 33.2 (0.50) 23.3 (0.45) 21.3 (0.44) Ages 18 years and over (crude)6 . . . . . . . . . . . . . . . . . . . . . . 100.0 6.9 (0.27) 14.9 (0.38) 33.3 (0.51) 23.5 (0.45) 21.5 (0.44)
Age
18–24 years . . . . . . . . . . . . . . . . . . . . . . . . . . . . . . . . . . . 100.0 2.3 (0.50) 12.6 (1.15) 27.5 (1.39) 27.0 (1.41) 30.5 (1.45) 25–44 years . . . . . . . . . . . . . . . . . . . . . . . . . . . . . . . . . . . 100.0 3.4 (0.27) 13.7 (0.52) 35.3 (0.78) 25.0 (0.74) 22.5 (0.65) 45–64 years . . . . . . . . . . . . . . . . . . . . . . . . . . . . . . . . . . . 100.0 8.7 (0.63) 16.9 (0.64) 34.9 (0.82) 22.1 (0.76) 17.5 (0.71) 65 years and over . . . . . . . . . . . . . . . . . . . . . . . . . . . . . . . 100.0 17.7 (0.95) 16.4 (0.94) 29.2 (1.12) 18.5 (0.91) 18.2 (0.95)
Race7
White, single race . . . . . . . . . . . . . . . . . . . . . . . . . . . . . . . 100.0 6.8 (0.28) 14.4 (0.41) 33.2 (0.55) 24.0 (0.50) 21.6 (0.50) Black or African American, single race. . . . . . . . . . . . . . . . . . . 100.0 11.4 (1.00) 16.0 (1.05) 33.1 (1.35) 19.6 (1.29) 19.9 (1.21) American Indian or Alaska Native, single race . . . . . . . . . . . . . . 100.0 *11.0 (4.85) 26.2 (6.37) 20.4 (5.10) 24.8 (6.18) 17.6 (4.17) Asian, single race . . . . . . . . . . . . . . . . . . . . . . . . . . . . . . . 100.0 6.6 (1.57) 21.8 (2.32) 33.4 (2.52) 20.0 (2.48) 18.2 (2.24) Native Hawaiian and Other Pacific Islander, single race . . . . . . . . 100.0 *– *10.7 (7.09) *39.9 (12.52) *28.3 (12.64) *21.0 (10.01) 2 or more races . . . . . . . . . . . . . . . . . . . . . . . . . . . . . . . . 100.0 *7.4 (2.99) 16.1 (3.98) 29.0 (4.57) 16.6 (3.44) 30.9 (4.04)
Black or African American; white . . . . . . . . . . . . . . . . . . . . . 100.0 *– *9.7 (9.20) *20.2 (10.41) *6.7 (5.71) 63.3 (13.00) American Indian and Alaska Native; white . . . . . . . . . . . . . . . 100.0 *5.9 (2.76) 20.2 (5.52) 29.7 (6.84) *18.3 (6.03) 25.8 (6.47)
Hispanic origin and race7
Hispanic or Latino . . . . . . . . . . . . . . . . . . . . . . . . . . . . . . . 100.0 8.6 (0.99) 15.3 (1.06) 38.5 (1.36) 20.3 (1.09) 17.3 (1.10) Mexican or Mexican American . . . . . . . . . . . . . . . . . . . . . . 100.0 7.8 (1.08) 15.1 (1.32) 39.9 (1.79) 20.6 (1.49) 16.7 (1.23)
Not Hispanic or Latino. . . . . . . . . . . . . . . . . . . . . . . . . . . . . 100.0 7.2 (0.30) 14.8 (0.40) 32.5 (0.54) 23.7 (0.49) 21.9 (0.47) White, single race . . . . . . . . . . . . . . . . . . . . . . . . . . . . . . 100.0 6.7 (0.29) 14.2 (0.43) 32.5 (0.59) 24.5 (0.54) 22.2 (0.53) Black or African American, single race . . . . . . . . . . . . . . . . . 100.0 11.4 (1.00) 16.0 (1.06) 33.1 (1.36) 19.7 (1.30) 19.8 (1.22)
Education7
Less than high school graduate . . . . . . . . . . . . . . . . . . . . . . . 100.0 10.8 (0.70) 18.2 (0.99) 38.5 (1.19) 16.3 (0.92) 16.1 (0.97) GED diploma8 . . . . . . . . . . . . . . . . . . . . . . . . . . . . . . . . . 100.0 6.5 (1.42) 14.9 (2.19) 36.6 (3.11) 20.3 (2.40) 21.7 (2.41) High school graduate . . . . . . . . . . . . . . . . . . . . . . . . . . . . . 100.0 6.5 (0.46) 13.7 (0.63) 34.5 (0.97) 22.2 (0.83) 23.1 (0.80) Some college – no degree . . . . . . . . . . . . . . . . . . . . . . . . . . 100.0 6.8 (0.59) 13.6 (0.86) 29.5 (1.16) 26.7 (1.06) 23.4 (0.97) Associate of arts degree . . . . . . . . . . . . . . . . . . . . . . . . . . . 100.0 5.0 (0.75) 13.7 (1.27) 31.1 (1.86) 24.9 (1.62) 25.2 (1.60) Bachelor of arts, science degree . . . . . . . . . . . . . . . . . . . . . . 100.0 5.7 (0.57) 16.0 (0.94) 31.9 (1.22) 25.4 (1.13) 21.1 (1.12) Masters, doctorate, medical degree . . . . . . . . . . . . . . . . . . . . 100.0 5.0 (0.70) 12.8 (0.99) 32.4 (2.41) 30.1 (2.60) 19.7 (2.48)
Poverty status7,9
Below poverty level . . . . . . . . . . . . . . . . . . . . . . . . . . . . . . 100.0 13.8 (1.09) 15.4 (1.24) 35.6 (1.79) 17.8 (1.37) 17.5 (1.28) 1.00–1.99 times poverty level . . . . . . . . . . . . . . . . . . . . . . . . 100.0 11.3 (0.98) 15.7 (1.07) 34.7 (1.30) 19.7 (1.16) 18.7 (1.14) 2.00–3.99 times poverty level . . . . . . . . . . . . . . . . . . . . . . . . 100.0 6.1 (0.48) 13.7 (0.72) 32.9 (0.96) 24.0 (0.92) 23.3 (0.82) 4.00 times poverty level or more . . . . . . . . . . . . . . . . . . . . . . 100.0 4.7 (0.42) 14.5 (0.65) 31.2 (0.90) 26.5 (0.86) 23.1 (0.82)
Marital status7
Never married. . . . . . . . . . . . . . . . . . . . . . . . . . . . . . . . . . 100.0 7.9 (0.83) 15.2 (1.05) 33.1 (1.23) 22.6 (1.14) 21.3 (1.00) Married . . . . . . . . . . . . . . . . . . . . . . . . . . . . . . . . . . . . . . 100.0 6.3 (0.33) 16.2 (0.62) 34.4 (0.77) 21.7 (0.59) 21.4 (0.68) Cohabiting . . . . . . . . . . . . . . . . . . . . . . . . . . . . . . . . . . . . 100.0 8.4 (1.90) 16.5 (1.85) 32.5 (2.79) 22.4 (2.05) 20.3 (2.16) Divorced or separated. . . . . . . . . . . . . . . . . . . . . . . . . . . . . 100.0 9.4 (0.87) 14.1 (1.40) 30.1 (1.49) 22.5 (1.52) 24.0 (2.14) Widowed . . . . . . . . . . . . . . . . . . . . . . . . . . . . . . . . . . . . . 100.0 14.2 (2.60) 11.8 (2.80) 34.4 (5.20) 18.0 (3.70) 21.6 (4.66)
Geographic region7
Northeast . . . . . . . . . . . . . . . . . . . . . . . . . . . . . . . . . . . . 100.0 6.3 (0.66) 15.2 (0.82) 31.6 (0.93) 24.1 (1.03) 22.9 (1.08) Midwest . . . . . . . . . . . . . . . . . . . . . . . . . . . . . . . . . . . . . 100.0 6.4 (0.51) 14.4 (0.79) 32.6 (1.01) 24.5 (0.85) 22.0 (0.91) South . . . . . . . . . . . . . . . . . . . . . . . . . . . . . . . . . . . . . . . 100.0 8.9 (0.55) 15.3 (0.64) 35.2 (0.91) 21.1 (0.80) 19.5 (0.76) West . . . . . . . . . . . . . . . . . . . . . . . . . . . . . . . . . . . . . . . 100.0 6.4 (0.55) 14.9 (0.81) 31.6 (1.12) 24.8 (0.89) 22.4 (0.80)
See footnotes at end of table.

Advance Data No. 333 + May 14, 2003 17
Table 4. Percent distribution of overall physical activity level for adults 18 years and over, by selected characteristics: United States, 2000—Con.
Overall physical activity level
Never Selected characteristic Total active1 Low2 Medium3 Medium-high4 High5
Percent distribution (standard error) Women
Ages 18 years and over (age adjusted)6,7 . . . . . . . . . . . . . . . . 100.0 11.6 (0.31) 16.5 (0.36) 31.3 (0.42) 23.8 (0.41) 16.9 (0.34) Ages 18 years and over (crude)6 . . . . . . . . . . . . . . . . . . . . . . 100.0 11.7 (0.33) 16.5 (0.36) 31.2 (0.42) 23.7 (0.41) 16.9 (0.34)
Age
18–24 years . . . . . . . . . . . . . . . . . . . . . . . . . . . . . . . . . . . 100.0 6.4 (0.68) 15.7 (1.01) 32.2 (1.36) 28.0 (1.37) 17.7 (1.07) 25–44 years . . . . . . . . . . . . . . . . . . . . . . . . . . . . . . . . . . . 100.0 7.2 (0.34) 16.2 (0.55) 32.8 (0.67) 25.3 (0.62) 18.5 (0.56) 45–64 years . . . . . . . . . . . . . . . . . . . . . . . . . . . . . . . . . . . 100.0 11.4 (0.52) 17.8 (0.61) 31.2 (0.76) 22.9 (0.71) 16.7 (0.62) 65 years and over . . . . . . . . . . . . . . . . . . . . . . . . . . . . . . . 100.0 26.1 (0.98) 15.4 (0.70) 27.0 (0.89) 18.4 (0.74) 13.1 (0.69)
Race7
White, single race . . . . . . . . . . . . . . . . . . . . . . . . . . . . . . . 100.0 10.4 (0.35) 15.4 (0.38) 31.1 (0.47) 24.9 (0.47) 18.1 (0.41) Black or African American, single race. . . . . . . . . . . . . . . . . . . 100.0 19.3 (0.78) 20.4 (1.09) 32.2 (0.95) 18.3 (0.97) 9.8 (0.64) American Indian or Alaska Native, single race . . . . . . . . . . . . . . 100.0 16.2 (4.63) 20.7 (3.60) 27.9 (4.85) 18.2 (4.10) 17.2 (3.78) Asian, single race . . . . . . . . . . . . . . . . . . . . . . . . . . . . . . . 100.0 12.3 (1.73) 20.8 (2.42) 32.2 (2.73) 20.2 (2.76) 14.4 (2.12) Native Hawaiian and Other Pacific Islander, single race . . . . . . . . 100.0 *– *16.5 (10.47) *8.5 (7.93) 43.0 (4.78) *32.0 (12.10) 2 or more races . . . . . . . . . . . . . . . . . . . . . . . . . . . . . . . . 100.0 11.9 (2.81) 12.8 (3.24) 27.5 (3.53) 25.8 (4.49) 22.0 (3.52)
Black or African American; white . . . . . . . . . . . . . . . . . . . . . 100.0 19.9 (2.17) *8.5 (4.64) 39.9 (10.11) *8.4 (6.03) *23.2 (10.01) American Indian and Alaska Native; white . . . . . . . . . . . . . . . 100.0 *15.1 (4.79) *12.9 (4.76) 15.6 (4.50) 31.6 (5.93) 24.8 (6.19)
Hispanic origin and race7
Hispanic or Latino . . . . . . . . . . . . . . . . . . . . . . . . . . . . . . . 100.0 13.5 (0.76) 20.0 (0.98) 34.6 (1.08) 18.7 (0.99) 13.2 (0.72) Mexican or Mexican American . . . . . . . . . . . . . . . . . . . . . . 100.0 12.8 (1.15) 20.1 (1.32) 35.1 (1.37) 19.4 (1.25) 12.6 (0.91)
Not Hispanic or Latino. . . . . . . . . . . . . . . . . . . . . . . . . . . . . 100.0 11.4 (0.33) 16.0 (0.39) 30.9 (0.45) 24.3 (0.44) 17.4 (0.37) White, single race . . . . . . . . . . . . . . . . . . . . . . . . . . . . . . 100.0 10.1 (0.37) 14.9 (0.40) 30.7 (0.51) 25.6 (0.49) 18.7 (0.43) Black or African American, single race . . . . . . . . . . . . . . . . . 100.0 19.5 (0.79) 20.4 (1.10) 32.1 (0.94) 18.2 (0.98) 9.7 (0.64)
Education7
Less than high school graduate . . . . . . . . . . . . . . . . . . . . . . . 100.0 17.8 (0.82) 19.2 (0.84) 35.5 (1.00) 16.2 (0.81) 11.2 (0.66) GED diploma8 . . . . . . . . . . . . . . . . . . . . . . . . . . . . . . . . . 100.0 14.3 (1.96) 17.1 (1.94) 34.4 (2.59) 19.5 (2.14) 14.6 (2.02) High school graduate . . . . . . . . . . . . . . . . . . . . . . . . . . . . . 100.0 11.4 (0.53) 17.6 (0.67) 31.8 (0.77) 23.4 (0.75) 15.8 (0.66) Some college – no degree . . . . . . . . . . . . . . . . . . . . . . . . . . 100.0 10.8 (0.68) 17.3 (0.74) 29.8 (0.90) 23.9 (0.80) 18.1 (0.73) Associate of arts degree . . . . . . . . . . . . . . . . . . . . . . . . . . . 100.0 8.8 (0.78) 15.8 (1.11) 31.0 (1.55) 27.4 (1.36) 17.0 (1.12) Bachelor of arts, science degree . . . . . . . . . . . . . . . . . . . . . . 100.0 7.1 (0.65) 14.2 (0.86) 29.5 (1.11) 28.3 (1.09) 20.9 (0.93) Masters, doctorate, medical degree . . . . . . . . . . . . . . . . . . . . 100.0 9.2 (1.87) 11.1 (1.06) 25.2 (2.28) 27.6 (2.37) 26.8 (2.66)
Poverty status7,9
Below poverty level . . . . . . . . . . . . . . . . . . . . . . . . . . . . . . 100.0 20.6 (1.15) 17.5 (0.99) 32.9 (1.18) 17.0 (0.95) 12.0 (0.89) 1.00–1.99 times poverty level . . . . . . . . . . . . . . . . . . . . . . . . 100.0 14.2 (0.85) 17.2 (0.85) 33.5 (1.06) 20.3 (0.85) 14.8 (0.85) 2.00–3.99 times poverty level . . . . . . . . . . . . . . . . . . . . . . . . 100.0 9.8 (0.59) 16.5 (0.64) 31.3 (0.83) 25.7 (0.82) 16.7 (0.67) 4.00 times poverty level or more . . . . . . . . . . . . . . . . . . . . . . 100.0 7.3 (0.54) 14.9 (0.75) 29.8 (0.94) 27.4 (0.83) 20.6 (0.73)
Marital status7
Never married. . . . . . . . . . . . . . . . . . . . . . . . . . . . . . . . . . 100.0 14.5 (0.99) 18.8 (1.02) 30.7 (1.12) 23.9 (1.05) 12.2 (0.71) Married . . . . . . . . . . . . . . . . . . . . . . . . . . . . . . . . . . . . . . 100.0 9.3 (0.39) 15.5 (0.53) 31.8 (0.61) 24.9 (0.57) 18.5 (0.55) Cohabiting . . . . . . . . . . . . . . . . . . . . . . . . . . . . . . . . . . . . 100.0 11.8 (2.15) 19.0 (2.55) 32.3 (2.78) 20.8 (2.35) 16.2 (2.35) Divorced or separated. . . . . . . . . . . . . . . . . . . . . . . . . . . . . 100.0 12.8 (0.76) 17.7 (1.01) 32.2 (1.25) 21.2 (1.16) 16.1 (1.17) Widowed . . . . . . . . . . . . . . . . . . . . . . . . . . . . . . . . . . . . . 100.0 17.5 (2.44) 18.4 (4.37) 35.5 (4.72) 14.7 (1.92) 13.9 (2.51)
Geographic region7
Northeast . . . . . . . . . . . . . . . . . . . . . . . . . . . . . . . . . . . . 100.0 9.8 (0.54) 15.5 (0.78) 30.6 (0.89) 25.9 (1.06) 18.2 (0.77) Midwest . . . . . . . . . . . . . . . . . . . . . . . . . . . . . . . . . . . . . 100.0 10.1 (0.62) 15.6 (0.63) 31.1 (0.93) 25.2 (0.80) 17.9 (0.74) South . . . . . . . . . . . . . . . . . . . . . . . . . . . . . . . . . . . . . . . 100.0 14.2 (0.60) 17.5 (0.67) 31.9 (0.70) 21.9 (0.67) 14.5 (0.55) West . . . . . . . . . . . . . . . . . . . . . . . . . . . . . . . . . . . . . . . 100.0 10.2 (0.57) 16.7 (0.81) 30.8 (0.82) 23.1 (0.84) 19.2 (0.70)
*Figure does not meet standards of reliability or precision (see Technical Notes). – Quantity zero. 1Never active is inactive during usual daily activities and never and/or unable to engage in leisure-time physical activity. 2Low activity level is moderately active during usual daily activities and never and/or unable to engage in leisure-time physical activity or inactive during usual daily activities and engaged in some leisure-time physical activity but less than regular. 3Medium activity level is very active during usual daily activities and never and/or unable to engage in leisure-time physical activity or moderately active during usual daily activities and engaged in some leisure-time physical activity but less than regular or inactive during usual daily activities and engaged in regular leisure-time physical activity. 4Medium-high activity level is very active during usual daily activities and engaged in some leisure-time physical activity, but less than regular or moderately active during usual daily activities and engaged in regular leisure-time physical activity. 5High activity level is very active during usual daily activities and engaged in regular leisure-time physical activity. 6Persons of other races and unknown race and ethnicity, unknown education, unknown poverty status, and unknown marital status are included in the total but not shown separately. 7Age adjusted to the 2000 U.S. standard population using age groups 18–24 years, 25–44 years, 45–64 years, and 65 years and over. 8GED is General Educational Development high school equivalency diploma. 9Poverty status is based on family income and family size using the U.S. Census Bureau poverty thresholds.
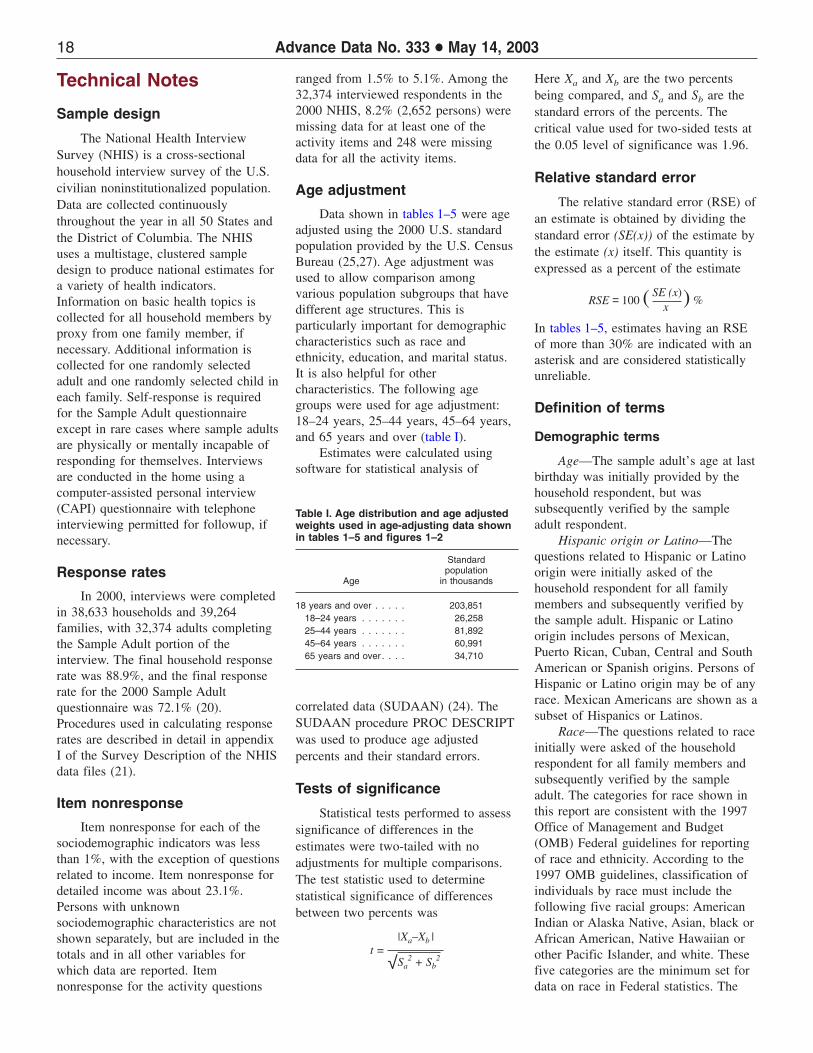
18 Advance Data No. 333 + May 14, 2003
Table I. Age distribution and age adjusted weights used in age-adjusting data shown in tables 1–5 and figures 1–2
Standard population
Age in thousands
18 years and over . . . . . 203,851 18–24 years . . . . . . . 26,258 25–44 years . . . . . . . 81,892 45–64 years . . . . . . . 60,991 65 years and over . . . . 34,710
Technical Notes
Sample design
The National Health Interview Survey (NHIS) is a cross-sectional household interview survey of the U.S. civilian noninstitutionalized population. Data are collected continuously throughout the year in all 50 States and the District of Columbia. The NHIS uses a multistage, clustered sample design to produce national estimates for a variety of health indicators. Information on basic health topics is collected for all household members by proxy from one family member, if necessary. Additional information is collected for one randomly selected adult and one randomly selected child in each family. Self-response is required for the Sample Adult questionnaire except in rare cases where sample adults are physically or mentally incapable of responding for themselves. Interviews are conducted in the home using a computer-assisted personal interview (CAPI) questionnaire with telephone interviewing permitted for followup, if necessary.
Response rates
In 2000, interviews were completed in 38,633 households and 39,264 families, with 32,374 adults completing the Sample Adult portion of the interview. The final household response rate was 88.9%, and the final response rate for the 2000 Sample Adult questionnaire was 72.1% (20). Procedures used in calculating response rates are described in detail in appendix I of the Survey Description of the NHIS data files (21).
Item nonresponse
Item nonresponse for each of the sociodemographic indicators was less than 1%, with the exception of questions related to income. Item nonresponse for detailed income was about 23.1%. Persons with unknown sociodemographic characteristics are not shown separately, but are included in the totals and in all other variables for which data are reported. Item nonresponse for the activity questions
ranged from 1.5% to 5.1%. Among the 32,374 interviewed respondents in the 2000 NHIS, 8.2% (2,652 persons) were missing data for at least one of the activity items and 248 were missing data for all the activity items.
Age adjustment
Data shown in tables 1–5 were age adjusted using the 2000 U.S. standard population provided by the U.S. Census Bureau (25,27). Age adjustment was used to allow comparison among various population subgroups that have different age structures. This is particularly important for demographic characteristics such as race and ethnicity, education, and marital status. It is also helpful for other characteristics. The following age groups were used for age adjustment: 18–24 years, 25–44 years, 45–64 years, and 65 years and over (table I).
Estimates were calculated using software for statistical analysis of
correlated data (SUDAAN) (24). The SUDAAN procedure PROC DESCRIPT was used to produce age adjusted percents and their standard errors.
Tests of significance
Statistical tests performed to assess significance of differences in the estimates were two-tailed with no adjustments for multiple comparisons. The test statistic used to determine statistical significance of differences between two percents was
|Xa –Xb | t =
√Sa2 + Sb
2
Here Xa and Xb are the two percents being compared, and Sa and Sb are the standard errors of the percents. The critical value used for two-sided tests at the 0.05 level of significance was 1.96.
Relative standard error
The relative standard error (RSE) of an estimate is obtained by dividing the standard error (SE(x)) of the estimate by the estimate (x) itself. This quantity is expressed as a percent of the estimate
RSE = 100 ( SE (x)) % x
In tables 1–5, estimates having an RSE of more than 30% are indicated with an asterisk and are considered statistically unreliable.
Definition of terms
Demographic terms
Age—The sample adult’s age at last birthday was initially provided by the household respondent, but was subsequently verified by the sample adult respondent.
Hispanic origin or Latino—The questions related to Hispanic or Latino origin were initially asked of the household respondent for all family members and subsequently verified by the sample adult. Hispanic or Latino origin includes persons of Mexican, Puerto Rican, Cuban, Central and South American or Spanish origins. Persons of Hispanic or Latino origin may be of any race. Mexican Americans are shown as a subset of Hispanics or Latinos.
Race—The questions related to race initially were asked of the household respondent for all family members and subsequently verified by the sample adult. The categories for race shown in this report are consistent with the 1997 Office of Management and Budget (OMB) Federal guidelines for reporting of race and ethnicity. According to the 1997 OMB guidelines, classification of individuals by race must include the following five racial groups: American Indian or Alaska Native, Asian, black or African American, Native Hawaiian or other Pacific Islander, and white. These five categories are the minimum set for data on race in Federal statistics. The

Advance Data No. 333 + May 14, 2003 19
1997 Standards also offer an opportunity for respondents to select more than one of the five groups, leading to multiple race combinations. Multiple race combinations can only be reported to the extent that the estimates meet the requirements for confidentiality and statistical reliability. In this report, three categories are shown for multiple race individuals (a summary category and two multiple race categories). Other combinations are not shown due to statistical unreliability.
The Federal government considers race and Hispanic or Latino origin to be two separate and distinct concepts. Thus, Hispanics or Latinos may be of any race. The variable labeled ‘‘race’’ shown in the tables in this report includes persons of Hispanic or Latino origin, while the variable labeled ‘‘Hispanic or Latino origin and race’’ separates individuals according to whether they reported Hispanic or Latino ethnicity and, for persons who reported they were not Hispanic or Latino, provides further breakdowns by race.
Education—This question was asked of the household respondent, but not verified with the sample adult. The interviewer asks the respondent for the highest level of school attended or highest degree received. Respondents were shown a flash card to choose an appropriate category. Greater detail is available on the data file; categories were combined due to small sample sizes in some groups.
Poverty status—Poverty status is based on family income and family size using the U.S. Census Bureau’s poverty thresholds (28). A person’s poverty status is expressed in terms of a ratio of family income to the poverty threshold. The lowest income group consists of persons living below the poverty level (ratio of less than 1.00). The highest income group consists of persons whose family income was at least four times the poverty level (ratio of 4.00 or more).
Marital status—Respondents were asked to choose a marital status category. Adults could select the one category they felt most appropriate for their marital situation.
Geographic region—To classify the U.S. population by geographic area, the
States are grouped into four regions. These regions, which correspond to those used by the U.S. Census Bureau, are as follows:
Region States included
Northeast Maine, Vermont, New Hampshire, Massachusetts, Connecticut, Rhode Island, New York, New Jersey, and Pennsylvania
Midwest Ohio, Illinois, Indiana, Michigan, Wisconsin, Minnesota, Iowa, Missouri, North Dakota, South Dakota, Kansas, and Nebraska
South Delaware, Maryland, District of Columbia, West Virginia, Virginia, Kentucky, Tennessee, North Carolina, South Carolina, Georgia, Florida, Alabama, Mississippi, Louisiana, Oklahoma, Arkansas, and Texas
West Washington, Oregon, California, Nevada, New Mexico, Arizona, Idaho, Utah, Colorado, Montana, Wyoming, Alaska, and Hawaii
Leisure-time physical activity terms
All questions related to leisure time physical activity were phrased in terms of current behavior, and they lack a specific reference period. An introductory phrase explained to respondents that they were being asked about leisure-time physical activities only. In this report, persons who volunteered a response indicating that they were ‘‘unable to do the activity’’ were combined with those saying they ‘‘never’’ engaged in the activity.
Regular leisure-time physical activity is engaging in light or moderate activity that caused light sweating or a slight to moderate increase in breathing or heart rate and occurs five or more times per week for at least 30 minutes each time and/or vigorous activity that caused heavy sweating or large increases in breathing or heart rate and occurs three or more times per week for
at least 20 minutes each time. It does not include other combinations of activity levels (e.g., vigorous activity twice a week combined with light or moderate activity three times a week). The number of individuals with such combinations of activity is small.
Usual daily activity terms
All questions related to usual daily activity were phrased in terms of current behavior, and they lack a specific reference period. Respondents were instructed to not include activities done in their leisure time when choosing the best description of their usual daily activities related to moving around and lifting or carrying things. In this report, persons who volunteered a response indicating that they were ‘‘unable to do the activity’’ were combined with those saying they ‘‘never’’ engaged in the activity.
Combined leisure-time physical activity and usual daily activity terms
Never physically active—Inactive during usual daily activities and never and/or unable to engage in leisure-time physical activity.
Low physical activity level— Moderately active during usual daily activities and never and/or unable to engage in leisure-time physical activity or inactive during usual daily activities and engaged in some leisure-time physical activity, but less than regular.
Medium physical activity level— Very active during usual daily activities and never and/or unable to engage in leisure-time physical activity or moderately active during usual daily activities and engaged in some leisure-time physical activity, but less than regular or inactive during usual daily activities and engaged in regular leisure-time physical activity.
Medium-high physical activity level—Very active during usual daily activities and engaged in some leisure-time physical activity, but less than regular or moderately active during usual daily activities and engaged in regular leisure-time physical activity.
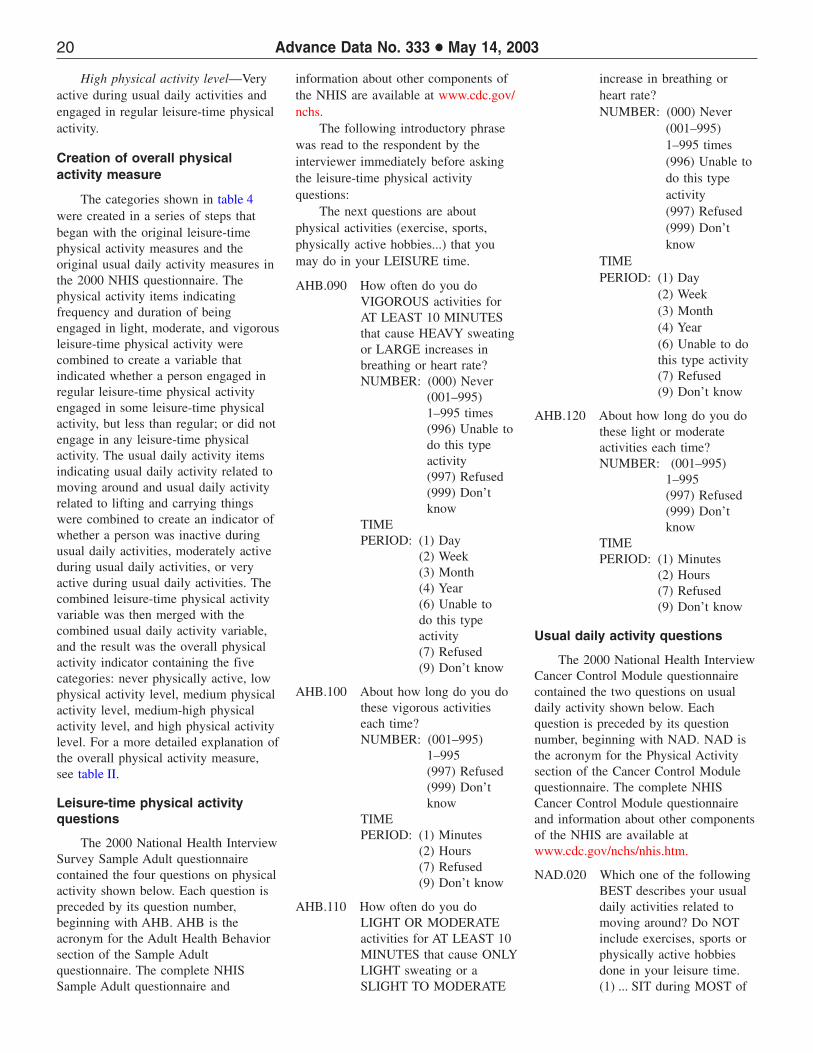
20 Advance Data No. 333 + May 14, 2003
High physical activity level—Very active during usual daily activities and engaged in regular leisure-time physical activity.
Creation of overall physical activity measure
The categories shown in table 4 were created in a series of steps that began with the original leisure-time physical activity measures and the original usual daily activity measures in the 2000 NHIS questionnaire. The physical activity items indicating frequency and duration of being engaged in light, moderate, and vigorous leisure-time physical activity were combined to create a variable that indicated whether a person engaged in regular leisure-time physical activity engaged in some leisure-time physical activity, but less than regular; or did not engage in any leisure-time physical activity. The usual daily activity items indicating usual daily activity related to moving around and usual daily activity related to lifting and carrying things were combined to create an indicator of whether a person was inactive during usual daily activities, moderately active during usual daily activities, or very active during usual daily activities. The combined leisure-time physical activity variable was then merged with the combined usual daily activity variable, and the result was the overall physical activity indicator containing the five categories: never physically active, low physical activity level, medium physical activity level, medium-high physical activity level, and high physical activity level. For a more detailed explanation of the overall physical activity measure, see table II.
Leisure-time physical activity questions
The 2000 National Health Interview Survey Sample Adult questionnaire contained the four questions on physical activity shown below. Each question is preceded by its question number, beginning with AHB. AHB is the acronym for the Adult Health Behavior section of the Sample Adult questionnaire. The complete NHIS Sample Adult questionnaire and
information about other components of the NHIS are available at www.cdc.gov/ nchs.
The following introductory phrase was read to the respondent by the interviewer immediately before asking the leisure-time physical activity questions:
The next questions are about physical activities (exercise, sports, physically active hobbies...) that you may do in your LEISURE time.
AHB.090 How often do you do VIGOROUS activities for AT LEAST 10 MINUTES that cause HEAVY sweating or LARGE increases in breathing or heart rate? NUMBER: (000) Never
(001–995) 1–995 times (996) Unable to do this type activity (997) Refused (999) Don’t know
TIME PERIOD: (1) Day
(2) Week (3) Month (4) Year (6) Unable to do this type activity (7) Refused (9) Don’t know
AHB.100 About how long do you do these vigorous activities each time? NUMBER: (001–995)
1–995 (997) Refused (999) Don’t know
TIME PERIOD: (1) Minutes
(2) Hours (7) Refused (9) Don’t know
AHB.110 How often do you do LIGHT OR MODERATE activities for AT LEAST 10 MINUTES that cause ONLY LIGHT sweating or a SLIGHT TO MODERATE
increase in breathing or heart rate? NUMBER: (000) Never
(001–995) 1–995 times (996) Unable to do this type activity (997) Refused (999) Don’t know
TIME PERIOD: (1) Day
(2) Week (3) Month (4) Year (6) Unable to do this type activity (7) Refused (9) Don’t know
AHB.120 About how long do you do these light or moderate activities each time? NUMBER: (001–995)
1–995 (997) Refused (999) Don’t know
TIME PERIOD: (1) Minutes
(2) Hours (7) Refused (9) Don’t know
Usual daily activity questions
The 2000 National Health Interview Cancer Control Module questionnaire contained the two questions on usual daily activity shown below. Each question is preceded by its question number, beginning with NAD. NAD is the acronym for the Physical Activity section of the Cancer Control Module questionnaire. The complete NHIS Cancer Control Module questionnaire and information about other components of the NHIS are available at www.cdc.gov/nchs/nhis.htm.
NAD.020 Which one of the following BEST describes your usual daily activities related to moving around? Do NOT include exercises, sports or physically active hobbies done in your leisure time. (1) ... SIT during MOST of
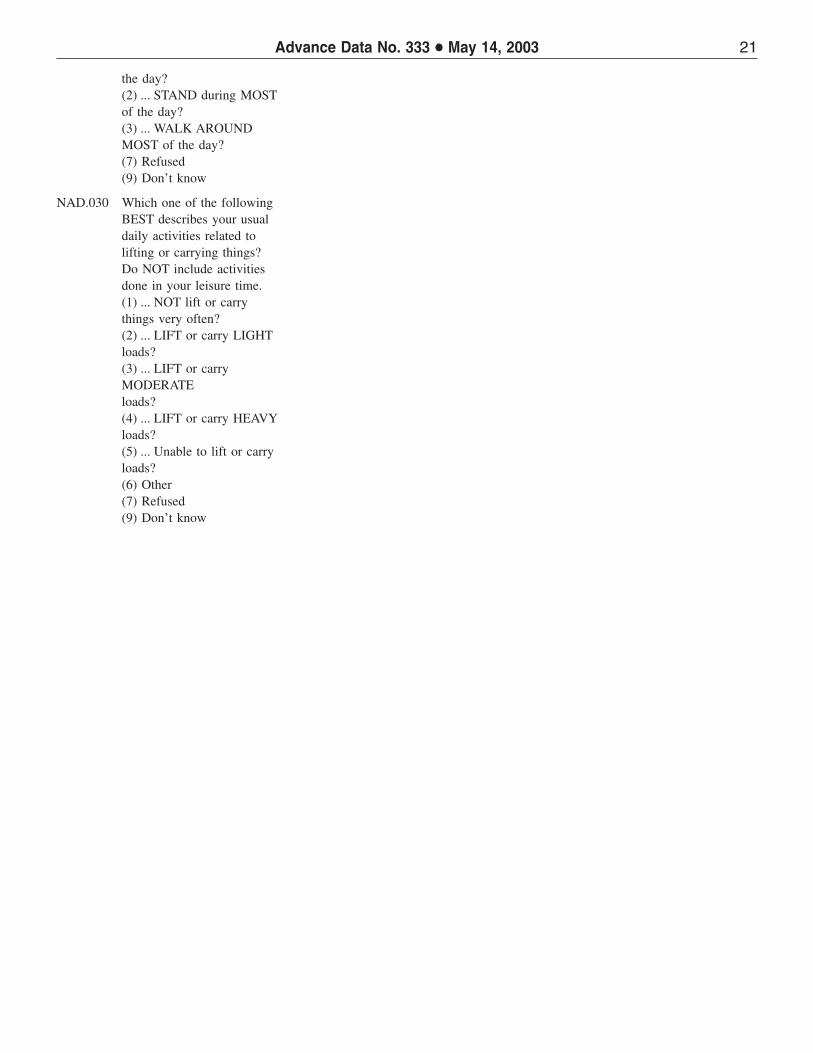
Advance Data No. 333 + May 14, 2003 21
the day?(2) ... STAND during MOSTof the day?(3) ... WALK AROUNDMOST of the day?(7) Refused(9) Don’t know
NAD.030 Which one of the following BEST describes your usual daily activities related to lifting or carrying things? Do NOT include activities done in your leisure time. (1) ... NOT lift or carry things very often? (2) ... LIFT or carry LIGHT loads? (3) ... LIFT or carry MODERATE loads? (4) ... LIFT or carry HEAVY loads? (5) ... Unable to lift or carry loads? (6) Other (7) Refused (9) Don’t know
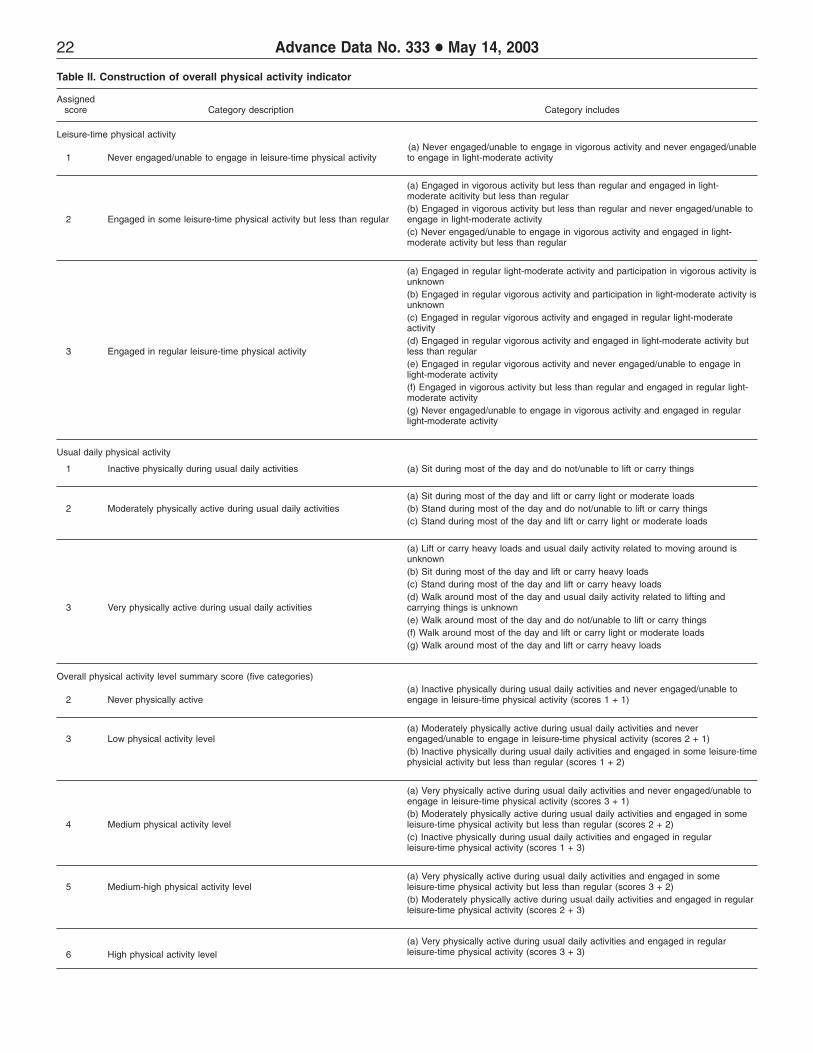
22 Advance Data No. 333 + May 14, 2003
Table II. Construction of overall physical activity indicator
Assigned score Category description Category includes
Leisure-time physical activity (a) Never engaged/unable to engage in vigorous activity and never engaged/unable
1 Never engaged/unable to engage in leisure-time physical activity to engage in light-moderate activity
(a) Engaged in vigorous activity but less than regular and engaged in light-moderate acitivity but less than regular
2 Engaged in some leisure-time physical activity but less than regular (b) Engaged in vigorous activity but less than regular and never engaged/unable to engage in light-moderate activity (c) Never engaged/unable to engage in vigorous activity and engaged in light-moderate activity but less than regular
(a) Engaged in regular light-moderate activity and participation in vigorous activity is unknown (b) Engaged in regular vigorous activity and participation in light-moderate activity is unknown (c) Engaged in regular vigorous activity and engaged in regular light-moderate activity
Engaged in regular leisure-time physical activity (d) Engaged in regular vigorous activity and engaged in light-moderate activity but less than regular (e) Engaged in regular vigorous activity and never engaged/unable to engage in light-moderate activity (f) Engaged in vigorous activity but less than regular and engaged in regular light-moderate activity (g) Never engaged/unable to engage in vigorous activity and engaged in regular light-moderate activity
Usual daily physical activity
Inactive physically during usual daily activities (a) Sit during most of the day and do not/unable to lift or carry things
(a) Sit during most of the day and lift or carry light or moderate loads Moderately physically active during usual daily activities (b) Stand during most of the day and do not/unable to lift or carry things
(c) Stand during most of the day and lift or carry light or moderate loads
(a) Lift or carry heavy loads and usual daily activity related to moving around is unknown (b) Sit during most of the day and lift or carry heavy loads (c) Stand during most of the day and lift or carry heavy loads
Very physically active during usual daily activities (d) Walk around most of the day and usual daily activity related to lifting and carrying things is unknown (e) Walk around most of the day and do not/unable to lift or carry things (f) Walk around most of the day and lift or carry light or moderate loads (g) Walk around most of the day and lift or carry heavy loads
Overall physical activity level summary score (five categories) (a) Inactive physically during usual daily activities and never engaged/unable to
Never physically active engage in leisure-time physical activity (scores 1 + 1)
(a) Moderately physically active during usual daily activities and never Low physical activity level engaged/unable to engage in leisure-time physical activity (scores 2 + 1)
(b) Inactive physically during usual daily activities and engaged in some leisure-time physicial activity but less than regular (scores 1 + 2)
(a) Very physically active during usual daily activities and never engaged/unable to engage in leisure-time physical activity (scores 3 + 1)
4 Medium physical activity level (b) Moderately physically active during usual daily activities and engaged in some leisure-time physical activity but less than regular (scores 2 + 2) (c) Inactive physically during usual daily activities and engaged in regular leisure-time physical activity (scores 1 + 3)
(a) Very physically active during usual daily activities and engaged in some 5 Medium-high physical activity level leisure-time physical activity but less than regular (scores 3 + 2)
(b) Moderately physically active during usual daily activities and engaged in regular leisure-time physical activity (scores 2 + 3)
(a) Very physically active during usual daily activities and engaged in regular 6 High physical activity level leisure-time physical activity (scores 3 + 3)
3
1
2
3
2
3
24 Advance Data No. 333 + May 14, 2003
Suggested citation Copyright information National Center for Health Statistics
Barnes PM, Schoenborn CA. Physical activity All material appearing in this report is in the Director among adults: United States, 2000. Advance public domain and may be reproduced or Edward J. Sondik, Ph.D. data from vital and health statistics; no. 333. Hyattsville, Maryland: National Center for Health Statistics. 2003.
copied without permission; citation as to source, however, is appreciated. Deputy Director
Jack R. Anderson
U.S. DEPARTMENT OFHEALTH & HUMAN SERVICES
Centers for Disease Control and PreventionNational Center for Health Statistics3311 Toledo RoadHyattsville, Maryland 20782
OFFICIAL BUSINESSPENALTY FOR PRIVATE USE, $300
To receive this publication regularly, contactthe National Center for Health Statistics bycalling 301-458-4636E-mail: [email protected]: www.cdc.gov/nchs
DHHS Publication No. (PHS) 2003-125003-0234 (4/03)
FIRST CLASS POSTAGE & FEES PAID
CDC/NCHS PERMIT NO. G-284