A N N UA L R E P O RT 2 0 1 5
S E T TO L E A D A N D G R OW
Annual R
eport 2015Perpetual Lim
ited
Perpetual is an independent and diversified financial services company with a rich history dating back to 1886. Perpetual protects, manages and grows clients’ wealth through a relentless focus on consistent delivery over time.
FOCUS AND DELIVERY
SHAREHOLDER CALENDAR
Final dividend payment25 September 2015
Annual general meeting5 November 2015
Interim profit and dividend announcement 25 February 2016
Final profit and dividend announcement25 August 2016
Please note these dates are subject to change.
Perpetual LimitedABN 86 000 431 827
CONTENTS
2 About Us
4 Chairman’s Report
6 2015 Highlights
8 CEO’s Report
12 2015 Group Results
14 Business Unit Overview
20 Directors’ Report
26 Corporate Responsibility Statement
28 Remuneration Report
57 Operating and Financial Review
85 Financial Report
139 Securities Exchange and Investor Information

WWW. P E R P E T UA L .CO M . AU
2
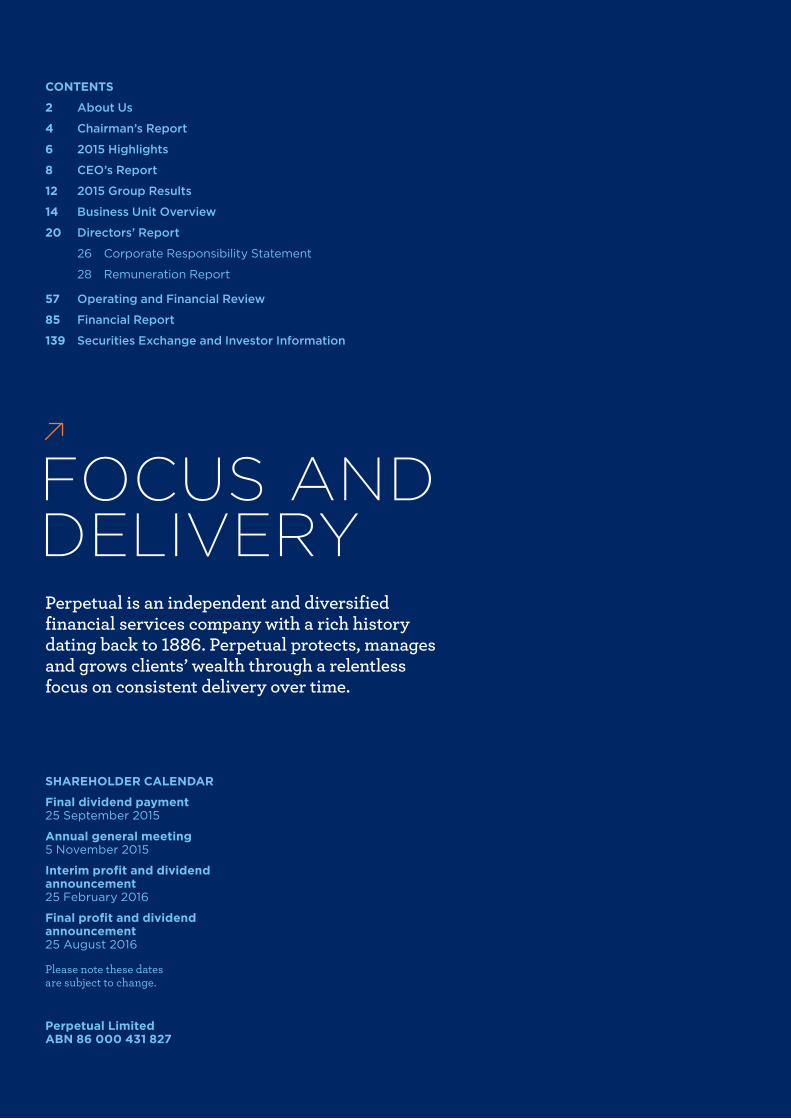
RECOGNISED AND AWARDED FOR PROTECTING AND GROWING WEALTH
Perpetual has been awarded Fund Manager of the Year awards across multiple categories every year for the past decade and has been rated #1 by Euromoney for its range of advisory services for high net worth clients.
ABOUT US
* As at 30 June 2015.
A widely-recognised and respected financial services organisation, Perpetual is one of Australia’s largest independent wealth managers, an expert adviser to high net worth individuals, families and businesses, and a leading provider of corporate trustee services.
Perpetual is proud to have $30.2 billion in funds under management, $13.1 billion in funds under advice and $566.1 billion in funds under administration* on behalf of our clients.
PERPETUAL ANNUAL REPORT 2015 3
Perpetual Investments is one of Australia’s most highly regarded and awarded investment managers, providing a broad range of investment strategies and products to institutions, advisers and individuals. Perpetual manages money across a range of asset classes including Australian and global equities, multi-sector strategies, and credit and fixed income.
Perpetual’s disciplined investment process has been tested and proven for nearly 50 years.
Perpetual actively manages investments based on fundamental research and analysis of quality, value and risk. Perpetual’s aim is to choose the best quality investments at prices that represent good value, based on their assessed risk and expected return.
To further strengthen its investment process, Perpetual constantly invests in the quality and depth of its investment team. Today, Perpetual has one of the most experienced and highly regarded investment teams in Australia.
Consistent delivery of investment outperformance has seen Perpetual Investments receive significant recognition in annual industry awards programs.
The team is proud to manage $30.2 billion in funds under management (as at 30 June 2015).
Perpetual Private provides tailored, holistic financial advice and solutions for individuals and families with high net worth, as well as community-based organisations. Fordham, which is part of Perpetual Private, exclusively advises private business owners and their families to manage their businesses and build and protect their wealth.
Perpetual Private’s hallmark is the breadth of services available to clients as it seeks to meet their often-complex needs at various life stages, and often across generations. Perpetual Private’s advisers provide strategic advice on superannuation and retirement planning, general investment, asset protection, insurance, tax management, estate planning, aged care, social security, succession planning and philanthropy.
As one of Australia’s largest managers of philanthropic funds, Perpetual Private advises 1,100 charitable trusts and endowment funds, which support medical, social, environmental, religious, cultural and educational causes. Perpetual Private is proud to be Australia’s largest independent distributor of funds to Australia’s not-for-profit sector.
Perpetual Private has also become a key partner in the prudent and effective management of Native Title trusts, a new and growing part of its business.
One of Perpetual Private’s strengths is its expertise in protecting and growing wealth over the very long term. Perpetual Private has been awarded the highest rank by Euromoney for a range of advisory services, and has $13.1 billion in funds under advice (as at 30 June 2015).
Perpetual Corporate Trust is the leading provider of corporate trustee services to the funds management sector and debt capital markets in Australia. In debt capital markets, its clients include banks, large financial institutions, non-bank lenders and loan originators.
Having been involved in the Australian securitisation industry since its inception in the 1980s, Perpetual Corporate Trust plays a leading role in growing the industry and managing regulatory and technological change. For example, Perpetual Corporate Trust’s enhanced data service, ABSPerpetual, provides an important link between issuers, the Reserve Bank of Australia (RBA) and the investment community.
The acquisition of The Trust Company in late 2013 has cemented Perpetual Corporate Trust’s position as the leading provider of fiduciary solutions to the funds management sector, and it services a broad range of clients across multiple asset classes including property, infrastructure, equities, fixed income and alternatives.
Having expanded its service offering and geographic footprint, Perpetual is now the only trustee with licences to provide corporate trustee services in Australia and Singapore.
Perpetual Corporate Trust’s extensive knowledge of financial markets, its trustee heritage and the expertise and experience of its team allow it to be the trusted partner of some of the world’s largest financial institutions. Perpetual Corporate Trust has $566.1 billion in funds under administration (as at 30 June 2015).
High net worth advisory and trustee services
PERPETUAL PRIVATE
PERPETUAL CORPORATE TRUST
Corporate fiduciary services
Award‑winning asset management
PERPETUAL INVESTMENTS
4
CHAIRMAN’S REPORT
A LOOK BEHIND THE NUMBERS“Higher people engagement means we can attract, keep and develop the best people.
That in turn means we can gain, keep and grow more clients.
It’s a compelling, virtuous circle.”
PERPETUAL ANNUAL REPORT 2015 5
Dear ShareholderThe profit and revenue numbers tell their own story about the performance of Perpetual over the past financial year. Our advice business grew its profit before tax by more than 70%. Our overall net profit after tax was up 50%. Across our three business divisions, there are numbers any business would be proud of.
In this report you can see more detailed financials. What I would like to focus on is what’s behind those numbers.
WE DID WHAT WE SAID WE WOULD DOThis year marked the end of our Transformation 2015 (T15) strategy. T15 included a whole range of initiatives – cost management, a focused business model, outsourcing non-core functions to external experts, a new and better-segmented approach to clients and markets. What’s most pleasing is that every step of the way the team delivered on what was promised to shareholders, the market and clients.
MEETING OUR PROMISE TO SHAREHOLDERSThe prudent balance sheet decisions we made during T15 also meant we were able to live up to our implied promise to shareholders. In the past year, to take just one example, we freed up significant regulatory capital – capital we were able to put to better use for our shareholders. We have a strong balance sheet that gives us scope to invest in growing our business. But it also provides additional protection for shareholders in a world full of uncertainty.
Careful capital management – and the underlying strength of our businesses – also means we are better able to provide shareholders with a growing income stream. Since FY12 our dividend has grown by nearly 40% a year (in cents per share). We know what a consistent dividend means to shareholders, and we always aim to deliver a solid dividend so long as we can achieve it in a prudent and conservative way.
BEING TRUE TO OURSELVESThe company’s new Lead & Grow strategy which Geoff Lloyd outlines in this report is a true growth strategy. But we start on that growth path with our core values very clear in our mind. Recent moves in our new listed investment company are an example of that.
The launch of the Perpetual Equity Investment Company was an important step, highlighting our ability to offer self-directed clients the Perpetual product they were looking for. We raised over $250 million in the biggest listing of its type since the Global Financial Crisis. Yet it’s the way we invested that capital that’s important. Despite some market pressure to put capital to work straight away, the Portfolio Manager, Vince Pezzullo, kept a relatively large cash balance, and was able to buy his preferred assets at better value during the recent bout of market volatility.
That’s the discipline that has made our team a leader in Australian equities over the long term. It’s the prudent Perpetual approach we will be taking as we expand global equities and other offerings as part of Lead & Grow.
GROWING WITH OUR CLIENTS We are building Lead & Grow to address what we think are the vital needs of our clients. Our global equities initiative is all about expanding the investment horizons of Australian investors. Australia is around 2% of the global economy, our market is fast becoming too small for the size of our national superannuation savings, and I believe our people and our skills make us a logical alternative for Australian investors seeking global diversification.
It’s a similar story in the data services division of Perpetual Corporate Trust. This year we were able to meet a challenge the RBA posed to our clients by developing a powerful data solution that both meets client needs and strengthens the long-term prospects of our business.
INVESTING IN OUR PEOPLEIn his letter, Geoff highlights our excellent staff engagement levels. We focused on that outcome across our business, investing in development, training, technology, productivity, leadership – all the things we can manage to enhance the performance and career satisfaction of our people.
Higher people engagement means we can attract, keep and develop the best people. That in turn means we can gain, keep and grow more clients. It’s a compelling, virtuous circle.
STAYING SHARPThe Perpetual Board and management team are all focusing on our Lead & Grow strategy. But we’re also thinking about the attitudes and mindsets needed to ensure we are where our clients need us to be – not just now – but in the future. That means continuous improvement and being ready to test new offerings in the marketplace.
It also means fighting for our place. We have an enviable reputation in one of the world’s biggest financial services markets. But it’s a market where competition is getting stronger every day.
We’re all part of a business that’s thrived for 129 years. It’s important we continue to grow our skills and our people so that we can hand this business onto the next generation even stronger than it is today.
BOARD SUCCESSIONThis year marks the retirement of Elizabeth Proust and Paul Brasher from the Board of Directors at Perpetual. They made outstanding contributions to the Board during a time of transformative change for the company – and I thank them very much.
I’m also delighted to welcome Ian Hammond and Nancy Fox to the Board. Their deep sector knowledge and leadership experience will be of great value as we implement our Lead & Grow strategy.
PETER SCOTTChairman
6
2015 HIGHLIGHTS
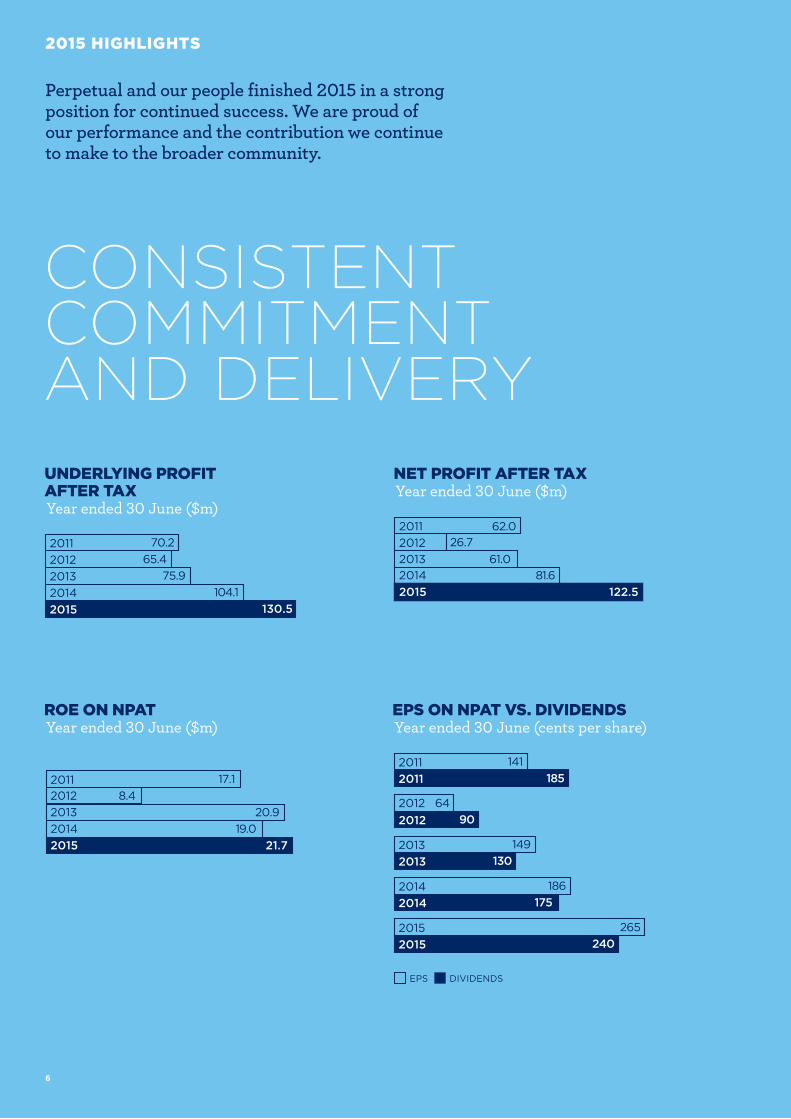
CONSISTENT COMMITMENT AND DELIVERY
Perpetual and our people finished 2015 in a strong position for continued success. We are proud of our performance and the contribution we continue to make to the broader community.
2011 62.026.72012
61.0201381.62014
2011 70.265.4
75.9104.1
130.5
2012201320142015
0.00 21.75 43.50 65.25 87.00 108.75 130.50
122.52015
0.00000020.41662140.83324261.24986481.666485102.083106122.499727
21.719.0
20.9
2011 17.18.42012
201320142015
0.0000003.6166677.23333410.85000014.46666718.08333421.700001
2011 141185
64
2011
2012902012
0.00000044.16670588.333411132.500116176.666821220.833526
underlying net pro�t earningsROE
14920131302013
18620141752014
26520152402015
ROE ON NPATYear ended 30 June ($m)
EPS DIVIDENDS
2011 62.026.72012
61.0201381.62014
2011 70.265.4
75.9104.1
130.5
2012201320142015
0.00 21.75 43.50 65.25 87.00 108.75 130.50
122.52015
0.00000020.41662140.83324261.24986481.666485102.083106122.499727
21.719.0
20.9
2011 17.18.42012
201320142015
0.0000003.6166677.23333410.85000014.46666718.08333421.700001
2011 141185
64
2011
2012902012
0.00000044.16670588.333411132.500116176.666821220.833526
underlying net pro�t earningsROE
14920131302013
18620141752014
26520152402015
EPS ON NPAT VS. DIVIDENDSYear ended 30 June (cents per share)
2011 62.026.72012
61.0201381.62014
2011 70.265.4
75.9104.1
130.5
2012201320142015
0.00 21.75 43.50 65.25 87.00 108.75 130.50
122.52015
0.00000020.41662140.83324261.24986481.666485102.083106122.499727
21.719.0
20.9
2011 17.18.42012
201320142015
0.0000003.6166677.23333410.85000014.46666718.08333421.700001
2011 141185
64
2011
2012902012
0.00000044.16670588.333411132.500116176.666821220.833526
underlying net pro�t earningsROE
14920131302013
18620141752014
26520152402015
NET PROFIT AFTER TAXYear ended 30 June ($m)
2011 62.026.72012
61.0201381.62014
2011 70.265.4
75.9104.1
130.5
2012201320142015
0.00 21.75 43.50 65.25 87.00 108.75 130.50
122.52015
0.00000020.41662140.83324261.24986481.666485102.083106122.499727
21.719.0
20.9
2011 17.18.42012
201320142015
0.0000003.6166677.23333410.85000014.46666718.08333421.700001
2011 141185
64
2011
2012902012
0.00000044.16670588.333411132.500116176.666821220.833526
underlying net pro�t earningsROE
14920131302013
18620141752014
26520152402015
UNDERLYING PROFIT AFTER TAXYear ended 30 June ($m)
PERPETUAL ANNUAL REPORT 2015 7
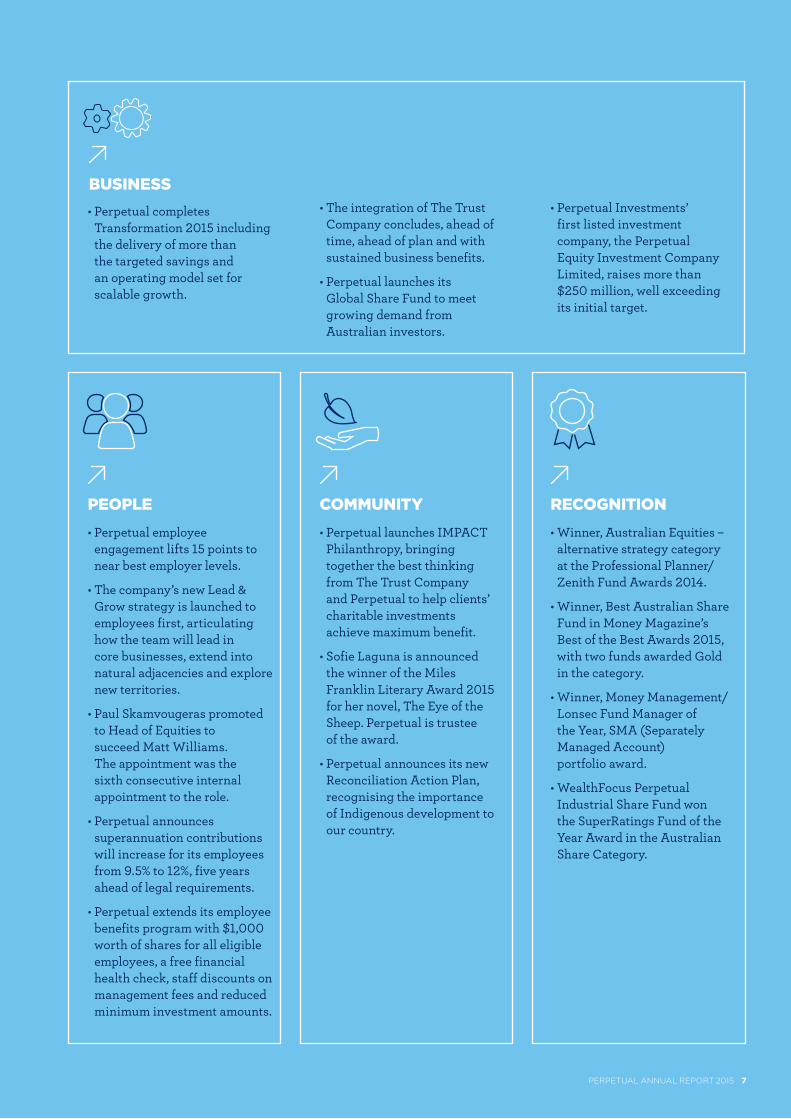
• Perpetual launches IMPACT Philanthropy, bringing together the best thinking from The Trust Company and Perpetual to help clients’ charitable investments achieve maximum benefit.
• Sofie Laguna is announced the winner of the Miles Franklin Literary Award 2015 for her novel, The Eye of the Sheep. Perpetual is trustee of the award.
• Perpetual announces its new Reconciliation Action Plan, recognising the importance of Indigenous development to our country.
COMMUNITY
• Perpetual completes Transformation 2015 including the delivery of more than the targeted savings and an operating model set for scalable growth.
BUSINESS
• Perpetual employee engagement lifts 15 points to near best employer levels.
• The company’s new Lead & Grow strategy is launched to employees first, articulating how the team will lead in core businesses, extend into natural adjacencies and explore new territories.
• Paul Skamvougeras promoted to Head of Equities to succeed Matt Williams. The appointment was the sixth consecutive internal appointment to the role.
• Perpetual announces superannuation contributions will increase for its employees from 9.5% to 12%, five years ahead of legal requirements.
• Perpetual extends its employee benefits program with $1,000 worth of shares for all eligible employees, a free financial health check, staff discounts on management fees and reduced minimum investment amounts.
PEOPLE• Winner, Australian Equities –
alternative strategy category at the Professional Planner/Zenith Fund Awards 2014.
• Winner, Best Australian Share Fund in Money Magazine’s Best of the Best Awards 2015, with two funds awarded Gold in the category.
• Winner, Money Management/ Lonsec Fund Manager of the Year, SMA (Separately Managed Account) portfolio award.
• WealthFocus Perpetual Industrial Share Fund won the SuperRatings Fund of the Year Award in the Australian Share Category.
RECOGNITION
• Perpetual Investments’ first listed investment company, the Perpetual Equity Investment Company Limited, raises more than $250 million, well exceeding its initial target.
• The integration of The Trust Company concludes, ahead of time, ahead of plan and with sustained business benefits.
• Perpetual launches its Global Share Fund to meet growing demand from Australian investors.
8
CEO’S REPORT
A MILESTONE YEAR FOR PERPETUAL
“We made significant, business‑changing moves that slimmed and focused Perpetual and created a business that delivers more for its clients and shareholders.”
PERPETUAL ANNUAL REPORT 2015 9
Dear ShareholderThe year just completed marks a milestone for Perpetual. It is the bridge between T15, a three-year program to resize, reshape and reinvigorate the business, and Lead & Grow – our new strategy that builds on our strengths to further grow the business for the benefit of our shareholders, clients and people.
This transition is symbolised by conversations I had recently with clients who came to Perpetual via our acquisition of The Trust Company (TrustCo).
They told me how happy they were to work with many of the same people they knew at TrustCo – but that the service they received had improved as a result of the greater size and capability of the merged businesses. Our ability to retain TrustCo staff – and to exceed the expectations of TrustCo clients – is one of the things I’m most proud of when I look back at the final stage of T15.
Those conversations illuminate the bigger picture of the past three years. We made significant, business-changing moves that slimmed and focused Perpetual and created a business that delivers more for its clients and shareholders.
Delivering more for our clients is what our new Lead & Grow strategy is all about. It is a growth strategy based around a simple but powerful strategic approach:
l lead in our core business l extend into logical adjacencies l explore new territories which allow us
to leverage our market insight, core capabilities, clients and cost base.
We will dedicate some 70% of our time and effort to leading in our core markets and segments, given the compelling opportunities we have already identified.
In many ways, Lead & Grow is a natural evolution of T15 in that our future strategic direction is consistent with, but not constrained by, the decisions of the past. In fact, we draw upon the critical strategic choices that underpinned T15: three core businesses united under a common purpose and a modern and scalable business model with shared goals, centralised support services and a trusted brand.
I believe the company’s move from T15 to Lead & Grow is already evident in this year’s results. Not just in the numbers we delivered, but in some of the major strategic initiatives that were developed by each division and will now form a key part of the Lead & Grow strategy.
PERPETUAL INVESTMENTSIn FY15, Perpetual Investments’ profit before tax was $125.6 million, 11% higher than in FY14. That profit was only marginally boosted by equity markets, which were up by on average just over 5%. The improvement was driven by the performance – and therefore performance fees – achieved by our fund managers and from increases in funds under management.
Leading, now growing – through global equitiesWith a leading capability in Australian equities, our move into global equities is a natural extension of our recognised investment philosophy, process and people into a growing asset class with attractive margins. We have a strong track record, $700 million under management now and a target of $1 billion by the third anniversary of the new Perpetual Global Share Fund.
We’re growing our global equity business by building on our strengths. We have brought the team strength up to seven analysts but crucially, all global analysts sit within our larger equity team of 21, sharing insights and ideas. Our ambition over time is to be as large and recognised in global equities as we are today in Australian equities.
PERPETUAL PRIVATE In Perpetual Private, our high net worth advice business, profit before tax was up over 70%. As evidence that our targeted segment approach is working, last year the business had 75 net new clients and now has more than $13 billion under advice.
Leading, now growing – through even deeper client focus In Perpetual Private we specialise – focusing on select groups of clients and providing exemplary, specialist service. We’re further deepening our commitment to segments like business owners, the established wealthy and professionals, and further deepening our relationships with existing clients to whom we can offer a wider suite of products and services.
“Lead & Grow – our new strategy that builds on our strengths to further grow the business for the benefit of our shareholders, clients and people.”
10
Our capability in strategic advice, tax and accounting, trustee services, estate planning and philanthropy means that our focus on these segments will grow our business and at the same time deliver considerable financial and personal value to our clients.
PERPETUAL CORPORATE TRUST Perpetual Corporate Trust is an Australian leader in securitisation and real asset markets, and has a growing franchise in Fund Services. In FY15, growth in Trust Services was driven by an improvement in securitisation markets, with funds under administration up 24%. Fund Services is growing on the back of inbound capital flows into Australian property and infrastructure and, pleasingly, last year our revenue grew by over 60%.
Leading, now growing – through data services Perpetual Corporate Trust has been the leading provider of asset backed securities information since 1997. As part of Lead & Grow, we are leveraging this position to meet market needs. For instance, the RBA’s new repo-eligibility reporting requirements were a significant challenge for the local securitisation market; but that challenge is also being viewed as an extension opportunity for Corporate Trust.
ABSPerpetual is providing data for some 90% of issuers in the market and more than $350 billion in financial assets are being reported on. Over the longer term, ABSPerpetual gives us the ability to extend into new products such as analytics and reporting, into new business models like subscription and fee-for-service, and potentially into partnership with new clients in markets beyond securitisation.
OUR PEOPLE DRIVE OUR GROWTHThere’s no doubt the last three years have been a time of significant and lasting change for Perpetual. Yet we never lost focus on our people.
The success we’ve had is the result of the dedication, passion and skill of our team, our focus on getting the right people into the right roles, and investing in our team and our leaders. The result of that work – and it is hard, vital work – is a team that’s constantly thinking about their clients and their needs.
That’s why, even as we face a period of time where market returns may come down and volatility rise, we can look forward with confidence. I believe we have the people and the disciplines to run the business prudently for our shareholders under any market conditions.
That’s also why, in a year when we have many positive numbers to reflect on, a major rise in our staff engagement – to near best-in-market levels – gave me so much pleasure; because a deeply motivated, highly-skilled team with real client focus is what drives results for our business and returns for our shareholders.
GEOFF LLOYD Chief Executive Officer and Managing Director
“There’s no doubt the last three years have been a time of significant and lasting change for Perpetual. Yet we never lost focus on our people. The success we’ve had is the result of the dedication, passion and skill of our team.”
11% PERPETUAL INVESTMENTS’ PROFIT BEFORE TAX WAS 11% HIGHER THAN IN FY14
$4.5m IN PERPETUAL PRIVATE, THE AVERAGE NEW CLIENT BALANCE ROSE TO $4.5 MILLION IN FY15
24%FUA IN THE TRUST SERVICES AREA OF PERPETUAL CORPORATE TRUST GREW 24% IN FY15
CEO’S REPORT

PERPETUAL ANNUAL REPORT 2015 11
THE PERPETUAL EXECUTIVE LEADERSHIP TEAMFrom left to right: Geoff Lloyd, Chris Green, Rebecca Nash,
Mark Smith, Gillian Larkins and Michael Gordon
2015 GROUP RESULTS
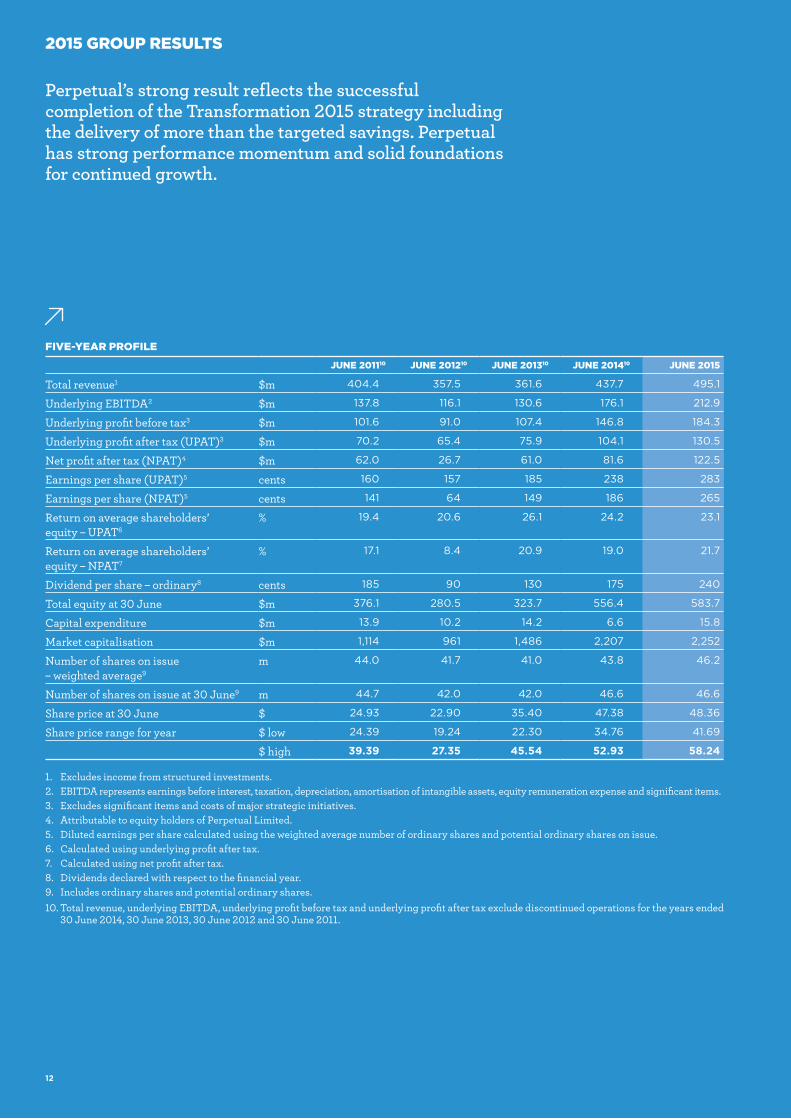
FIVE-YEAR PROFILE
JUNE 201110 JUNE 201210 JUNE 201310 JUNE 201410 JUNE 2015
Total revenue1 $m 404.4 357.5 361.6 437.7 495.1
Underlying EBITDA2 $m 137.8 116.1 130.6 176.1 212.9
Underlying profit before tax3 $m 101.6 91.0 107.4 146.8 184.3
Underlying profit after tax (UPAT)3 $m 70.2 65.4 75.9 104.1 130.5
Net profit after tax (NPAT)4 $m 62.0 26.7 61.0 81.6 122.5
Earnings per share (UPAT)5 cents 160 157 185 238 283
Earnings per share (NPAT)5 cents 141 64 149 186 265
Return on average shareholders’ equity – UPAT6
% 19.4 20.6 26.1 24.2 23.1
Return on average shareholders’ equity – NPAT7
% 17.1 8.4 20.9 19.0 21.7
Dividend per share – ordinary8 cents 185 90 130 175 240
Total equity at 30 June $m 376.1 280.5 323.7 556.4 583.7
Capital expenditure $m 13.9 10.2 14.2 6.6 15.8
Market capitalisation $m 1,114 961 1,486 2,207 2,252
Number of shares on issue – weighted average9
m 44.0 41.7 41.0 43.8 46.2
Number of shares on issue at 30 June9 m 44.7 42.0 42.0 46.6 46.6
Share price at 30 June $ 24.93 22.90 35.40 47.38 48.36
Share price range for year $ low 24.39 19.24 22.30 34.76 41.69
$ high 39.39 27.35 45.54 52.93 58.24
1. Excludes income from structured investments.2. EBITDA represents earnings before interest, taxation, depreciation, amortisation of intangible assets, equity remuneration expense and significant items.3. Excludes significant items and costs of major strategic initiatives.4. Attributable to equity holders of Perpetual Limited.5. Diluted earnings per share calculated using the weighted average number of ordinary shares and potential ordinary shares on issue.6. Calculated using underlying profit after tax.7. Calculated using net profit after tax.8. Dividends declared with respect to the financial year.9. Includes ordinary shares and potential ordinary shares. 10. Total revenue, underlying EBITDA, underlying profit before tax and underlying profit after tax exclude discontinued operations for the years ended
30 June 2014, 30 June 2013, 30 June 2012 and 30 June 2011.
Perpetual’s strong result reflects the successful completion of the Transformation 2015 strategy including the delivery of more than the targeted savings. Perpetual has strong performance momentum and solid foundations for continued growth.
12
PERPETUAL ANNUAL REPORT 2015 13
FINANCIAL RESULTSPerpetual’s underlying profit after tax for the year ended 30 June 2015 was $130.5 million, an increase of 25% on FY14. Statutory net profit after tax was $122.5 million, an increase of 50%.
Perpetual generated $497.1 million of total operating revenue, which was $56.5 million or 13% higher than in FY14.
The result reflects the disciplined completion of the T15 strategy, higher average levels of equity markets, and net new clients.
All three business divisions contributed to the positive results.
FINAL DIVIDENDThe Board determined a FY15 fully franked final dividend of 125 cents per share, bringing total fully franked dividends for the 12 months to 240 cents per share. This is up 37% on the past year. The final dividend is payable on 25 September.
COMPLETION OF TRANSFORMATION 2015The end of FY15 marked the successful completion of Perpetual’s T15 strategy – ahead of time and with savings above those targeted. This includes the successful integration of The Trust Company, which will deliver annualised synergy benefits of $21 million per annum before tax by FY16. This is at the top end of the forecast range.
Following the simplification and refocusing of the business, Perpetual is on a sound footing and is well placed to identify and respond to further growth opportunities.
LEAD, EXTEND, EXPLOREPerpetual’s Lead & Grow strategy builds on the foundation of T15. The critical strategic choices that underpinned T15 – three core businesses forming a scalable business model, sharing central services and a strong brand – form the basis of future growth.
The Lead & Grow strategy has three key objectives to capture sustainable growth: to lead in each of the Group’s core businesses, to extend into adjacent opportunities and explore new markets and ventures over the long term.
MARKET ENVIRONMENTThe main drivers of total revenue are the value of funds under management (FUM) in Perpetual Investments and funds under advice (FUA) in Perpetual Private, which are primarily influenced by the level of the Australian equity market.
The S&P/ASX All Ordinaries Price Index (All Ords) closed at 5,451 on 30 June 2015, up 1.3% on the closing level on 30 June 2014. The average All Ords in FY15 was up 5.3% on FY14. At 30 June 2015, Perpetual Investments’ FUM and Perpetual Private’s FUA were around 80% and 58% exposed to equity markets respectively.
Perpetual Corporate Trust’s funds under administration are primarily influenced by issuance activity in the residential mortgage-backed securities market, which improved over the course of the year.
$130.5mUNDERLYING PROFIT AFTER TAX UP 25%
$21mTHE TRUST COMPANY INTEGRATION COMPLETE. ANNUALISED SYNERGY BENEFITS OF $21 MILLION BEFORE TAX BY FY16 – AT THE TOP END OF THE FORECAST RANGE
37%TOTAL DIVIDENDS 240 CENTS PER SHARE, UP 37%
14
BUSINESS UNIT OVERVIEW
PERPETUAL INVESTMENTS
PERPETUAL ANNUAL REPORT 2015 15
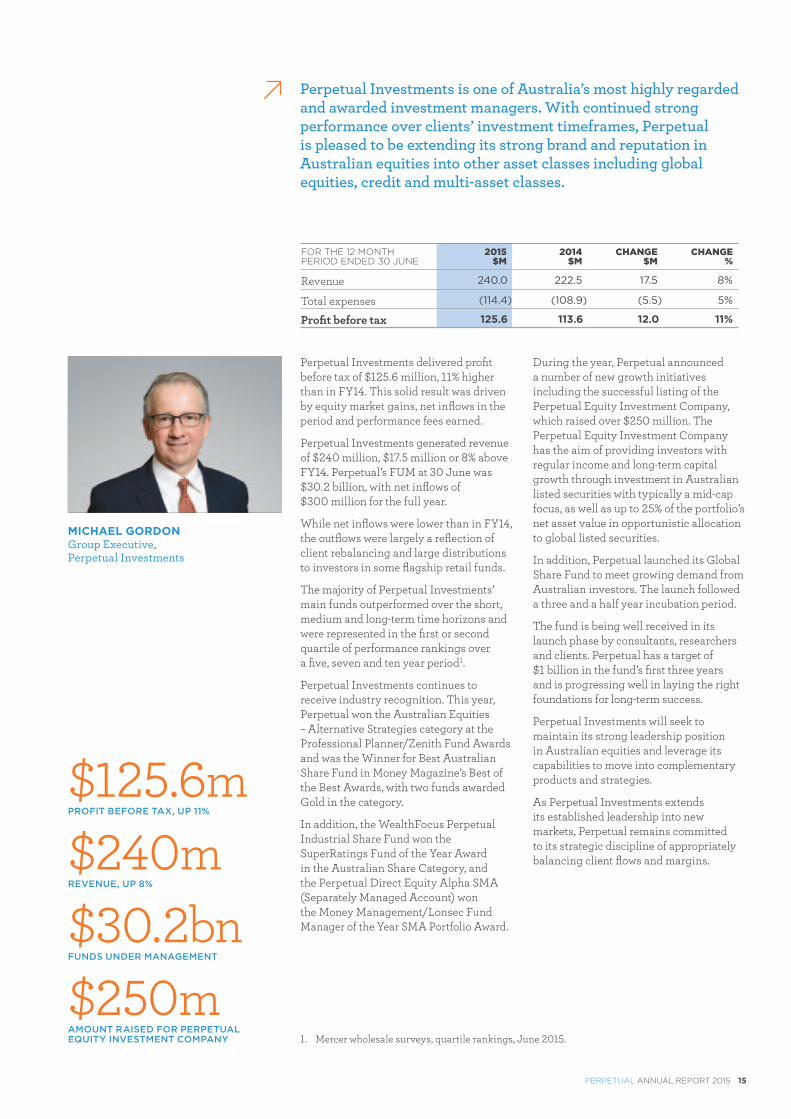
Perpetual Investments delivered profit before tax of $125.6 million, 11% higher than in FY14. This solid result was driven by equity market gains, net inflows in the period and performance fees earned.
Perpetual Investments generated revenue of $240 million, $17.5 million or 8% above FY14. Perpetual’s FUM at 30 June was $30.2 billion, with net inflows of $300 million for the full year.
While net inflows were lower than in FY14, the outflows were largely a reflection of client rebalancing and large distributions to investors in some flagship retail funds.
The majority of Perpetual Investments’ main funds outperformed over the short, medium and long-term time horizons and were represented in the first or second quartile of performance rankings over a five, seven and ten year period1.
Perpetual Investments continues to receive industry recognition. This year, Perpetual won the Australian Equities – Alternative Strategies category at the Professional Planner/Zenith Fund Awards and was the Winner for Best Australian Share Fund in Money Magazine’s Best of the Best Awards, with two funds awarded Gold in the category.
In addition, the WealthFocus Perpetual Industrial Share Fund won the SuperRatings Fund of the Year Award in the Australian Share Category, and the Perpetual Direct Equity Alpha SMA (Separately Managed Account) won the Money Management/Lonsec Fund Manager of the Year SMA Portfolio Award.
During the year, Perpetual announced a number of new growth initiatives including the successful listing of the Perpetual Equity Investment Company, which raised over $250 million. The Perpetual Equity Investment Company has the aim of providing investors with regular income and long-term capital growth through investment in Australian listed securities with typically a mid-cap focus, as well as up to 25% of the portfolio’s net asset value in opportunistic allocation to global listed securities.
In addition, Perpetual launched its Global Share Fund to meet growing demand from Australian investors. The launch followed a three and a half year incubation period.
The fund is being well received in its launch phase by consultants, researchers and clients. Perpetual has a target of $1 billion in the fund’s first three years and is progressing well in laying the right foundations for long-term success.
Perpetual Investments will seek to maintain its strong leadership position in Australian equities and leverage its capabilities to move into complementary products and strategies.
As Perpetual Investments extends its established leadership into new markets, Perpetual remains committed to its strategic discipline of appropriately balancing client flows and margins.
$125.6mPROFIT BEFORE TAX, UP 11%
$240mREVENUE, UP 8%
$30.2bnFUNDS UNDER MANAGEMENT
$250mAMOUNT RAISED FOR PERPETUAL EQUITY INVESTMENT COMPANY
FOR THE 12 MONTH 2015 2014 CHANGE CHANGEPERIOD ENDED 30 JUNE $M $M $M %
Revenue 240.0 222.5 17.5 8%
Total expenses (114.4) (108.9) (5.5) 5%
Profit before tax 125.6 113.6 12.0 11%
MICHAEL GORDON Group Executive, Perpetual Investments
Perpetual Investments is one of Australia’s most highly regarded and awarded investment managers. With continued strong performance over clients’ investment timeframes, Perpetual is pleased to be extending its strong brand and reputation in Australian equities into other asset classes including global equities, credit and multi‑asset classes.
1. Mercer wholesale surveys, quartile rankings, June 2015.
16
PERPETUAL PRIVATE
BUSINESS UNIT OVERVIEW
PERPETUAL ANNUAL REPORT 2015 17
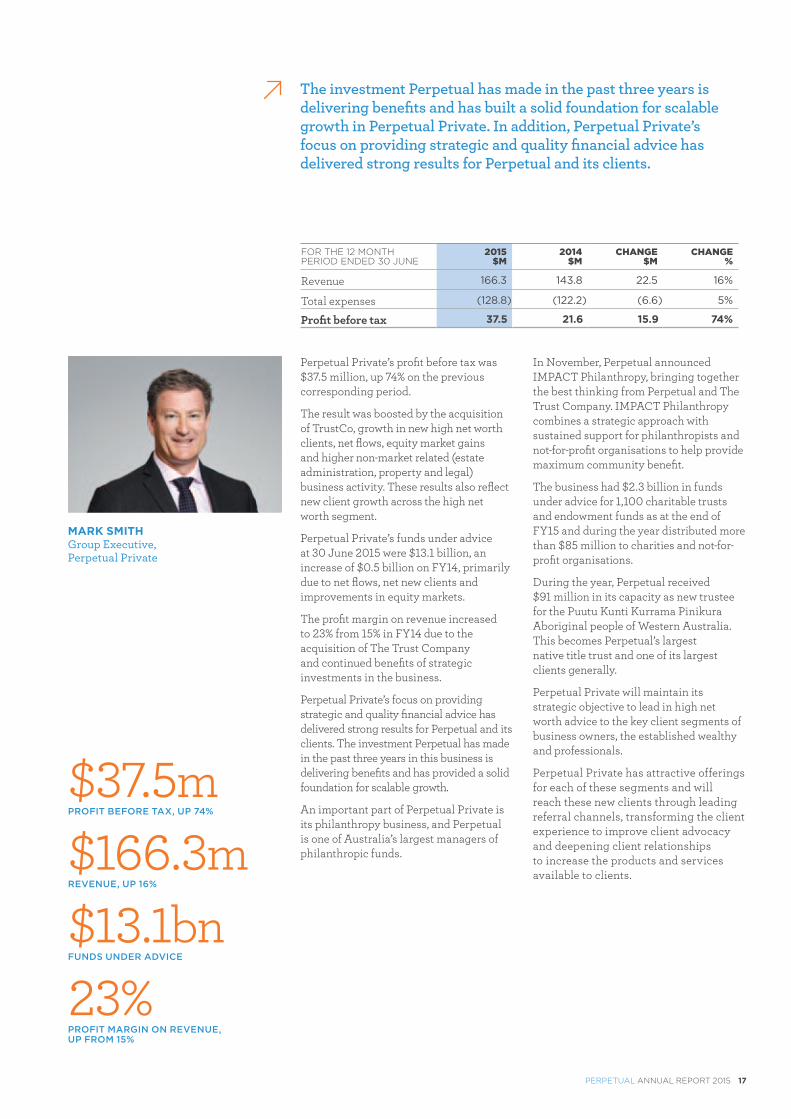
Perpetual Private’s profit before tax was $37.5 million, up 74% on the previous corresponding period.
The result was boosted by the acquisition of TrustCo, growth in new high net worth clients, net flows, equity market gains and higher non-market related (estate administration, property and legal) business activity. These results also reflect new client growth across the high net worth segment.
Perpetual Private’s funds under advice at 30 June 2015 were $13.1 billion, an increase of $0.5 billion on FY14, primarily due to net flows, net new clients and improvements in equity markets.
The profit margin on revenue increased to 23% from 15% in FY14 due to the acquisition of The Trust Company and continued benefits of strategic investments in the business.
Perpetual Private’s focus on providing strategic and quality financial advice has delivered strong results for Perpetual and its clients. The investment Perpetual has made in the past three years in this business is delivering benefits and has provided a solid foundation for scalable growth.
An important part of Perpetual Private is its philanthropy business, and Perpetual is one of Australia’s largest managers of philanthropic funds.
In November, Perpetual announced IMPACT Philanthropy, bringing together the best thinking from Perpetual and The Trust Company. IMPACT Philanthropy combines a strategic approach with sustained support for philanthropists and not-for-profit organisations to help provide maximum community benefit.
The business had $2.3 billion in funds under advice for 1,100 charitable trusts and endowment funds as at the end of FY15 and during the year distributed more than $85 million to charities and not-for-profit organisations.
During the year, Perpetual received $91 million in its capacity as new trustee for the Puutu Kunti Kurrama Pinikura Aboriginal people of Western Australia. This becomes Perpetual’s largest native title trust and one of its largest clients generally.
Perpetual Private will maintain its strategic objective to lead in high net worth advice to the key client segments of business owners, the established wealthy and professionals.
Perpetual Private has attractive offerings for each of these segments and will reach these new clients through leading referral channels, transforming the client experience to improve client advocacy and deepening client relationships to increase the products and services available to clients.
$37.5m PROFIT BEFORE TAX, UP 74%
$166.3mREVENUE, UP 16%
$13.1bnFUNDS UNDER ADVICE
23%PROFIT MARGIN ON REVENUE, UP FROM 15%
FOR THE 12 MONTH 2015 2014 CHANGE CHANGEPERIOD ENDED 30 JUNE $M $M $M %
Revenue 166.3 143.8 22.5 16%
Total expenses (128.8) (122.2) (6.6) 5%
Profit before tax 37.5 21.6 15.9 74%
MARK SMITH Group Executive, Perpetual Private
The investment Perpetual has made in the past three years is delivering benefits and has built a solid foundation for scalable growth in Perpetual Private. In addition, Perpetual Private’s focus on providing strategic and quality financial advice has delivered strong results for Perpetual and its clients.
18
PERPETUAL CORPORATE TRUST
BUSINESS UNIT OVERVIEW
PERPETUAL ANNUAL REPORT 2015 19
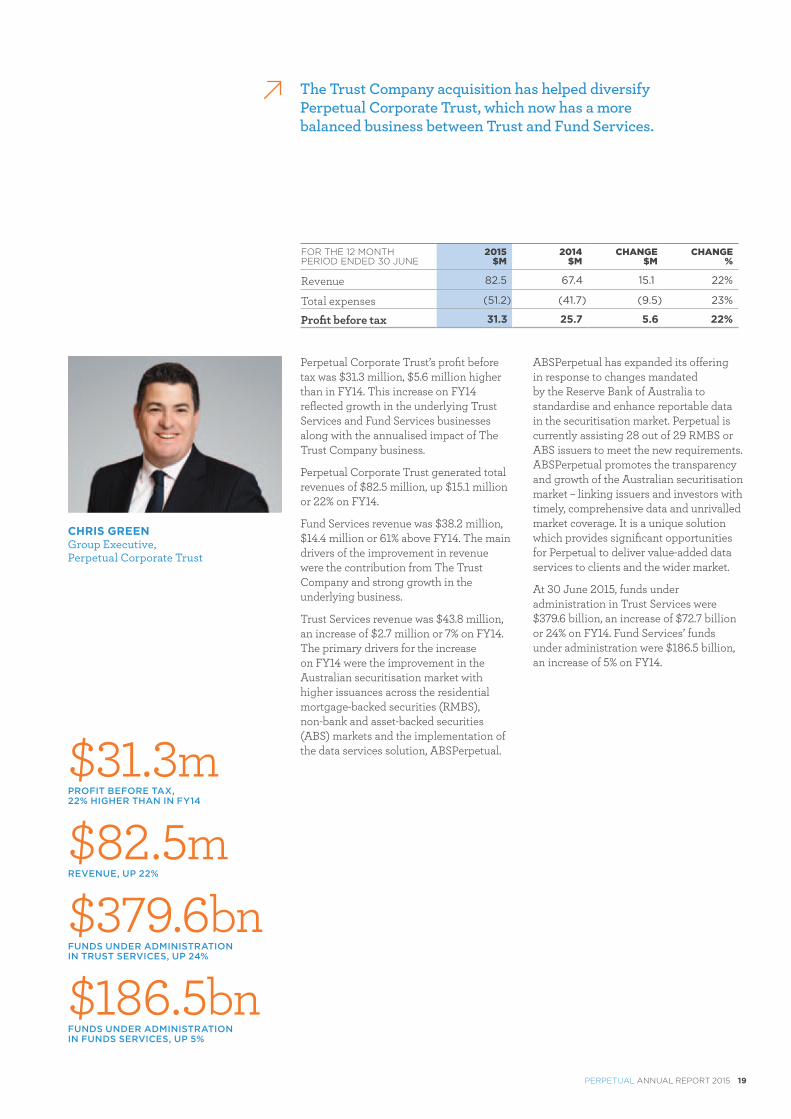
Perpetual Corporate Trust’s profit before tax was $31.3 million, $5.6 million higher than in FY14. This increase on FY14 reflected growth in the underlying Trust Services and Fund Services businesses along with the annualised impact of The Trust Company business.
Perpetual Corporate Trust generated total revenues of $82.5 million, up $15.1 million or 22% on FY14.
Fund Services revenue was $38.2 million, $14.4 million or 61% above FY14. The main drivers of the improvement in revenue were the contribution from The Trust Company and strong growth in the underlying business.
Trust Services revenue was $43.8 million, an increase of $2.7 million or 7% on FY14. The primary drivers for the increase on FY14 were the improvement in the Australian securitisation market with higher issuances across the residential mortgage-backed securities (RMBS), non-bank and asset-backed securities (ABS) markets and the implementation of the data services solution, ABSPerpetual.
ABSPerpetual has expanded its offering in response to changes mandated by the Reserve Bank of Australia to standardise and enhance reportable data in the securitisation market. Perpetual is currently assisting 28 out of 29 RMBS or ABS issuers to meet the new requirements. ABSPerpetual promotes the transparency and growth of the Australian securitisation market – linking issuers and investors with timely, comprehensive data and unrivalled market coverage. It is a unique solution which provides significant opportunities for Perpetual to deliver value-added data services to clients and the wider market.
At 30 June 2015, funds under administration in Trust Services were $379.6 billion, an increase of $72.7 billion or 24% on FY14. Fund Services’ funds under administration were $186.5 billion, an increase of 5% on FY14.
$31.3mPROFIT BEFORE TAX, 22% HIGHER THAN IN FY14
$82.5mREVENUE, UP 22%
$379.6bnFUNDS UNDER ADMINISTRATION IN TRUST SERVICES, UP 24%
$186.5bnFUNDS UNDER ADMINISTRATION IN FUNDS SERVICES, UP 5%
FOR THE 12 MONTH 2015 2014 CHANGE CHANGEPERIOD ENDED 30 JUNE $M $M $M %
Revenue 82.5 67.4 15.1 22%
Total expenses (51.2) (41.7) (9.5) 23%
Profit before tax 31.3 25.7 5.6 22%
CHRIS GREEN Group Executive, Perpetual Corporate Trust
The Trust Company acquisition has helped diversify Perpetual Corporate Trust, which now has a more balanced business between Trust and Fund Services.
20
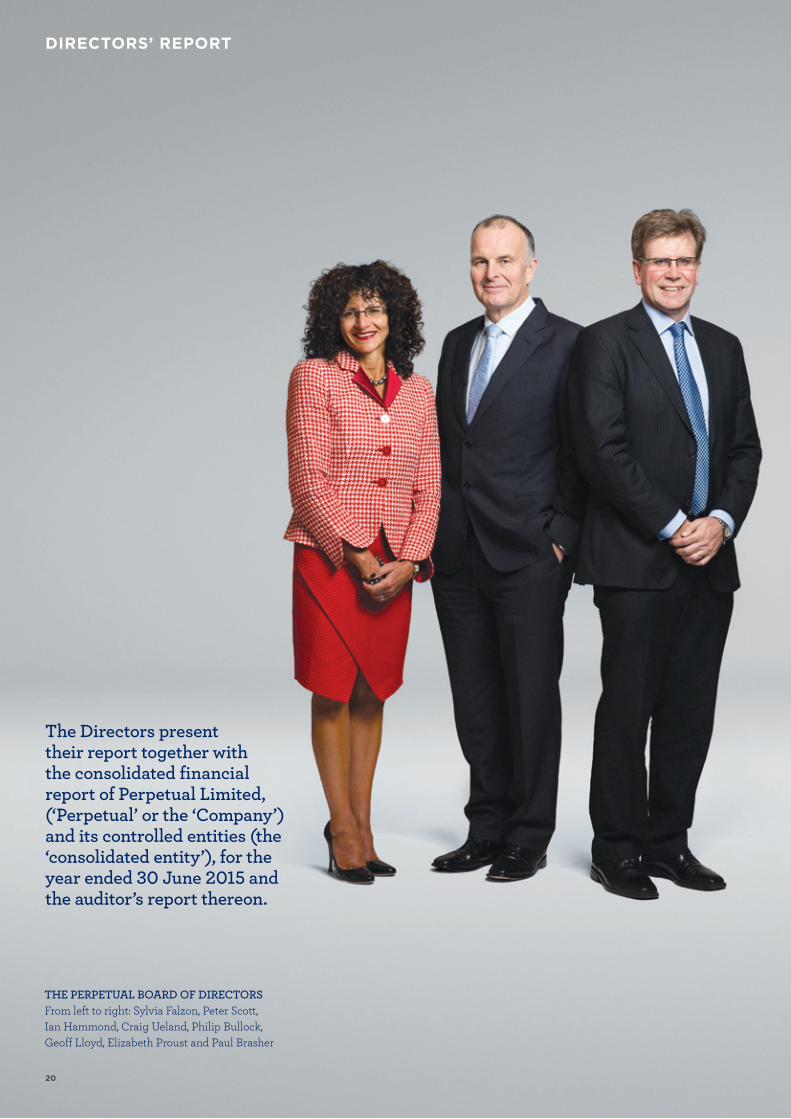
The Directors present their report together with the consolidated financial report of Perpetual Limited, (‘Perpetual’ or the ‘Company’) and its controlled entities (the ‘consolidated entity’), for the year ended 30 June 2015 and the auditor’s report thereon.
THE PERPETUAL BOARD OF DIRECTORSFrom left to right: Sylvia Falzon, Peter Scott, Ian Hammond, Craig Ueland, Philip Bullock, Geoff Lloyd, Elizabeth Proust and Paul Brasher
DIRECTORS’ REPORT

PERPETUAL ANNUAL REPORT 2015 21
DIRECTORS’ REPORT
22
Peter ScottCHAIRMAN AND INDEPENDENT DIRECTOR
BE (Hons), MEngSc (Age 61)
Appointed Director in July 2005 and Chairman on 26 October 2010. Mr Scott was formerly the Chief Executive Officer of MLC and an Executive General Manager of National Australia Bank, and held a number of senior positions with Lend Lease. He is Chairman of Perpetual Equity Investment Company Limited, a Non-executive Director of Stockland Corporation Limited and an advisory board member of Igniting Change. He is Chairman of Perpetual’s Nominations Committee.
Mr Scott has more than 20 years of senior business experience in publicly listed companies and extensive knowledge of the wealth management industry.
Listed company directorships held during the past three financial years: � Stockland Corporation Limited
(from August 2005 to the present) � Perpetual Equity Investment
Company Limited (from August 2014 to present)
Paul V BrasherINDEPENDENT DIRECTOR
BEc (Hons), FCA (Age 65)
Appointed Director in November 2009. Mr Brasher was formerly Chairman of the Global Board of PricewaterhouseCoopers International. He previously chaired the Board of PricewaterhouseCoopers’ Australian firm and held a number of other senior management and client service roles during his career with that firm. Mr Brasher was Client Service Partner and/or Lead Engagement Partner for some of the firm’s most significant clients. He also spent significant periods working with PricewaterhouseCoopers in the US and the UK. Mr Brasher is currently Chairman of Incitec Pivot Limited, Non-executive Director of Amcor Limited and Deputy Chairman of Essendon Football Club. He is Chairman of Perpetual’s Audit, Risk and Compliance Committee and a member of the Nominations Committee and the People and Remuneration Committee.
Mr Brasher brings to the Board his local and global experience as a senior executive and director, particularly in the areas of strategy, finance, audit and risk management and public company governance.
Listed company directorships held during the past three financial years: � Incitec Pivot Limited (from
September 2010 to the present) � Amcor Limited (from January 2014
to the present)
Philip BullockINDEPENDENT DIRECTOR
BA, MBA, GAICD, Dip Ed (Age 62)
Appointed Director in June 2010. Mr Bullock was formerly Vice President, Systems and Technology Group, IBM Asia Pacific, Shanghai, China. Prior to that he was Chief Executive Officer and Managing Director of IBM Australia and New Zealand. His career with IBM spanned almost 30 years in the Asia Pacific region. Mr Bullock is a Non-executive Director of CSG Limited, Hills Limited and formerly of Healthscope Limited. He also provided advice to the Federal Government, through a number of organisations, most notably as Chair of Skills Australia. He is a member of Perpetual’s Investment Committee and People and Remuneration Committee.
Mr Bullock brings to the Board extensive management experience in Australia and Asia in technology, client relationships, marketing, talent development and government.
Listed company directorships held during the past three financial years: � CSG Limited (from August 2009
to the present) � Hills Limited (from June 2014
to the present)
The Directors of the Company at any time during or since the end of the financial year are:
PERPETUAL ANNUAL REPORT 2015 23
Sylvia FalzonINDEPENDENT DIRECTOR
MIR (Hons), BBus, GAICD, SF Fin (Age 50)
Appointed Director in November 2012. Ms Falzon has worked in the financial services industry for over 27 years and during that time has held senior executive positions responsible for institutional and retail funds management businesses, both domestically and internationally. Her roles have included Head of Business Development at Aviva Investors Australia, an equity partner at Alpha Investment Management and Chief Manager International Sales and Service at National Mutual Funds Management/AXA. Ms Falzon is currently a Non-executive Director of SAI Global Limited, Regis Healthcare Limited, Cabrini Health Ltd and the Museums Board of Victoria. She is a member of Perpetual’s Audit, Risk and Compliance Committee and Investment Committee.
Ms Falzon brings to the Board her extensive knowledge and insight in the development of asset management businesses with a particular focus on marketing, sales/distribution, client service and operations including risk and compliance.
Listed company directorships held during the past three financial years: � SAI Global Limited (from October
2013 to present) � Regis Healthcare Limited (from
September 2014 to present)
Ian HammondINDEPENDENT DIRECTOR
BA (Hons), FCA, FCPA, GAICD (Age 57)
Appointed Director in March 2015. Mr Hammond was a partner at PricewaterhouseCoopers for 26 years and during that time, held a range of senior management positions including lead partner for several major financial institutions. He has previously been a member of the Australian Accounting Standards Board and represented Australia on the International Accounting Standards Board. Mr Hammond is a board member of a number of not-for-profit organisations including the Chris O’Brien Lifehouse. He is a member of Perpetual’s Audit, Risk and Compliance Committee.
Mr Hammond has deep knowledge of the financial services industry and brings to the Board expertise in financial reporting and risk management.
Elizabeth M Proust AOINDEPENDENT DIRECTOR
BA (Hons), LLB, FAICD (Age 64)
Appointed Director in January 2006. Ms Proust was formerly Managing Director of Esanda, part of the ANZ Group. Prior to joining ANZ, she was Secretary (CEO) of the Victorian Department of Premier and Cabinet and Chief Executive Officer of the City of Melbourne. She is currently Chairman of Nestlé Australia Ltd and the Bank of Melbourne board; a Non-executive Director of the Australian Institute of Company Directors and a Trustee of the Prince’s Charities Australia. She is Chairman of Perpetual’s People and Remuneration Committee and a member of Perpetual’s Audit, Risk and Compliance Committee and Nominations Committee.
In addition to her skills from her leadership roles in significant change management programs, Ms Proust brings to the Board her strengths in human resources, public affairs and strategy development, and her strong knowledge of board processes and governance through her many senior executive and board roles.
Listed company directorships held during the past three financial years:� Spotless Group Limited (from June
2008 to 16 August 2012)
24
DIRECTORS’ REPORT
P Craig UelandINDEPENDENT DIRECTOR
BA (Hons and Distinction), MBA (Hons), CFA (Age 57)
Appointed Director in September 2012. Mr Ueland was formerly President and Chief Executive Officer of Russell Investments, a global leader in multi-manager investing. He previously served as Russell’s Chief Operating Officer, Chief Financial Officer, and Managing Director of International Operations, which he led from both London and the firm’s headquarters in the US. Earlier in his career, he opened and headed Russell’s first office in Australia. Mr Ueland chairs the Endowment Investment Advisory Committee for The Benevolent Society, is a member of the board of the Stanford Australia Foundation and the Supervisory Board of OneVentures Innovation and Growth Fund II. He is Chairman of Perpetual’s Investment Committee and a member of Perpetual’s Audit, Risk and Compliance Committee and Nominations Committee.
Mr Ueland brings to the Board detailed knowledge of global financial markets and the investment management industry, gleaned from more than 20 years as a senior executive of a major investment firm, along with a strong commitment to leadership development and corporate strategy development and execution.
Geoff LloydCHIEF EXECUTIVE OFFICER AND MANAGING DIRECTOR
Barrister at Law, LLM (Distinction) (UTS), Adv Mgt Program (Harvard) (Age 47)
Appointed CEO and Managing Director in February 2012. Mr Lloyd was previously Group Executive of Private Wealth at Perpetual. In 2012, Mr Lloyd and his senior leadership team rolled out Perpetual’s Transformation 2015 strategy, designed to simplify, refocus and grow Perpetual. Growth initiatives put in place as part of this strategy include the successful acquisition of The Trust Company in December 2013 and the launch of a new Global Equity capability in September 2014.
Before commencing at Perpetual, Mr Lloyd held a number of senior roles at BT Financial Group and St.George’s Wealth Management business including General Manager, Advice and Private Banking and Group Executive Wealth Management.
He is joint Deputy Chair of the Financial Services Council, an Advisory Board member of The Big Issue, and the Patron of the Financial Industry Community Aid Program. He is a patron of the Emerge Foundation and also sits on the University of Technology, Sydney Law Advisory Board.
Mr Lloyd has a Masters of Law (Distinction) from the University of Technology, Sydney and has completed the Harvard University Advanced Management Program.
Mr Lloyd has over 20 years’ experience in the financial services industry and has an extensive understanding of the industry and demonstrated leadership skills.
ALTERNATE DIRECTORGillian LarkinsBCom, Grad Dip, MBA, CA, GAICD, (Age 44)
Appointed Alternate Director for Geoff Lloyd on 25 January 2013. Ms Larkins joined Perpetual as Group Executive Transformation Office in October 2012 and assumed the role of Chief Financial Officer in January 2013. She has over 20 years of experience in finance, strategy and management roles across a number of industries. Most recently, she was Chief Financial Officer, Managing Director of Westpac Institutional Bank, responsible for Finance and Strategy, and prior to that, Chief Financial Officer Australia and New Zealand of Citigroup. Ms Larkins has also served on the board of Hastings Fund Management as a Non-executive Director from 2009 to 2011. Ms Larkins resigned as an Alternate Director for Mr Lloyd on 27 October 2014.
PERPETUAL ANNUAL REPORT 2015 25
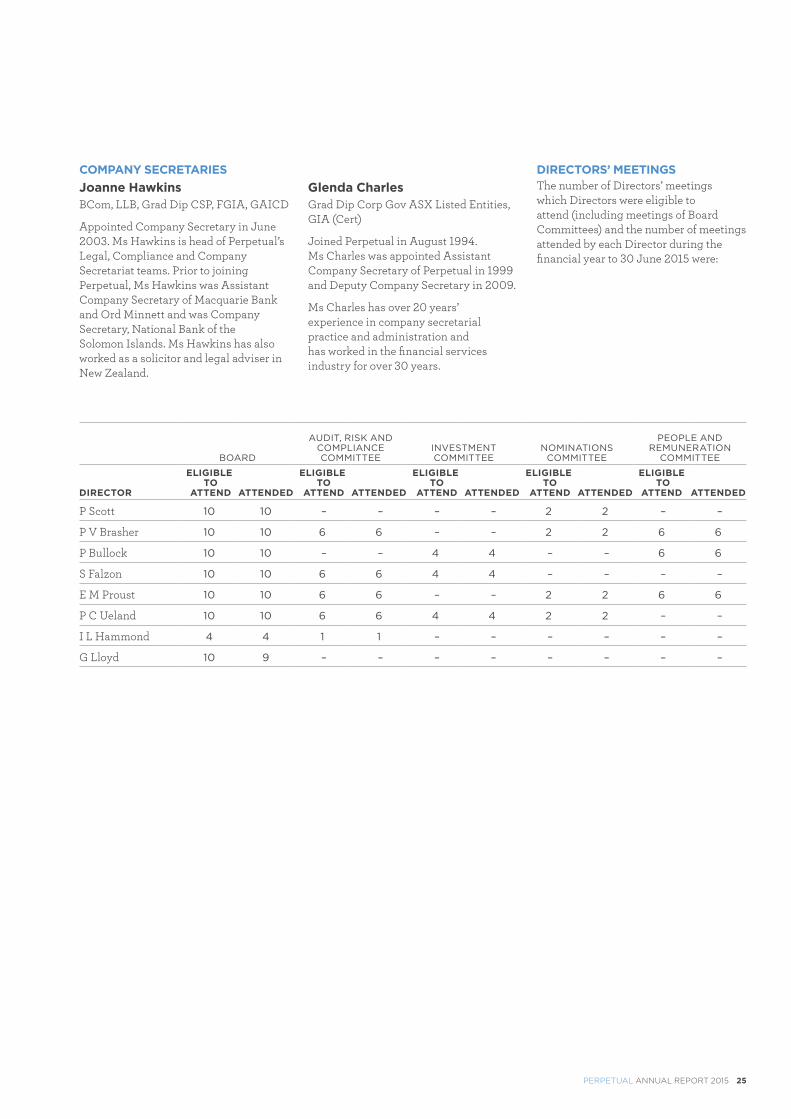
COMPANY SECRETARIESJoanne HawkinsBCom, LLB, Grad Dip CSP, FGIA, GAICD
Appointed Company Secretary in June 2003. Ms Hawkins is head of Perpetual’s Legal, Compliance and Company Secretariat teams. Prior to joining Perpetual, Ms Hawkins was Assistant Company Secretary of Macquarie Bank and Ord Minnett and was Company Secretary, National Bank of the Solomon Islands. Ms Hawkins has also worked as a solicitor and legal adviser in New Zealand.
Glenda CharlesGrad Dip Corp Gov ASX Listed Entities, GIA (Cert)
Joined Perpetual in August 1994. Ms Charles was appointed Assistant Company Secretary of Perpetual in 1999 and Deputy Company Secretary in 2009.
Ms Charles has over 20 years’ experience in company secretarial practice and administration and has worked in the financial services industry for over 30 years.
DIRECTORS’ MEETINGSThe number of Directors’ meetings which Directors were eligible to attend (including meetings of Board Committees) and the number of meetings attended by each Director during the financial year to 30 June 2015 were:
BOARD
AUDIT, RISK AND COMPLIANCE COMMITTEE
INVESTMENT COMMITTEE
NOMINATIONS COMMITTEE
PEOPLE AND REMUNERATION
COMMITTEE
DIRECTOR
ELIGIBLE TO
ATTEND ATTENDED
ELIGIBLE TO
ATTEND ATTENDED
ELIGIBLE TO
ATTEND ATTENDED
ELIGIBLE TO
ATTEND ATTENDED
ELIGIBLE TO
ATTEND ATTENDED
P Scott 10 10 – – – – 2 2 – –
P V Brasher 10 10 6 6 – – 2 2 6 6
P Bullock 10 10 – – 4 4 – – 6 6
S Falzon 10 10 6 6 4 4 – – – –
E M Proust 10 10 6 6 – – 2 2 6 6
P C Ueland 10 10 6 6 4 4 2 2 – –
I L Hammond 4 4 1 1 – – – – – –
G Lloyd 10 9 – – – – – – – –
26
DIRECTORS’ REPORT
CORPORATE RESPONSIBILITY STATEMENTPerpetual’s Corporate Responsibility Statement, which meets the requirements of ASX Listing Rule 4.10.3 will be provided at the time the Annual Report is released in September 2015. It is expected to be located on the Corporate Governance page of Perpetual’s website at www.perpetual.com.au/About/Corporate-Governance
PRINCIPAL ACTIVITIESThe principal activities of the consolidated entity during the financial year were funds management, portfolio management, financial planning, trustee, responsible entity and compliance services, executor services, investment administration and custody services.
There were no significant changes in the nature of activities of the consolidated entity during the year.
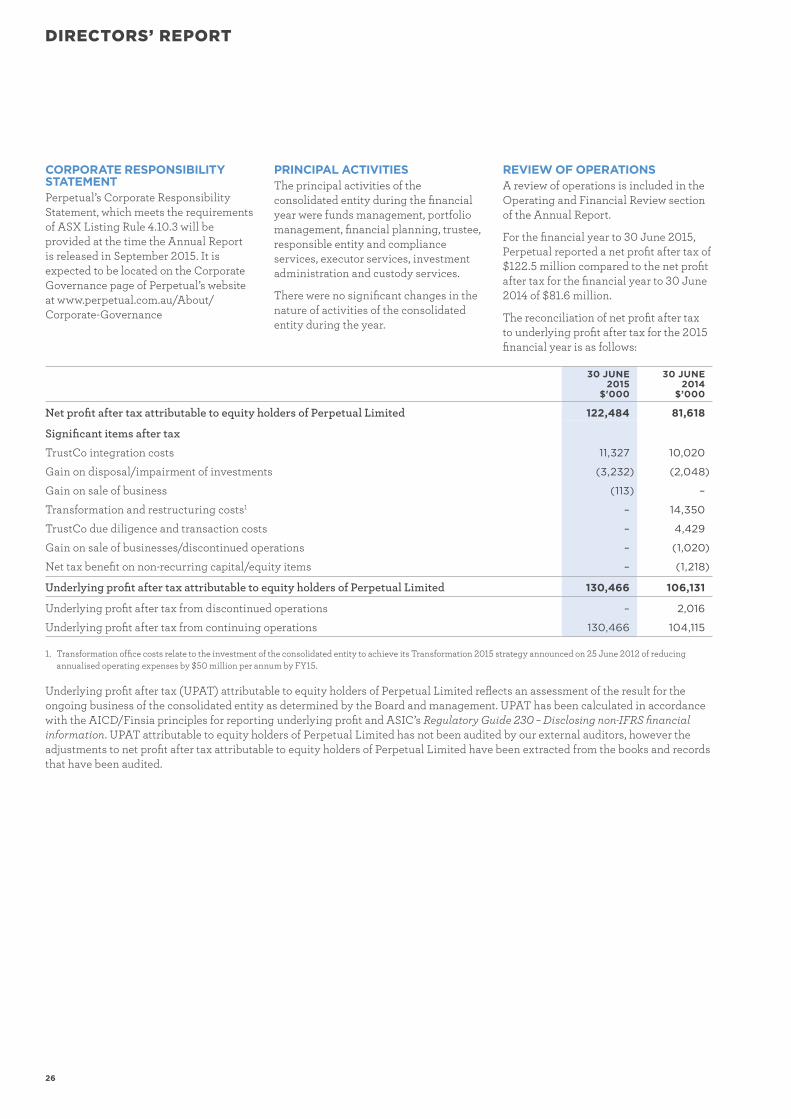
REVIEW OF OPERATIONSA review of operations is included in the Operating and Financial Review section of the Annual Report.
For the financial year to 30 June 2015, Perpetual reported a net profit after tax of $122.5 million compared to the net profit after tax for the financial year to 30 June 2014 of $81.6 million.
The reconciliation of net profit after tax to underlying profit after tax for the 2015 financial year is as follows:
30 JUNE 2015
$'000
30 JUNE 2014
$’000
Net profit after tax attributable to equity holders of Perpetual Limited 122,484 81,618
Significant items after tax
TrustCo integration costs 11,327 10,020
Gain on disposal/impairment of investments (3,232) (2,048)
Gain on sale of business (113) –
Transformation and restructuring costs1 – 14,350
TrustCo due diligence and transaction costs – 4,429
Gain on sale of businesses/discontinued operations – (1,020)
Net tax benefit on non-recurring capital/equity items – (1,218)
Underlying profit after tax attributable to equity holders of Perpetual Limited 130,466 106,131
Underlying profit after tax from discontinued operations – 2,016
Underlying profit after tax from continuing operations 130,466 104,115
1. Transformation office costs relate to the investment of the consolidated entity to achieve its Transformation 2015 strategy announced on 25 June 2012 of reducing annualised operating expenses by $50 million per annum by FY15.
Underlying profit after tax (UPAT) attributable to equity holders of Perpetual Limited reflects an assessment of the result for the ongoing business of the consolidated entity as determined by the Board and management. UPAT has been calculated in accordance with the AICD/Finsia principles for reporting underlying profit and ASIC’s Regulatory Guide 230 – Disclosing non-IFRS financial information. UPAT attributable to equity holders of Perpetual Limited has not been audited by our external auditors, however the adjustments to net profit after tax attributable to equity holders of Perpetual Limited have been extracted from the books and records that have been audited.
PERPETUAL ANNUAL REPORT 2015 27
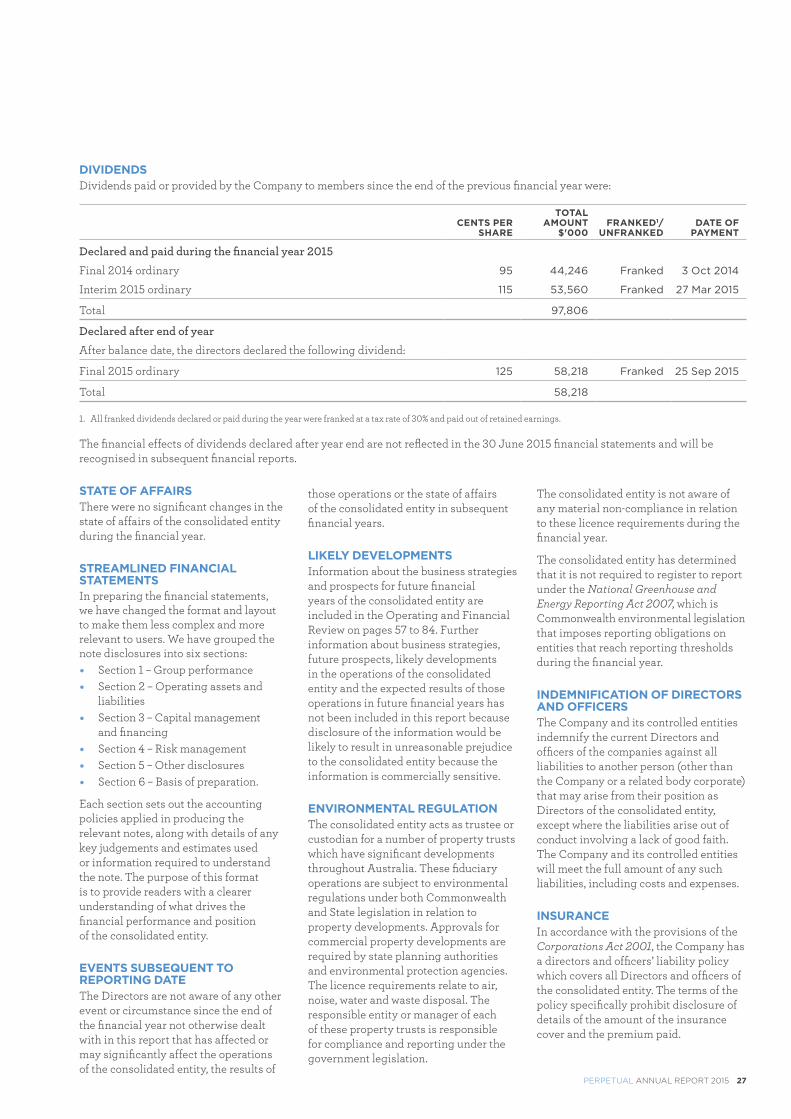
DIVIDENDSDividends paid or provided by the Company to members since the end of the previous financial year were:
CENTS PER SHARE
TOTAL AMOUNT
$'000FRANKED1/
UNFRANKEDDATE OF
PAYMENT
Declared and paid during the financial year 2015
Final 2014 ordinary 95 44,246 Franked 3 Oct 2014
Interim 2015 ordinary 115 53,560 Franked 27 Mar 2015
Total 97,806
Declared after end of year
After balance date, the directors declared the following dividend:
Final 2015 ordinary 125 58,218 Franked 25 Sep 2015
Total 58,218
1. All franked dividends declared or paid during the year were franked at a tax rate of 30% and paid out of retained earnings.
The financial effects of dividends declared after year end are not reflected in the 30 June 2015 financial statements and will be recognised in subsequent financial reports.
STATE OF AFFAIRSThere were no significant changes in the state of affairs of the consolidated entity during the financial year.
STREAMLINED FINANCIAL STATEMENTSIn preparing the financial statements, we have changed the format and layout to make them less complex and more relevant to users. We have grouped the note disclosures into six sections: � Section 1 – Group performance � Section 2 – Operating assets and
liabilities � Section 3 – Capital management
and financing � Section 4 – Risk management � Section 5 – Other disclosures � Section 6 – Basis of preparation.
Each section sets out the accounting policies applied in producing the relevant notes, along with details of any key judgements and estimates used or information required to understand the note. The purpose of this format is to provide readers with a clearer understanding of what drives the financial performance and position of the consolidated entity.
EVENTS SUBSEQUENT TO REPORTING DATEThe Directors are not aware of any other event or circumstance since the end of the financial year not otherwise dealt with in this report that has affected or may significantly affect the operations of the consolidated entity, the results of
those operations or the state of affairs of the consolidated entity in subsequent financial years.
LIKELY DEVELOPMENTSInformation about the business strategies and prospects for future financial years of the consolidated entity are included in the Operating and Financial Review on pages 57 to 84. Further information about business strategies, future prospects, likely developments in the operations of the consolidated entity and the expected results of those operations in future financial years has not been included in this report because disclosure of the information would be likely to result in unreasonable prejudice to the consolidated entity because the information is commercially sensitive.
ENVIRONMENTAL REGULATIONThe consolidated entity acts as trustee or custodian for a number of property trusts which have significant developments throughout Australia. These fiduciary operations are subject to environmental regulations under both Commonwealth and State legislation in relation to property developments. Approvals for commercial property developments are required by state planning authorities and environmental protection agencies. The licence requirements relate to air, noise, water and waste disposal. The responsible entity or manager of each of these property trusts is responsible for compliance and reporting under the government legislation.
The consolidated entity is not aware of any material non-compliance in relation to these licence requirements during the financial year.
The consolidated entity has determined that it is not required to register to report under the National Greenhouse and Energy Reporting Act 2007, which is Commonwealth environmental legislation that imposes reporting obligations on entities that reach reporting thresholds during the financial year.
INDEMNIFICATION OF DIRECTORS AND OFFICERSThe Company and its controlled entities indemnify the current Directors and officers of the companies against all liabilities to another person (other than the Company or a related body corporate) that may arise from their position as Directors of the consolidated entity, except where the liabilities arise out of conduct involving a lack of good faith. The Company and its controlled entities will meet the full amount of any such liabilities, including costs and expenses.
INSURANCEIn accordance with the provisions of the Corporations Act 2001, the Company has a directors and officers’ liability policy which covers all Directors and officers of the consolidated entity. The terms of the policy specifically prohibit disclosure of details of the amount of the insurance cover and the premium paid.
DIRECTORS’ REPORT
28
REMUNERATION REPORT
Dear Shareholder
On behalf of your Board, I am pleased to present our Remuneration Report for 2015.
The 2015 year has seen continued solid financial results where, overall, Perpetual met its business objectives. The stable executive team has continued to drive success across the business, with a particular focus in FY15 on completing the integration of The Trust Company into Perpetual to ensure that shareholder value of this acquisition is optimised. The Company also saw exceptional improvements in our employee engagement levels. Our efforts and focus on employee and leadership initiatives, including key new employee benefits, have impacted the 15 point increase in employee engagement from 2014.
With a strong foundation of financial performance, we have been able to increase our focus on enhancing our employee offering. This year, we introduced a number of new employee benefits, including a free financial health check for all employees, increased employer superannuation contributions and an annual employee share grant of up to $1,000 for all employees below senior leadership team level. These enhanced employee benefits are aimed at securing the financial wellbeing of our people into retirement and allow for increased shareholder, client and employer alignment consistent with our aim of securing the financial future of Australians.
During the year, Perpetual moved into a new stage: looking ahead to our new Lead & Grow strategy. One of the key aspects of our Transformation 2015 strategy was to lead in our core businesses and set the business up for future growth. Having successfully laid these foundations, we can move to an exciting time to focus on further improving and leading in our core areas, as well as exploring new opportunities.
Thank you for taking the time to read this report.
ELIZABETH M PROUST AOChairman, People and Remuneration Committee
PERPETUAL ANNUAL REPORT 2015 29
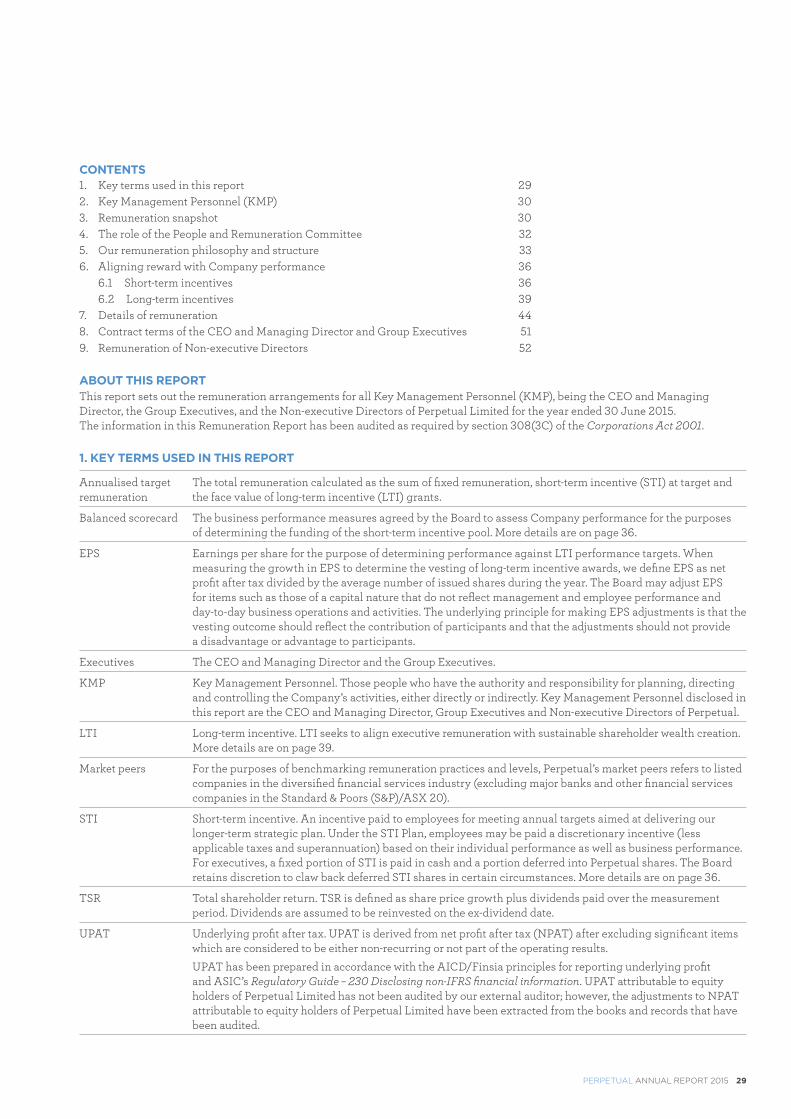
CONTENTS1. Key terms used in this report 292. Key Management Personnel (KMP) 303. Remuneration snapshot 304. The role of the People and Remuneration Committee 325. Our remuneration philosophy and structure 336. Aligning reward with Company performance 36 6.1 Short-term incentives 36 6.2 Long-term incentives 397. Details of remuneration 448. Contract terms of the CEO and Managing Director and Group Executives 519. Remuneration of Non-executive Directors 52
ABOUT THIS REPORTThis report sets out the remuneration arrangements for all Key Management Personnel (KMP), being the CEO and Managing Director, the Group Executives, and the Non-executive Directors of Perpetual Limited for the year ended 30 June 2015. The information in this Remuneration Report has been audited as required by section 308(3C) of the Corporations Act 2001.
1. KEY TERMS USED IN THIS REPORT
Annualised target remuneration
The total remuneration calculated as the sum of fixed remuneration, short-term incentive (STI) at target and the face value of long-term incentive (LTI) grants.
Balanced scorecard The business performance measures agreed by the Board to assess Company performance for the purposes of determining the funding of the short-term incentive pool. More details are on page 36.
EPS Earnings per share for the purpose of determining performance against LTI performance targets. When measuring the growth in EPS to determine the vesting of long-term incentive awards, we define EPS as net profit after tax divided by the average number of issued shares during the year. The Board may adjust EPS for items such as those of a capital nature that do not reflect management and employee performance and day-to-day business operations and activities. The underlying principle for making EPS adjustments is that the vesting outcome should reflect the contribution of participants and that the adjustments should not provide a disadvantage or advantage to participants.
Executives The CEO and Managing Director and the Group Executives.
KMP Key Management Personnel. Those people who have the authority and responsibility for planning, directing and controlling the Company’s activities, either directly or indirectly. Key Management Personnel disclosed in this report are the CEO and Managing Director, Group Executives and Non-executive Directors of Perpetual.
LTI Long-term incentive. LTI seeks to align executive remuneration with sustainable shareholder wealth creation. More details are on page 39.
Market peers For the purposes of benchmarking remuneration practices and levels, Perpetual’s market peers refers to listed companies in the diversified financial services industry (excluding major banks and other financial services companies in the Standard & Poors (S&P)/ASX 20).
STI Short-term incentive. An incentive paid to employees for meeting annual targets aimed at delivering our longer-term strategic plan. Under the STI Plan, employees may be paid a discretionary incentive (less applicable taxes and superannuation) based on their individual performance as well as business performance. For executives, a fixed portion of STI is paid in cash and a portion deferred into Perpetual shares. The Board retains discretion to claw back deferred STI shares in certain circumstances. More details are on page 36.
TSR Total shareholder return. TSR is defined as share price growth plus dividends paid over the measurement period. Dividends are assumed to be reinvested on the ex-dividend date.
UPAT Underlying profit after tax. UPAT is derived from net profit after tax (NPAT) after excluding significant items which are considered to be either non-recurring or not part of the operating results.
UPAT has been prepared in accordance with the AICD/Finsia principles for reporting underlying profit and ASIC’s Regulatory Guide – 230 Disclosing non-IFRS financial information. UPAT attributable to equity holders of Perpetual Limited has not been audited by our external auditor; however, the adjustments to NPAT attributable to equity holders of Perpetual Limited have been extracted from the books and records that have been audited.
30
DIRECTORS’ REPORTREMUNERATION REPORT
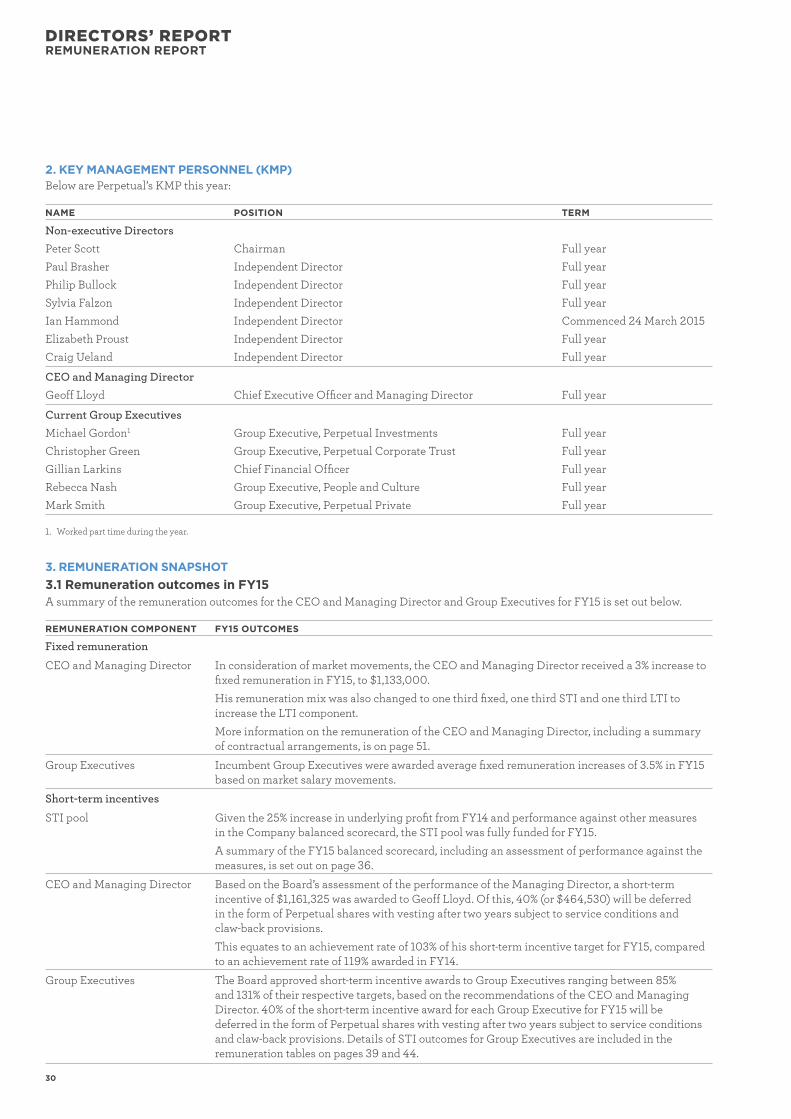
2. KEY MANAGEMENT PERSONNEL (KMP)Below are Perpetual’s KMP this year:
NAME POSITION TERM
Non-executive Directors
Peter Scott Chairman Full year
Paul Brasher Independent Director Full year
Philip Bullock Independent Director Full year
Sylvia Falzon Independent Director Full year
Ian Hammond Independent Director Commenced 24 March 2015
Elizabeth Proust Independent Director Full year
Craig Ueland Independent Director Full year
CEO and Managing Director
Geoff Lloyd Chief Executive Officer and Managing Director Full year
Current Group Executives
Michael Gordon1 Group Executive, Perpetual Investments Full year
Christopher Green Group Executive, Perpetual Corporate Trust Full year
Gillian Larkins Chief Financial Officer Full year
Rebecca Nash Group Executive, People and Culture Full year
Mark Smith Group Executive, Perpetual Private Full year
1. Worked part time during the year.
3. REMUNERATION SNAPSHOT3.1 Remuneration outcomes in FY15A summary of the remuneration outcomes for the CEO and Managing Director and Group Executives for FY15 is set out below.
REMUNERATION COMPONENT FY15 OUTCOMES
Fixed remuneration
CEO and Managing Director In consideration of market movements, the CEO and Managing Director received a 3% increase to fixed remuneration in FY15, to $1,133,000.
His remuneration mix was also changed to one third fixed, one third STI and one third LTI to increase the LTI component.
More information on the remuneration of the CEO and Managing Director, including a summary of contractual arrangements, is on page 51.
Group Executives Incumbent Group Executives were awarded average fixed remuneration increases of 3.5% in FY15 based on market salary movements.
Short-term incentives
STI pool Given the 25% increase in underlying profit from FY14 and performance against other measures in the Company balanced scorecard, the STI pool was fully funded for FY15.
A summary of the FY15 balanced scorecard, including an assessment of performance against the measures, is set out on page 36.
CEO and Managing Director Based on the Board’s assessment of the performance of the Managing Director, a short-term incentive of $1,161,325 was awarded to Geoff Lloyd. Of this, 40% (or $464,530) will be deferred in the form of Perpetual shares with vesting after two years subject to service conditions and claw-back provisions.
This equates to an achievement rate of 103% of his short-term incentive target for FY15, compared to an achievement rate of 119% awarded in FY14.
Group Executives The Board approved short-term incentive awards to Group Executives ranging between 85% and 131% of their respective targets, based on the recommendations of the CEO and Managing Director. 40% of the short-term incentive award for each Group Executive for FY15 will be deferred in the form of Perpetual shares with vesting after two years subject to service conditions and claw-back provisions. Details of STI outcomes for Group Executives are included in the remuneration tables on pages 39 and 44.
PERPETUAL ANNUAL REPORT 2015 31
REMUNERATION COMPONENT FY15 OUTCOMES
Long-term incentives
CEO and Managing Director Effective 1 October 2011, Geoff Lloyd was awarded an LTI grant (2011 LTI) of 32,066 shares for which vesting was subject to TSR and EPS growth performance targets over a three year period.
100% of the portion of Mr Lloyd’s LTI grant subject to a TSR performance vested on 1 October 2014, as Perpetual’s TSR performance over the performance period ranked at the 92nd percentile. 30% of the portion of Mr Lloyd’s 2011 LTI grant subject to an EPS growth also vested on 1 October 2014, as the EPS growth over the period was 6.59%.
As a result 20,843 shares vested to Mr Lloyd, and the remaining 11,223 shares were forfeited.
Details of the LTI arrangements at Perpetual are on page 39.
Group Executives As a result of the 2011 LTI vesting outcomes (as mentioned above for the CEO and Managing Director), 10,035 shares vested to Mr Green based on the TSR and EPS performance outcome and 5,404 were forfeited.
No other current Group Executive participated in the 2011 LTI grant, as they commenced employment after the grant date.
Non-executive Director fees
Total fees paid to Non-executive Directors in FY15 were $1,230,058, which represented an increase of 8.6% from the total fees of $1,132,847 paid in FY14.
The total remuneration available to Non-executive Directors remains at $2,250,000, as approved by shareholders at the 2006 Annual General Meeting.
Further detail on Non-executive Director remuneration is provided on page 52.
3.2 Fixed remuneration increases for FY16Following a review of market fixed remuneration increase trends, all employees including the CEO and Managing Director and Group Executives are eligible for a fixed remuneration increase in FY16. A budget increase on average of 3% will be applied to all eligible employees.
3.3 New employee benefitsAt Perpetual, we are passionate about protecting and growing the wealth of all Australians and positioning them for financial security in retirement. With our strengthened business performance, we are pleased to be able to extend improved benefits to our employees to help them reach their financial goals.
The new employee benefits introduced during FY15 were: � a free financial health check for all employees � increased employer superannuation contributions � an annual grant of up to $1,000 of Perpetual shares to eligible employees � reduced management fees on investment products.
The change in the Company’s new superannuation policy will see employer contributions increase to 12% by 2020 (by 0.5% increments applied annually). As a result, all employees will receive a 0.5% increase in employer superannuation contributions to 10% effective 1 September 2015.
As the Company has met its FY15 profit targets, the first grant of the annual $1,000 employee share grant under the One Perpetual Share Plan will be made to eligible employees in early FY16.
3.4 CEO and Managing Director and Group Executive remuneration review for FY16The Board has reviewed the remuneration package for the CEO and Managing Director and the Group Executives, and has decided to provide fixed remuneration increases averaging 2.8% (inclusive of the increased employer superannuation contributions) for FY16. The increases are in consideration of market movements and to ensure retention for this key group as the Company moves to execute the Lead & Grow strategy. No changes to the remuneration mix were made.
3.5 Actual remuneration receivedThe following table provides a summary of actual remuneration received by the CEO and Managing Director and the Group Executives during FY15. This includes: � fixed remuneration (consisting of cash salary, superannuation, packaged employee benefits and associated fringe benefits tax) � the cash component of short-term incentives awarded for performance in FY14 (paid September 2015) � the value of equity grants awarded in previous years which vested during the year and � cash dividends received during the year on unvested LTI shares received during the year.
32
DIRECTORS’ REPORTREMUNERATION REPORT
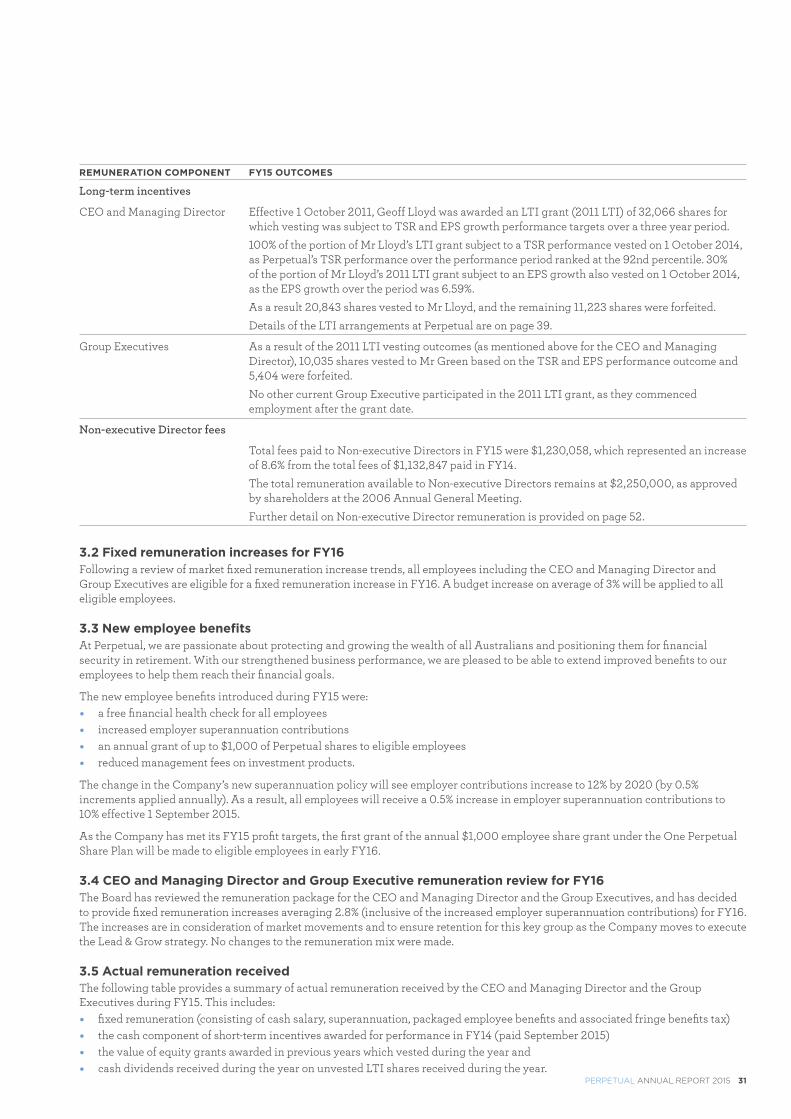
This table differs from the remuneration table on page 44, which has been constructed in accordance with the requirements of the relevant accounting standards. It includes remuneration received on a cash rather than an accrual basis.
ACTUAL REMUNERATION RECEIVED
NAMETOTAL
$
TOTAL FIXED
REMUNERATION$
STI CASH 1
$
EQUITY VESTED DURING
YEAR 2
$
DIVIDENDS PAID ON
UNVESTED SHARES DURING
YEAR 3
$
SIGN-ON AND
RELOCATION BENEFITS
$
PAYMENTS MADE ON
TERMINATION$
CEO and Managing Director
G Lloyd 2,890,030 1,125,101 788,040 913,757 63,132 – –
Current Group Executives
M Gordon 1,120,788 581,356 300,504 212,357 26,571 – –
C Green 1,210,157 452,833 290,400 439,934 26,990 – –
G Larkins 918,272 668,958 237,600 – 11,714 – –
R Nash 773,014 586,625 177,178 – 9,211 – –
M Smith 1,482,889 576,333 236,880 648,876 20,800 – –
Totals 8,395,150 3,991,206 2,030,602 2,214,924 158,418 – –
1. Represents the cash portion of STI outcome for FY14 paid in September 2014.2. For G Lloyd and C Green, this represents the value at vesting of the 2011 LTI grant made on 1 October 2011. For M Smith, this includes the value at vesting of his
sign-on equity grants that vested on 1 October 2014. These shares have been valued at $43.84, being the closing market value of Perpetual shares on the vesting date of 1 October 2014. For M Gordon, this includes the value at vesting of his sign-on equity grant that vested on 30 June 2014. These shares have been valued at $47.38, being the closing market value of Perpetual shares on the vesting date of 30 June 2014.
3. Dividends paid during FY15 on FY14 deferred STI shares and unvested long-term incentives issued prior to 2012.
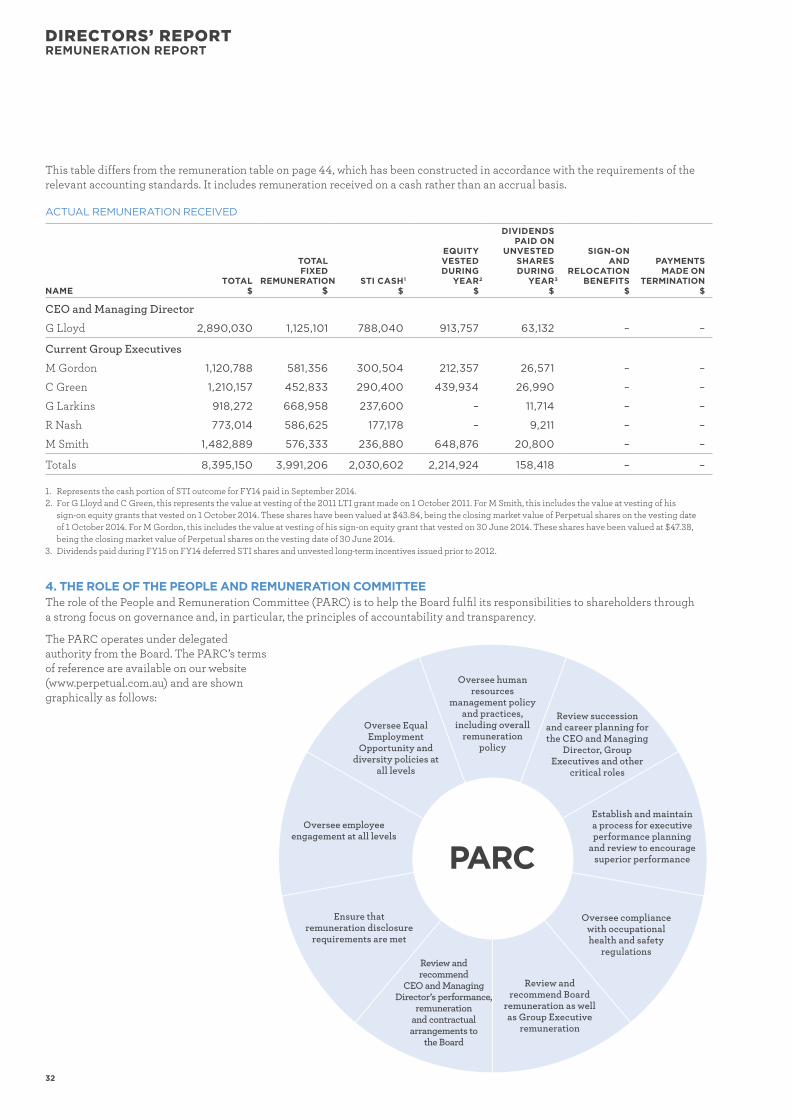
4. THE ROLE OF THE PEOPLE AND REMUNERATION COMMITTEEThe role of the People and Remuneration Committee (PARC) is to help the Board fulfil its responsibilities to shareholders through a strong focus on governance and, in particular, the principles of accountability and transparency.
The PARC operates under delegated authority from the Board. The PARC’s terms of reference are available on our website (www.perpetual.com.au) and are shown graphically as follows:
Oversee human resources
management policy and practices,
including overall remuneration
policy
Review succession and career planning for the CEO and Managing
Director, Group Executives and other
critical roles
Establish and maintain a process for executive performance planning
and review to encourage superior performance
Oversee compliance with occupational health and safety
regulations
Review and recommend Board
remuneration as well as Group Executive
remuneration
Review and recommend
CEO and Managing Director’s performance,
remuneration and contractual arrangements to
the Board
Ensure that remuneration disclosure
requirements are met
Oversee employee engagement at all levels
Oversee Equal Employment
Opportunity and diversity policies at
all levels
PARC
PERPETUAL ANNUAL REPORT 2015 33
The terms of reference are broad, encompassing remuneration as well as executive development, talent management and succession planning. This enables the PARC to focus on ensuring a high quality of succession planning and executive development at all levels of Perpetual.
The PARC members for FY15 were: � Elizabeth Proust (Chairman) � Paul Brasher and � Philip Bullock.
The PARC met six times during the year. A standing invitation exists to all Directors to attend PARC meetings. Attendance at these meetings is set out on page 25 of the Directors’ Report.
At the PARC’s invitation, the CEO and Managing Director and the Group Executive People and Culture attended meetings except where matters associated with their own performance evaluation, development and remuneration were to be considered.
The PARC considers advice and views from those invited to attend meetings and draws on services from a range of external sources, including remuneration consultants.
USE OF REMUNERATION CONSULTANTS
In March 2011, the PARC appointed PricewaterhouseCoopers (PwC) as its principal remuneration consultant to provide specialist advice on executive remuneration and other Group-wide remuneration matters.
During the year PwC provided general information to the PARC in respect of Executive and Non-executive Director remuneration practices and trends. This information did not include any specific recommendations in relation to the remuneration or fees paid to KMP.
5. OUR REMUNERATION PHILOSOPHY AND STRUCTUREPerpetual’s remuneration philosophy is designed to align with and support the achievement of our business strategy, while ensuring that remuneration outcomes are aligned with shareholder interests and are market competitive. To that end, we have created six guiding principles that direct our remuneration approach.
5.1 Remuneration principlesOur remuneration policy is designed around the following six guiding principles:1. The remuneration structure should attract, motivate and retain the desired talent within Perpetual.2. The remuneration structure should align value creation for shareholders, clients and employees.3. The remuneration structure should embed sound risk management.4. Incentive arrangements should motivate performance.5. Remuneration should be delivered efficiently and effectively considering the level of administration required.6. The remuneration structure should be supported by a governance framework that avoids conflict of interest and ensures that
proper controls are in place.
The PARC has also adopted a number of practices that collectively contribute to each remuneration principle.
5.2 Alignment with sound risk managementWhen determining the variable (or ‘at risk’) elements of remuneration, we ensure that risk management is a key performance metric using specific performance goals and targets. Sound risk management practices include: � deeming employees to be ineligible for the payment of STI in the event that they exhibit poor risk behaviours � incorporating goals that are specifically related to risk management performance measures in individual employee scorecards;
these goals are approved by the Board and cascade down to all employees � performing scenario testing on potential outcomes under any new incentive plans � regularly reviewing the alignment between remuneration outcomes and performance achievement for existing incentive plans � deferring a portion of STI into Perpetual shares to align remuneration outcomes with longer-term Company performance � including provisions in incentive plans for the Board or the PARC to adjust incentive payments downwards, if required, to protect
Perpetual’s financial soundness, or to respond to significant unexpected or unintended consequences � including a provision for the Board or the PARC to ‘claw back’ deferred STI shares in certain circumstances, and � continuous monitoring of remuneration outcomes by the Board, the PARC and management, to ensure that results are promoting
behaviours that support Perpetual’s long-term financial soundness and the desired culture.
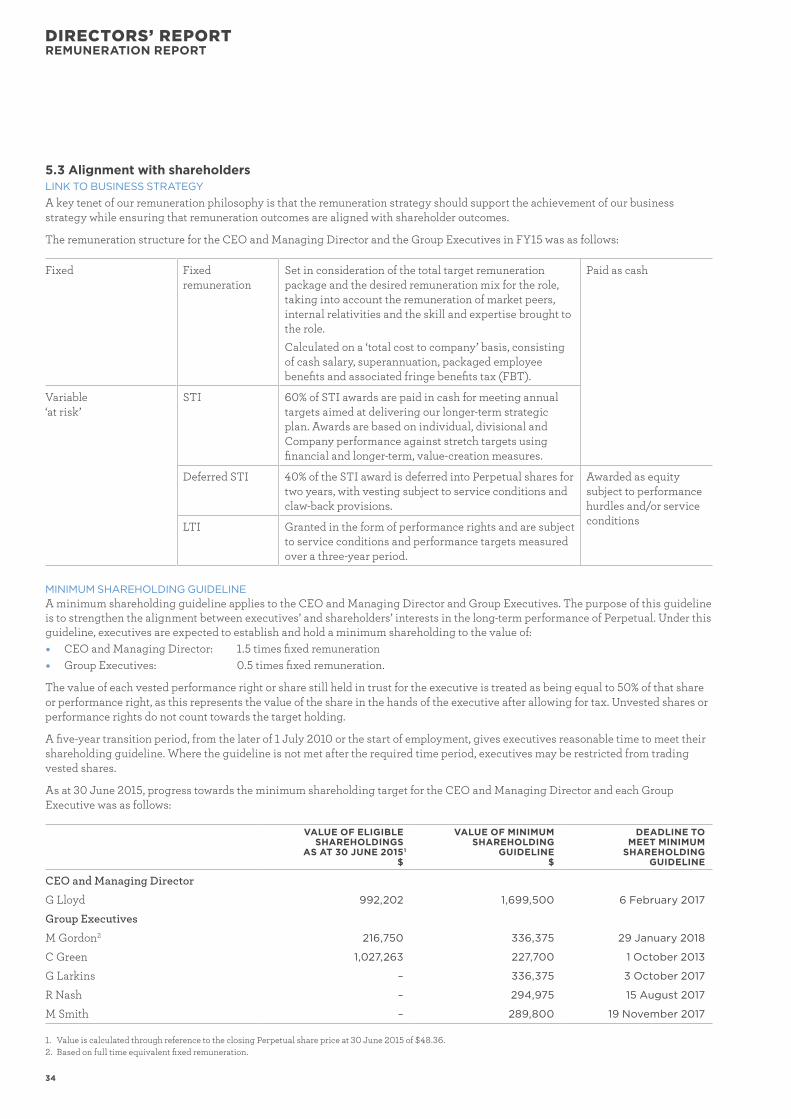
34
DIRECTORS’ REPORTREMUNERATION REPORT
5.3 Alignment with shareholdersLINK TO BUSINESS STRATEGY
A key tenet of our remuneration philosophy is that the remuneration strategy should support the achievement of our business strategy while ensuring that remuneration outcomes are aligned with shareholder outcomes.
The remuneration structure for the CEO and Managing Director and the Group Executives in FY15 was as follows:
Fixed Fixed remuneration
Set in consideration of the total target remuneration package and the desired remuneration mix for the role, taking into account the remuneration of market peers, internal relativities and the skill and expertise brought to the role.
Calculated on a ‘total cost to company’ basis, consisting of cash salary, superannuation, packaged employee benefits and associated fringe benefits tax (FBT).
Paid as cash
Variable ‘at risk’
STI 60% of STI awards are paid in cash for meeting annual targets aimed at delivering our longer-term strategic plan. Awards are based on individual, divisional and Company performance against stretch targets using financial and longer-term, value-creation measures.
Deferred STI 40% of the STI award is deferred into Perpetual shares for two years, with vesting subject to service conditions and claw-back provisions.
Awarded as equity subject to performance hurdles and/or service conditionsLTI Granted in the form of performance rights and are subject
to service conditions and performance targets measured over a three-year period.
MINIMUM SHAREHOLDING GUIDELINEA minimum shareholding guideline applies to the CEO and Managing Director and Group Executives. The purpose of this guideline is to strengthen the alignment between executives’ and shareholders’ interests in the long-term performance of Perpetual. Under this guideline, executives are expected to establish and hold a minimum shareholding to the value of: � CEO and Managing Director: 1.5 times fixed remuneration � Group Executives: 0.5 times fixed remuneration.
The value of each vested performance right or share still held in trust for the executive is treated as being equal to 50% of that share or performance right, as this represents the value of the share in the hands of the executive after allowing for tax. Unvested shares or performance rights do not count towards the target holding.
A five-year transition period, from the later of 1 July 2010 or the start of employment, gives executives reasonable time to meet their shareholding guideline. Where the guideline is not met after the required time period, executives may be restricted from trading vested shares.
As at 30 June 2015, progress towards the minimum shareholding target for the CEO and Managing Director and each Group Executive was as follows:
VALUE OF ELIGIBLE SHAREHOLDINGS
AS AT 30 JUNE 2015 1 $
VALUE OF MINIMUM SHAREHOLDING
GUIDELINE$
DEADLINE TO MEET MINIMUM
SHAREHOLDING GUIDELINE
CEO and Managing Director
G Lloyd 992,202 1,699,500 6 February 2017
Group Executives
M Gordon2 216,750 336,375 29 January 2018
C Green 1,027,263 227,700 1 October 2013
G Larkins – 336,375 3 October 2017
R Nash – 294,975 15 August 2017
M Smith – 289,800 19 November 2017
1. Value is calculated through reference to the closing Perpetual share price at 30 June 2015 of $48.36.2. Based on full time equivalent fixed remuneration.
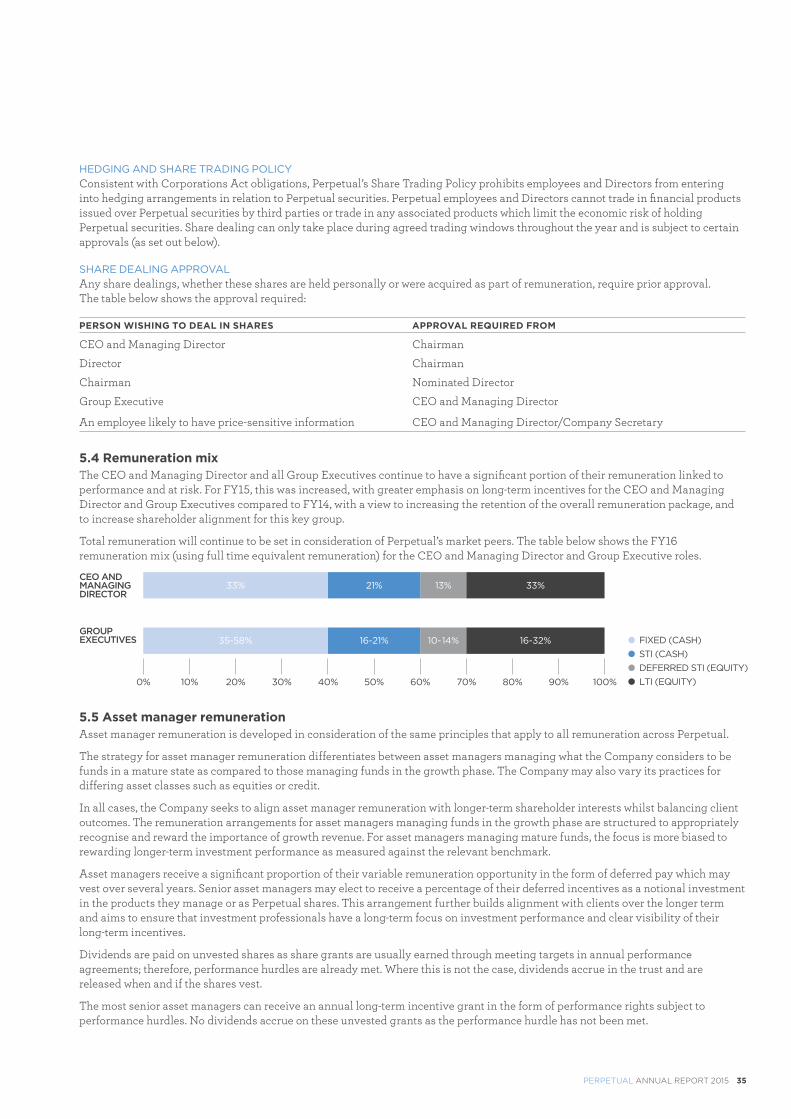
PERPETUAL ANNUAL REPORT 2015 35
HEDGING AND SHARE TRADING POLICYConsistent with Corporations Act obligations, Perpetual’s Share Trading Policy prohibits employees and Directors from entering into hedging arrangements in relation to Perpetual securities. Perpetual employees and Directors cannot trade in financial products issued over Perpetual securities by third parties or trade in any associated products which limit the economic risk of holding Perpetual securities. Share dealing can only take place during agreed trading windows throughout the year and is subject to certain approvals (as set out below).
SHARE DEALING APPROVALAny share dealings, whether these shares are held personally or were acquired as part of remuneration, require prior approval. The table below shows the approval required:
PERSON WISHING TO DEAL IN SHARES APPROVAL REQUIRED FROM
CEO and Managing Director Chairman
Director Chairman
Chairman Nominated Director
Group Executive CEO and Managing Director
An employee likely to have price-sensitive information CEO and Managing Director/Company Secretary
5.4 Remuneration mixThe CEO and Managing Director and all Group Executives continue to have a significant portion of their remuneration linked to performance and at risk. For FY15, this was increased, with greater emphasis on long-term incentives for the CEO and Managing Director and Group Executives compared to FY14, with a view to increasing the retention of the overall remuneration package, and to increase shareholder alignment for this key group.
Total remuneration will continue to be set in consideration of Perpetual’s market peers. The table below shows the FY16 remuneration mix (using full time equivalent remuneration) for the CEO and Managing Director and Group Executive roles.
FIXED (CASH)STI (CASH)DEFERRED STI (EQUITY)LTI (EQUITY)0% 10% 20% 30% 40% 50% 60% 70% 80% 90% 100%
GROUPEXECUTIVES
CEO ANDMANAGINGDIRECTOR
33% 21% 13% 33%
35-58% 16-21% 10-14% 16-32%
5.5 Asset manager remunerationAsset manager remuneration is developed in consideration of the same principles that apply to all remuneration across Perpetual.
The strategy for asset manager remuneration differentiates between asset managers managing what the Company considers to be funds in a mature state as compared to those managing funds in the growth phase. The Company may also vary its practices for differing asset classes such as equities or credit.
In all cases, the Company seeks to align asset manager remuneration with longer-term shareholder interests whilst balancing client outcomes. The remuneration arrangements for asset managers managing funds in the growth phase are structured to appropriately recognise and reward the importance of growth revenue. For asset managers managing mature funds, the focus is more biased to rewarding longer-term investment performance as measured against the relevant benchmark.
Asset managers receive a significant proportion of their variable remuneration opportunity in the form of deferred pay which may vest over several years. Senior asset managers may elect to receive a percentage of their deferred incentives as a notional investment in the products they manage or as Perpetual shares. This arrangement further builds alignment with clients over the longer term and aims to ensure that investment professionals have a long-term focus on investment performance and clear visibility of their long-term incentives.
Dividends are paid on unvested shares as share grants are usually earned through meeting targets in annual performance agreements; therefore, performance hurdles are already met. Where this is not the case, dividends accrue in the trust and are released when and if the shares vest.
The most senior asset managers can receive an annual long-term incentive grant in the form of performance rights subject to performance hurdles. No dividends accrue on these unvested grants as the performance hurdle has not been met.
36
DIRECTORS’ REPORTREMUNERATION REPORT
6. ALIGNING REWARD WITH COMPANY PERFORMANCE6.1 Short-term incentives6.1.1 LINKING COMPANY PERFORMANCE AND REMUNERATION
One of Perpetual’s remuneration guiding principles is that the remuneration structure should align value creation for shareholders, clients and employees.
This section demonstrates the strong alignment between Company performance and remuneration outcomes for KMP over the last five years.
The following table shows the Company’s five-year performance.
PERPETUAL’S FIVE-YEAR PERFORMANCE
YEAR END
30 JUNE 2011
30 JUNE 2012
30 JUNE 2013
30 JUNE 2014
30 JUNE 2015
Net profit after tax reported ($’000) 62,031 26,679 60,968 81,618 122,484
UPAT reported ($’000) 72,879 67,623 76,320 106,131 130,466
Ordinary dividend per share declared with respect to the year ($) 1.85 0.90 1.30 1.75 2.40
Earnings per share – UPAT1 ($) 1.79 1.74 1.98 2.55 2.91
Closing share price ($) 24.93 22.90 35.40 47.38 48.36
Annual total shareholder return (TSR) -8.76% -10.65% 78.38% 19.87% 20.55%
1. Based on basic EPS calculated based on the number of ordinary shares only.
6.1.2 MEASURING PERFORMANCEAt the beginning of each financial year the Board agrees the balanced scorecard goals for Perpetual and each division for the coming year. The scorecard is considered to be ‘balanced’ because it includes a range of short-term financial and longer-term value-creation measures. This approach aims to balance rewards for meeting financial objectives for the year, with rewarding activities designed to deliver sustainable future profits. In FY15 the measures included Financial, Client Advocacy, Growth, People and Operational efficiency.
The balanced scorecard includes stretch targets approved by the Board, allowing the business to be assessed in the context of the operating environment. Financial performance remains a key performance indicator to ensure that STI outcomes under the STI plan are closely aligned with shareholder interests.
The balanced scorecard measures for FY15 and performance against those measures is summarised below:
MEASURE WEIGHTING FULL YEAR PERFORMANCE
Financial Outcome Comments
Underlying profit after tax (UPAT)
40% Performance above UPAT plan target
FY15 UPAT increased by 25% compared to FY14. This was a very good achievement for shareholders and continues to build on the strong performance Perpetual has displayed in recent years.
Client advocacy Outcome Comments
Improve client advocacy – external net promoter score (NPS) performance
10% Performance below target
Client advocacy (as measured by NPS) for Perpetual as a whole improved by one point from 2014 to 26 this year. While this is an improvement on last year, it was not the uplift we had planned on. Client satisfaction remains a strong focus for us, and we are building client experience capabilities across Perpetual as part of our Lead & Grow strategy.
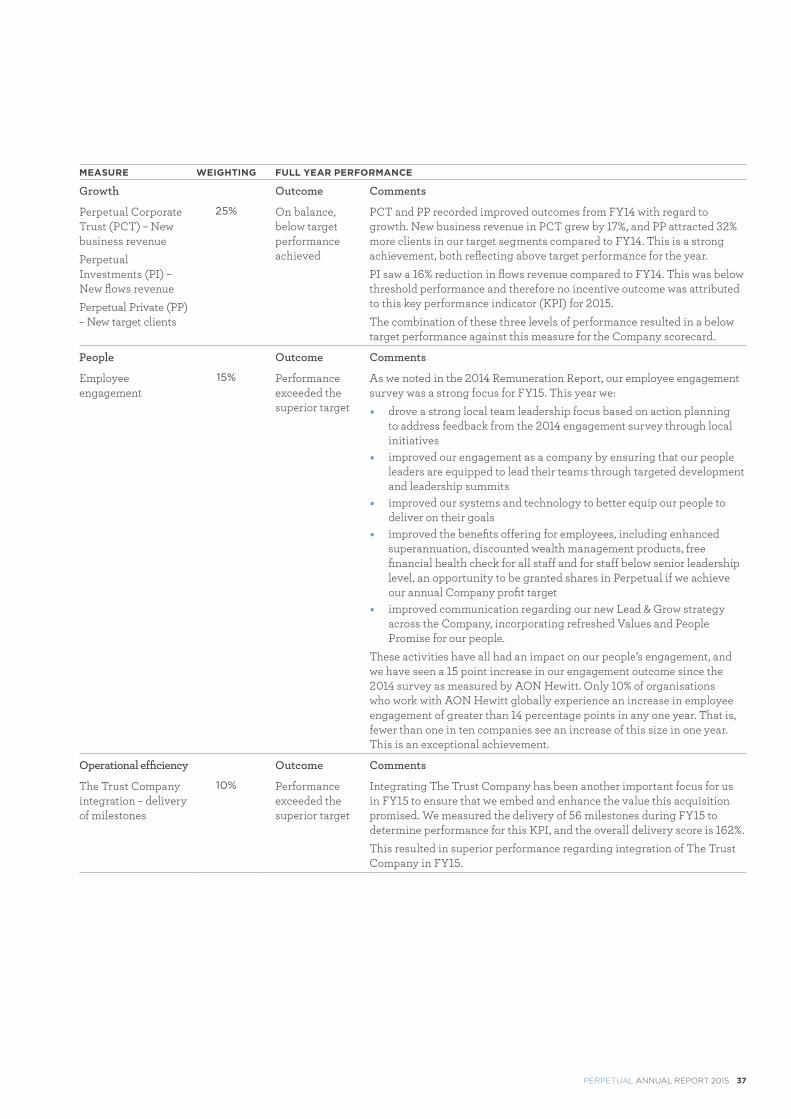
PERPETUAL ANNUAL REPORT 2015 37
MEASURE WEIGHTING FULL YEAR PERFORMANCE
Growth Outcome Comments
Perpetual Corporate Trust (PCT) – New business revenue
Perpetual Investments (PI) – New flows revenue
Perpetual Private (PP) – New target clients
25% On balance, below target performance achieved
PCT and PP recorded improved outcomes from FY14 with regard to growth. New business revenue in PCT grew by 17%, and PP attracted 32% more clients in our target segments compared to FY14. This is a strong achievement, both reflecting above target performance for the year.
PI saw a 16% reduction in flows revenue compared to FY14. This was below threshold performance and therefore no incentive outcome was attributed to this key performance indicator (KPI) for 2015.
The combination of these three levels of performance resulted in a below target performance against this measure for the Company scorecard.
People Outcome Comments
Employee engagement
15% Performance exceeded the superior target
As we noted in the 2014 Remuneration Report, our employee engagement survey was a strong focus for FY15. This year we:
� drove a strong local team leadership focus based on action planning to address feedback from the 2014 engagement survey through local initiatives
� improved our engagement as a company by ensuring that our people leaders are equipped to lead their teams through targeted development and leadership summits
� improved our systems and technology to better equip our people to deliver on their goals
� improved the benefits offering for employees, including enhanced superannuation, discounted wealth management products, free financial health check for all staff and for staff below senior leadership level, an opportunity to be granted shares in Perpetual if we achieve our annual Company profit target
� improved communication regarding our new Lead & Grow strategy across the Company, incorporating refreshed Values and People Promise for our people.
These activities have all had an impact on our people’s engagement, and we have seen a 15 point increase in our engagement outcome since the 2014 survey as measured by AON Hewitt. Only 10% of organisations who work with AON Hewitt globally experience an increase in employee engagement of greater than 14 percentage points in any one year. That is, fewer than one in ten companies see an increase of this size in one year. This is an exceptional achievement.
Operational efficiency Outcome Comments
The Trust Company integration – delivery of milestones
10% Performance exceeded the superior target
Integrating The Trust Company has been another important focus for us in FY15 to ensure that we embed and enhance the value this acquisition promised. We measured the delivery of 56 milestones during FY15 to determine performance for this KPI, and the overall delivery score is 162%.
This resulted in superior performance regarding integration of The Trust Company in FY15.
38
DIRECTORS’ REPORTREMUNERATION REPORT
6.1.3 DETERMINING THE STI POOLAt the conclusion of each financial year, the Perpetual Board considers Company performance against each measure of the balanced scorecard, and on the basis of this review recommends the pool that is available for distribution to employees by way of STI payments. This is expressed as a percentage of the aggregate of all STI targets for eligible employees. The outcome of this assessment determines the proportion of the overall pool each division receives.
As discussed in section 6.1.2, overall performance against the Company scorecard was at plan for the year. Given this, the Board approved a fully funded STI pool for FY15.
The performance of each division against their scorecard is assessed by the CEO and Managing Director. Divisional pools are then allocated to the employees of that division based on the individual performance rating and target STI of the respective employees. The maximum STI opportunity for each employee is two times their target STI. Each year performance targets and goals are set for employees in consideration of the balanced scorecards for their division and the Company to ensure alignment of objectives.
6.1.4 DISTRIBUTING THE STI POOLPerformance objectives are assessed throughout the year as part of the performance management process. At year end, an annual assessment of each employee’s performance is made and the STI is then allocated.
Individual STI awards are determined through an assessment of overall Company performance against the balanced scorecard, divisional performance against a divisional scorecard and individual performance, which includes an assessment against behavioural expectations for all employees. Employees must also meet risk and compliance requirements to be eligible to receive an STI payment.
For FY15, 90% of the CEO and Managing Director’s STI outcome was weighted to overall performance against the Company scorecard, with 10% weighted to individual measures. For Group Executives, 50% of their STI outcome was weighted to overall performance against the Company scorecard, with 50% weighted to the performance of their division and individual measures. This equal focus on Company and divisional/individual performance ensures shared accountability for Company performance amongst Group Executives, balanced with divisional and individual priorities. It provides greater scope to differentiate the incentive outcomes for Group Executives to ensure a strong adjustment to individual performance contribution.
The Senior Leadership Team (direct reports to Group Executives) also have a portion (30%) of their STI outcome weighted to overall Company scorecard performance. The remaining 70% is weighted to individual performance measures.
The CEO and Managing Director makes recommendations to the PARC on STI allocations for the Group Executives, and these are subject to approval by the Board. The Chairman of the Board makes recommendations to the Board on the STI allocation for the CEO and Managing Director, and this is also approved by the Board.
6.1.5 DELIVERING STI AWARDSSTI payments are delivered in cash and deferred Perpetual shares. Cash payments are made in September following the end of the performance year less applicable tax and superannuation.
Deferral arrangementsThe STI plan requires that 40% of an executive’s STI award be delivered in the form of unvested Perpetual shares. Deferred STI shares may vest after a two-year vesting period, subject to service conditions and claw-back provisions. Dividends on deferred STI shares are paid during the vesting period as the performance criteria for awarding the STI have already been met.
Termination of employmentIn the event of the CEO and Managing Director or a Group Executive ceasing employment with the Company due to resignation, poor performance or dismissal, all unvested STI shares will be forfeited at the termination date. If an executive is made redundant or retires, dies or exits due to total and permanent disablement, unvested shares are retained by the executive or their estate, with vesting subject to the original two-year period and claw-back provisions.
This approach strengthens the alignment between executives’ and shareholders’ interest in the long-term performance of Perpetual, extending beyond the executives’ tenure.
Claw-back provisionsThe Board retains a discretion to claw back deferred STI shares awarded to executives prior to the shares vesting if the Board becomes aware of any information that, had it been available at the time STI awards were determined, would have resulted in a different (or no) STI amount being awarded.
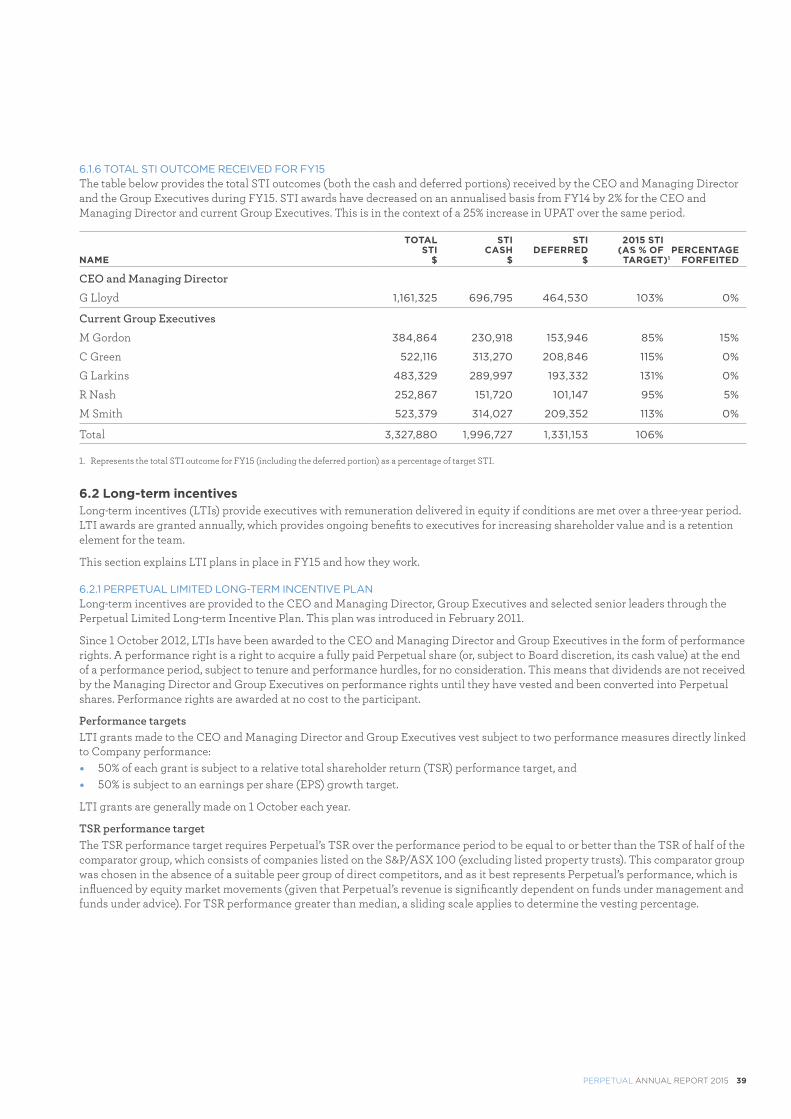
PERPETUAL ANNUAL REPORT 2015 39
6.1.6 TOTAL STI OUTCOME RECEIVED FOR FY15The table below provides the total STI outcomes (both the cash and deferred portions) received by the CEO and Managing Director and the Group Executives during FY15. STI awards have decreased on an annualised basis from FY14 by 2% for the CEO and Managing Director and current Group Executives. This is in the context of a 25% increase in UPAT over the same period.
NAME
TOTAL STI
$
STI CASH
$
STI DEFERRED
$
2015 STI(AS % OF TARGET)1
PERCENTAGE FORFEITED
CEO and Managing Director
G Lloyd 1,161,325 696,795 464,530 103% 0%
Current Group Executives
M Gordon 384,864 230,918 153,946 85% 15%
C Green 522,116 313,270 208,846 115% 0%
G Larkins 483,329 289,997 193,332 131% 0%
R Nash 252,867 151,720 101,147 95% 5%
M Smith 523,379 314,027 209,352 113% 0%
Total 3,327,880 1,996,727 1,331,153 106%
1. Represents the total STI outcome for FY15 (including the deferred portion) as a percentage of target STI.
6.2 Long-term incentivesLong-term incentives (LTIs) provide executives with remuneration delivered in equity if conditions are met over a three-year period. LTI awards are granted annually, which provides ongoing benefits to executives for increasing shareholder value and is a retention element for the team.
This section explains LTI plans in place in FY15 and how they work.
6.2.1 PERPETUAL LIMITED LONG-TERM INCENTIVE PLANLong-term incentives are provided to the CEO and Managing Director, Group Executives and selected senior leaders through the Perpetual Limited Long-term Incentive Plan. This plan was introduced in February 2011.
Since 1 October 2012, LTIs have been awarded to the CEO and Managing Director and Group Executives in the form of performance rights. A performance right is a right to acquire a fully paid Perpetual share (or, subject to Board discretion, its cash value) at the end of a performance period, subject to tenure and performance hurdles, for no consideration. This means that dividends are not received by the Managing Director and Group Executives on performance rights until they have vested and been converted into Perpetual shares. Performance rights are awarded at no cost to the participant.
Performance targetsLTI grants made to the CEO and Managing Director and Group Executives vest subject to two performance measures directly linked to Company performance: � 50% of each grant is subject to a relative total shareholder return (TSR) performance target, and � 50% is subject to an earnings per share (EPS) growth target.
LTI grants are generally made on 1 October each year.
TSR performance targetThe TSR performance target requires Perpetual’s TSR over the performance period to be equal to or better than the TSR of half of the comparator group, which consists of companies listed on the S&P/ASX 100 (excluding listed property trusts). This comparator group was chosen in the absence of a suitable peer group of direct competitors, and as it best represents Perpetual’s performance, which is influenced by equity market movements (given that Perpetual’s revenue is significantly dependent on funds under management and funds under advice). For TSR performance greater than median, a sliding scale applies to determine the vesting percentage.
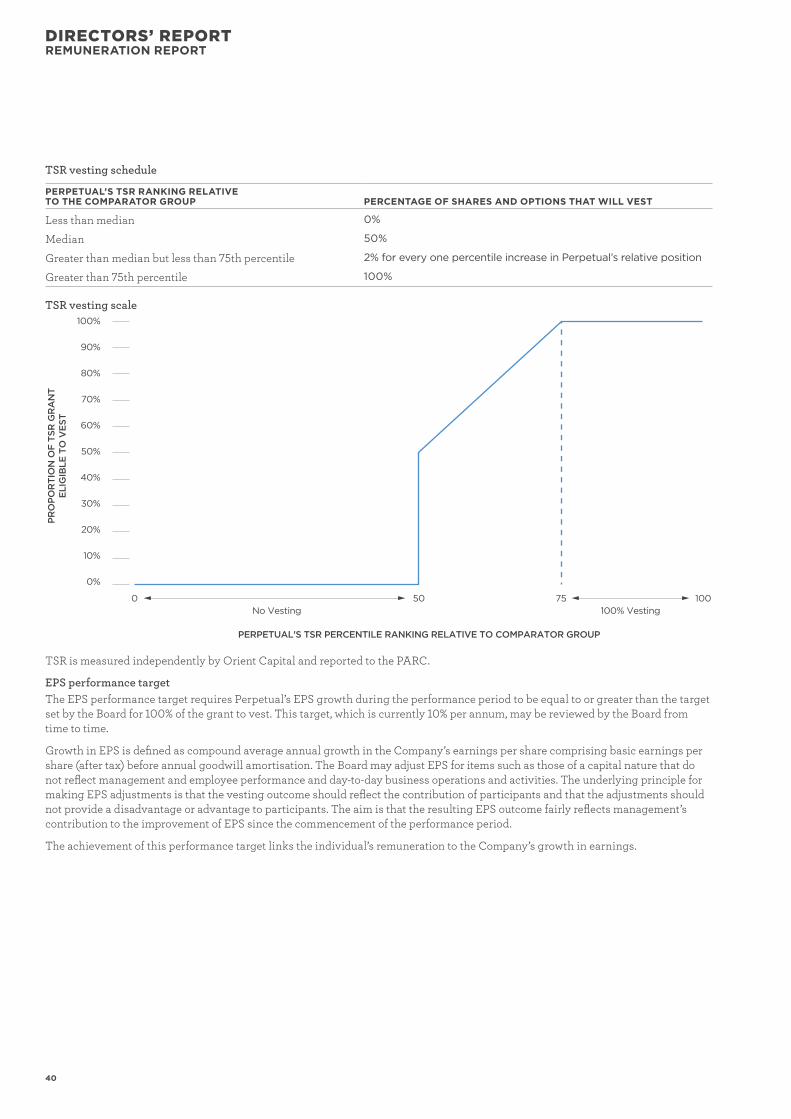
40
DIRECTORS’ REPORTREMUNERATION REPORT
TSR vesting schedule
PERPETUAL’S TSR RANKING RELATIVE TO THE COMPARATOR GROUP PERCENTAGE OF SHARES AND OPTIONS THAT WILL VEST
Less than median 0%
Median 50%
Greater than median but less than 75th percentile 2% for every one percentile increase in Perpetual’s relative position
Greater than 75th percentile 100%
TSR vesting scale
No Vesting 100% Vesting
PRO
POR
TIO
N O
F TS
R G
RA
NT
ELIG
IBLE
TO
VES
T
PERPETUAL'S TSR PERCENTILE RANKING RELATIVE TO COMPARATOR GROUP
0%
10%
20%
30%
40%
50%
60%
70%
80%
90%
100%
0 10050 75
TSR is measured independently by Orient Capital and reported to the PARC.
EPS performance targetThe EPS performance target requires Perpetual’s EPS growth during the performance period to be equal to or greater than the target set by the Board for 100% of the grant to vest. This target, which is currently 10% per annum, may be reviewed by the Board from time to time.
Growth in EPS is defined as compound average annual growth in the Company’s earnings per share comprising basic earnings per share (after tax) before annual goodwill amortisation. The Board may adjust EPS for items such as those of a capital nature that do not reflect management and employee performance and day-to-day business operations and activities. The underlying principle for making EPS adjustments is that the vesting outcome should reflect the contribution of participants and that the adjustments should not provide a disadvantage or advantage to participants. The aim is that the resulting EPS outcome fairly reflects management’s contribution to the improvement of EPS since the commencement of the performance period.
The achievement of this performance target links the individual’s remuneration to the Company’s growth in earnings.
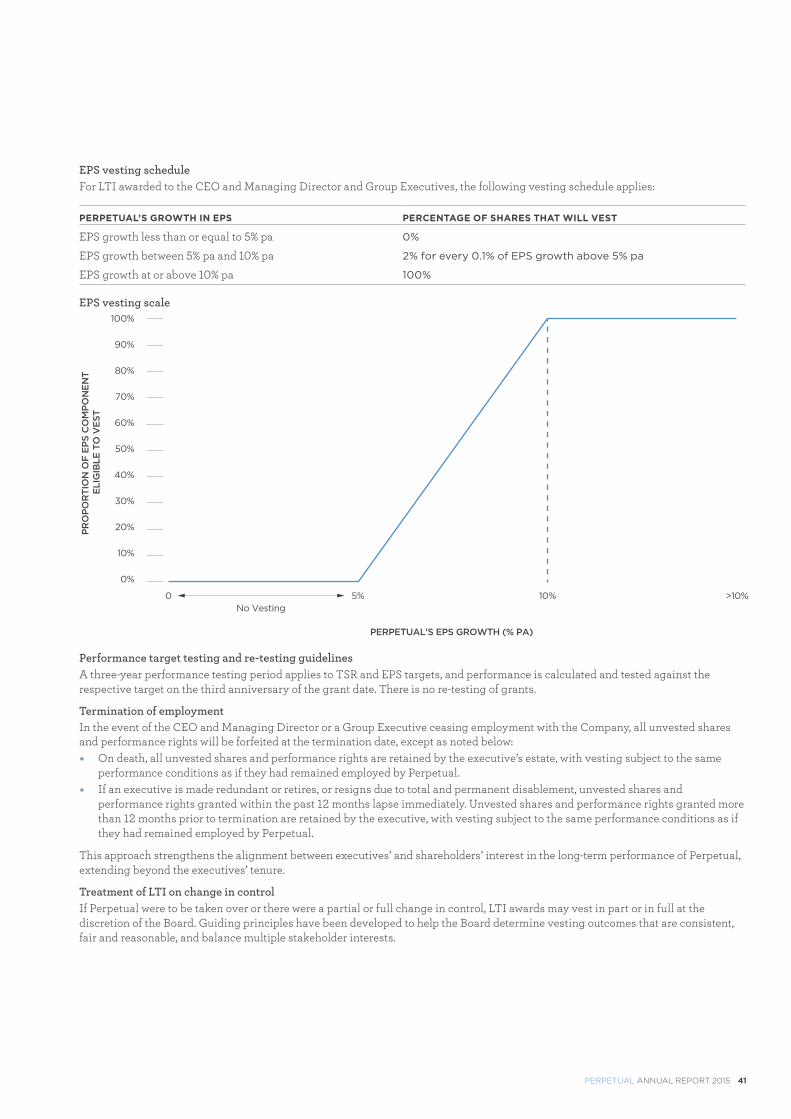
PERPETUAL ANNUAL REPORT 2015 41
EPS vesting scheduleFor LTI awarded to the CEO and Managing Director and Group Executives, the following vesting schedule applies:
PERPETUAL’S GROWTH IN EPS PERCENTAGE OF SHARES THAT WILL VEST
EPS growth less than or equal to 5% pa 0%
EPS growth between 5% pa and 10% pa 2% for every 0.1% of EPS growth above 5% pa
EPS growth at or above 10% pa 100%
EPS vesting scale
No Vesting
PRO
POR
TIO
N O
F EP
S C
OM
PON
ENT
ELIG
IBLE
TO
VES
T
PERPETUAL'S EPS GROWTH (% PA)
0%
10%
20%
30%
40%
50%
60%
70%
80%
90%
100%
0 >10%5% 10%
Performance target testing and re-testing guidelinesA three-year performance testing period applies to TSR and EPS targets, and performance is calculated and tested against the respective target on the third anniversary of the grant date. There is no re-testing of grants.
Termination of employmentIn the event of the CEO and Managing Director or a Group Executive ceasing employment with the Company, all unvested shares and performance rights will be forfeited at the termination date, except as noted below: � On death, all unvested shares and performance rights are retained by the executive’s estate, with vesting subject to the same
performance conditions as if they had remained employed by Perpetual. � If an executive is made redundant or retires, or resigns due to total and permanent disablement, unvested shares and
performance rights granted within the past 12 months lapse immediately. Unvested shares and performance rights granted more than 12 months prior to termination are retained by the executive, with vesting subject to the same performance conditions as if they had remained employed by Perpetual.
This approach strengthens the alignment between executives’ and shareholders’ interest in the long-term performance of Perpetual, extending beyond the executives’ tenure.
Treatment of LTI on change in controlIf Perpetual were to be taken over or there were a partial or full change in control, LTI awards may vest in part or in full at the discretion of the Board. Guiding principles have been developed to help the Board determine vesting outcomes that are consistent, fair and reasonable, and balance multiple stakeholder interests.
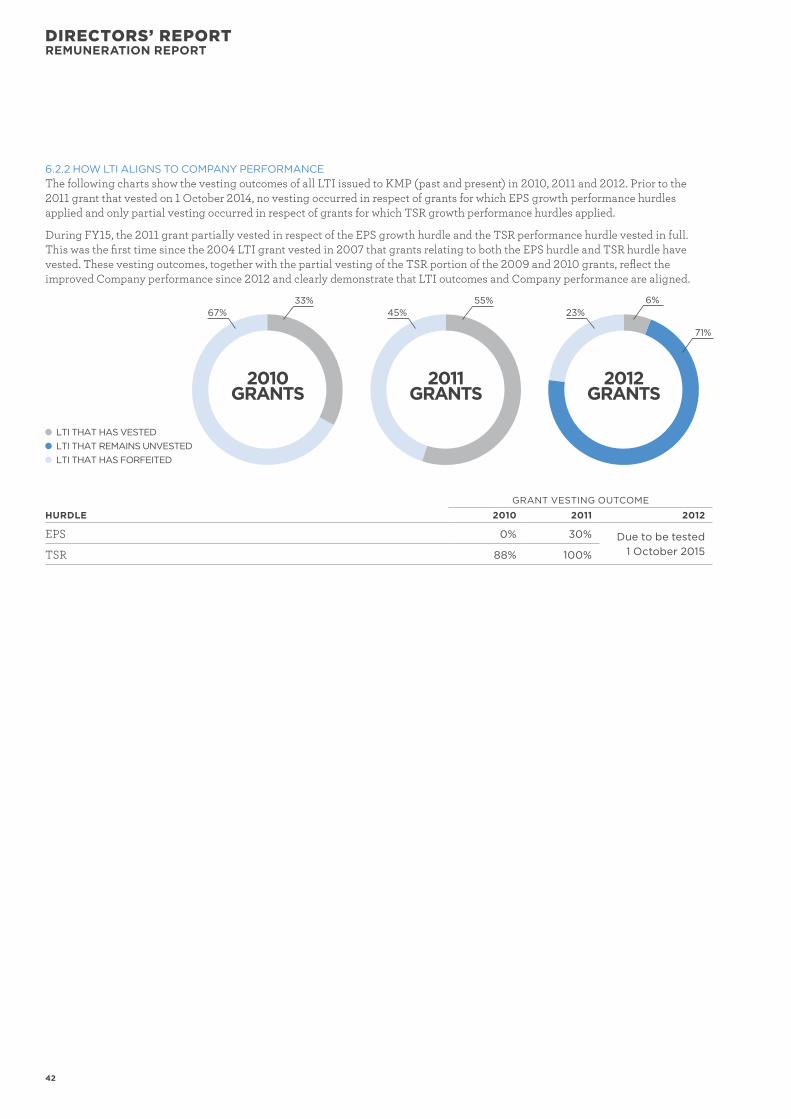
42
DIRECTORS’ REPORTREMUNERATION REPORT
6.2.2 HOW LTI ALIGNS TO COMPANY PERFORMANCEThe following charts show the vesting outcomes of all LTI issued to KMP (past and present) in 2010, 2011 and 2012. Prior to the 2011 grant that vested on 1 October 2014, no vesting occurred in respect of grants for which EPS growth performance hurdles applied and only partial vesting occurred in respect of grants for which TSR growth performance hurdles applied.
During FY15, the 2011 grant partially vested in respect of the EPS growth hurdle and the TSR performance hurdle vested in full. This was the first time since the 2004 LTI grant vested in 2007 that grants relating to both the EPS hurdle and TSR hurdle have vested. These vesting outcomes, together with the partial vesting of the TSR portion of the 2009 and 2010 grants, reflect the improved Company performance since 2012 and clearly demonstrate that LTI outcomes and Company performance are aligned.
2010GRANTS
2011GRANTS
2012GRANTS
45% 23%55%
67%33% 6%
71%
LTI THAT HAS VESTEDLTI THAT REMAINS UNVESTEDLTI THAT HAS FORFEITED
HURDLEGRANT VESTING OUTCOME
2010 2011 2012
EPS 0% 30% Due to be tested 1 October 2015TSR 88% 100%
PERPETUAL ANNUAL REPORT 2015 43
6.2.3 EMPLOYEE SHARE PLANSPerpetual offers all employees (including KMP) the opportunity to participate in share plans. These are described below.
OPEN PLANS DESCRIPTION
Perpetual Limited Long-term Incentive Plan
211 members
From February 2011, this is the primary plan to be used for LTI grants to eligible employees, including the CEO and Managing Director and Group Executives.
Deferred Share Plan (DSP)
2 members
This plan is used for a small number of employees within the asset management team, as part of their incentive arrangements. No KMP participate in this plan.
Shares held in the plan vest subject to achievement of investment performance and succession targets.
The plan ensures that the interests of these key employees are aligned with those of shareholders and clients over the longer term and provides a strong retention element, as employees who cease employment with Perpetual during the vesting period forfeit any unvested shares.
Tax Exempt Share Plan (TESP)
32 members
This plan allows all employees, including the CEO and Managing Director and Group Executives, to purchase shares using a salary-sacrifice arrangement.
Employees may elect to sacrifice up to $1,000 of their cash STI payment into shares under the TESP. Shares acquired via this sacrifice are not subject to performance targets as they are acquired in lieu of a cash payment by the Company; however, the plan’s trading restrictions continue to apply until the earlier of three years from the date of grant or on termination of employment, before the shares can be released.
Tax Deferred Share Plan (TDSP)
26 members
This plan is used for awards made under the annual sales incentive plans for eligible employees within the Perpetual Private and Corporate Trust teams.
The plan was previously used by employees, including the CEO and Managing Director and Group Executives, to buy shares using a salary-sacrifice arrangement. The plan was closed to any new salary-sacrifice purchases during FY10.
One Perpetual Share Plan (OPSP)
0 members. First grant may be made in early FY16
This plan, introduced in FY15, awards eligible employees with annual grants of up to $1,000 worth of Perpetual shares. The grant will be made in August/September each year subject to the Company meeting its profit target.
The first grant will be made in early FY16 subject to the Company’s FY15 profit performance.
PLANS CLOSED TO NEW ISSUE DESCRIPTION
Executive Share Plan (ESP)
3 members
Until February 2011, this was the main plan used for LTI share grants to eligible employees, including the CEO and Managing Director and Group Executives.
Employee Share Purchase Plan (ESPP)
0 members. Remaining members exited from the plan during FY15
This plan was used for granting shares under a non-recourse loan arrangement. It has been closed to new issues since FY04.
The ESPP is discussed in section 5–6 of the financial statements.
Non-executive Director Share Plan (NEDSP)
2 members
This plan was used only by Non-executive Directors and was closed to new purchases on 1 July 2009, following changes to taxation rules.
Dilution limits for share plansShares awarded under Perpetual’s employee share plans may be purchased on market or issued subject to Board discretion and the requirements of the Corporations Act 2001 and the ASX Listing Rules.
As at 30 June 2015, the proportion of unvested shares and performance rights (excluding unallocated shares as a result of forfeitures) held in Perpetual’s employee share plans as a percentage of issued shares was 2.1%. This has reduced from 4.1% as at 30 June 2014.
The Board will manage the issue of shares under employee incentive plans to balance remuneration needs of employees with shareholder returns, subject to the relevant regulatory requirements. Refer to page 35 for detail on the share dealing approval process.
Going forward, Perpetual will continue to purchase shares on market, which will reduce the dilutionary impact of the employee share plans on shareholders.
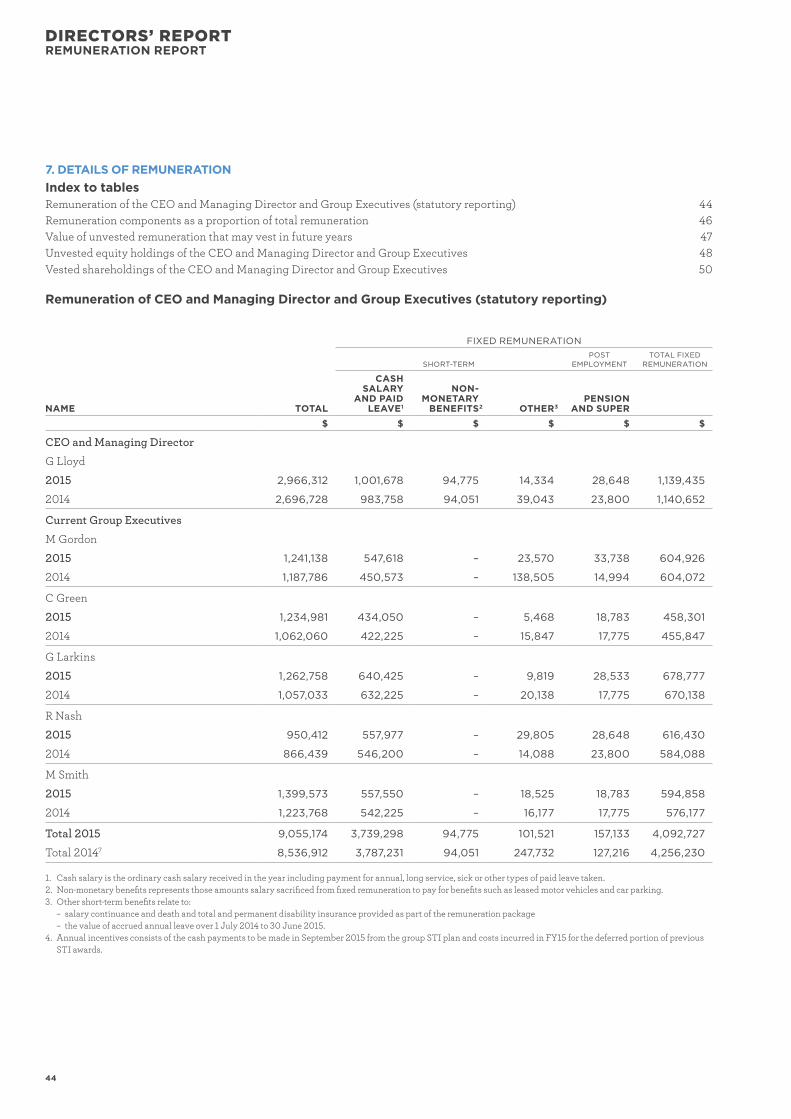
44
DIRECTORS’ REPORTREMUNERATION REPORT
7. DETAILS OF REMUNERATIONIndex to tablesRemuneration of the CEO and Managing Director and Group Executives (statutory reporting) 44Remuneration components as a proportion of total remuneration 46Value of unvested remuneration that may vest in future years 47Unvested equity holdings of the CEO and Managing Director and Group Executives 48Vested shareholdings of the CEO and Managing Director and Group Executives 50
Remuneration of CEO and Managing Director and Group Executives (statutory reporting)
NAME TOTAL
FIXED REMUNERATION STI4
FIXED REMUNERATION
AND STI LTI5
OTHER LONG-TERM BENEFITS6
PAYMENTS MADE ON
TERMINATION
SHORT-TERMPOST
EMPLOYMENTTOTAL FIXED
REMUNERATION EQUITY-BASED TOTAL LTI
CASH SALARY
AND PAID LEAVE1
NON-MONETARY BENEFITS 2 OTHER 3
PENSION AND SUPER
CASH SHORT-TERM INCENTIVES
DEFERRED SHORT-TERM
INCENTIVE SHARESPERFORMANCE
RIGHTS
$ $ $ $ $ $ $ $ $ $ $ $ $ $
CEO and Managing Director
G Lloyd
2015 2,966,312 1,001,678 94,775 14,334 28,648 1,139,435 696,795 395,303 2,231,533 60,499 661,086 721,585 13,194 –
2014 2,696,728 983,758 94,051 39,043 23,800 1,140,652 788,040 240,460 2,169,152 195,098 324,464 519,562 8,014 –
Current Group Executives
M Gordon
2015 1,241,138 547,618 – 23,570 33,738 604,926 230,918 142,993 978,837 121,606 138,485 260,091 2,210 –
2014 1,187,786 450,573 – 138,505 14,994 604,072 300,504 91,678 996,254 144,316 46,344 190,660 872 –
C Green
2015 1,234,981 434,050 – 5,468 18,783 458,301 313,270 160,020 931,591 29,128 259,454 288,582 14,808 –
2014 1,062,060 422,225 – 15,847 17,775 455,847 290,400 90,405 836,652 93,933 119,829 213,762 11,646 –
G Larkins
2015 1,262,758 640,425 – 9,819 28,533 678,777 289,997 148,677 1,117,451 – 142,441 142,441 2,866 –
2014 1,057,033 632,225 – 20,138 17,775 670,138 237,600 84,233 991,971 – 63,732 63,732 1,330 –
R Nash
2015 950,412 557,977 – 29,805 28,648 616,430 151,720 99,534 867,684 – 80,136 80,136 2,592 –
2014 866,439 546,200 – 14,088 23,800 584,088 177,178 65,818 827,084 – 38,132 38,132 1,223 –
M Smith
2015 1,399,573 557,550 – 18,525 18,783 594,858 314,027 154,427 1,063,312 37,499 296,371 333,870 2,391 –
2014 1,223,768 542,225 – 16,177 17,775 576,177 236,880 84,643 897,700 137,496 187,476 324,972 1,096 –
Total 2015 9,055,174 3,739,298 94,775 101,521 157,133 4,092,727 1,996,727 1,100,954 7,190,408 248,732 1,577,973 1,826,705 38,061 –
Total 20147 8,536,912 3,787,231 94,051 247,732 127,216 4,256,230 2,113,205 673,538 7,042,973 676,905 790,197 1,467,102 26,837 –
1. Cash salary is the ordinary cash salary received in the year including payment for annual, long service, sick or other types of paid leave taken.2. Non-monetary benefits represents those amounts salary sacrificed from fixed remuneration to pay for benefits such as leased motor vehicles and car parking.3. Other short-term benefits relate to: – salary continuance and death and total and permanent disability insurance provided as part of the remuneration package – the value of accrued annual leave over 1 July 2014 to 30 June 2015. 4. Annual incentives consists of the cash payments to be made in September 2015 from the group STI plan and costs incurred in FY15 for the deferred portion of previous
STI awards.
5. Share-based remuneration has been valued using the binomial method, which takes into account the performance hurdles relevant to each issue of equity instruments. The value of each equity instrument has been provided by PricewaterhouseCoopers. Share-based remuneration is the amount expensed in the financial statements for the year and includes adjustments to reflect the most current expectation of vesting of LTI grants with non-market condition hurdles. For grants with non-market conditions including earnings per share hurdles, the number of shares expected to vest is estimated at the end of each reporting period, and the amount to be expensed in the financial statements is adjusted accordingly. For grants with market conditions such as TSR hurdles, the number of shares expected to vest is not adjusted during the life of the grant, and no adjustment is made to the amount expensed in the financial statements (except if service conditions are not met). The accounting treatment of non-market and market conditions is in accordance with accounting standards.
6. The expense value of accrued long service leave for FY15. 7. The totals shown relate to executives disclosed in Perpetual’s Remuneration Report 2014 and so do not equal the 2014 totals for executives disclosed in this table.
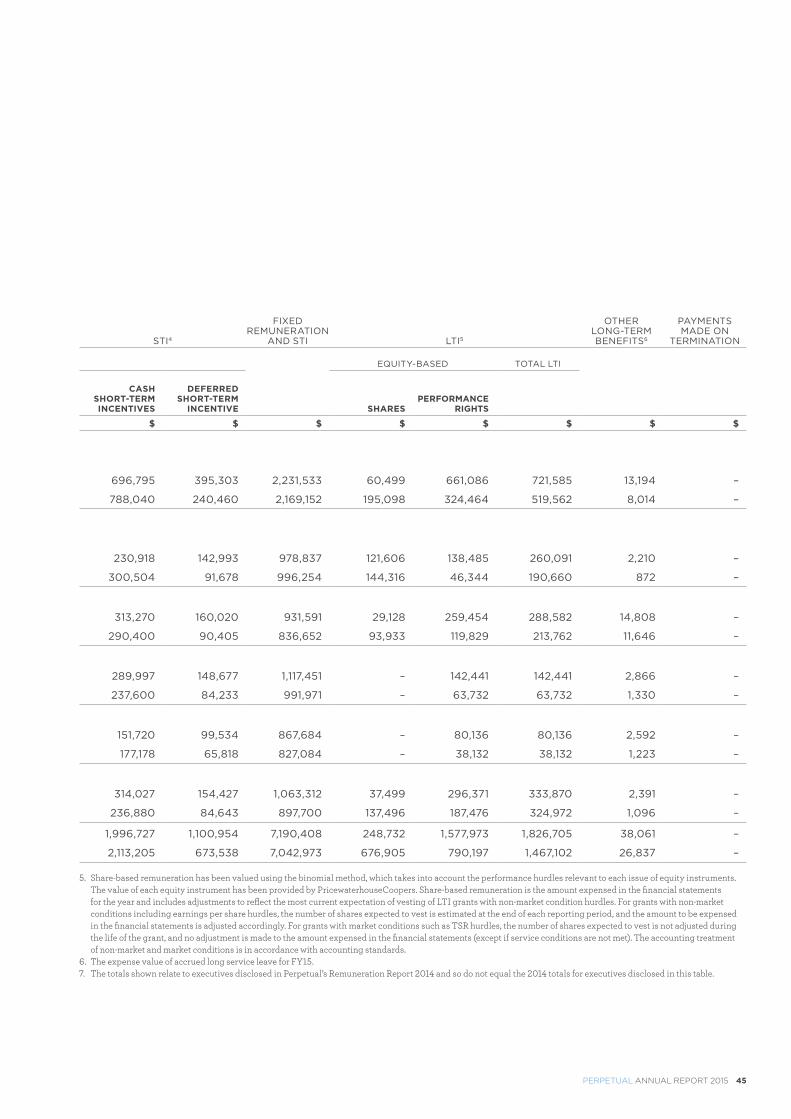
PERPETUAL ANNUAL REPORT 2015 45
7. DETAILS OF REMUNERATIONIndex to tablesRemuneration of the CEO and Managing Director and Group Executives (statutory reporting) 44Remuneration components as a proportion of total remuneration 46Value of unvested remuneration that may vest in future years 47Unvested equity holdings of the CEO and Managing Director and Group Executives 48Vested shareholdings of the CEO and Managing Director and Group Executives 50
Remuneration of CEO and Managing Director and Group Executives (statutory reporting)
NAME TOTAL
FIXED REMUNERATION STI4
FIXED REMUNERATION
AND STI LTI5
OTHER LONG-TERM BENEFITS6
PAYMENTS MADE ON
TERMINATION
SHORT-TERMPOST
EMPLOYMENTTOTAL FIXED
REMUNERATION EQUITY-BASED TOTAL LTI
CASH SALARY
AND PAID LEAVE1
NON-MONETARY BENEFITS 2 OTHER 3
PENSION AND SUPER
CASH SHORT-TERM INCENTIVES
DEFERRED SHORT-TERM
INCENTIVE SHARESPERFORMANCE
RIGHTS
$ $ $ $ $ $ $ $ $ $ $ $ $ $
CEO and Managing Director
G Lloyd
2015 2,966,312 1,001,678 94,775 14,334 28,648 1,139,435 696,795 395,303 2,231,533 60,499 661,086 721,585 13,194 –
2014 2,696,728 983,758 94,051 39,043 23,800 1,140,652 788,040 240,460 2,169,152 195,098 324,464 519,562 8,014 –
Current Group Executives
M Gordon
2015 1,241,138 547,618 – 23,570 33,738 604,926 230,918 142,993 978,837 121,606 138,485 260,091 2,210 –
2014 1,187,786 450,573 – 138,505 14,994 604,072 300,504 91,678 996,254 144,316 46,344 190,660 872 –
C Green
2015 1,234,981 434,050 – 5,468 18,783 458,301 313,270 160,020 931,591 29,128 259,454 288,582 14,808 –
2014 1,062,060 422,225 – 15,847 17,775 455,847 290,400 90,405 836,652 93,933 119,829 213,762 11,646 –
G Larkins
2015 1,262,758 640,425 – 9,819 28,533 678,777 289,997 148,677 1,117,451 – 142,441 142,441 2,866 –
2014 1,057,033 632,225 – 20,138 17,775 670,138 237,600 84,233 991,971 – 63,732 63,732 1,330 –
R Nash
2015 950,412 557,977 – 29,805 28,648 616,430 151,720 99,534 867,684 – 80,136 80,136 2,592 –
2014 866,439 546,200 – 14,088 23,800 584,088 177,178 65,818 827,084 – 38,132 38,132 1,223 –
M Smith
2015 1,399,573 557,550 – 18,525 18,783 594,858 314,027 154,427 1,063,312 37,499 296,371 333,870 2,391 –
2014 1,223,768 542,225 – 16,177 17,775 576,177 236,880 84,643 897,700 137,496 187,476 324,972 1,096 –
Total 2015 9,055,174 3,739,298 94,775 101,521 157,133 4,092,727 1,996,727 1,100,954 7,190,408 248,732 1,577,973 1,826,705 38,061 –
Total 20147 8,536,912 3,787,231 94,051 247,732 127,216 4,256,230 2,113,205 673,538 7,042,973 676,905 790,197 1,467,102 26,837 –
1. Cash salary is the ordinary cash salary received in the year including payment for annual, long service, sick or other types of paid leave taken.2. Non-monetary benefits represents those amounts salary sacrificed from fixed remuneration to pay for benefits such as leased motor vehicles and car parking.3. Other short-term benefits relate to: – salary continuance and death and total and permanent disability insurance provided as part of the remuneration package – the value of accrued annual leave over 1 July 2014 to 30 June 2015. 4. Annual incentives consists of the cash payments to be made in September 2015 from the group STI plan and costs incurred in FY15 for the deferred portion of previous
STI awards.
5. Share-based remuneration has been valued using the binomial method, which takes into account the performance hurdles relevant to each issue of equity instruments. The value of each equity instrument has been provided by PricewaterhouseCoopers. Share-based remuneration is the amount expensed in the financial statements for the year and includes adjustments to reflect the most current expectation of vesting of LTI grants with non-market condition hurdles. For grants with non-market conditions including earnings per share hurdles, the number of shares expected to vest is estimated at the end of each reporting period, and the amount to be expensed in the financial statements is adjusted accordingly. For grants with market conditions such as TSR hurdles, the number of shares expected to vest is not adjusted during the life of the grant, and no adjustment is made to the amount expensed in the financial statements (except if service conditions are not met). The accounting treatment of non-market and market conditions is in accordance with accounting standards.
6. The expense value of accrued long service leave for FY15. 7. The totals shown relate to executives disclosed in Perpetual’s Remuneration Report 2014 and so do not equal the 2014 totals for executives disclosed in this table.
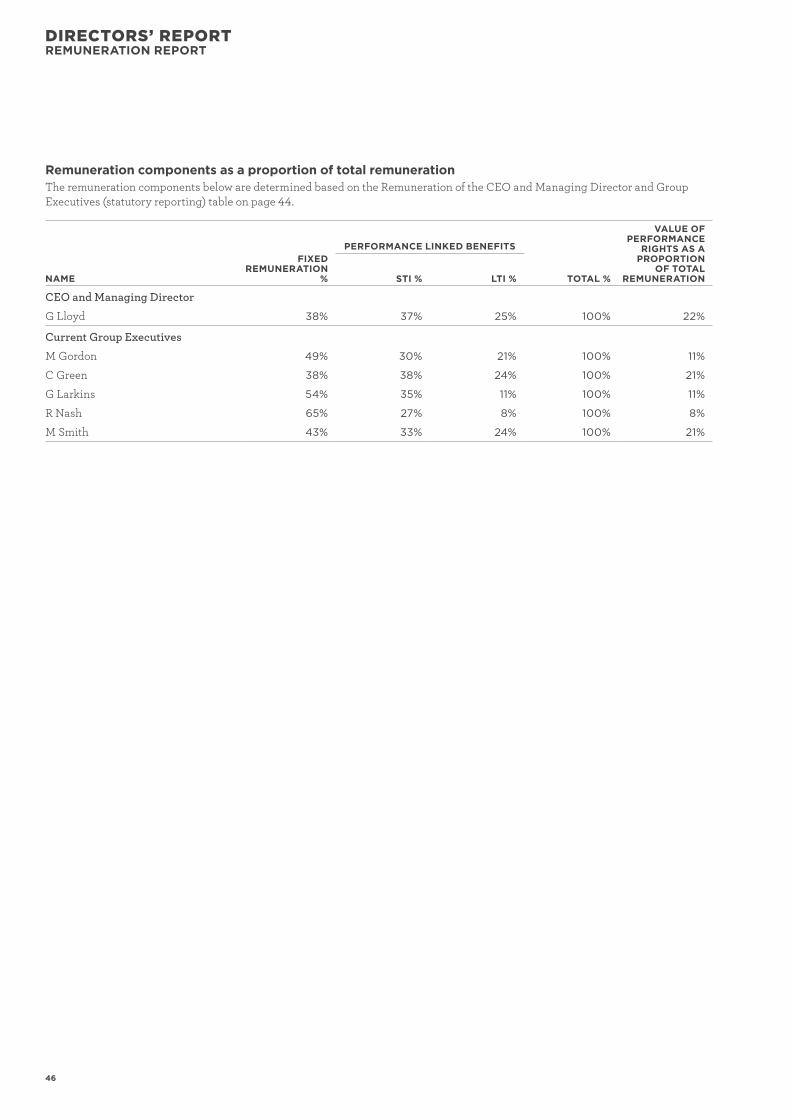
46
DIRECTORS’ REPORTREMUNERATION REPORT
Remuneration components as a proportion of total remunerationThe remuneration components below are determined based on the Remuneration of the CEO and Managing Director and Group Executives (statutory reporting) table on page 44.
NAME
FIXED REMUNERATION
%
PERFORMANCE LINKED BENEFITS
TOTAL %
VALUE OF PERFORMANCE
RIGHTS AS A PROPORTION
OF TOTAL REMUNERATIONSTI % LTI %
CEO and Managing Director
G Lloyd 38% 37% 25% 100% 22%
Current Group Executives
M Gordon 49% 30% 21% 100% 11%
C Green 38% 38% 24% 100% 21%
G Larkins 54% 35% 11% 100% 11%
R Nash 65% 27% 8% 100% 8%
M Smith 43% 33% 24% 100% 21%
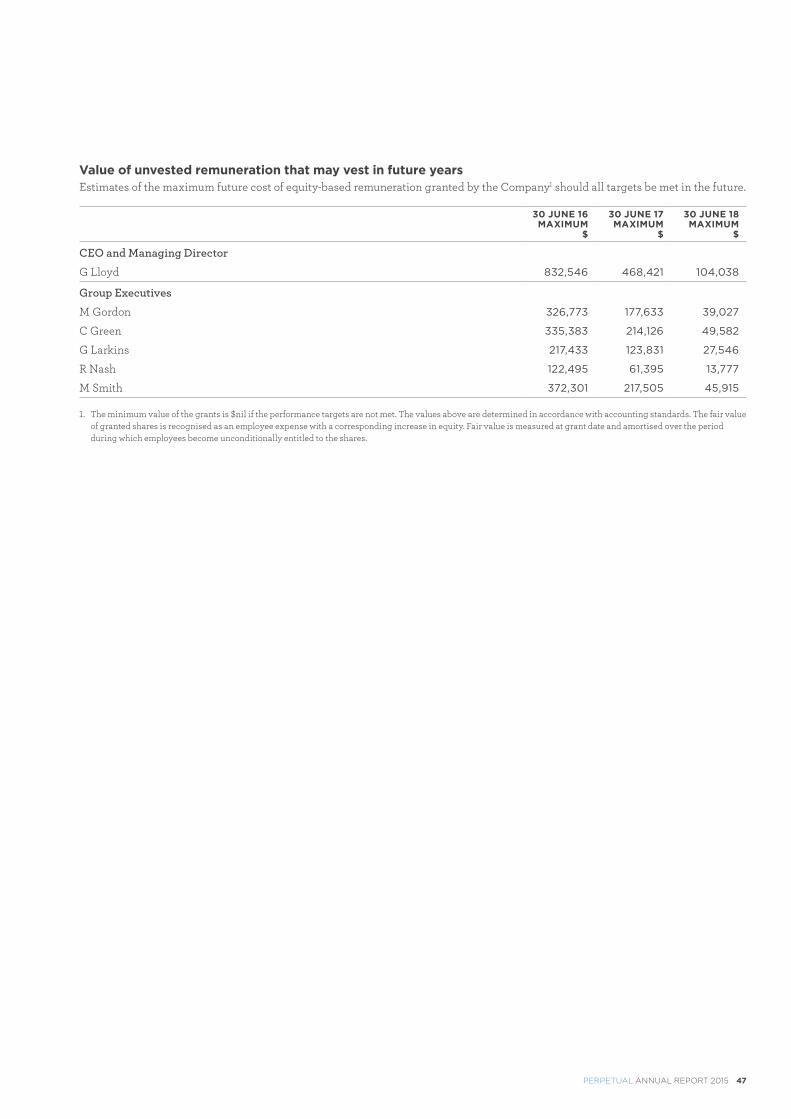
PERPETUAL ANNUAL REPORT 2015 47
Value of unvested remuneration that may vest in future yearsEstimates of the maximum future cost of equity-based remuneration granted by the Company1 should all targets be met in the future.
30 JUNE 16MAXIMUM
$
30 JUNE 17MAXIMUM
$
30 JUNE 18MAXIMUM
$
CEO and Managing Director
G Lloyd 832,546 468,421 104,038
Group Executives
M Gordon 326,773 177,633 39,027
C Green 335,383 214,126 49,582
G Larkins 217,433 123,831 27,546
R Nash 122,495 61,395 13,777
M Smith 372,301 217,505 45,915
1. The minimum value of the grants is $nil if the performance targets are not met. The values above are determined in accordance with accounting standards. The fair value of granted shares is recognised as an employee expense with a corresponding increase in equity. Fair value is measured at grant date and amortised over the period during which employees become unconditionally entitled to the shares.
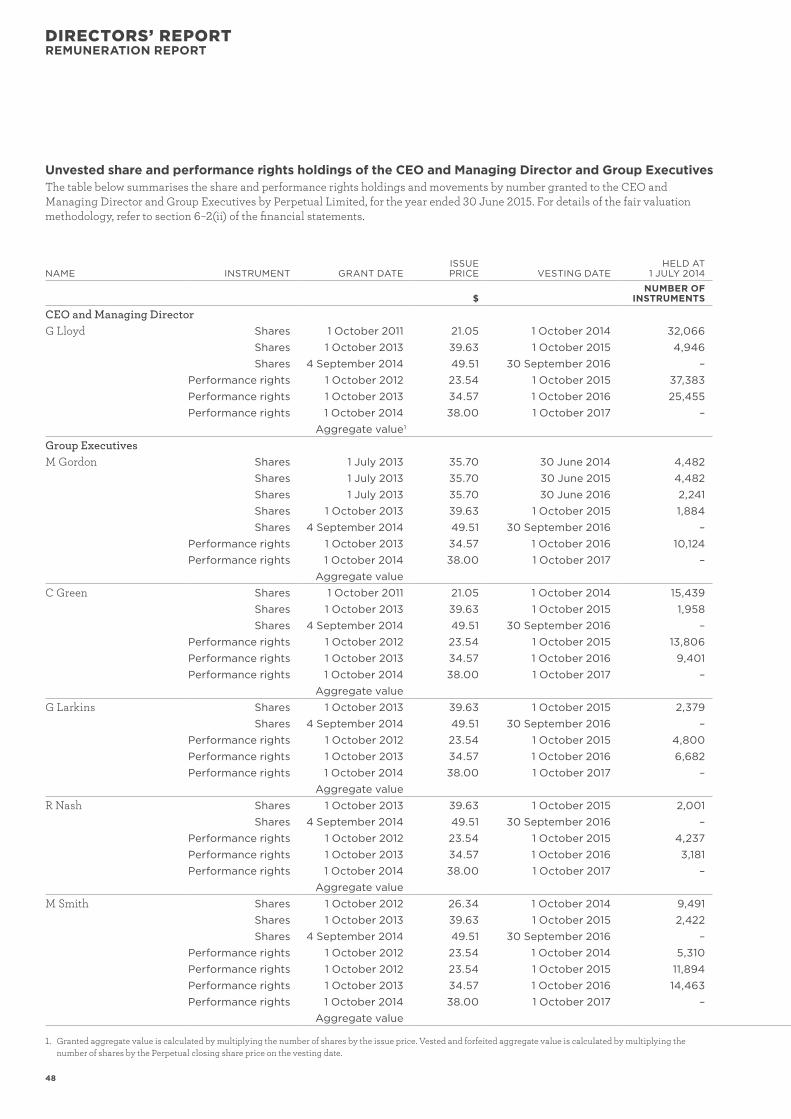
48
DIRECTORS’ REPORTREMUNERATION REPORT
Unvested share and performance rights holdings of the CEO and Managing Director and Group ExecutivesThe table below summarises the share and performance rights holdings and movements by number granted to the CEO and Managing Director and Group Executives by Perpetual Limited, for the year ended 30 June 2015. For details of the fair valuation methodology, refer to section 6–2(ii) of the financial statements.
NAME INSTRUMENT GRANT DATEISSUE PRICE VESTING DATE
HELD AT 1 JULY 2014
MOVEMENT DURING THE YEAR HELD AT
30 JUNE 2015
FAIR VALUE PER INSTRUMENT
AT GRANT TSR HURDLE
FAIR VALUE PER INSTRUMENT
AT GRANT NON-TSR HURDLE GRANTED FORFEITED VESTED
$ NUMBER OF
INSTRUMENTS NUMBER OF INSTRUMENTS NUMBER OF
INSTRUMENTS $ $
CEO and Managing DirectorG Lloyd Shares 1 October 2011 21.05 1 October 2014 32,066 – 11,223 20,843 – 14.60 21.05
Shares 1 October 2013 39.63 1 October 2015 4,946 – – – 4,946 N/A 39.63Shares 4 September 2014 49.51 30 September 2016 – 10,611 – – 10,611 N/A 49.51
Performance rights 1 October 2012 23.54 1 October 2015 37,383 – – – 37,383 14.38 23.54Performance rights 1 October 2013 34.57 1 October 2016 25,455 – – – 25,455 22.65 34.57Performance rights 1 October 2014 38.00 1 October 2017 – 29,815 – – 29,815 21.82 38.00
Aggregate value 1 $1,658,321 $492,016 $913,757 Group ExecutivesM Gordon Shares 1 July 2013 35.70 30 June 2014 4,482 – – 4,482 – N/A 35.70
Shares 1 July 2013 35.70 30 June 2015 4,482 – – – 4,482 N/A 35.70Shares 1 July 2013 35.70 30 June 2016 2,241 – – – 2,241 N/A 35.70Shares 1 October 2013 39.63 1 October 2015 1,884 – – – 1,884 N/A 39.63Shares 4 September 2014 49.51 30 September 2016 – 4,046 – – 4,046 N/A 49.51
Performance rights 1 October 2013 34.57 1 October 2016 10,124 – – – 10,124 22.65 34.57Performance rights 1 October 2014 38.00 1 October 2017 – 11,184 – – 11,184 21.82 38.00
Aggregate value $625,309 $– $212,357 C Green Shares 1 October 2011 21.05 1 October 2014 15,439 – 5,404 10,035 – 14.60 21.05
Shares 1 October 2013 39.63 1 October 2015 1,958 – – – 1,958 N/A 39.63Shares 4 September 2014 49.51 30 September 2016 – 3,910 – – 3,910 N/A 49.51
Performance rights 1 October 2012 23.54 1 October 2015 13,806 – – – 13,806 14.38 23.54Performance rights 1 October 2013 34.57 1 October 2016 9,401 – – – 9,401 22.65 34.57Performance rights 1 October 2014 38.00 1 October 2017 – 11,184 – – 11,184 21.82 38.00
Aggregate value $618,576 $236,911 $439,934 G Larkins Shares 1 October 2013 39.63 1 October 2015 2,379 – – – 2,379 N/A 39.63
Shares 4 September 2014 49.51 30 September 2016 – 3,199 – – 3,199 N/A 49.51Performance rights 1 October 2012 23.54 1 October 2015 4,800 – – – 4,800 14.38 23.54Performance rights 1 October 2013 34.57 1 October 2016 6,682 – – – 6,682 22.65 34.57Performance rights 1 October 2014 38.00 1 October 2017 – 7,894 – – 7,894 21.82 38.00
Aggregate value $458,354 $– $– R Nash Shares 1 October 2013 39.63 1 October 2015 2,001 – – – 2,001 N/A 39.63
Shares 4 September 2014 49.51 30 September 2016 – 2,385 – – 2,385 N/A 49.51Performance rights 1 October 2012 23.54 1 October 2015 4,237 – – – 4,237 14.38 23.54Performance rights 1 October 2013 34.57 1 October 2016 3,181 – – – 3,181 22.65 34.57Performance rights 1 October 2014 38.00 1 October 2017 – 3,948 – – 3,948 21.82 38.00
Aggregate value $268,105 $– $– M Smith Shares 1 October 2012 26.34 1 October 2014 9,491 – – 9,491 – N/A 26.34
Shares 1 October 2013 39.63 1 October 2015 2,422 – – – 2,422 N/A 39.63Shares 4 September 2014 49.51 30 September 2016 – 3,189 – – 3,189 N/A 49.51
Performance rights 1 October 2012 23.54 1 October 2014 5,310 – – 5,310 – 14.26 23.54Performance rights 1 October 2012 23.54 1 October 2015 11,894 – – – 11,894 14.38 23.54Performance rights 1 October 2013 34.57 1 October 2016 14,463 – – – 14,463 22.65 34.57Performance rights 1 October 2014 38.00 1 October 2017 – 13,158 – – 13,158 21.82 38.00
Aggregate value $657,891 $– $648,876
1. Granted aggregate value is calculated by multiplying the number of shares by the issue price. Vested and forfeited aggregate value is calculated by multiplying the number of shares by the Perpetual closing share price on the vesting date.
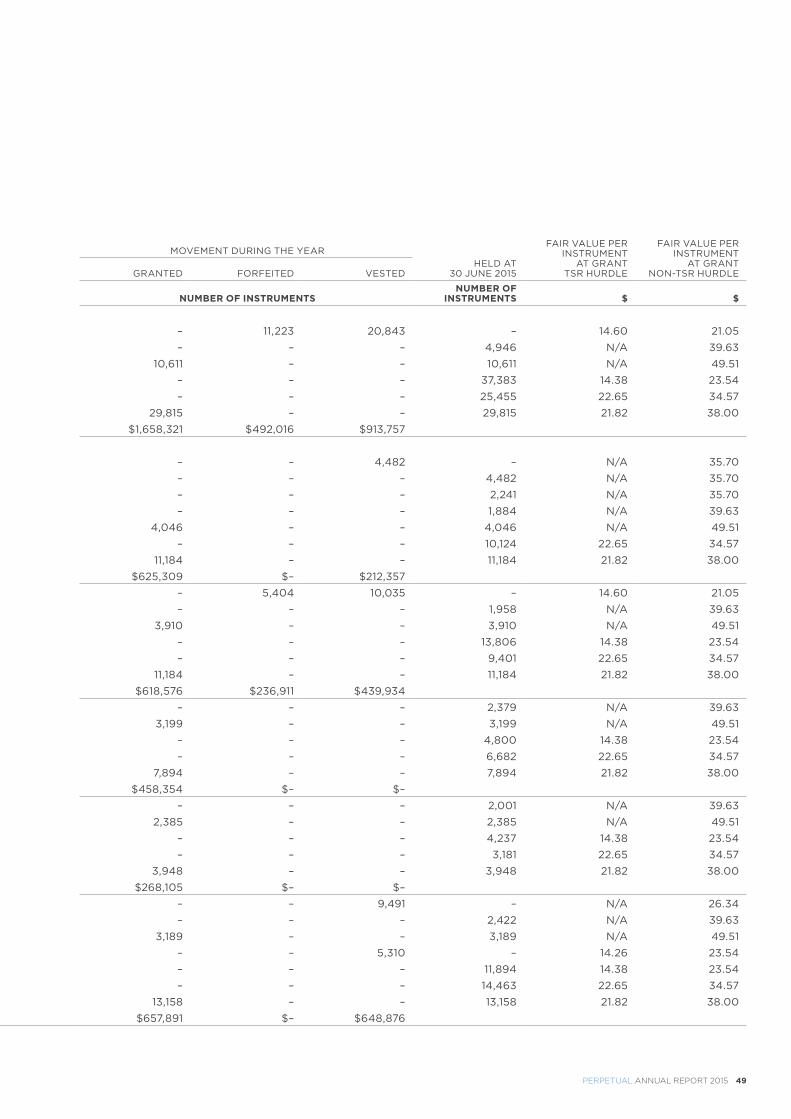
PERPETUAL ANNUAL REPORT 2015 49
Unvested share and performance rights holdings of the CEO and Managing Director and Group ExecutivesThe table below summarises the share and performance rights holdings and movements by number granted to the CEO and Managing Director and Group Executives by Perpetual Limited, for the year ended 30 June 2015. For details of the fair valuation methodology, refer to section 6–2(ii) of the financial statements.
NAME INSTRUMENT GRANT DATEISSUE PRICE VESTING DATE
HELD AT 1 JULY 2014
MOVEMENT DURING THE YEAR HELD AT
30 JUNE 2015
FAIR VALUE PER INSTRUMENT
AT GRANT TSR HURDLE
FAIR VALUE PER INSTRUMENT
AT GRANT NON-TSR HURDLE GRANTED FORFEITED VESTED
$ NUMBER OF
INSTRUMENTS NUMBER OF INSTRUMENTS NUMBER OF
INSTRUMENTS $ $
CEO and Managing DirectorG Lloyd Shares 1 October 2011 21.05 1 October 2014 32,066 – 11,223 20,843 – 14.60 21.05
Shares 1 October 2013 39.63 1 October 2015 4,946 – – – 4,946 N/A 39.63Shares 4 September 2014 49.51 30 September 2016 – 10,611 – – 10,611 N/A 49.51
Performance rights 1 October 2012 23.54 1 October 2015 37,383 – – – 37,383 14.38 23.54Performance rights 1 October 2013 34.57 1 October 2016 25,455 – – – 25,455 22.65 34.57Performance rights 1 October 2014 38.00 1 October 2017 – 29,815 – – 29,815 21.82 38.00
Aggregate value 1 $1,658,321 $492,016 $913,757 Group ExecutivesM Gordon Shares 1 July 2013 35.70 30 June 2014 4,482 – – 4,482 – N/A 35.70
Shares 1 July 2013 35.70 30 June 2015 4,482 – – – 4,482 N/A 35.70Shares 1 July 2013 35.70 30 June 2016 2,241 – – – 2,241 N/A 35.70Shares 1 October 2013 39.63 1 October 2015 1,884 – – – 1,884 N/A 39.63Shares 4 September 2014 49.51 30 September 2016 – 4,046 – – 4,046 N/A 49.51
Performance rights 1 October 2013 34.57 1 October 2016 10,124 – – – 10,124 22.65 34.57Performance rights 1 October 2014 38.00 1 October 2017 – 11,184 – – 11,184 21.82 38.00
Aggregate value $625,309 $– $212,357 C Green Shares 1 October 2011 21.05 1 October 2014 15,439 – 5,404 10,035 – 14.60 21.05
Shares 1 October 2013 39.63 1 October 2015 1,958 – – – 1,958 N/A 39.63Shares 4 September 2014 49.51 30 September 2016 – 3,910 – – 3,910 N/A 49.51
Performance rights 1 October 2012 23.54 1 October 2015 13,806 – – – 13,806 14.38 23.54Performance rights 1 October 2013 34.57 1 October 2016 9,401 – – – 9,401 22.65 34.57Performance rights 1 October 2014 38.00 1 October 2017 – 11,184 – – 11,184 21.82 38.00
Aggregate value $618,576 $236,911 $439,934 G Larkins Shares 1 October 2013 39.63 1 October 2015 2,379 – – – 2,379 N/A 39.63
Shares 4 September 2014 49.51 30 September 2016 – 3,199 – – 3,199 N/A 49.51Performance rights 1 October 2012 23.54 1 October 2015 4,800 – – – 4,800 14.38 23.54Performance rights 1 October 2013 34.57 1 October 2016 6,682 – – – 6,682 22.65 34.57Performance rights 1 October 2014 38.00 1 October 2017 – 7,894 – – 7,894 21.82 38.00
Aggregate value $458,354 $– $– R Nash Shares 1 October 2013 39.63 1 October 2015 2,001 – – – 2,001 N/A 39.63
Shares 4 September 2014 49.51 30 September 2016 – 2,385 – – 2,385 N/A 49.51Performance rights 1 October 2012 23.54 1 October 2015 4,237 – – – 4,237 14.38 23.54Performance rights 1 October 2013 34.57 1 October 2016 3,181 – – – 3,181 22.65 34.57Performance rights 1 October 2014 38.00 1 October 2017 – 3,948 – – 3,948 21.82 38.00
Aggregate value $268,105 $– $– M Smith Shares 1 October 2012 26.34 1 October 2014 9,491 – – 9,491 – N/A 26.34
Shares 1 October 2013 39.63 1 October 2015 2,422 – – – 2,422 N/A 39.63Shares 4 September 2014 49.51 30 September 2016 – 3,189 – – 3,189 N/A 49.51
Performance rights 1 October 2012 23.54 1 October 2014 5,310 – – 5,310 – 14.26 23.54Performance rights 1 October 2012 23.54 1 October 2015 11,894 – – – 11,894 14.38 23.54Performance rights 1 October 2013 34.57 1 October 2016 14,463 – – – 14,463 22.65 34.57Performance rights 1 October 2014 38.00 1 October 2017 – 13,158 – – 13,158 21.82 38.00
Aggregate value $657,891 $– $648,876
1. Granted aggregate value is calculated by multiplying the number of shares by the issue price. Vested and forfeited aggregate value is calculated by multiplying the number of shares by the Perpetual closing share price on the vesting date.
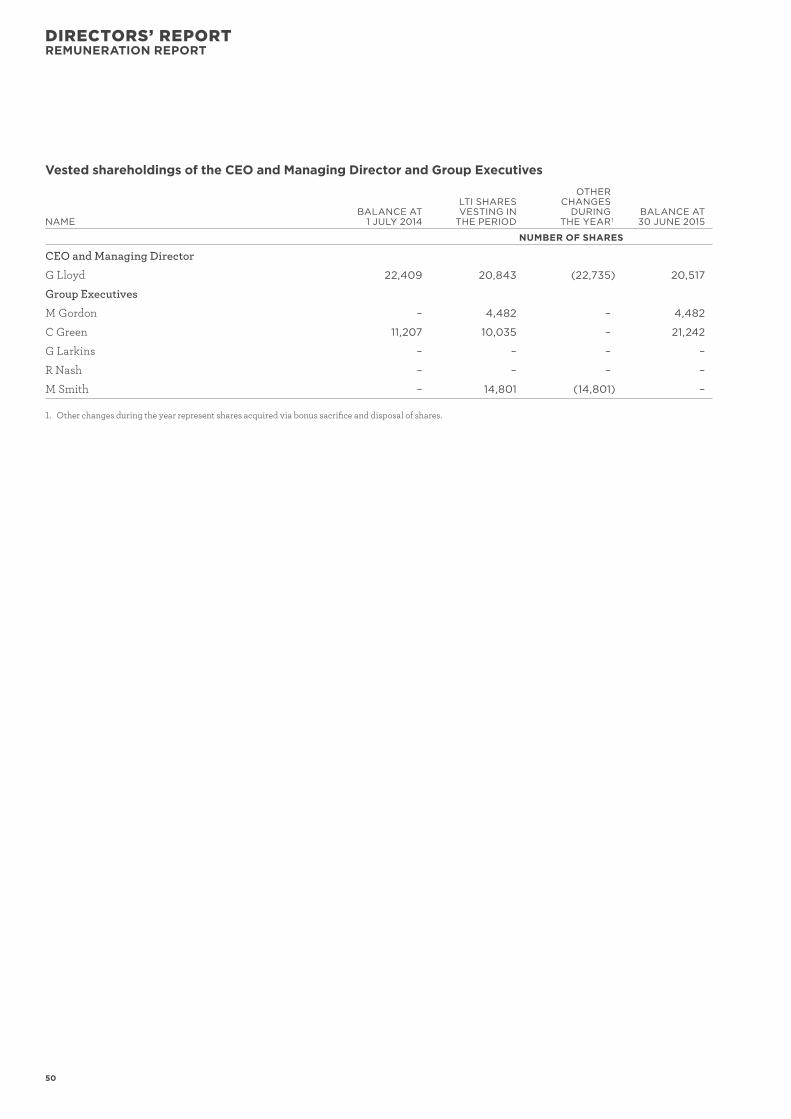
50
DIRECTORS’ REPORTREMUNERATION REPORT
Vested shareholdings of the CEO and Managing Director and Group Executives
NAMEBALANCE AT
1 JULY 2014
LTI SHARES VESTING IN THE PERIOD
OTHER CHANGES
DURING THE YEAR 1
BALANCE AT 30 JUNE 2015
NUMBER OF SHARES
CEO and Managing Director
G Lloyd 22,409 20,843 (22,735) 20,517
Group Executives
M Gordon – 4,482 – 4,482
C Green 11,207 10,035 – 21,242
G Larkins – – – –
R Nash – – – –
M Smith – 14,801 (14,801) –
1. Other changes during the year represent shares acquired via bonus sacrifice and disposal of shares.
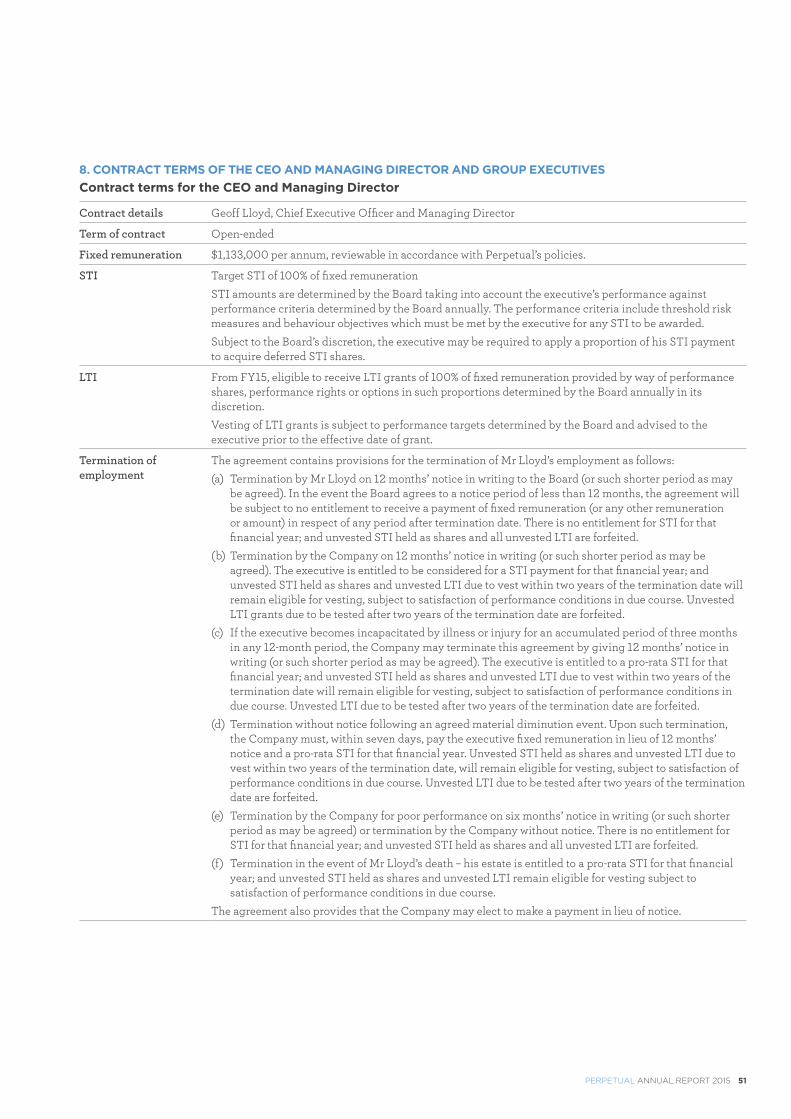
PERPETUAL ANNUAL REPORT 2015 51
8. CONTRACT TERMS OF THE CEO AND MANAGING DIRECTOR AND GROUP EXECUTIVESContract terms for the CEO and Managing Director
Contract details Geoff Lloyd, Chief Executive Officer and Managing Director
Term of contract Open-ended
Fixed remuneration $1,133,000 per annum, reviewable in accordance with Perpetual’s policies.
STI Target STI of 100% of fixed remuneration
STI amounts are determined by the Board taking into account the executive’s performance against performance criteria determined by the Board annually. The performance criteria include threshold risk measures and behaviour objectives which must be met by the executive for any STI to be awarded.
Subject to the Board’s discretion, the executive may be required to apply a proportion of his STI payment to acquire deferred STI shares.
LTI From FY15, eligible to receive LTI grants of 100% of fixed remuneration provided by way of performance shares, performance rights or options in such proportions determined by the Board annually in its discretion.
Vesting of LTI grants is subject to performance targets determined by the Board and advised to the executive prior to the effective date of grant.
Termination of employment
The agreement contains provisions for the termination of Mr Lloyd’s employment as follows:
(a) Termination by Mr Lloyd on 12 months’ notice in writing to the Board (or such shorter period as may be agreed). In the event the Board agrees to a notice period of less than 12 months, the agreement will be subject to no entitlement to receive a payment of fixed remuneration (or any other remuneration or amount) in respect of any period after termination date. There is no entitlement for STI for that financial year; and unvested STI held as shares and all unvested LTI are forfeited.
(b) Termination by the Company on 12 months’ notice in writing (or such shorter period as may be agreed). The executive is entitled to be considered for a STI payment for that financial year; and unvested STI held as shares and unvested LTI due to vest within two years of the termination date will remain eligible for vesting, subject to satisfaction of performance conditions in due course. Unvested LTI grants due to be tested after two years of the termination date are forfeited.
(c) If the executive becomes incapacitated by illness or injury for an accumulated period of three months in any 12-month period, the Company may terminate this agreement by giving 12 months’ notice in writing (or such shorter period as may be agreed). The executive is entitled to a pro-rata STI for that financial year; and unvested STI held as shares and unvested LTI due to vest within two years of the termination date will remain eligible for vesting, subject to satisfaction of performance conditions in due course. Unvested LTI due to be tested after two years of the termination date are forfeited.
(d) Termination without notice following an agreed material diminution event. Upon such termination, the Company must, within seven days, pay the executive fixed remuneration in lieu of 12 months’ notice and a pro-rata STI for that financial year. Unvested STI held as shares and unvested LTI due to vest within two years of the termination date, will remain eligible for vesting, subject to satisfaction of performance conditions in due course. Unvested LTI due to be tested after two years of the termination date are forfeited.
(e) Termination by the Company for poor performance on six months’ notice in writing (or such shorter period as may be agreed) or termination by the Company without notice. There is no entitlement for STI for that financial year; and unvested STI held as shares and all unvested LTI are forfeited.
(f) Termination in the event of Mr Lloyd’s death – his estate is entitled to a pro-rata STI for that financial year; and unvested STI held as shares and unvested LTI remain eligible for vesting subject to satisfaction of performance conditions in due course.
The agreement also provides that the Company may elect to make a payment in lieu of notice.
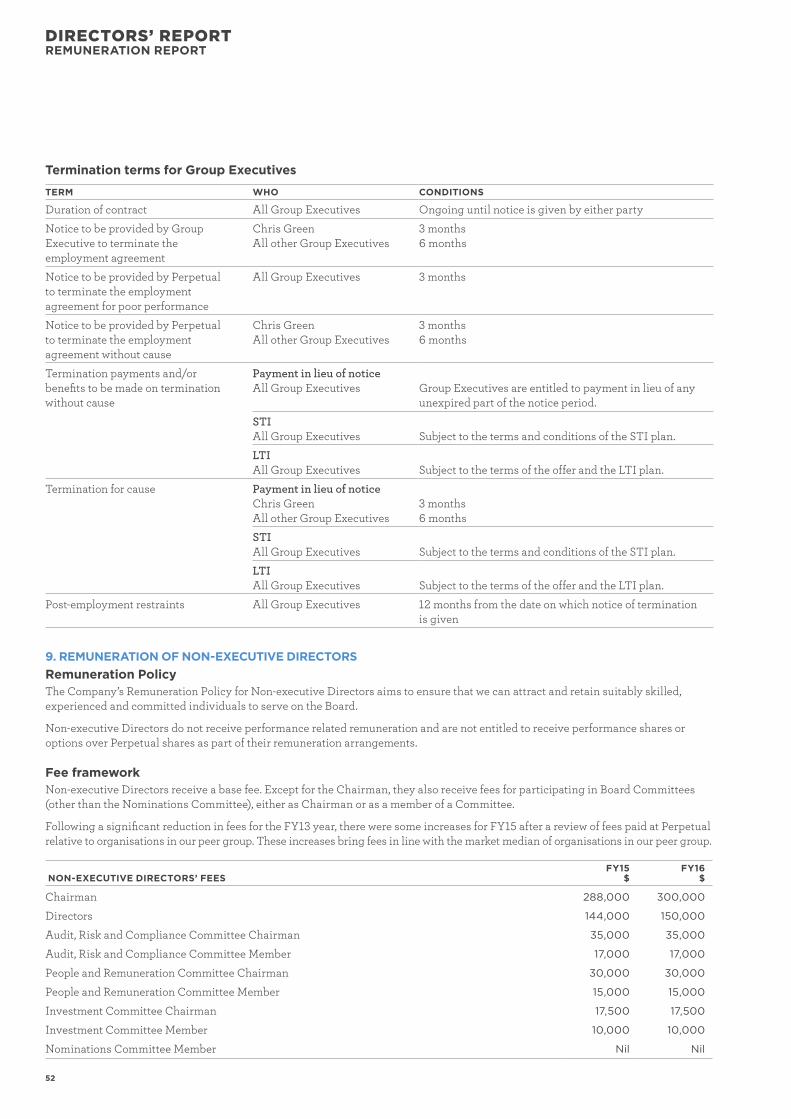
52
DIRECTORS’ REPORTREMUNERATION REPORT
Termination terms for Group Executives
TERM WHO CONDITIONS
Duration of contract All Group Executives Ongoing until notice is given by either party
Notice to be provided by Group Executive to terminate the employment agreement
Chris GreenAll other Group Executives
3 months6 months
Notice to be provided by Perpetual to terminate the employment agreement for poor performance
All Group Executives 3 months
Notice to be provided by Perpetual to terminate the employment agreement without cause
Chris GreenAll other Group Executives
3 months6 months
Termination payments and/or benefits to be made on termination without cause
Payment in lieu of noticeAll Group Executives Group Executives are entitled to payment in lieu of any
unexpired part of the notice period.
STI All Group Executives Subject to the terms and conditions of the STI plan.
LTIAll Group Executives Subject to the terms of the offer and the LTI plan.
Termination for cause Payment in lieu of noticeChris GreenAll other Group Executives
3 months6 months
STI All Group Executives Subject to the terms and conditions of the STI plan.
LTIAll Group Executives Subject to the terms of the offer and the LTI plan.
Post-employment restraints All Group Executives 12 months from the date on which notice of termination is given
9. REMUNERATION OF NON-EXECUTIVE DIRECTORSRemuneration PolicyThe Company’s Remuneration Policy for Non-executive Directors aims to ensure that we can attract and retain suitably skilled, experienced and committed individuals to serve on the Board.
Non-executive Directors do not receive performance related remuneration and are not entitled to receive performance shares or options over Perpetual shares as part of their remuneration arrangements.
Fee frameworkNon-executive Directors receive a base fee. Except for the Chairman, they also receive fees for participating in Board Committees (other than the Nominations Committee), either as Chairman or as a member of a Committee.
Following a significant reduction in fees for the FY13 year, there were some increases for FY15 after a review of fees paid at Perpetual relative to organisations in our peer group. These increases bring fees in line with the market median of organisations in our peer group.
NON-EXECUTIVE DIRECTORS’ FEES FY15
$FY16
$
Chairman 288,000 300,000
Directors 144,000 150,000
Audit, Risk and Compliance Committee Chairman 35,000 35,000
Audit, Risk and Compliance Committee Member 17,000 17,000
People and Remuneration Committee Chairman 30,000 30,000
People and Remuneration Committee Member 15,000 15,000
Investment Committee Chairman 17,500 17,500
Investment Committee Member 10,000 10,000
Nominations Committee Member Nil Nil
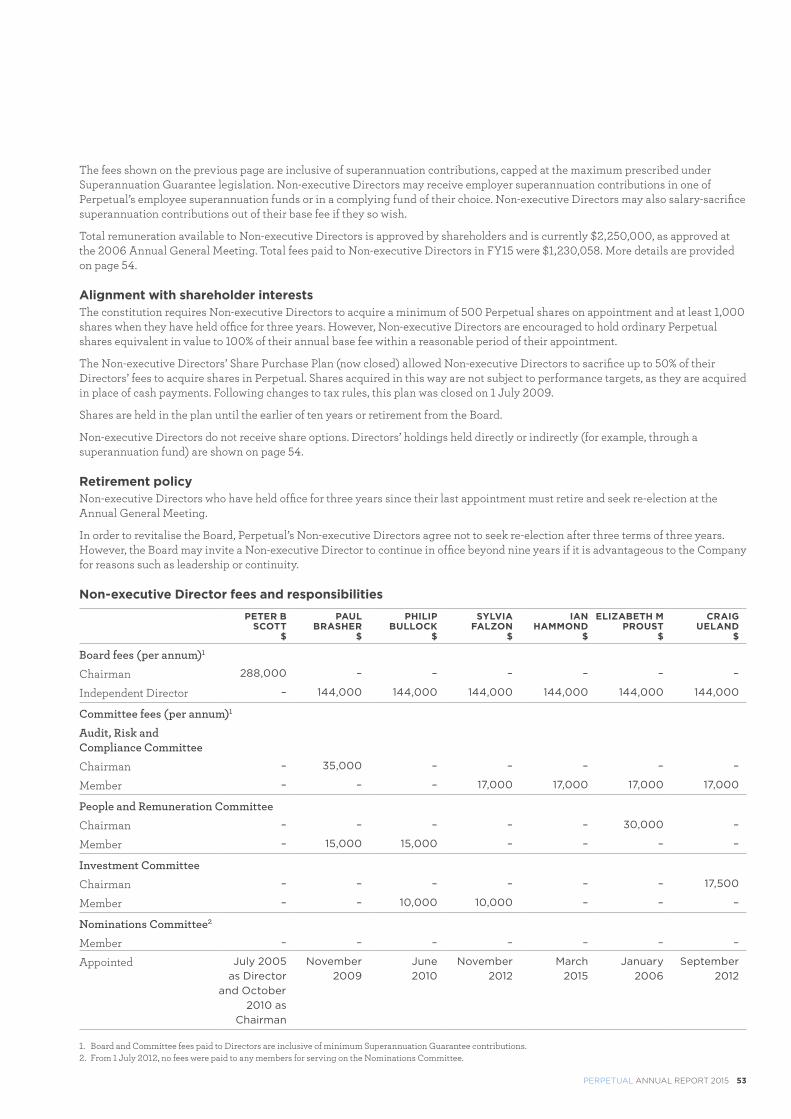
PERPETUAL ANNUAL REPORT 2015 53
The fees shown on the previous page are inclusive of superannuation contributions, capped at the maximum prescribed under Superannuation Guarantee legislation. Non-executive Directors may receive employer superannuation contributions in one of Perpetual’s employee superannuation funds or in a complying fund of their choice. Non-executive Directors may also salary-sacrifice superannuation contributions out of their base fee if they so wish.
Total remuneration available to Non-executive Directors is approved by shareholders and is currently $2,250,000, as approved at the 2006 Annual General Meeting. Total fees paid to Non-executive Directors in FY15 were $1,230,058. More details are provided on page 54.
Alignment with shareholder interestsThe constitution requires Non-executive Directors to acquire a minimum of 500 Perpetual shares on appointment and at least 1,000 shares when they have held office for three years. However, Non-executive Directors are encouraged to hold ordinary Perpetual shares equivalent in value to 100% of their annual base fee within a reasonable period of their appointment.
The Non-executive Directors’ Share Purchase Plan (now closed) allowed Non-executive Directors to sacrifice up to 50% of their Directors’ fees to acquire shares in Perpetual. Shares acquired in this way are not subject to performance targets, as they are acquired in place of cash payments. Following changes to tax rules, this plan was closed on 1 July 2009.
Shares are held in the plan until the earlier of ten years or retirement from the Board.
Non-executive Directors do not receive share options. Directors’ holdings held directly or indirectly (for example, through a superannuation fund) are shown on page 54.
Retirement policyNon-executive Directors who have held office for three years since their last appointment must retire and seek re-election at the Annual General Meeting.
In order to revitalise the Board, Perpetual’s Non-executive Directors agree not to seek re-election after three terms of three years. However, the Board may invite a Non-executive Director to continue in office beyond nine years if it is advantageous to the Company for reasons such as leadership or continuity.
Non-executive Director fees and responsibilities
PETER B SCOTT
$
PAUL BRASHER
$
PHILIP BULLOCK
$
SYLVIA FALZON
$
IAN HAMMOND
$
ELIZABETH M PROUST
$
CRAIG UELAND
$
Board fees (per annum)1
Chairman 288,000 – – – – – –
Independent Director – 144,000 144,000 144,000 144,000 144,000 144,000
Committee fees (per annum)1
Audit, Risk and Compliance Committee
Chairman – 35,000 – – – – –
Member – – – 17,000 17,000 17,000 17,000
People and Remuneration Committee
Chairman – – – – – 30,000 –
Member – 15,000 15,000 – – – –
Investment Committee
Chairman – – – – – – 17,500
Member – – 10,000 10,000 – – –
Nominations Committee2
Member – – – – – – –
Appointed July 2005 as Director
and October 2010 as
Chairman
November 2009
June 2010
November 2012
March 2015
January 2006
September 2012
1. Board and Committee fees paid to Directors are inclusive of minimum Superannuation Guarantee contributions. 2. From 1 July 2012, no fees were paid to any members for serving on the Nominations Committee.
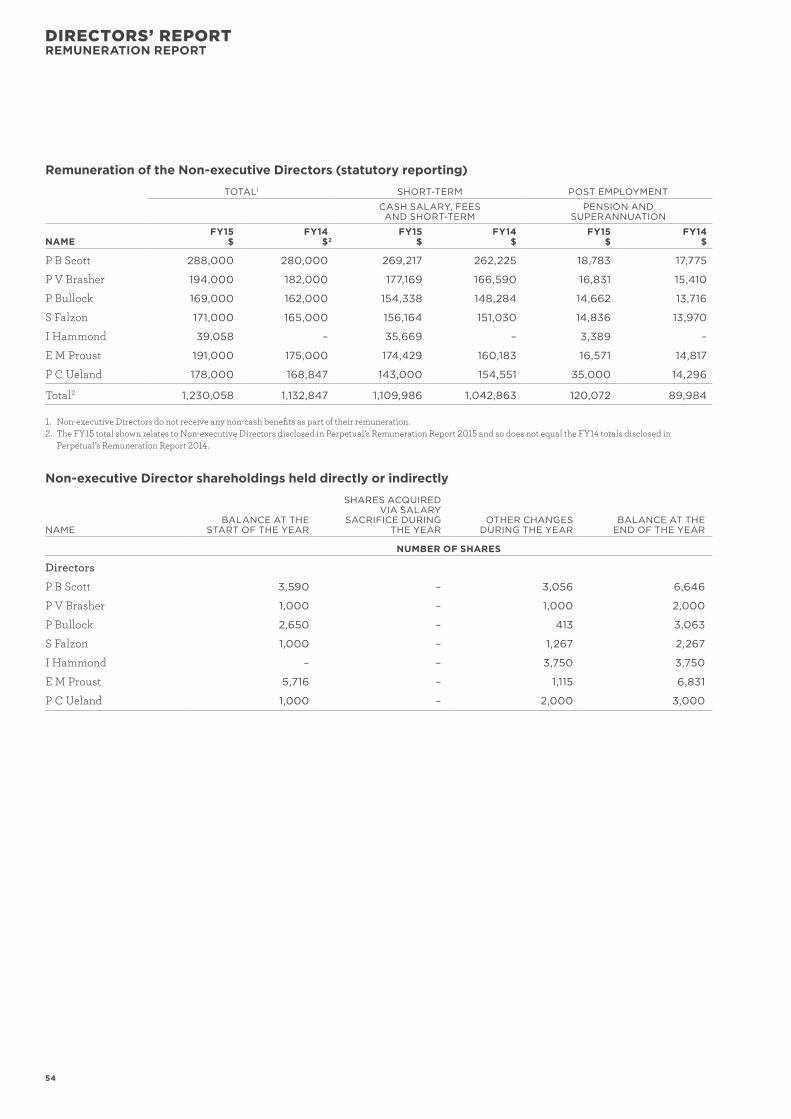
54
DIRECTORS’ REPORTREMUNERATION REPORT
Remuneration of the Non-executive Directors (statutory reporting)TOTAL1 SHORT-TERM POST EMPLOYMENT
CASH SALARY, FEES AND SHORT-TERM
PENSION AND SUPERANNUATION
NAMEFY15
$FY14
$ 2FY15
$FY14
$FY15
$FY14
$
P B Scott 288,000 280,000 269,217 262,225 18,783 17,775
P V Brasher 194,000 182,000 177,169 166,590 16,831 15,410
P Bullock 169,000 162,000 154,338 148,284 14,662 13,716
S Falzon 171,000 165,000 156,164 151,030 14,836 13,970
I Hammond 39,058 – 35,669 – 3,389 –
E M Proust 191,000 175,000 174,429 160,183 16,571 14,817
P C Ueland 178,000 168,847 143,000 154,551 35,000 14,296
Total2 1,230,058 1,132,847 1,109,986 1,042,863 120,072 89,984
1. Non-executive Directors do not receive any non-cash benefits as part of their remuneration.2. The FY15 total shown relates to Non-executive Directors disclosed in Perpetual’s Remuneration Report 2015 and so does not equal the FY14 totals disclosed in
Perpetual’s Remuneration Report 2014.
Non-executive Director shareholdings held directly or indirectly
NAMEBALANCE AT THE
START OF THE YEAR
SHARES ACQUIRED VIA SALARY
SACRIFICE DURING THE YEAR
OTHER CHANGES DURING THE YEAR
BALANCE AT THE END OF THE YEAR
NUMBER OF SHARES
Directors
P B Scott 3,590 – 3,056 6,646
P V Brasher 1,000 – 1,000 2,000
P Bullock 2,650 – 413 3,063
S Falzon 1,000 – 1,267 2,267
I Hammond – – 3,750 3,750
E M Proust 5,716 – 1,115 6,831
P C Ueland 1,000 – 2,000 3,000
PERPETUAL ANNUAL REPORT 2015 55
CHIEF EXECUTIVE OFFICER’S AND CHIEF FINANCIAL OFFICER’S DECLARATIONThe CEO and Managing Director and the Chief Financial Officer declared in writing to the Board, in accordance with section 295A of the Corporations Act 2001, that the financial records of the Company for the financial year have been properly maintained, and that the Company’s financial reports for the year ended 30 June 2015 comply with accounting standards and present a true and fair view of the Company’s financial condition and operational results. This statement is required annually.
NON-AUDIT SERVICES PROVIDED BY THE EXTERNAL AUDITORFees for non-audit services paid to KPMG in the current year were $52,500 (2014: $30,000).
The Board has a review process in relation to any non-audit services provided by the external auditor. The Board considered the non-audit services provided by the auditor and is satisfied that the provision of these non-audit services by the auditor is compatible with, and does not compromise, the auditor independence requirements of the Corporations Act 2001 for the following reasons: � all non-audit services are subject to the corporate governance procedures adopted by the Company and are reviewed by the
Audit, Risk and Compliance Committee to ensure that they do not impact the integrity and objectivity of the auditor, and � non-audit services provided do not undermine the general principles relating to auditor independence as set out in
APES 110 Code of Ethics for Professional Accountants, as they do not involve reviewing or auditing the auditor’s own work, acting in a management or decision-making capacity for the Company, acting as an advocate for the Company or jointly sharing risks and rewards.
The Lead Auditor’s independence declaration for the 30 June 2015 financial year is included at the end of this report.
ROUNDING OFFThe Company is of a kind referred to in ASIC Class Order 98/100 dated 10 July 1998 and, in accordance with that Order, amounts in the financial report and the Directors’ Report have been rounded off to the nearest thousand dollars, unless otherwise stated.
This report is made in accordance with a resolution of the Directors:
PETER SCOTT GEOFF LLOYDChairman Chief Executive Officer and Managing Director
Sydney 27 August 2015
56
ABCD
KPMG, an Australian partnership and a member firm of the KPMG network of independent member firms affiliated with KPMG International Cooperative (“KPMG International”), a Swiss entity.
Liability limited by a scheme approved under Professional Standards Legislation.
Lead Auditor’s Independence Declaration under Section 307C of the Corporations Act 2001
To: the Directors of Perpetual Limited
I declare that, to the best of my knowledge and belief, in relation to the audit for the financial year ended 30 June 2015 there have been:
(i) no contraventions of the auditor independence requirements as set out in theCorporations Act 2001 in relation to the audit; and
(ii) no contraventions of any applicable code of professional conduct in relation to theaudit.
KPMG
Martin McGrathPartner
Sydney
27 August 2015
42
LEAD AUDITOR’S INDEPENDENCE DECLARATION UNDER SECTION 307C OF THE CORPORATIONS ACT 2001
PERPETUAL ANNUAL REPORT 2015 57
OPERATING AND FINANCIAL REVIEW
DISCLAIMERThe following information should be read in conjunction with the Group’s audited consolidated financial statements and associated notes for the 12 months ended 30 June 2015 and should also be read in conjunction with the audited financial statements and notes thereto contained in the Annual Report for the financial year ended 30 June 2015 (FY15). The Group’s audited consolidated financial statements were subject to independent audit by KPMG.
No representation or warranty is made as to the accuracy, adequacy or reliability of any statements, estimates, opinions or other information contained in this review (any of which may change without notice). To the maximum extent permitted by law, the Perpetual Group, its Directors, officers, employees, agents and contractors and any other person disclaim all liability and responsibility (including without limitation any liability arising from fault or negligence) for any direct or indirect loss or damage which may be suffered through use or reliance on anything contained in or omitted from this review.
This review contains forward looking statements. These forward looking statements should not be relied upon as a representation or warranty, express or implied, as to future matters. Prospective financial information has been based on current expectations about future events but is, however, subject to risks, uncertainties, contingencies and assumptions that could cause actual results to differ materially from the expectations described in such prospective financial information. The Perpetual Group undertakes no obligation to update any forward looking statement to reflect events or circumstances after the date of this review, subject to disclosure requirements applicable to the Group.
OPERATING AND FINANCIAL REVIEW FOR THE 12 MONTHS ENDED 30 JUNE 2015
TABLE OF CONTENTS1 Review of Group 58 1.1 Business model 58 1.2 Strategy 58 1.3 Group financial performance 59 1.4 Shareholder returns and dividends 61 1.5 Segment results summary 62 1.6 Group initiatives 62 1.7 Group financial position 64 1.8 Capital management 66 1.9 Regulatory environment 68 1.10 Business risks 69 1.11 Outlook 70 1.12 Events subsequent to balance date 70
2 Review of businesses 71 2.1 Perpetual Investments 71 2.2 Perpetual Private 74 2.3 Perpetual Corporate Trust 76 2.4 Group Support Services 77
3 Appendices 78 3.1 Appendix A: Segment results 78 3.2 Appendix B: Bridge for FY15 Statutory accounts and OFR 80 3.3 Appendix C: Average funds under management 82 3.4 Appendix D: Full time equivalent employees (FTE’s) 82 3.5 Appendix E: Dividend history 83 3.6 Glossary 84
NOTESNote that in this review: � 1H15 refers to the financial reporting period for the six months ended
31 December 2014 � 2H15 refers to the financial reporting period for the six months ended 30 June 2015 � FY15 refers to the financial reporting period for the 12 months ended 30 June 2015 � with similar abbreviations for previous and subsequent periods.
This is a review of Perpetual’s operations for the 12 months ended 30 June 2015 (FY15). It also includes a review of its financial position as at 30 June 2015.
The following information should be read in conjunction with the Group’s audited consolidated financial statements and associated notes for FY15.
All amounts shown are stated in Australian dollars unless otherwise noted, and are subject to rounding.
Additional information is available on the Group’s website www.perpetual.com.au.
A glossary of frequently used terms and abbreviations can be found at the end of the review.
58
1 1. REVIEW OF GROUP1.1 Business modelPerpetual Limited (Perpetual or the Group) is an Australian independent wealth manager operating in asset management, financial advice and trustee services. In each of these businesses, Perpetual earns the majority of its revenue from fees charged on assets under either management, advice or administration. Revenue is influenced by movement in the underlying asset values, margin on assets and net client flows. The business model provides Perpetual with recurring revenue streams and leverage to movement in asset values. As Perpetual is a provider of high quality financial services, employment costs comprise the largest component of its expenses.
Factors that affect the performance of the business include, amongst others, the performance of the global and Australian economies and financial markets, consumer and investor confidence and government policy.
1.2 StrategyPerpetual’s vision is to be Australia’s largest and most trusted independent wealth manager.
The end of FY15 marked the successful completion of Perpetual’s Transformation 2015 (T15) strategy. Following the simplification and refocusing of the business with the T15 strategy, the Group is on a sound footing and is well placed for identifying and capturing growth opportunities. Perpetual’s Lead & Grow strategy builds on the foundation of the T15 strategy and critical strategic choices that underpinned T15 – three core businesses forming a scalable business model, sharing central services and a strong brand – are retained beyond 2015.
Lead, Extend, ExploreThe Lead & Grow strategy has three key objectives to capture sustainable growth: the primary objective is to ‘Lead’ in each of the Group’s core businesses, to ‘Extend’ into nearby adjacencies and ‘Explore’ new markets and new ventures for the Group over the long term.
Perpetual Investments (PI) will seek to maintain its strong leadership position in Australian equities manufacturing and leverage its capabilities to move into logical, adjacent products and strategies. Two new initiatives have already been launched: a global equities fund and a listed investment company. In addition to these, the growth opportunities for PI are to lead in credit strategies and in the multi-asset strategies; specifically with the Pure Credit Alpha product and the Diversified Real Return Fund.
Perpetual Private (PP) will maintain its strategic objective to lead in high net worth (HNW) advice to its key client segments of ‘business owners’, ‘established wealthy’ and ‘professionals’. PP has developed attractive value propositions for each of its three target client segments, will source new prospects through leading referral channels (including developing critical relationships with medical specialists), transform the client experience to improve client advocacy and deepen client relationships to maximise the opportunity to cross-sell products and services.
The primary opportunity for Perpetual Corporate Trust (PCT) is to harness and reinforce the economics of its market leading businesses. Trust Services will enhance its market leading position in the provision of trust, custody and standby services to debt capital and securitisation markets through the provision of value added services via its Data Services capability. Fund Services will continue to leverage its scale in the market and develop more specific initiatives like providing responsible entity services to managed investment schemes.
OPERATING AND FINANCIAL REVIEW
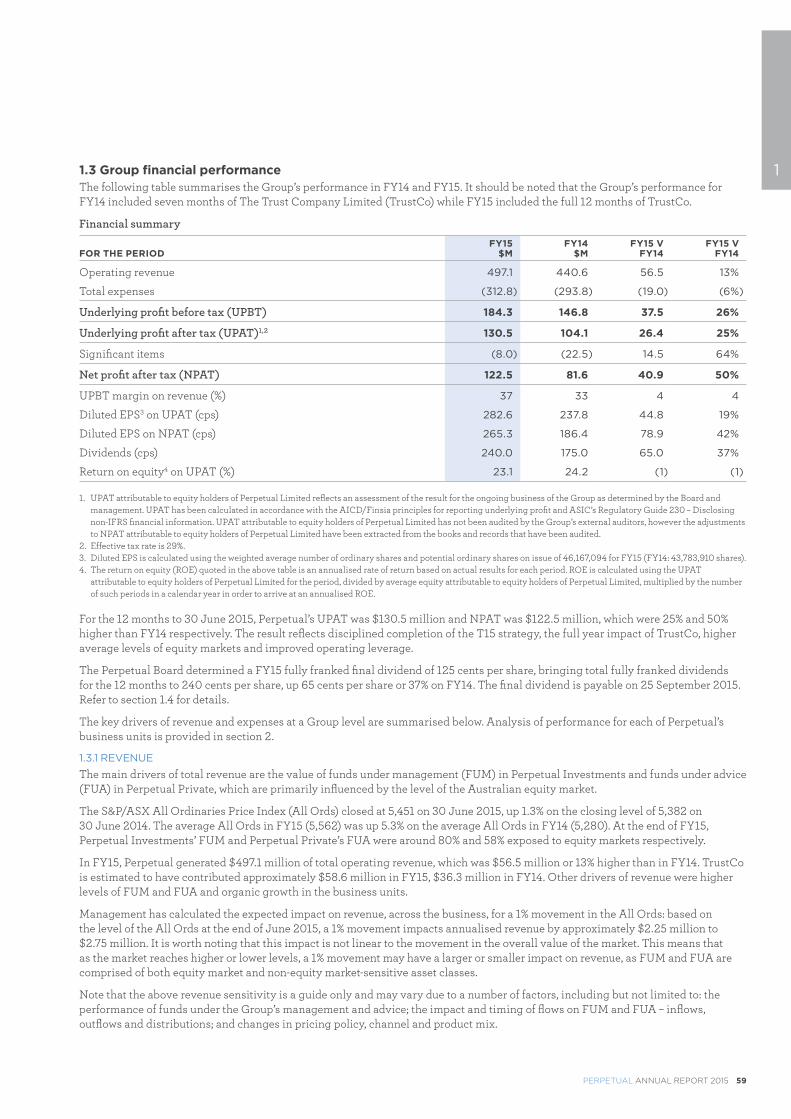
PERPETUAL ANNUAL REPORT 2015 59
11.3 Group financial performanceThe following table summarises the Group’s performance in FY14 and FY15. It should be noted that the Group’s performance for FY14 included seven months of The Trust Company Limited (TrustCo) while FY15 included the full 12 months of TrustCo.
Financial summary
FOR THE PERIODFY15
$MFY14
$MFY15 V
FY14FY15 V
FY14
Operating revenue 497.1 440.6 56.5 13%
Total expenses (312.8) (293.8) (19.0) (6%)
Underlying profit before tax (UPBT) 184.3 146.8 37.5 26%
Underlying profit after tax (UPAT)1,2 130.5 104.1 26.4 25%
Significant items (8.0) (22.5) 14.5 64%
Net profit after tax (NPAT) 122.5 81.6 40.9 50%
UPBT margin on revenue (%) 37 33 4 4
Diluted EPS3 on UPAT (cps) 282.6 237.8 44.8 19%
Diluted EPS on NPAT (cps) 265.3 186.4 78.9 42%
Dividends (cps) 240.0 175.0 65.0 37%
Return on equity4 on UPAT (%) 23.1 24.2 (1) (1)
1. UPAT attributable to equity holders of Perpetual Limited reflects an assessment of the result for the ongoing business of the Group as determined by the Board and management. UPAT has been calculated in accordance with the AICD/Finsia principles for reporting underlying profit and ASIC’s Regulatory Guide 230 – Disclosing non-IFRS financial information. UPAT attributable to equity holders of Perpetual Limited has not been audited by the Group’s external auditors, however the adjustments to NPAT attributable to equity holders of Perpetual Limited have been extracted from the books and records that have been audited.
2. Effective tax rate is 29%.3. Diluted EPS is calculated using the weighted average number of ordinary shares and potential ordinary shares on issue of 46,167,094 for FY15 (FY14: 43,783,910 shares).4. The return on equity (ROE) quoted in the above table is an annualised rate of return based on actual results for each period. ROE is calculated using the UPAT
attributable to equity holders of Perpetual Limited for the period, divided by average equity attributable to equity holders of Perpetual Limited, multiplied by the number of such periods in a calendar year in order to arrive at an annualised ROE.
For the 12 months to 30 June 2015, Perpetual’s UPAT was $130.5 million and NPAT was $122.5 million, which were 25% and 50% higher than FY14 respectively. The result reflects disciplined completion of the T15 strategy, the full year impact of TrustCo, higher average levels of equity markets and improved operating leverage.
The Perpetual Board determined a FY15 fully franked final dividend of 125 cents per share, bringing total fully franked dividends for the 12 months to 240 cents per share, up 65 cents per share or 37% on FY14. The final dividend is payable on 25 September 2015. Refer to section 1.4 for details.
The key drivers of revenue and expenses at a Group level are summarised below. Analysis of performance for each of Perpetual’s business units is provided in section 2.
1.3.1 REVENUE
The main drivers of total revenue are the value of funds under management (FUM) in Perpetual Investments and funds under advice (FUA) in Perpetual Private, which are primarily influenced by the level of the Australian equity market.
The S&P/ASX All Ordinaries Price Index (All Ords) closed at 5,451 on 30 June 2015, up 1.3% on the closing level of 5,382 on 30 June 2014. The average All Ords in FY15 (5,562) was up 5.3% on the average All Ords in FY14 (5,280). At the end of FY15, Perpetual Investments’ FUM and Perpetual Private’s FUA were around 80% and 58% exposed to equity markets respectively.
In FY15, Perpetual generated $497.1 million of total operating revenue, which was $56.5 million or 13% higher than in FY14. TrustCo is estimated to have contributed approximately $58.6 million in FY15, $36.3 million in FY14. Other drivers of revenue were higher levels of FUM and FUA and organic growth in the business units.
Management has calculated the expected impact on revenue, across the business, for a 1% movement in the All Ords: based on the level of the All Ords at the end of June 2015, a 1% movement impacts annualised revenue by approximately $2.25 million to $2.75 million. It is worth noting that this impact is not linear to the movement in the overall value of the market. This means that as the market reaches higher or lower levels, a 1% movement may have a larger or smaller impact on revenue, as FUM and FUA are comprised of both equity market and non-equity market-sensitive asset classes.
Note that the above revenue sensitivity is a guide only and may vary due to a number of factors, including but not limited to: the performance of funds under the Group’s management and advice; the impact and timing of flows on FUM and FUA – inflows, outflows and distributions; and changes in pricing policy, channel and product mix.
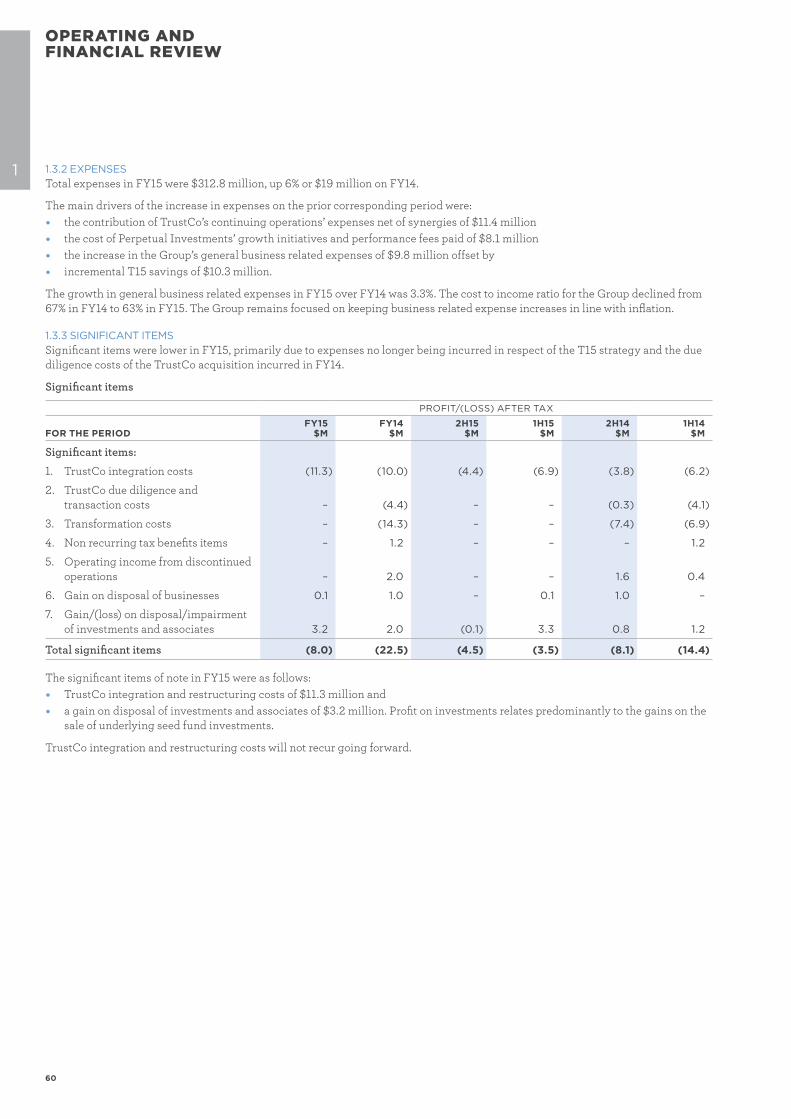
60
OPERATING AND FINANCIAL REVIEW
1 1.3.2 EXPENSESTotal expenses in FY15 were $312.8 million, up 6% or $19 million on FY14.
The main drivers of the increase in expenses on the prior corresponding period were: � the contribution of TrustCo’s continuing operations’ expenses net of synergies of $11.4 million � the cost of Perpetual Investments’ growth initiatives and performance fees paid of $8.1 million � the increase in the Group’s general business related expenses of $9.8 million offset by � incremental T15 savings of $10.3 million.
The growth in general business related expenses in FY15 over FY14 was 3.3%. The cost to income ratio for the Group declined from 67% in FY14 to 63% in FY15. The Group remains focused on keeping business related expense increases in line with inflation.
1.3.3 SIGNIFICANT ITEMSSignificant items were lower in FY15, primarily due to expenses no longer being incurred in respect of the T15 strategy and the due diligence costs of the TrustCo acquisition incurred in FY14.
Significant items
PROFIT/(LOSS) AFTER TAX
FOR THE PERIODFY15
$MFY14
$M2H15
$M1H15
$M2H14
$M1H14
$M
Significant items:
1. TrustCo integration costs (11.3) (10.0) (4.4) (6.9) (3.8) (6.2)
2. TrustCo due diligence and transaction costs – (4.4) – – (0.3) (4.1)
3. Transformation costs – (14.3) – – (7.4) (6.9)
4. Non recurring tax benefits items – 1.2 – – – 1.2
5. Operating income from discontinued operations – 2.0 – – 1.6 0.4
6. Gain on disposal of businesses 0.1 1.0 – 0.1 1.0 –
7. Gain/(loss) on disposal/impairment of investments and associates 3.2 2.0 (0.1) 3.3 0.8 1.2
Total significant items (8.0) (22.5) (4.5) (3.5) (8.1) (14.4)
The significant items of note in FY15 were as follows: � TrustCo integration and restructuring costs of $11.3 million and � a gain on disposal of investments and associates of $3.2 million. Profit on investments relates predominantly to the gains on the
sale of underlying seed fund investments.
TrustCo integration and restructuring costs will not recur going forward.
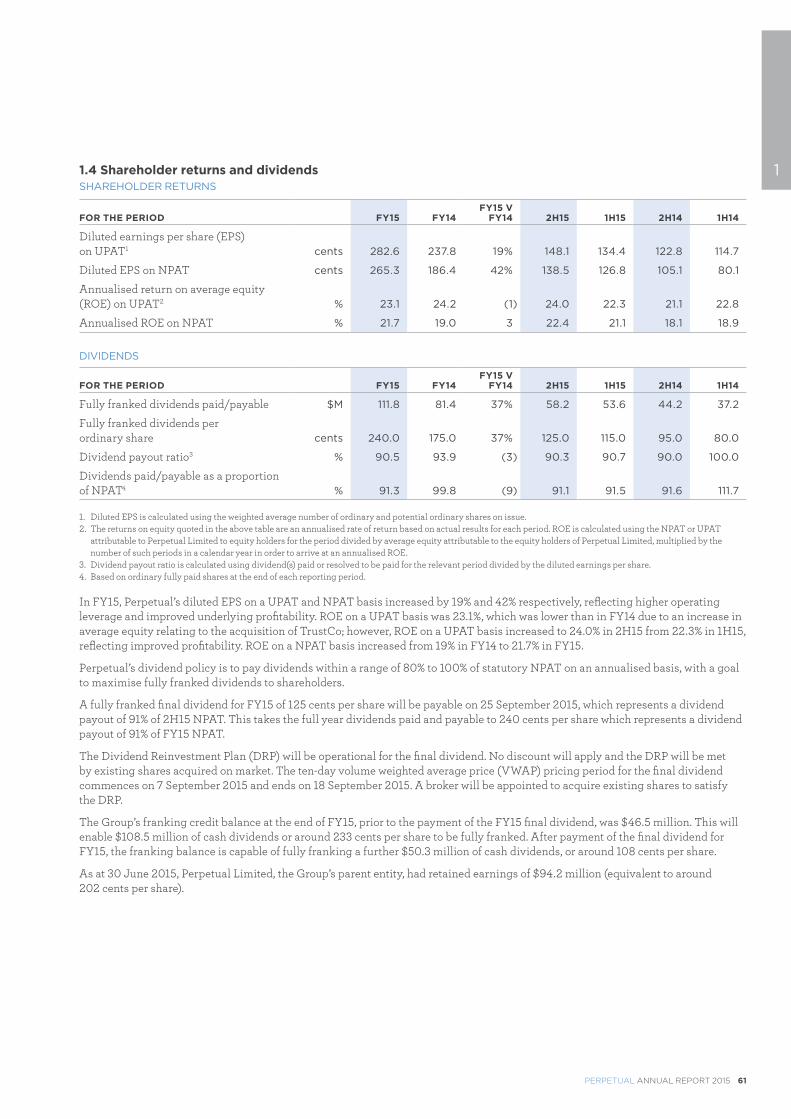
PERPETUAL ANNUAL REPORT 2015 61
11.4 Shareholder returns and dividendsSHAREHOLDER RETURNS
FOR THE PERIOD FY15 FY14FY15 V
FY14 2H15 1H15 2H14 1H14
Diluted earnings per share (EPS) on UPAT1 cents 282.6 237.8 19% 148.1 134.4 122.8 114.7
Diluted EPS on NPAT cents 265.3 186.4 42% 138.5 126.8 105.1 80.1
Annualised return on average equity (ROE) on UPAT2 % 23.1 24.2 (1) 24.0 22.3 21.1 22.8
Annualised ROE on NPAT % 21.7 19.0 3 22.4 21.1 18.1 18.9
DIVIDENDS
FOR THE PERIOD FY15 FY14FY15 V
FY14 2H15 1H15 2H14 1H14
Fully franked dividends paid/payable $M 111.8 81.4 37% 58.2 53.6 44.2 37.2
Fully franked dividends per ordinary share cents 240.0 175.0 37% 125.0 115.0 95.0 80.0
Dividend payout ratio3 % 90.5 93.9 (3) 90.3 90.7 90.0 100.0
Dividends paid/payable as a proportion of NPAT4 % 91.3 99.8 (9) 91.1 91.5 91.6 111.7
1. Diluted EPS is calculated using the weighted average number of ordinary and potential ordinary shares on issue.2. The returns on equity quoted in the above table are an annualised rate of return based on actual results for each period. ROE is calculated using the NPAT or UPAT
attributable to Perpetual Limited to equity holders for the period divided by average equity attributable to the equity holders of Perpetual Limited, multiplied by the number of such periods in a calendar year in order to arrive at an annualised ROE.
3. Dividend payout ratio is calculated using dividend(s) paid or resolved to be paid for the relevant period divided by the diluted earnings per share.4. Based on ordinary fully paid shares at the end of each reporting period.
In FY15, Perpetual’s diluted EPS on a UPAT and NPAT basis increased by 19% and 42% respectively, reflecting higher operating leverage and improved underlying profitability. ROE on a UPAT basis was 23.1%, which was lower than in FY14 due to an increase in average equity relating to the acquisition of TrustCo; however, ROE on a UPAT basis increased to 24.0% in 2H15 from 22.3% in 1H15, reflecting improved profitability. ROE on a NPAT basis increased from 19% in FY14 to 21.7% in FY15.
Perpetual’s dividend policy is to pay dividends within a range of 80% to 100% of statutory NPAT on an annualised basis, with a goal to maximise fully franked dividends to shareholders.
A fully franked final dividend for FY15 of 125 cents per share will be payable on 25 September 2015, which represents a dividend payout of 91% of 2H15 NPAT. This takes the full year dividends paid and payable to 240 cents per share which represents a dividend payout of 91% of FY15 NPAT.
The Dividend Reinvestment Plan (DRP) will be operational for the final dividend. No discount will apply and the DRP will be met by existing shares acquired on market. The ten-day volume weighted average price (VWAP) pricing period for the final dividend commences on 7 September 2015 and ends on 18 September 2015. A broker will be appointed to acquire existing shares to satisfy the DRP.
The Group’s franking credit balance at the end of FY15, prior to the payment of the FY15 final dividend, was $46.5 million. This will enable $108.5 million of cash dividends or around 233 cents per share to be fully franked. After payment of the final dividend for FY15, the franking balance is capable of fully franking a further $50.3 million of cash dividends, or around 108 cents per share.
As at 30 June 2015, Perpetual Limited, the Group’s parent entity, had retained earnings of $94.2 million (equivalent to around 202 cents per share).
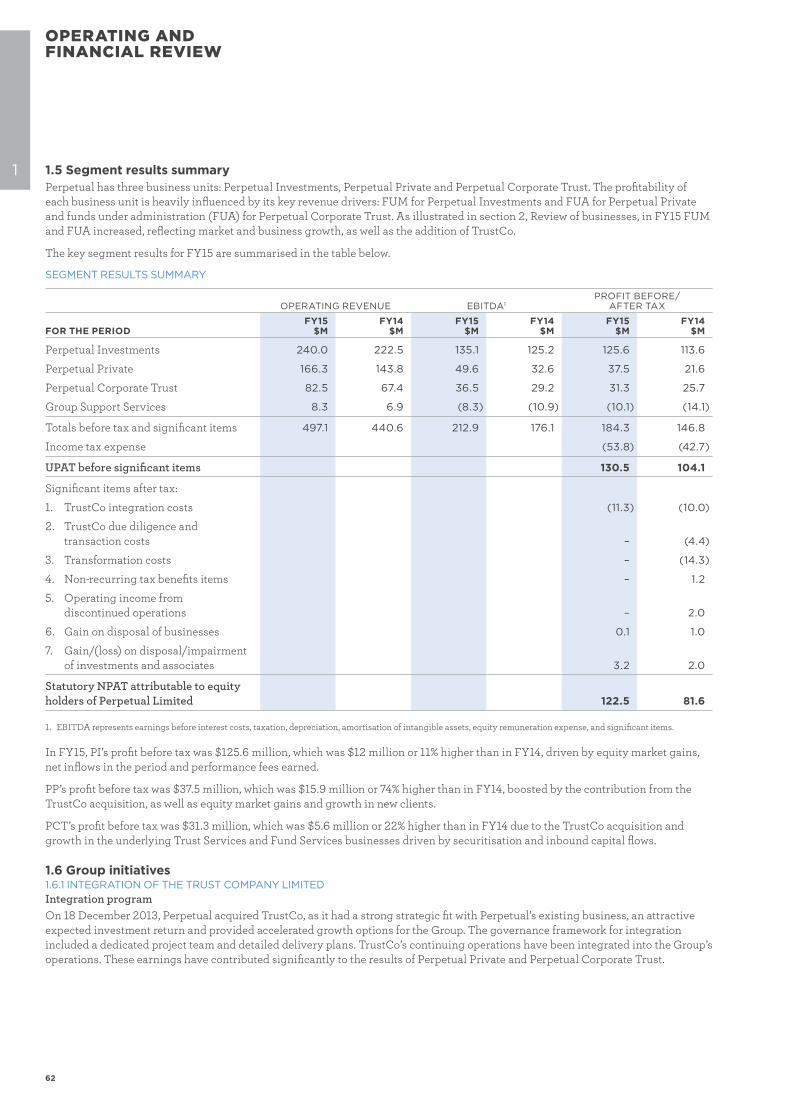
62
1 1.5 Segment results summaryPerpetual has three business units: Perpetual Investments, Perpetual Private and Perpetual Corporate Trust. The profitability of each business unit is heavily influenced by its key revenue drivers: FUM for Perpetual Investments and FUA for Perpetual Private and funds under administration (FUA) for Perpetual Corporate Trust. As illustrated in section 2, Review of businesses, in FY15 FUM and FUA increased, reflecting market and business growth, as well as the addition of TrustCo.
The key segment results for FY15 are summarised in the table below.
SEGMENT RESULTS SUMMARY
OPERATING REVENUE EBITDA1PROFIT BEFORE/
AFTER TAX
FOR THE PERIODFY15
$MFY14
$MFY15
$MFY14
$MFY15
$MFY14
$M
Perpetual Investments 240.0 222.5 135.1 125.2 125.6 113.6
Perpetual Private 166.3 143.8 49.6 32.6 37.5 21.6
Perpetual Corporate Trust 82.5 67.4 36.5 29.2 31.3 25.7
Group Support Services 8.3 6.9 (8.3) (10.9) (10.1) (14.1)
Totals before tax and significant items 497.1 440.6 212.9 176.1 184.3 146.8
Income tax expense (53.8) (42.7)
UPAT before significant items 130.5 104.1
Significant items after tax:
1. TrustCo integration costs (11.3) (10.0)
2. TrustCo due diligence and transaction costs – (4.4)
3. Transformation costs – (14.3)
4. Non-recurring tax benefits items – 1.2
5. Operating income from discontinued operations – 2.0
6. Gain on disposal of businesses 0.1 1.0
7. Gain/(loss) on disposal/impairment of investments and associates 3.2 2.0
Statutory NPAT attributable to equity holders of Perpetual Limited 122.5 81.6
1. EBITDA represents earnings before interest costs, taxation, depreciation, amortisation of intangible assets, equity remuneration expense, and significant items.
In FY15, PI’s profit before tax was $125.6 million, which was $12 million or 11% higher than in FY14, driven by equity market gains, net inflows in the period and performance fees earned.
PP’s profit before tax was $37.5 million, which was $15.9 million or 74% higher than in FY14, boosted by the contribution from the TrustCo acquisition, as well as equity market gains and growth in new clients.
PCT’s profit before tax was $31.3 million, which was $5.6 million or 22% higher than in FY14 due to the TrustCo acquisition and growth in the underlying Trust Services and Fund Services businesses driven by securitisation and inbound capital flows.
1.6 Group initiatives1.6.1 INTEGRATION OF THE TRUST COMPANY LIMITEDIntegration programOn 18 December 2013, Perpetual acquired TrustCo, as it had a strong strategic fit with Perpetual’s existing business, an attractive expected investment return and provided accelerated growth options for the Group. The governance framework for integration included a dedicated project team and detailed delivery plans. TrustCo’s continuing operations have been integrated into the Group’s operations. These earnings have contributed significantly to the results of Perpetual Private and Perpetual Corporate Trust.
OPERATING AND FINANCIAL REVIEW
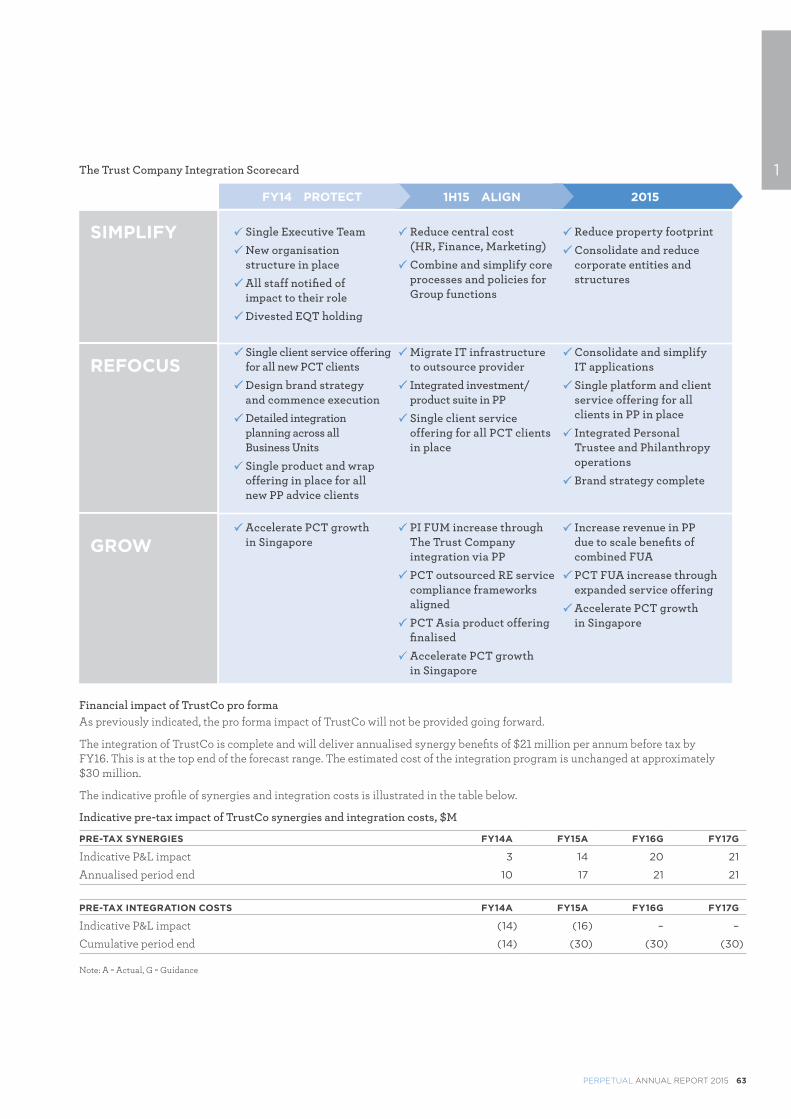
PERPETUAL ANNUAL REPORT 2015 63
1The Trust Company Integration Scorecard
Single Executive Team
New organisation structure in place
All staff notified of impact to their role
Divested EQT holding
Reduce central cost (HR, Finance, Marketing)
Combine and simplify core processes and policies for Group functions
Reduce property footprint
Consolidate and reduce corporate entities and structures
Single client service offering for all new PCT clients
Design brand strategy and commence execution
Detailed integration planning across all Business Units
Single product and wrap offering in place for all new PP advice clients
Migrate IT infrastructure to outsource provider
Integrated investment/product suite in PP
Single client service offering for all PCT clients in place
Consolidate and simplify IT applications
Single platform and client service offering for all clients in PP in place
Integrated Personal Trustee and Philanthropy operations
Brand strategy complete
Accelerate PCT growth in Singapore
PI FUM increase through The Trust Company integration via PP
PCT outsourced RE service compliance frameworks aligned
PCT Asia product offering finalised
Accelerate PCT growth in Singapore
Increase revenue in PP due to scale benefits of combined FUA
PCT FUA increase through expanded service offering
Accelerate PCT growth in Singapore
SIMPLIFY
REFOCUS
GROW
20151H15 ALIGNFY14 PROTECT
Financial impact of TrustCo pro formaAs previously indicated, the pro forma impact of TrustCo will not be provided going forward.
The integration of TrustCo is complete and will deliver annualised synergy benefits of $21 million per annum before tax by FY16. This is at the top end of the forecast range. The estimated cost of the integration program is unchanged at approximately $30 million.
The indicative profile of synergies and integration costs is illustrated in the table below.
Indicative pre-tax impact of TrustCo synergies and integration costs, $M
PRE-TAX SYNERGIES FY14A FY15A FY16G FY17G
Indicative P&L impact 3 14 20 21
Annualised period end 10 17 21 21
PRE-TAX INTEGRATION COSTS FY14A FY15A FY16G FY17G
Indicative P&L impact (14) (16) – –
Cumulative period end (14) (30) (30) (30)
Note: A = Actual, G = Guidance
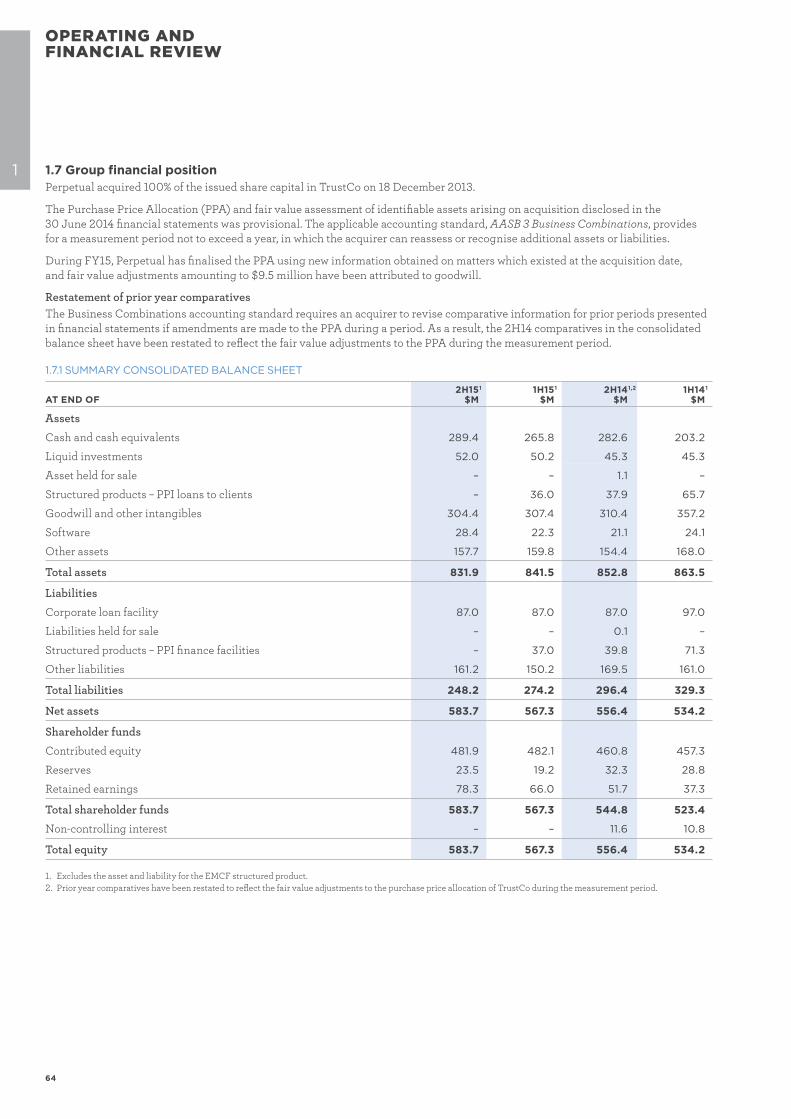
64
OPERATING AND FINANCIAL REVIEW
1 1.7 Group financial positionPerpetual acquired 100% of the issued share capital in TrustCo on 18 December 2013.
The Purchase Price Allocation (PPA) and fair value assessment of identifiable assets arising on acquisition disclosed in the 30 June 2014 financial statements was provisional. The applicable accounting standard, AASB 3 Business Combinations, provides for a measurement period not to exceed a year, in which the acquirer can reassess or recognise additional assets or liabilities.
During FY15, Perpetual has finalised the PPA using new information obtained on matters which existed at the acquisition date, and fair value adjustments amounting to $9.5 million have been attributed to goodwill.
Restatement of prior year comparativesThe Business Combinations accounting standard requires an acquirer to revise comparative information for prior periods presented in financial statements if amendments are made to the PPA during a period. As a result, the 2H14 comparatives in the consolidated balance sheet have been restated to reflect the fair value adjustments to the PPA during the measurement period.
1.7.1 SUMMARY CONSOLIDATED BALANCE SHEET
AT END OF2H15 1
$M1H15 1
$M2H14 1,2
$M1H14 1
$M
Assets
Cash and cash equivalents 289.4 265.8 282.6 203.2
Liquid investments 52.0 50.2 45.3 45.3
Asset held for sale – – 1.1 –
Structured products – PPI loans to clients – 36.0 37.9 65.7
Goodwill and other intangibles 304.4 307.4 310.4 357.2
Software 28.4 22.3 21.1 24.1
Other assets 157.7 159.8 154.4 168.0
Total assets 831.9 841.5 852.8 863.5
Liabilities
Corporate loan facility 87.0 87.0 87.0 97.0
Liabilities held for sale – – 0.1 –
Structured products – PPI finance facilities – 37.0 39.8 71.3
Other liabilities 161.2 150.2 169.5 161.0
Total liabilities 248.2 274.2 296.4 329.3
Net assets 583.7 567.3 556.4 534.2
Shareholder funds
Contributed equity 481.9 482.1 460.8 457.3
Reserves 23.5 19.2 32.3 28.8
Retained earnings 78.3 66.0 51.7 37.3
Total shareholder funds 583.7 567.3 544.8 523.4
Non-controlling interest – – 11.6 10.8
Total equity 583.7 567.3 556.4 534.2
1. Excludes the asset and liability for the EMCF structured product.2. Prior year comparatives have been restated to reflect the fair value adjustments to the purchase price allocation of TrustCo during the measurement period.
PERPETUAL ANNUAL REPORT 2015 65
11.7.2 BALANCE SHEET ANALYSISKey movements in Perpetual’s consolidated balance sheet are described below.
CashCash and cash equivalents increased from $282.6 million at the end of FY14 to $289.4 million at the end of FY15, an increase of $6.8 million or 2%. The movement in the cash balance during FY15 was primarily due to the following: � net cash inflows from operations of $129.2 million � net cash used in investing activities of $18.8 million for property, plant and equipment, software and investments � cash dividends paid of $97.8 million and � proceeds from the sale of units in seed funds paid to non-controlling interests of $5.8 million.
Further detail can be found in section 1.8.2, ‘Cash flow’.
Liquid investmentsLiquid investments increased to $52.0 million at the end of FY15 from $45.3 million at the end of FY14. This was due to appreciation in market valuations as well as further investment in products to hedge against the future cost of certain deferred incentives of the asset managers that have been notionally invested in those products.
Structured products – Perpetual Protected Investments loans to clients and finance facilitiesPerpetual Protected Investments (PPI) loans to clients expired in FY15, and clients repaid their loans on exit of their investments in the product. The PPI balance at the end of FY15 was $nil, which was $37.9 million lower than at the end of FY14.
GoodwillThere has been no movement in goodwill and a $6.0 million decrease in other intangibles during the year.
Further detail can be found in section 1.7.3, ‘Goodwill and intangibles’.
Other assets and liabilities‘Other assets’ increased to $157.7 million from $154.4 million at the end of FY14 and ‘Other liabilities’ decreased to $161.2 million from $169.5 million at the end of FY14. The increase in other assets is primarily attributable to timing differences on accrued income. The decrease in other liabilities is predominantly due to the payment of short-term incentives to employees and payment of provisions.
LoansMovements in loans balances are described in section 1.8.3, ‘Debt’.
Contributed equityContributed Equity increased by $21.1 million since 30 June 2014. This increase is primarily attributable to the vesting of shares under employee share plans.
ReservesTotal reserves have decreased by $8.8 million to $23.5 million as at 30 June 2015 due primarily to a decrease in the Equity Compensation Reserve, offset by a $2.9 million increase in the Available-for-Sale Reserve.
The decrease in the Equity Compensation Reserve has resulted from a $22.9 million movement on employee shares, mainly due to the vesting of shares, offset by the FY15 equity remuneration expense.
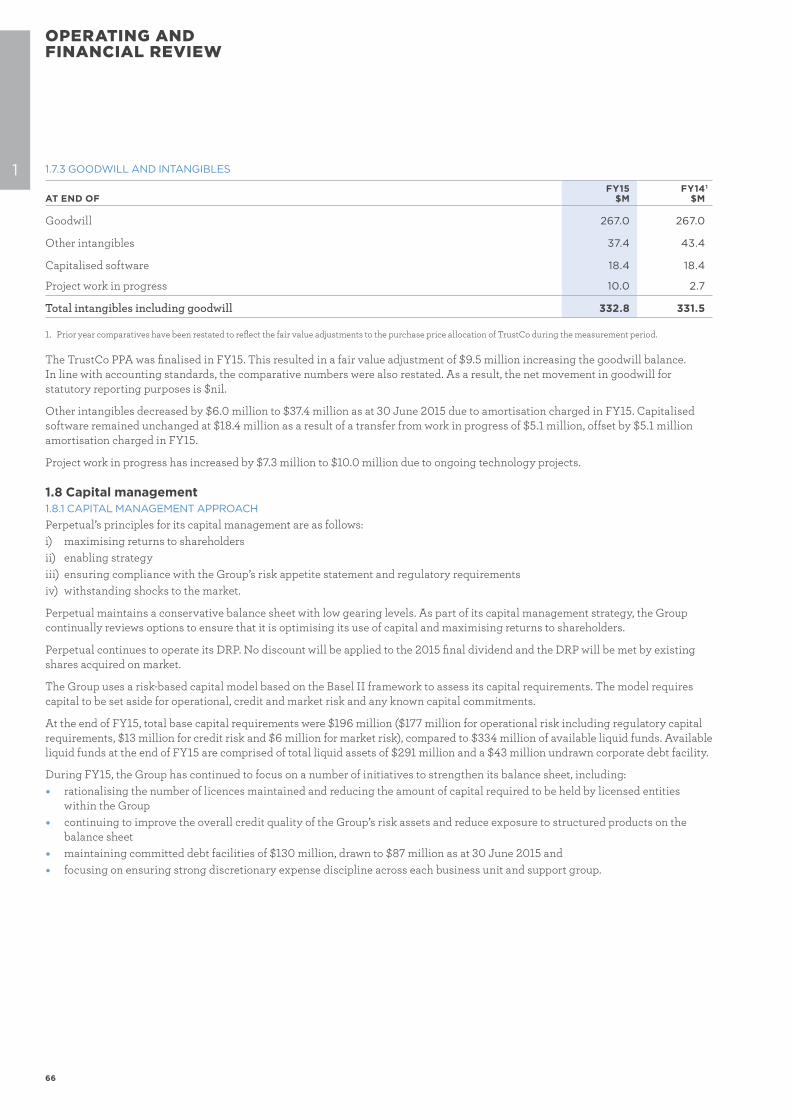
66
OPERATING AND FINANCIAL REVIEW
1 1.7.3 GOODWILL AND INTANGIBLES
AT END OFFY15
$MFY14 1
$M
Goodwill 267.0 267.0
Other intangibles 37.4 43.4
Capitalised software 18.4 18.4
Project work in progress 10.0 2.7
Total intangibles including goodwill 332.8 331.5
1. Prior year comparatives have been restated to reflect the fair value adjustments to the purchase price allocation of TrustCo during the measurement period.
The TrustCo PPA was finalised in FY15. This resulted in a fair value adjustment of $9.5 million increasing the goodwill balance. In line with accounting standards, the comparative numbers were also restated. As a result, the net movement in goodwill for statutory reporting purposes is $nil.
Other intangibles decreased by $6.0 million to $37.4 million as at 30 June 2015 due to amortisation charged in FY15. Capitalised software remained unchanged at $18.4 million as a result of a transfer from work in progress of $5.1 million, offset by $5.1 million amortisation charged in FY15.
Project work in progress has increased by $7.3 million to $10.0 million due to ongoing technology projects.
1.8 Capital management1.8.1 CAPITAL MANAGEMENT APPROACHPerpetual’s principles for its capital management are as follows:i) maximising returns to shareholdersii) enabling strategyiii) ensuring compliance with the Group’s risk appetite statement and regulatory requirementsiv) withstanding shocks to the market.
Perpetual maintains a conservative balance sheet with low gearing levels. As part of its capital management strategy, the Group continually reviews options to ensure that it is optimising its use of capital and maximising returns to shareholders.
Perpetual continues to operate its DRP. No discount will be applied to the 2015 final dividend and the DRP will be met by existing shares acquired on market.
The Group uses a risk-based capital model based on the Basel II framework to assess its capital requirements. The model requires capital to be set aside for operational, credit and market risk and any known capital commitments.
At the end of FY15, total base capital requirements were $196 million ($177 million for operational risk including regulatory capital requirements, $13 million for credit risk and $6 million for market risk), compared to $334 million of available liquid funds. Available liquid funds at the end of FY15 are comprised of total liquid assets of $291 million and a $43 million undrawn corporate debt facility.
During FY15, the Group has continued to focus on a number of initiatives to strengthen its balance sheet, including: � rationalising the number of licences maintained and reducing the amount of capital required to be held by licensed entities
within the Group � continuing to improve the overall credit quality of the Group’s risk assets and reduce exposure to structured products on the
balance sheet � maintaining committed debt facilities of $130 million, drawn to $87 million as at 30 June 2015 and � focusing on ensuring strong discretionary expense discipline across each business unit and support group.
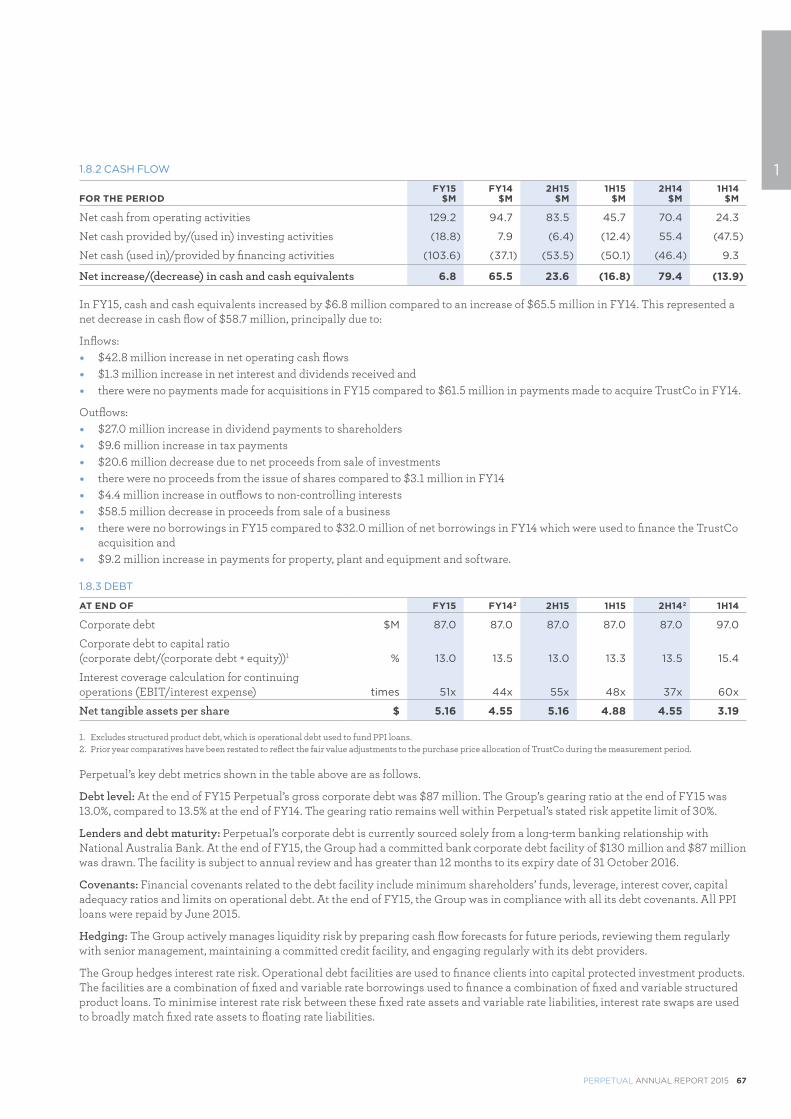
PERPETUAL ANNUAL REPORT 2015 67
11.8.2 CASH FLOW
FOR THE PERIODFY15
$MFY14
$M2H15
$M1H15
$M2H14
$M1H14
$M
Net cash from operating activities 129.2 94.7 83.5 45.7 70.4 24.3
Net cash provided by/(used in) investing activities (18.8) 7.9 (6.4) (12.4) 55.4 (47.5)
Net cash (used in)/provided by financing activities (103.6) (37.1) (53.5) (50.1) (46.4) 9.3
Net increase/(decrease) in cash and cash equivalents 6.8 65.5 23.6 (16.8) 79.4 (13.9)
In FY15, cash and cash equivalents increased by $6.8 million compared to an increase of $65.5 million in FY14. This represented a net decrease in cash flow of $58.7 million, principally due to:
Inflows: � $42.8 million increase in net operating cash flows � $1.3 million increase in net interest and dividends received and � there were no payments made for acquisitions in FY15 compared to $61.5 million in payments made to acquire TrustCo in FY14.
Outflows: � $27.0 million increase in dividend payments to shareholders � $9.6 million increase in tax payments � $20.6 million decrease due to net proceeds from sale of investments � there were no proceeds from the issue of shares compared to $3.1 million in FY14 � $4.4 million increase in outflows to non-controlling interests � $58.5 million decrease in proceeds from sale of a business � there were no borrowings in FY15 compared to $32.0 million of net borrowings in FY14 which were used to finance the TrustCo
acquisition and � $9.2 million increase in payments for property, plant and equipment and software.
1.8.3 DEBT
AT END OF FY15 FY14 2 2H15 1H15 2H14 2 1H14
Corporate debt $M 87.0 87.0 87.0 87.0 87.0 97.0
Corporate debt to capital ratio (corporate debt/(corporate debt + equity))1 % 13.0 13.5 13.0 13.3 13.5 15.4
Interest coverage calculation for continuing operations (EBIT/interest expense) times 51x 44x 55x 48x 37x 60x
Net tangible assets per share $ 5.16 4.55 5.16 4.88 4.55 3.19
1. Excludes structured product debt, which is operational debt used to fund PPI loans.2. Prior year comparatives have been restated to reflect the fair value adjustments to the purchase price allocation of TrustCo during the measurement period.
Perpetual’s key debt metrics shown in the table above are as follows.
Debt level: At the end of FY15 Perpetual’s gross corporate debt was $87 million. The Group’s gearing ratio at the end of FY15 was 13.0%, compared to 13.5% at the end of FY14. The gearing ratio remains well within Perpetual’s stated risk appetite limit of 30%.
Lenders and debt maturity: Perpetual’s corporate debt is currently sourced solely from a long-term banking relationship with National Australia Bank. At the end of FY15, the Group had a committed bank corporate debt facility of $130 million and $87 million was drawn. The facility is subject to annual review and has greater than 12 months to its expiry date of 31 October 2016.
Covenants: Financial covenants related to the debt facility include minimum shareholders’ funds, leverage, interest cover, capital adequacy ratios and limits on operational debt. At the end of FY15, the Group was in compliance with all its debt covenants. All PPI loans were repaid by June 2015.
Hedging: The Group actively manages liquidity risk by preparing cash flow forecasts for future periods, reviewing them regularly with senior management, maintaining a committed credit facility, and engaging regularly with its debt providers.
The Group hedges interest rate risk. Operational debt facilities are used to finance clients into capital protected investment products. The facilities are a combination of fixed and variable rate borrowings used to finance a combination of fixed and variable structured product loans. To minimise interest rate risk between these fixed rate assets and variable rate liabilities, interest rate swaps are used to broadly match fixed rate assets to floating rate liabilities.
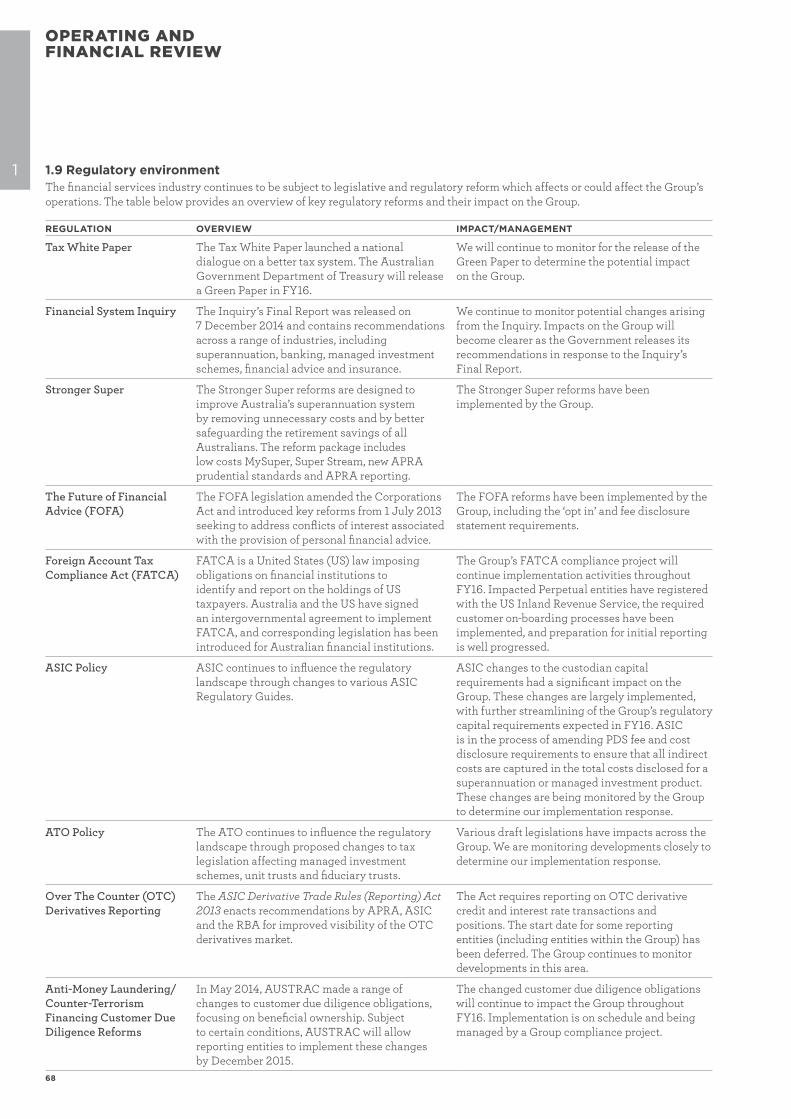
68
OPERATING AND FINANCIAL REVIEW
1 1.9 Regulatory environmentThe financial services industry continues to be subject to legislative and regulatory reform which affects or could affect the Group’s operations. The table below provides an overview of key regulatory reforms and their impact on the Group.
REGULATION OVERVIEW IMPACT/MANAGEMENT
Tax White Paper The Tax White Paper launched a national dialogue on a better tax system. The Australian Government Department of Treasury will release a Green Paper in FY16.
We will continue to monitor for the release of the Green Paper to determine the potential impact on the Group.
Financial System Inquiry The Inquiry’s Final Report was released on 7 December 2014 and contains recommendations across a range of industries, including superannuation, banking, managed investment schemes, financial advice and insurance.
We continue to monitor potential changes arising from the Inquiry. Impacts on the Group will become clearer as the Government releases its recommendations in response to the Inquiry’s Final Report.
Stronger Super The Stronger Super reforms are designed to improve Australia’s superannuation system by removing unnecessary costs and by better safeguarding the retirement savings of all Australians. The reform package includes low costs MySuper, Super Stream, new APRA prudential standards and APRA reporting.
The Stronger Super reforms have been implemented by the Group.
The Future of Financial Advice (FOFA)
The FOFA legislation amended the Corporations Act and introduced key reforms from 1 July 2013 seeking to address conflicts of interest associated with the provision of personal financial advice.
The FOFA reforms have been implemented by the Group, including the ‘opt in’ and fee disclosure statement requirements.
Foreign Account Tax Compliance Act (FATCA)
FATCA is a United States (US) law imposing obligations on financial institutions to identify and report on the holdings of US taxpayers. Australia and the US have signed an intergovernmental agreement to implement FATCA, and corresponding legislation has been introduced for Australian financial institutions.
The Group’s FATCA compliance project will continue implementation activities throughout FY16. Impacted Perpetual entities have registered with the US Inland Revenue Service, the required customer on-boarding processes have been implemented, and preparation for initial reporting is well progressed.
ASIC Policy ASIC continues to influence the regulatory landscape through changes to various ASIC Regulatory Guides.
ASIC changes to the custodian capital requirements had a significant impact on the Group. These changes are largely implemented, with further streamlining of the Group’s regulatory capital requirements expected in FY16. ASIC is in the process of amending PDS fee and cost disclosure requirements to ensure that all indirect costs are captured in the total costs disclosed for a superannuation or managed investment product. These changes are being monitored by the Group to determine our implementation response.
ATO Policy The ATO continues to influence the regulatory landscape through proposed changes to tax legislation affecting managed investment schemes, unit trusts and fiduciary trusts.
Various draft legislations have impacts across the Group. We are monitoring developments closely to determine our implementation response.
Over The Counter (OTC) Derivatives Reporting
The ASIC Derivative Trade Rules (Reporting) Act 2013 enacts recommendations by APRA, ASIC and the RBA for improved visibility of the OTC derivatives market.
The Act requires reporting on OTC derivative credit and interest rate transactions and positions. The start date for some reporting entities (including entities within the Group) has been deferred. The Group continues to monitor developments in this area.
Anti-Money Laundering/ Counter-Terrorism Financing Customer Due Diligence Reforms
In May 2014, AUSTRAC made a range of changes to customer due diligence obligations, focusing on beneficial ownership. Subject to certain conditions, AUSTRAC will allow reporting entities to implement these changes by December 2015.
The changed customer due diligence obligations will continue to impact the Group throughout FY16. Implementation is on schedule and being managed by a Group compliance project.
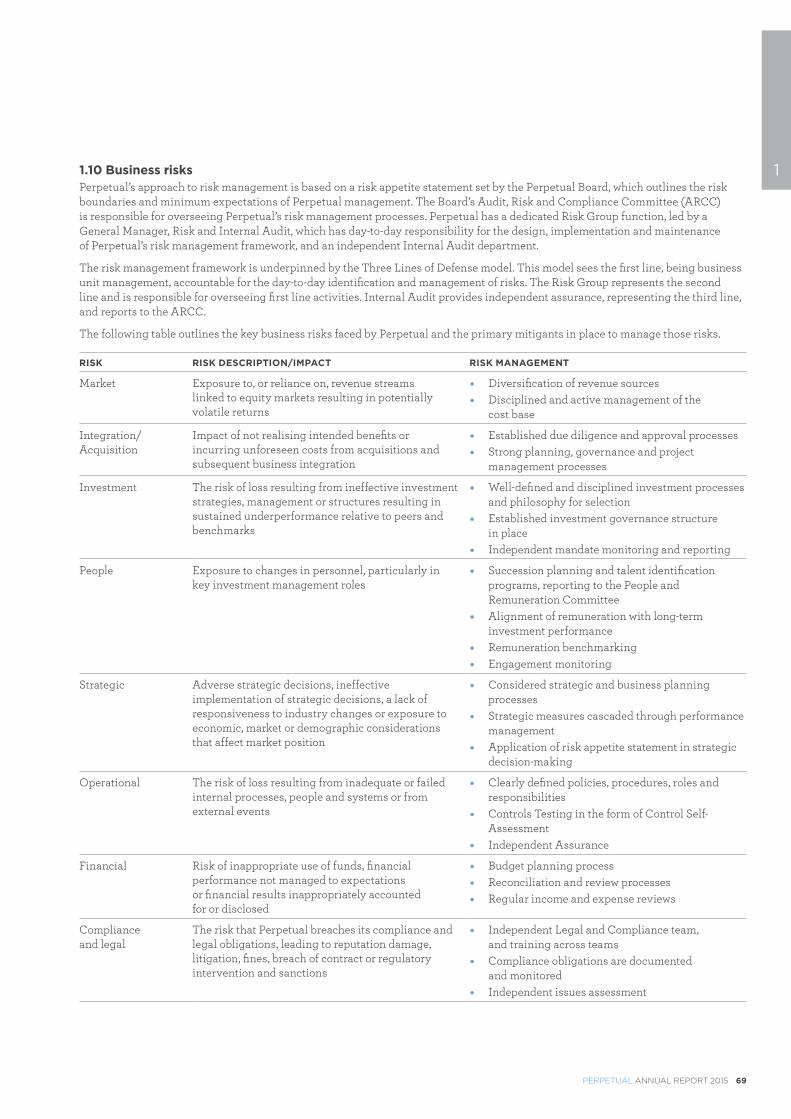
PERPETUAL ANNUAL REPORT 2015 69
11.10 Business risksPerpetual’s approach to risk management is based on a risk appetite statement set by the Perpetual Board, which outlines the risk boundaries and minimum expectations of Perpetual management. The Board’s Audit, Risk and Compliance Committee (ARCC) is responsible for overseeing Perpetual’s risk management processes. Perpetual has a dedicated Risk Group function, led by a General Manager, Risk and Internal Audit, which has day-to-day responsibility for the design, implementation and maintenance of Perpetual’s risk management framework, and an independent Internal Audit department.
The risk management framework is underpinned by the Three Lines of Defense model. This model sees the first line, being business unit management, accountable for the day-to-day identification and management of risks. The Risk Group represents the second line and is responsible for overseeing first line activities. Internal Audit provides independent assurance, representing the third line, and reports to the ARCC.
The following table outlines the key business risks faced by Perpetual and the primary mitigants in place to manage those risks.
RISK RISK DESCRIPTION/IMPACT RISK MANAGEMENT
Market Exposure to, or reliance on, revenue streams linked to equity markets resulting in potentially volatile returns
� Diversification of revenue sources � Disciplined and active management of the
cost base
Integration/ Acquisition
Impact of not realising intended benefits or incurring unforeseen costs from acquisitions and subsequent business integration
� Established due diligence and approval processes � Strong planning, governance and project
management processes
Investment The risk of loss resulting from ineffective investment strategies, management or structures resulting in sustained underperformance relative to peers and benchmarks
� Well-defined and disciplined investment processes and philosophy for selection
� Established investment governance structure in place
� Independent mandate monitoring and reporting
People Exposure to changes in personnel, particularly in key investment management roles
� Succession planning and talent identification programs, reporting to the People and Remuneration Committee
� Alignment of remuneration with long-term investment performance
� Remuneration benchmarking � Engagement monitoring
Strategic Adverse strategic decisions, ineffective implementation of strategic decisions, a lack of responsiveness to industry changes or exposure to economic, market or demographic considerations that affect market position
� Considered strategic and business planning processes
� Strategic measures cascaded through performance management
� Application of risk appetite statement in strategic decision-making
Operational The risk of loss resulting from inadequate or failed internal processes, people and systems or from external events
� Clearly defined policies, procedures, roles and responsibilities
� Controls Testing in the form of Control Self-Assessment
� Independent Assurance
Financial Risk of inappropriate use of funds, financial performance not managed to expectations or financial results inappropriately accounted for or disclosed
� Budget planning process � Reconciliation and review processes � Regular income and expense reviews
Compliance and legal
The risk that Perpetual breaches its compliance and legal obligations, leading to reputation damage, litigation, fines, breach of contract or regulatory intervention and sanctions
� Independent Legal and Compliance team, and training across teams
� Compliance obligations are documented and monitored
� Independent issues assessment
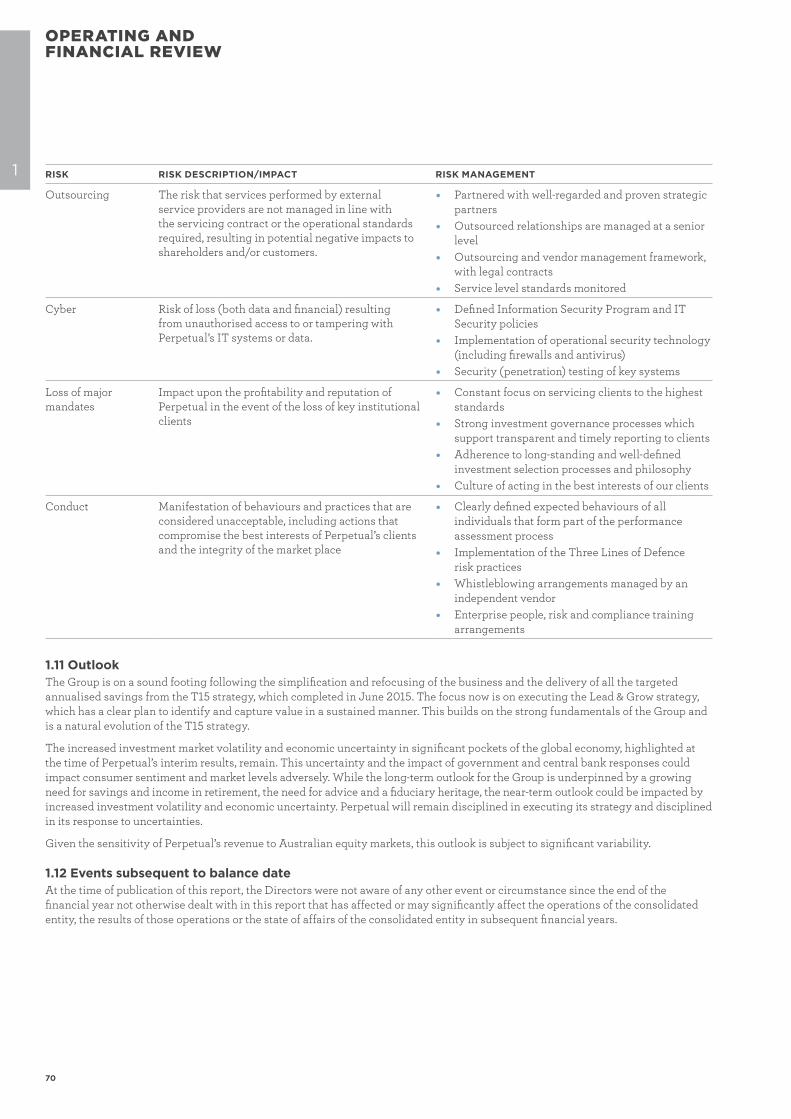
70
OPERATING AND FINANCIAL REVIEW
1 RISK RISK DESCRIPTION/IMPACT RISK MANAGEMENT
Outsourcing The risk that services performed by external service providers are not managed in line with the servicing contract or the operational standards required, resulting in potential negative impacts to shareholders and/or customers.
� Partnered with well-regarded and proven strategic partners
� Outsourced relationships are managed at a senior level
� Outsourcing and vendor management framework, with legal contracts
� Service level standards monitored
Cyber Risk of loss (both data and financial) resulting from unauthorised access to or tampering with Perpetual’s IT systems or data.
� Defined Information Security Program and IT Security policies
� Implementation of operational security technology (including firewalls and antivirus)
� Security (penetration) testing of key systems
Loss of major mandates
Impact upon the profitability and reputation of Perpetual in the event of the loss of key institutional clients
� Constant focus on servicing clients to the highest standards
� Strong investment governance processes which support transparent and timely reporting to clients
� Adherence to long-standing and well-defined investment selection processes and philosophy
� Culture of acting in the best interests of our clients
Conduct Manifestation of behaviours and practices that are considered unacceptable, including actions that compromise the best interests of Perpetual’s clients and the integrity of the market place
� Clearly defined expected behaviours of all individuals that form part of the performance assessment process
� Implementation of the Three Lines of Defence risk practices
� Whistleblowing arrangements managed by an independent vendor
� Enterprise people, risk and compliance training arrangements
1.11 OutlookThe Group is on a sound footing following the simplification and refocusing of the business and the delivery of all the targeted annualised savings from the T15 strategy, which completed in June 2015. The focus now is on executing the Lead & Grow strategy, which has a clear plan to identify and capture value in a sustained manner. This builds on the strong fundamentals of the Group and is a natural evolution of the T15 strategy.
The increased investment market volatility and economic uncertainty in significant pockets of the global economy, highlighted at the time of Perpetual’s interim results, remain. This uncertainty and the impact of government and central bank responses could impact consumer sentiment and market levels adversely. While the long-term outlook for the Group is underpinned by a growing need for savings and income in retirement, the need for advice and a fiduciary heritage, the near-term outlook could be impacted by increased investment volatility and economic uncertainty. Perpetual will remain disciplined in executing its strategy and disciplined in its response to uncertainties.
Given the sensitivity of Perpetual’s revenue to Australian equity markets, this outlook is subject to significant variability.
1.12 Events subsequent to balance dateAt the time of publication of this report, the Directors were not aware of any other event or circumstance since the end of the financial year not otherwise dealt with in this report that has affected or may significantly affect the operations of the consolidated entity, the results of those operations or the state of affairs of the consolidated entity in subsequent financial years.
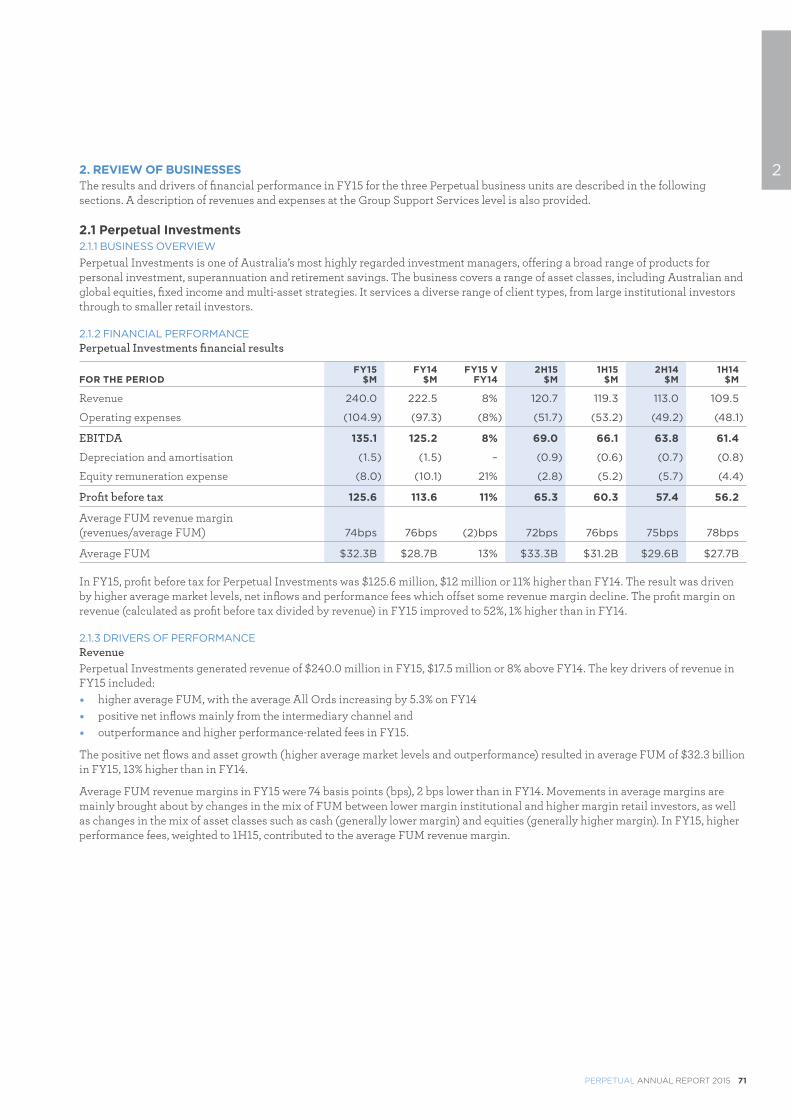
PERPETUAL ANNUAL REPORT 2015 71
22. REVIEW OF BUSINESSESThe results and drivers of financial performance in FY15 for the three Perpetual business units are described in the following sections. A description of revenues and expenses at the Group Support Services level is also provided.
2.1 Perpetual Investments2.1.1 BUSINESS OVERVIEW
Perpetual Investments is one of Australia’s most highly regarded investment managers, offering a broad range of products for personal investment, superannuation and retirement savings. The business covers a range of asset classes, including Australian and global equities, fixed income and multi-asset strategies. It services a diverse range of client types, from large institutional investors through to smaller retail investors.
2.1.2 FINANCIAL PERFORMANCEPerpetual Investments financial results
FOR THE PERIODFY15
$MFY14
$MFY15 V
FY142H15
$M1H15
$M2H14
$M1H14
$M
Revenue 240.0 222.5 8% 120.7 119.3 113.0 109.5
Operating expenses (104.9) (97.3) (8%) (51.7) (53.2) (49.2) (48.1)
EBITDA 135.1 125.2 8% 69.0 66.1 63.8 61.4
Depreciation and amortisation (1.5) (1.5) – (0.9) (0.6) (0.7) (0.8)
Equity remuneration expense (8.0) (10.1) 21% (2.8) (5.2) (5.7) (4.4)
Profit before tax 125.6 113.6 11% 65.3 60.3 57.4 56.2
Average FUM revenue margin(revenues/average FUM) 74bps 76bps (2)bps 72bps 76bps 75bps 78bps
Average FUM $32.3B $28.7B 13% $33.3B $31.2B $29.6B $27.7B
In FY15, profit before tax for Perpetual Investments was $125.6 million, $12 million or 11% higher than FY14. The result was driven by higher average market levels, net inflows and performance fees which offset some revenue margin decline. The profit margin on revenue (calculated as profit before tax divided by revenue) in FY15 improved to 52%, 1% higher than in FY14.
2.1.3 DRIVERS OF PERFORMANCERevenuePerpetual Investments generated revenue of $240.0 million in FY15, $17.5 million or 8% above FY14. The key drivers of revenue in FY15 included: � higher average FUM, with the average All Ords increasing by 5.3% on FY14 � positive net inflows mainly from the intermediary channel and � outperformance and higher performance-related fees in FY15.
The positive net flows and asset growth (higher average market levels and outperformance) resulted in average FUM of $32.3 billion in FY15, 13% higher than in FY14.
Average FUM revenue margins in FY15 were 74 basis points (bps), 2 bps lower than in FY14. Movements in average margins are mainly brought about by changes in the mix of FUM between lower margin institutional and higher margin retail investors, as well as changes in the mix of asset classes such as cash (generally lower margin) and equities (generally higher margin). In FY15, higher performance fees, weighted to 1H15, contributed to the average FUM revenue margin.
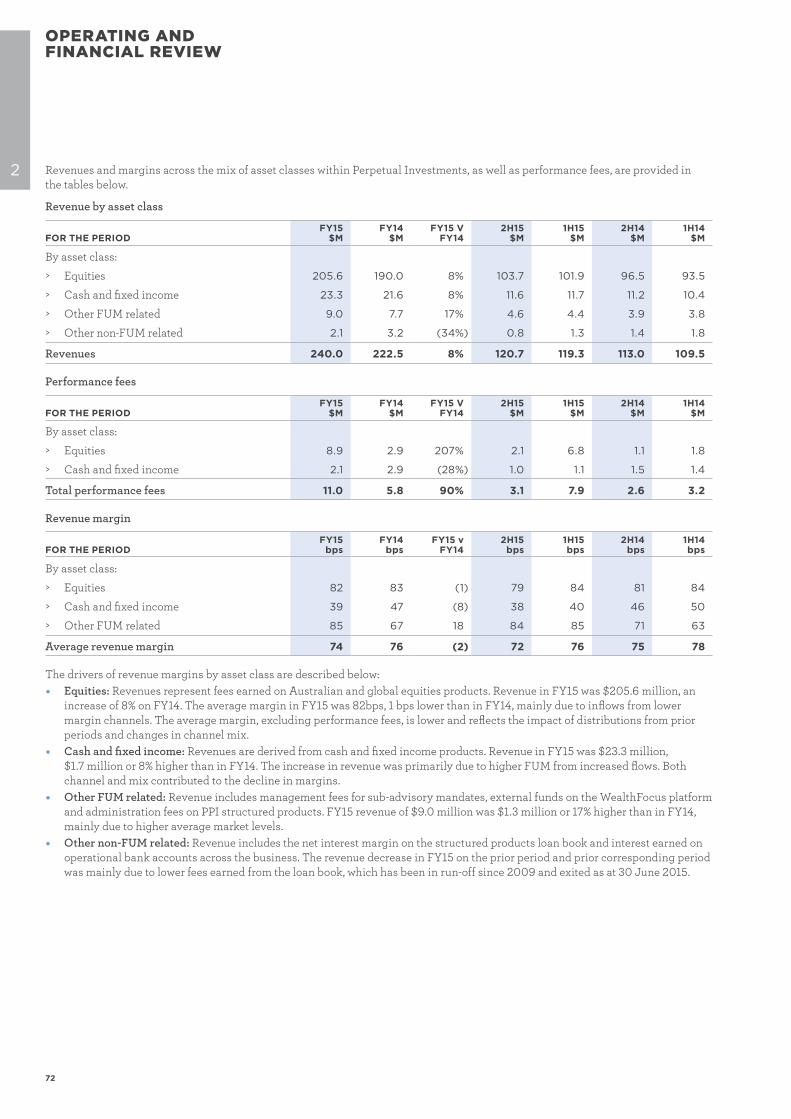
72
OPERATING AND FINANCIAL REVIEW
2 Revenues and margins across the mix of asset classes within Perpetual Investments, as well as performance fees, are provided in the tables below.
Revenue by asset class
FOR THE PERIODFY15
$MFY14
$MFY15 V
FY142H15
$M1H15
$M2H14
$M1H14
$M
By asset class:
> Equities 205.6 190.0 8% 103.7 101.9 96.5 93.5
> Cash and fixed income 23.3 21.6 8% 11.6 11.7 11.2 10.4
> Other FUM related 9.0 7.7 17% 4.6 4.4 3.9 3.8
> Other non-FUM related 2.1 3.2 (34%) 0.8 1.3 1.4 1.8
Revenues 240.0 222.5 8% 120.7 119.3 113.0 109.5
Performance fees
FOR THE PERIODFY15
$MFY14
$MFY15 V
FY142H15
$M1H15
$M2H14
$M1H14
$M
By asset class:
> Equities 8.9 2.9 207% 2.1 6.8 1.1 1.8
> Cash and fixed income 2.1 2.9 (28%) 1.0 1.1 1.5 1.4
Total performance fees 11.0 5.8 90% 3.1 7.9 2.6 3.2
Revenue margin
FOR THE PERIODFY15
bpsFY14
bpsFY15 v
FY142H15
bps1H15bps
2H14bps
1H14bps
By asset class:
> Equities 82 83 (1) 79 84 81 84
> Cash and fixed income 39 47 (8) 38 40 46 50
> Other FUM related 85 67 18 84 85 71 63
Average revenue margin 74 76 (2) 72 76 75 78
The drivers of revenue margins by asset class are described below: � Equities: Revenues represent fees earned on Australian and global equities products. Revenue in FY15 was $205.6 million, an
increase of 8% on FY14. The average margin in FY15 was 82bps, 1 bps lower than in FY14, mainly due to inflows from lower margin channels. The average margin, excluding performance fees, is lower and reflects the impact of distributions from prior periods and changes in channel mix.
� Cash and fixed income: Revenues are derived from cash and fixed income products. Revenue in FY15 was $23.3 million, $1.7 million or 8% higher than in FY14. The increase in revenue was primarily due to higher FUM from increased flows. Both channel and mix contributed to the decline in margins.
� Other FUM related: Revenue includes management fees for sub-advisory mandates, external funds on the WealthFocus platform and administration fees on PPI structured products. FY15 revenue of $9.0 million was $1.3 million or 17% higher than in FY14, mainly due to higher average market levels.
� Other non-FUM related: Revenue includes the net interest margin on the structured products loan book and interest earned on operational bank accounts across the business. The revenue decrease in FY15 on the prior period and prior corresponding period was mainly due to lower fees earned from the loan book, which has been in run-off since 2009 and exited as at 30 June 2015.
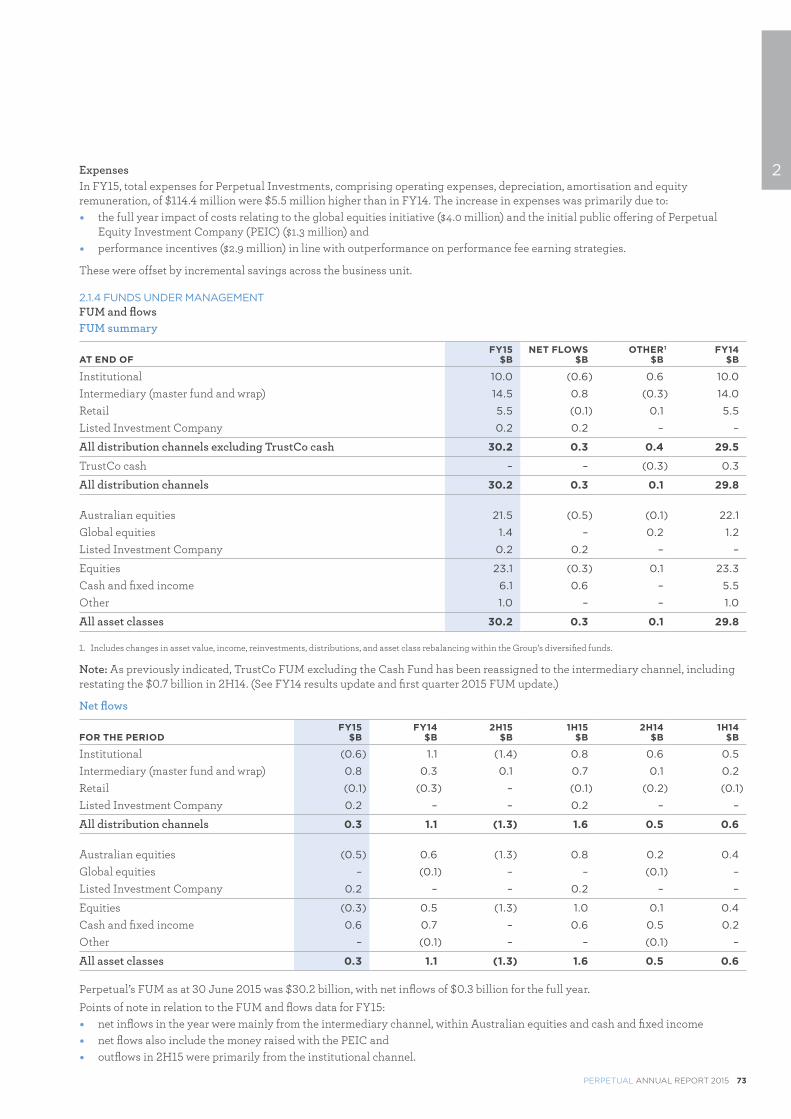
PERPETUAL ANNUAL REPORT 2015 73
2ExpensesIn FY15, total expenses for Perpetual Investments, comprising operating expenses, depreciation, amortisation and equity remuneration, of $114.4 million were $5.5 million higher than in FY14. The increase in expenses was primarily due to: � the full year impact of costs relating to the global equities initiative ($4.0 million) and the initial public offering of Perpetual
Equity Investment Company (PEIC) ($1.3 million) and � performance incentives ($2.9 million) in line with outperformance on performance fee earning strategies.
These were offset by incremental savings across the business unit.
2.1.4 FUNDS UNDER MANAGEMENTFUM and flowsFUM summary
AT END OFFY15
$BNET FLOWS
$BOTHER 1
$BFY14
$B
Institutional 10.0 (0.6) 0.6 10.0
Intermediary (master fund and wrap) 14.5 0.8 (0.3) 14.0
Retail 5.5 (0.1) 0.1 5.5
Listed Investment Company 0.2 0.2 – –
All distribution channels excluding TrustCo cash 30.2 0.3 0.4 29.5
TrustCo cash – – (0.3) 0.3
All distribution channels 30.2 0.3 0.1 29.8
Australian equities 21.5 (0.5) (0.1) 22.1
Global equities 1.4 – 0.2 1.2
Listed Investment Company 0.2 0.2 – –
Equities 23.1 (0.3) 0.1 23.3
Cash and fixed income 6.1 0.6 – 5.5
Other 1.0 – – 1.0
All asset classes 30.2 0.3 0.1 29.8
1. Includes changes in asset value, income, reinvestments, distributions, and asset class rebalancing within the Group’s diversified funds.
Note: As previously indicated, TrustCo FUM excluding the Cash Fund has been reassigned to the intermediary channel, including restating the $0.7 billion in 2H14. (See FY14 results update and first quarter 2015 FUM update.)
Net flows
FOR THE PERIODFY15
$BFY14
$B2H15
$B1H15
$B2H14
$B1H14
$B
Institutional (0.6) 1.1 (1.4) 0.8 0.6 0.5
Intermediary (master fund and wrap) 0.8 0.3 0.1 0.7 0.1 0.2
Retail (0.1) (0.3) – (0.1) (0.2) (0.1)
Listed Investment Company 0.2 – – 0.2 – –
All distribution channels 0.3 1.1 (1.3) 1.6 0.5 0.6
Australian equities (0.5) 0.6 (1.3) 0.8 0.2 0.4
Global equities – (0.1) – – (0.1) –
Listed Investment Company 0.2 – – 0.2 – –
Equities (0.3) 0.5 (1.3) 1.0 0.1 0.4
Cash and fixed income 0.6 0.7 – 0.6 0.5 0.2
Other – (0.1) – – (0.1) –
All asset classes 0.3 1.1 (1.3) 1.6 0.5 0.6
Perpetual’s FUM as at 30 June 2015 was $30.2 billion, with net inflows of $0.3 billion for the full year.
Points of note in relation to the FUM and flows data for FY15: � net inflows in the year were mainly from the intermediary channel, within Australian equities and cash and fixed income � net flows also include the money raised with the PEIC and � outflows in 2H15 were primarily from the institutional channel.
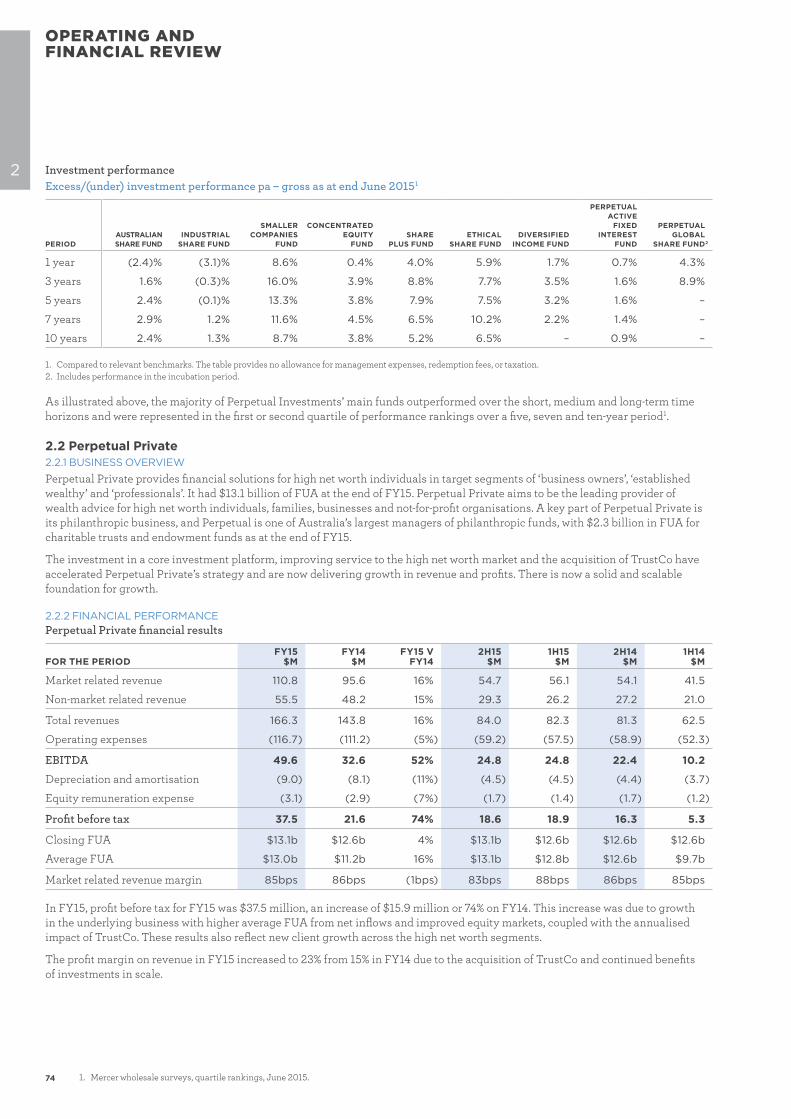
74
OPERATING AND FINANCIAL REVIEW
2 Investment performanceExcess/(under) investment performance pa – gross as at end June 20151
PERIODAUSTRALIAN SHARE FUND
INDUSTRIAL SHARE FUND
SMALLER COMPANIES
FUND
CONCENTRATED EQUITY
FUNDSHARE
PLUS FUNDETHICAL
SHARE FUNDDIVERSIFIED
INCOME FUND
PERPETUAL ACTIVE
FIXED INTEREST
FUND
PERPETUAL GLOBAL
SHARE FUND 2
1 year (2.4)% (3.1)% 8.6% 0.4% 4.0% 5.9% 1.7% 0.7% 4.3%
3 years 1.6% (0.3)% 16.0% 3.9% 8.8% 7.7% 3.5% 1.6% 8.9%
5 years 2.4% (0.1)% 13.3% 3.8% 7.9% 7.5% 3.2% 1.6% –
7 years 2.9% 1.2% 11.6% 4.5% 6.5% 10.2% 2.2% 1.4% –
10 years 2.4% 1.3% 8.7% 3.8% 5.2% 6.5% – 0.9% –
1. Compared to relevant benchmarks. The table provides no allowance for management expenses, redemption fees, or taxation.2. Includes performance in the incubation period.
As illustrated above, the majority of Perpetual Investments’ main funds outperformed over the short, medium and long-term time horizons and were represented in the first or second quartile of performance rankings over a five, seven and ten-year period1.
2.2 Perpetual Private2.2.1 BUSINESS OVERVIEW
Perpetual Private provides financial solutions for high net worth individuals in target segments of ‘business owners’, ‘established wealthy’ and ‘professionals’. It had $13.1 billion of FUA at the end of FY15. Perpetual Private aims to be the leading provider of wealth advice for high net worth individuals, families, businesses and not-for-profit organisations. A key part of Perpetual Private is its philanthropic business, and Perpetual is one of Australia’s largest managers of philanthropic funds, with $2.3 billion in FUA for charitable trusts and endowment funds as at the end of FY15.
The investment in a core investment platform, improving service to the high net worth market and the acquisition of TrustCo have accelerated Perpetual Private’s strategy and are now delivering growth in revenue and profits. There is now a solid and scalable foundation for growth.
2.2.2 FINANCIAL PERFORMANCEPerpetual Private financial results
FOR THE PERIODFY15
$MFY14
$MFY15 V
FY142H15
$M1H15
$M2H14
$M1H14
$M
Market related revenue 110.8 95.6 16% 54.7 56.1 54.1 41.5
Non-market related revenue 55.5 48.2 15% 29.3 26.2 27.2 21.0
Total revenues 166.3 143.8 16% 84.0 82.3 81.3 62.5
Operating expenses (116.7) (111.2) (5%) (59.2) (57.5) (58.9) (52.3)
EBITDA 49.6 32.6 52% 24.8 24.8 22.4 10.2
Depreciation and amortisation (9.0) (8.1) (11%) (4.5) (4.5) (4.4) (3.7)
Equity remuneration expense (3.1) (2.9) (7%) (1.7) (1.4) (1.7) (1.2)
Profit before tax 37.5 21.6 74% 18.6 18.9 16.3 5.3
Closing FUA $13.1b $12.6b 4% $13.1b $12.6b $12.6b $12.6b
Average FUA $13.0b $11.2b 16% $13.1b $12.8b $12.6b $9.7b
Market related revenue margin 85bps 86bps (1bps) 83bps 88bps 86bps 85bps
In FY15, profit before tax for FY15 was $37.5 million, an increase of $15.9 million or 74% on FY14. This increase was due to growth in the underlying business with higher average FUA from net inflows and improved equity markets, coupled with the annualised impact of TrustCo. These results also reflect new client growth across the high net worth segments.
The profit margin on revenue in FY15 increased to 23% from 15% in FY14 due to the acquisition of TrustCo and continued benefits of investments in scale.
1. Mercer wholesale surveys, quartile rankings, June 2015.
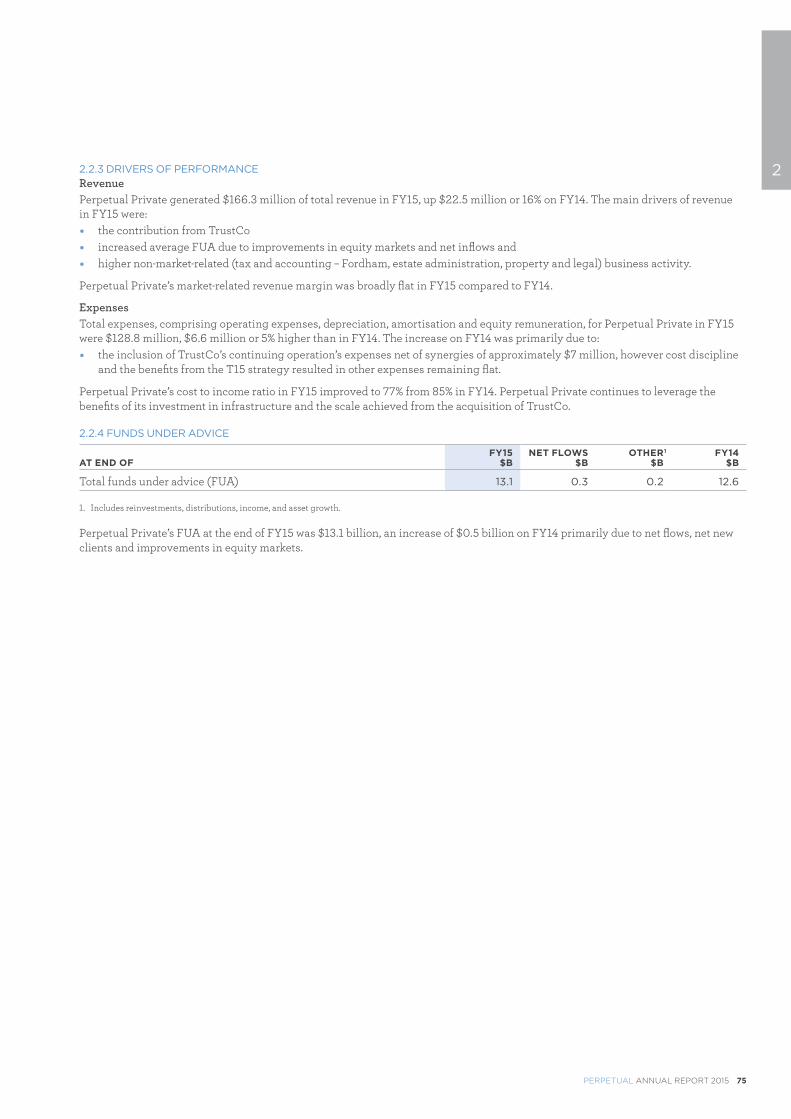
PERPETUAL ANNUAL REPORT 2015 75
22.2.3 DRIVERS OF PERFORMANCERevenuePerpetual Private generated $166.3 million of total revenue in FY15, up $22.5 million or 16% on FY14. The main drivers of revenue in FY15 were: � the contribution from TrustCo � increased average FUA due to improvements in equity markets and net inflows and � higher non-market-related (tax and accounting – Fordham, estate administration, property and legal) business activity.
Perpetual Private’s market-related revenue margin was broadly flat in FY15 compared to FY14.
ExpensesTotal expenses, comprising operating expenses, depreciation, amortisation and equity remuneration, for Perpetual Private in FY15 were $128.8 million, $6.6 million or 5% higher than in FY14. The increase on FY14 was primarily due to: � the inclusion of TrustCo’s continuing operation’s expenses net of synergies of approximately $7 million, however cost discipline
and the benefits from the T15 strategy resulted in other expenses remaining flat.
Perpetual Private’s cost to income ratio in FY15 improved to 77% from 85% in FY14. Perpetual Private continues to leverage the benefits of its investment in infrastructure and the scale achieved from the acquisition of TrustCo.
2.2.4 FUNDS UNDER ADVICE
AT END OFFY15
$BNET FLOWS
$BOTHER 1
$BFY14
$B
Total funds under advice (FUA) 13.1 0.3 0.2 12.6
1. Includes reinvestments, distributions, income, and asset growth.
Perpetual Private’s FUA at the end of FY15 was $13.1 billion, an increase of $0.5 billion on FY14 primarily due to net flows, net new clients and improvements in equity markets.
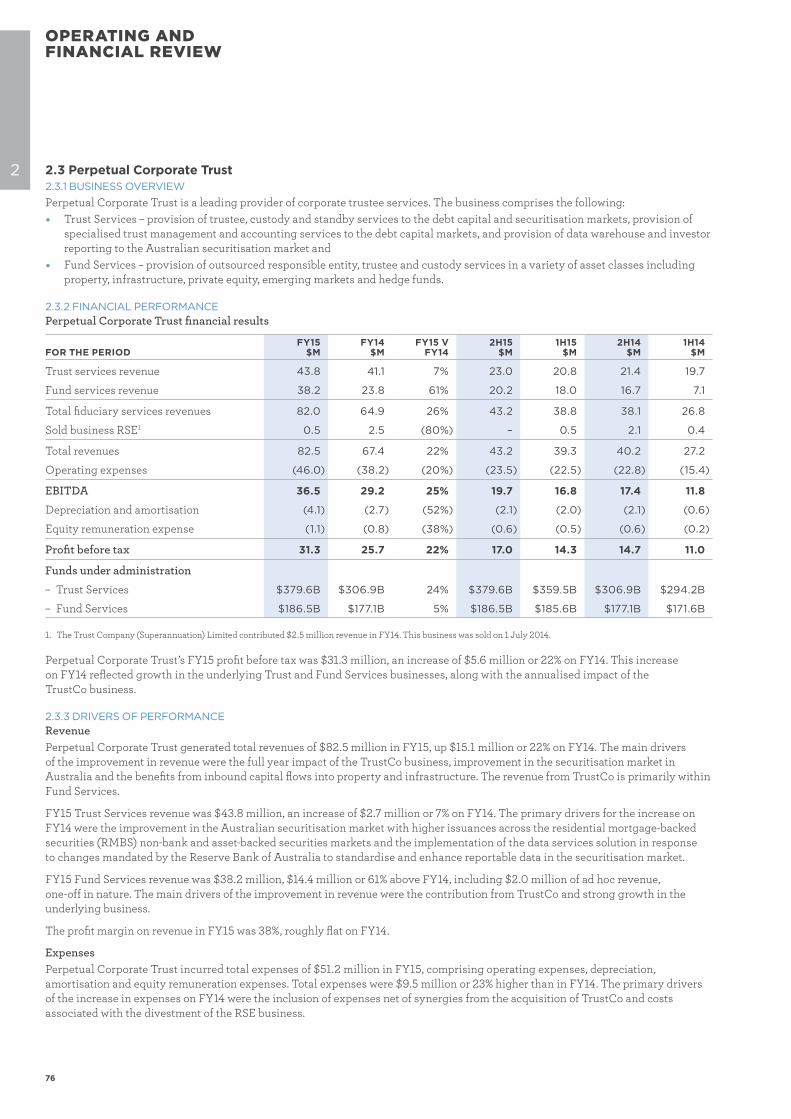
76
OPERATING AND FINANCIAL REVIEW
2 2.3 Perpetual Corporate Trust2.3.1 BUSINESS OVERVIEW Perpetual Corporate Trust is a leading provider of corporate trustee services. The business comprises the following: � Trust Services – provision of trustee, custody and standby services to the debt capital and securitisation markets, provision of
specialised trust management and accounting services to the debt capital markets, and provision of data warehouse and investor reporting to the Australian securitisation market and
� Fund Services – provision of outsourced responsible entity, trustee and custody services in a variety of asset classes including property, infrastructure, private equity, emerging markets and hedge funds.
2.3.2 FINANCIAL PERFORMANCEPerpetual Corporate Trust financial results
FOR THE PERIODFY15
$MFY14
$MFY15 V
FY142H15
$M1H15
$M2H14
$M1H14
$M
Trust services revenue 43.8 41.1 7% 23.0 20.8 21.4 19.7
Fund services revenue 38.2 23.8 61% 20.2 18.0 16.7 7.1
Total fiduciary services revenues 82.0 64.9 26% 43.2 38.8 38.1 26.8
Sold business RSE 1 0.5 2.5 (80%) – 0.5 2.1 0.4
Total revenues 82.5 67.4 22% 43.2 39.3 40.2 27.2
Operating expenses (46.0) (38.2) (20%) (23.5) (22.5) (22.8) (15.4)
EBITDA 36.5 29.2 25% 19.7 16.8 17.4 11.8
Depreciation and amortisation (4.1) (2.7) (52%) (2.1) (2.0) (2.1) (0.6)
Equity remuneration expense (1.1) (0.8) (38%) (0.6) (0.5) (0.6) (0.2)
Profit before tax 31.3 25.7 22% 17.0 14.3 14.7 11.0
Funds under administration
– Trust Services $379.6B $306.9B 24% $379.6B $359.5B $306.9B $294.2B
– Fund Services $186.5B $177.1B 5% $186.5B $185.6B $177.1B $171.6B
1. The Trust Company (Superannuation) Limited contributed $2.5 million revenue in FY14. This business was sold on 1 July 2014.
Perpetual Corporate Trust’s FY15 profit before tax was $31.3 million, an increase of $5.6 million or 22% on FY14. This increase on FY14 reflected growth in the underlying Trust and Fund Services businesses, along with the annualised impact of the TrustCo business.
2.3.3 DRIVERS OF PERFORMANCERevenuePerpetual Corporate Trust generated total revenues of $82.5 million in FY15, up $15.1 million or 22% on FY14. The main drivers of the improvement in revenue were the full year impact of the TrustCo business, improvement in the securitisation market in Australia and the benefits from inbound capital flows into property and infrastructure. The revenue from TrustCo is primarily within Fund Services.
FY15 Trust Services revenue was $43.8 million, an increase of $2.7 million or 7% on FY14. The primary drivers for the increase on FY14 were the improvement in the Australian securitisation market with higher issuances across the residential mortgage-backed securities (RMBS) non-bank and asset-backed securities markets and the implementation of the data services solution in response to changes mandated by the Reserve Bank of Australia to standardise and enhance reportable data in the securitisation market.
FY15 Fund Services revenue was $38.2 million, $14.4 million or 61% above FY14, including $2.0 million of ad hoc revenue, one-off in nature. The main drivers of the improvement in revenue were the contribution from TrustCo and strong growth in the underlying business.
The profit margin on revenue in FY15 was 38%, roughly flat on FY14.
ExpensesPerpetual Corporate Trust incurred total expenses of $51.2 million in FY15, comprising operating expenses, depreciation, amortisation and equity remuneration expenses. Total expenses were $9.5 million or 23% higher than in FY14. The primary drivers of the increase in expenses on FY14 were the inclusion of expenses net of synergies from the acquisition of TrustCo and costs associated with the divestment of the RSE business.
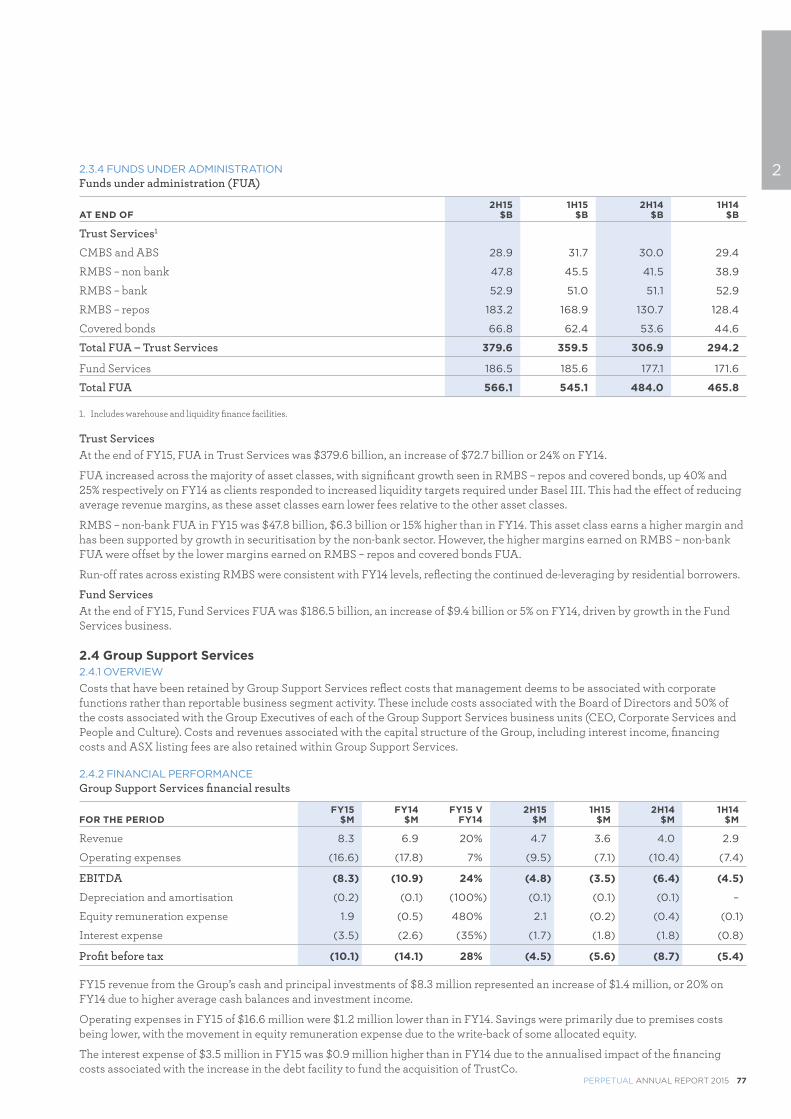
PERPETUAL ANNUAL REPORT 2015 77
22.3.4 FUNDS UNDER ADMINISTRATIONFunds under administration (FUA)
AT END OF2H15
$B1H15
$B2H14
$B1H14
$B
Trust Services1
CMBS and ABS 28.9 31.7 30.0 29.4
RMBS – non bank 47.8 45.5 41.5 38.9
RMBS – bank 52.9 51.0 51.1 52.9
RMBS – repos 183.2 168.9 130.7 128.4
Covered bonds 66.8 62.4 53.6 44.6
Total FUA – Trust Services 379.6 359.5 306.9 294.2
Fund Services 186.5 185.6 177.1 171.6
Total FUA 566.1 545.1 484.0 465.8
1. Includes warehouse and liquidity finance facilities.
Trust ServicesAt the end of FY15, FUA in Trust Services was $379.6 billion, an increase of $72.7 billion or 24% on FY14.
FUA increased across the majority of asset classes, with significant growth seen in RMBS – repos and covered bonds, up 40% and 25% respectively on FY14 as clients responded to increased liquidity targets required under Basel III. This had the effect of reducing average revenue margins, as these asset classes earn lower fees relative to the other asset classes.
RMBS – non-bank FUA in FY15 was $47.8 billion, $6.3 billion or 15% higher than in FY14. This asset class earns a higher margin and has been supported by growth in securitisation by the non-bank sector. However, the higher margins earned on RMBS – non-bank FUA were offset by the lower margins earned on RMBS – repos and covered bonds FUA.
Run-off rates across existing RMBS were consistent with FY14 levels, reflecting the continued de-leveraging by residential borrowers.
Fund ServicesAt the end of FY15, Fund Services FUA was $186.5 billion, an increase of $9.4 billion or 5% on FY14, driven by growth in the Fund Services business.
2.4 Group Support Services2.4.1 OVERVIEW
Costs that have been retained by Group Support Services reflect costs that management deems to be associated with corporate functions rather than reportable business segment activity. These include costs associated with the Board of Directors and 50% of the costs associated with the Group Executives of each of the Group Support Services business units (CEO, Corporate Services and People and Culture). Costs and revenues associated with the capital structure of the Group, including interest income, financing costs and ASX listing fees are also retained within Group Support Services.
2.4.2 FINANCIAL PERFORMANCEGroup Support Services financial results
FOR THE PERIODFY15
$MFY14
$MFY15 V
FY142H15
$M1H15
$M2H14
$M1H14
$M
Revenue 8.3 6.9 20% 4.7 3.6 4.0 2.9
Operating expenses (16.6) (17.8) 7% (9.5) (7.1) (10.4) (7.4)
EBITDA (8.3) (10.9) 24% (4.8) (3.5) (6.4) (4.5)
Depreciation and amortisation (0.2) (0.1) (100%) (0.1) (0.1) (0.1) –
Equity remuneration expense 1.9 (0.5) 480% 2.1 (0.2) (0.4) (0.1)
Interest expense (3.5) (2.6) (35%) (1.7) (1.8) (1.8) (0.8)
Profit before tax (10.1) (14.1) 28% (4.5) (5.6) (8.7) (5.4)
FY15 revenue from the Group’s cash and principal investments of $8.3 million represented an increase of $1.4 million, or 20% on FY14 due to higher average cash balances and investment income.
Operating expenses in FY15 of $16.6 million were $1.2 million lower than in FY14. Savings were primarily due to premises costs being lower, with the movement in equity remuneration expense due to the write-back of some allocated equity.
The interest expense of $3.5 million in FY15 was $0.9 million higher than in FY14 due to the annualised impact of the financing costs associated with the increase in the debt facility to fund the acquisition of TrustCo.
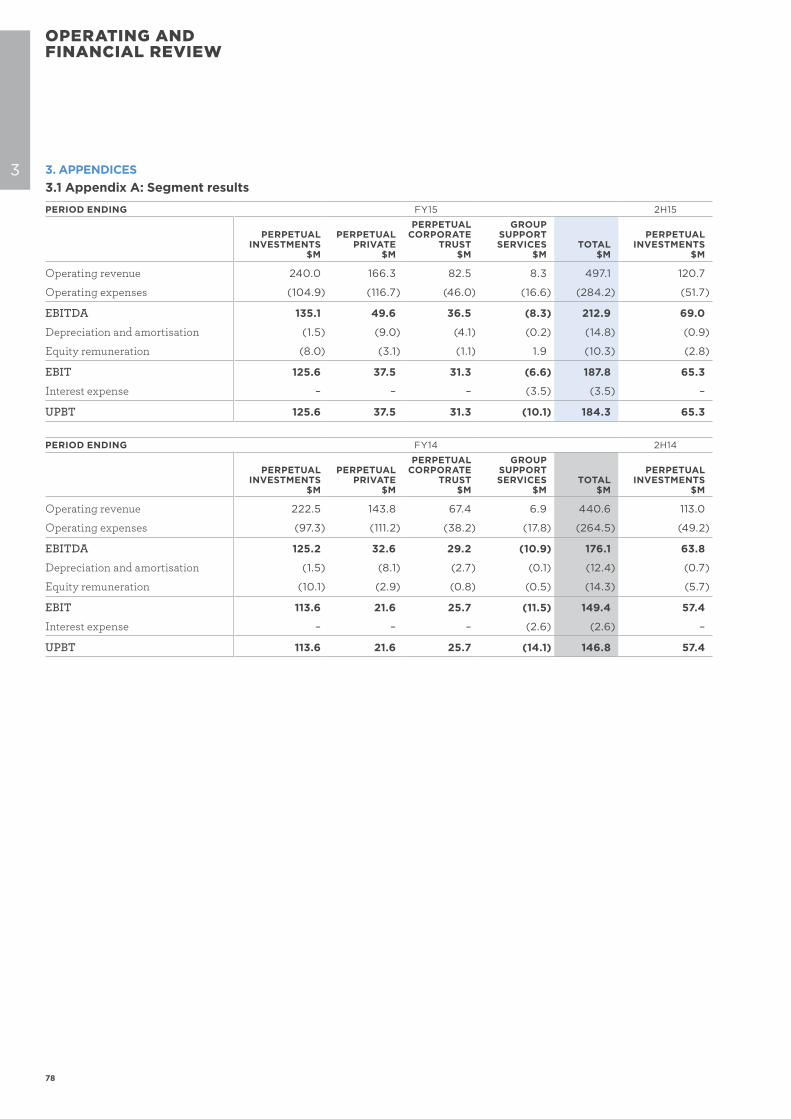
78
OPERATING AND FINANCIAL REVIEW
3 3. APPENDICES3.1 Appendix A: Segment results
PERIOD ENDING FY15 2H15 2H15 1H15
PERPETUAL INVESTMENTS
$M
PERPETUAL PRIVATE
$M
PERPETUAL CORPORATE
TRUST$M
GROUP SUPPORT SERVICES
$MTOTAL
$M
PERPETUAL INVESTMENTS
$M
PERPETUAL PRIVATE
$M
PERPETUAL CORPORATE
TRUST$M
GROUP SUPPORT SERVICES
$MTOTAL
$M
PERPETUAL INVESTMENTS
$M
PERPETUAL PRIVATE
$M
PERPETUAL CORPORATE
TRUST$M
GROUP SUPPORT SERVICES
$MTOTAL
$M
Operating revenue 240.0 166.3 82.5 8.3 497.1 120.7 84.0 43.2 4.7 252.6 119.3 82.3 39.3 3.6 244.5
Operating expenses (104.9) (116.7) (46.0) (16.6) (284.2) (51.7) (59.2) (23.5) (9.5) (143.9) (53.2) (57.5) (22.5) (7.1) (140.3)
EBITDA 135.1 49.6 36.5 (8.3) 212.9 69.0 24.8 19.7 (4.8) 108.7 66.1 24.8 16.8 (3.5) 104.2
Depreciation and amortisation (1.5) (9.0) (4.1) (0.2) (14.8) (0.9) (4.5) (2.1) (0.1) (7.6) (0.6) (4.5) (2.0) (0.1) (7.2)
Equity remuneration (8.0) (3.1) (1.1) 1.9 (10.3) (2.8) (1.7) (0.6) 2.1 (3.0) (5.2) (1.4) (0.5) (0.2) (7.3)
EBIT 125.6 37.5 31.3 (6.6) 187.8 65.3 18.6 17.0 (2.8) 98.1 60.3 18.9 14.3 (3.8) 89.7
Interest expense – – – (3.5) (3.5) – – – (1.7) (1.7) – – – (1.8) (1.8)
UPBT 125.6 37.5 31.3 (10.1) 184.3 65.3 18.6 17.0 (4.5) 96.4 60.3 18.9 14.3 (5.6) 87.9
PERIOD ENDING FY14 2H14 2H14 1H14
PERPETUAL INVESTMENTS
$M
PERPETUAL PRIVATE
$M
PERPETUAL CORPORATE
TRUST$M
GROUP SUPPORT SERVICES
$MTOTAL
$M
PERPETUAL INVESTMENTS
$M
PERPETUAL PRIVATE
$M
PERPETUAL CORPORATE
TRUST$M
GROUP SUPPORT SERVICES
$MTOTAL
$M
PERPETUAL INVESTMENTS
$M
PERPETUAL PRIVATE
$M
PERPETUAL CORPORATE
TRUST$M
GROUP SUPPORT SERVICES
$MTOTAL
$M
Operating revenue 222.5 143.8 67.4 6.9 440.6 113.0 81.3 40.2 4.0 238.5 109.5 62.5 27.2 2.9 202.1
Operating expenses (97.3) (111.2) (38.2) (17.8) (264.5) (49.2) (58.9) (22.8) (10.4) (141.3) (48.1) (52.3) (15.4) (7.4) (123.2)
EBITDA 125.2 32.6 29.2 (10.9) 176.1 63.8 22.4 17.4 (6.4) 97.2 61.4 10.2 11.8 (4.5) 78.9
Depreciation and amortisation (1.5) (8.1) (2.7) (0.1) (12.4) (0.7) (4.4) (2.1) (0.1) (7.3) (0.8) (3.7) (0.6) – (5.1)
Equity remuneration (10.1) (2.9) (0.8) (0.5) (14.3) (5.7) (1.7) (0.6) (0.4) (8.4) (4.4) (1.2) (0.2) (0.1) (5.9)
EBIT 113.6 21.6 25.7 (11.5) 149.4 57.4 16.3 14.7 (6.9) 81.5 56.2 5.3 11.0 (4.6) 67.9
Interest expense – – – (2.6) (2.6) – – – (1.8) (1.8) – – – (0.8) (0.8)
UPBT 113.6 21.6 25.7 (14.1) 146.8 57.4 16.3 14.7 (8.7) 79.7 56.2 5.3 11.0 (5.4) 67.1
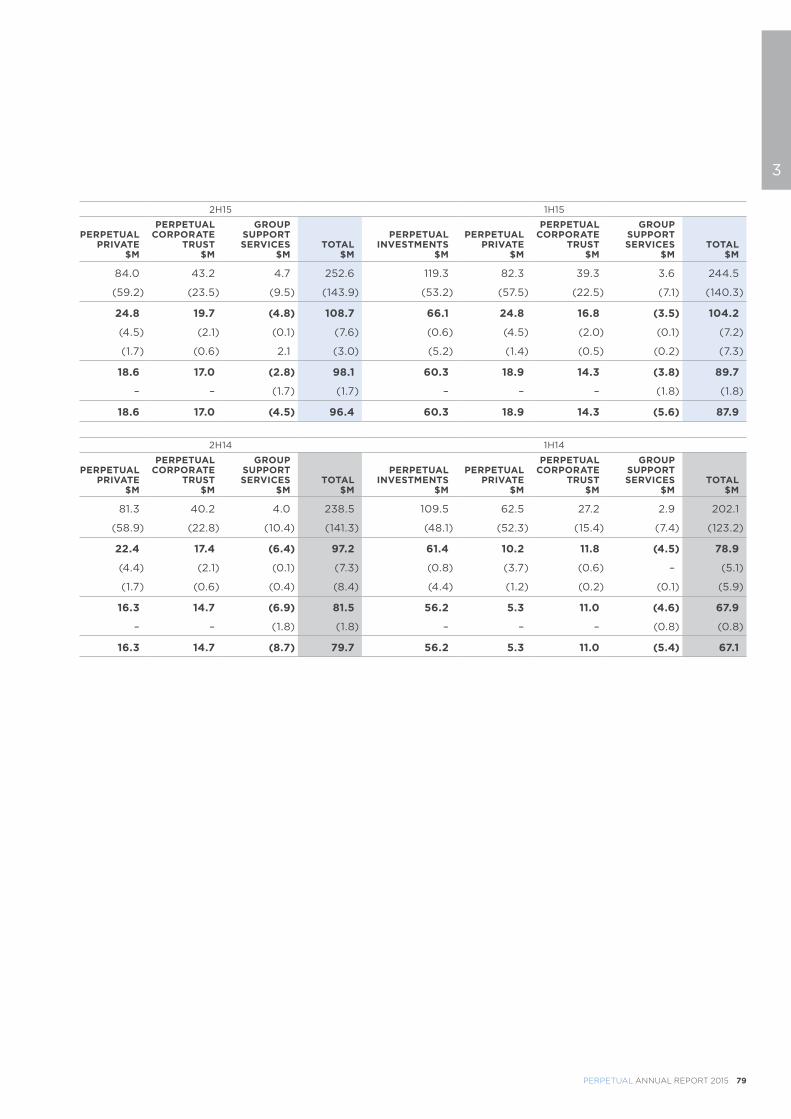
PERPETUAL ANNUAL REPORT 2015 79
33. APPENDICES3.1 Appendix A: Segment results
PERIOD ENDING FY15 2H15 2H15 1H15
PERPETUAL INVESTMENTS
$M
PERPETUAL PRIVATE
$M
PERPETUAL CORPORATE
TRUST$M
GROUP SUPPORT SERVICES
$MTOTAL
$M
PERPETUAL INVESTMENTS
$M
PERPETUAL PRIVATE
$M
PERPETUAL CORPORATE
TRUST$M
GROUP SUPPORT SERVICES
$MTOTAL
$M
PERPETUAL INVESTMENTS
$M
PERPETUAL PRIVATE
$M
PERPETUAL CORPORATE
TRUST$M
GROUP SUPPORT SERVICES
$MTOTAL
$M
Operating revenue 240.0 166.3 82.5 8.3 497.1 120.7 84.0 43.2 4.7 252.6 119.3 82.3 39.3 3.6 244.5
Operating expenses (104.9) (116.7) (46.0) (16.6) (284.2) (51.7) (59.2) (23.5) (9.5) (143.9) (53.2) (57.5) (22.5) (7.1) (140.3)
EBITDA 135.1 49.6 36.5 (8.3) 212.9 69.0 24.8 19.7 (4.8) 108.7 66.1 24.8 16.8 (3.5) 104.2
Depreciation and amortisation (1.5) (9.0) (4.1) (0.2) (14.8) (0.9) (4.5) (2.1) (0.1) (7.6) (0.6) (4.5) (2.0) (0.1) (7.2)
Equity remuneration (8.0) (3.1) (1.1) 1.9 (10.3) (2.8) (1.7) (0.6) 2.1 (3.0) (5.2) (1.4) (0.5) (0.2) (7.3)
EBIT 125.6 37.5 31.3 (6.6) 187.8 65.3 18.6 17.0 (2.8) 98.1 60.3 18.9 14.3 (3.8) 89.7
Interest expense – – – (3.5) (3.5) – – – (1.7) (1.7) – – – (1.8) (1.8)
UPBT 125.6 37.5 31.3 (10.1) 184.3 65.3 18.6 17.0 (4.5) 96.4 60.3 18.9 14.3 (5.6) 87.9
PERIOD ENDING FY14 2H14 2H14 1H14
PERPETUAL INVESTMENTS
$M
PERPETUAL PRIVATE
$M
PERPETUAL CORPORATE
TRUST$M
GROUP SUPPORT SERVICES
$MTOTAL
$M
PERPETUAL INVESTMENTS
$M
PERPETUAL PRIVATE
$M
PERPETUAL CORPORATE
TRUST$M
GROUP SUPPORT SERVICES
$MTOTAL
$M
PERPETUAL INVESTMENTS
$M
PERPETUAL PRIVATE
$M
PERPETUAL CORPORATE
TRUST$M
GROUP SUPPORT SERVICES
$MTOTAL
$M
Operating revenue 222.5 143.8 67.4 6.9 440.6 113.0 81.3 40.2 4.0 238.5 109.5 62.5 27.2 2.9 202.1
Operating expenses (97.3) (111.2) (38.2) (17.8) (264.5) (49.2) (58.9) (22.8) (10.4) (141.3) (48.1) (52.3) (15.4) (7.4) (123.2)
EBITDA 125.2 32.6 29.2 (10.9) 176.1 63.8 22.4 17.4 (6.4) 97.2 61.4 10.2 11.8 (4.5) 78.9
Depreciation and amortisation (1.5) (8.1) (2.7) (0.1) (12.4) (0.7) (4.4) (2.1) (0.1) (7.3) (0.8) (3.7) (0.6) – (5.1)
Equity remuneration (10.1) (2.9) (0.8) (0.5) (14.3) (5.7) (1.7) (0.6) (0.4) (8.4) (4.4) (1.2) (0.2) (0.1) (5.9)
EBIT 113.6 21.6 25.7 (11.5) 149.4 57.4 16.3 14.7 (6.9) 81.5 56.2 5.3 11.0 (4.6) 67.9
Interest expense – – – (2.6) (2.6) – – – (1.8) (1.8) – – – (0.8) (0.8)
UPBT 113.6 21.6 25.7 (14.1) 146.8 57.4 16.3 14.7 (8.7) 79.7 56.2 5.3 11.0 (5.4) 67.1
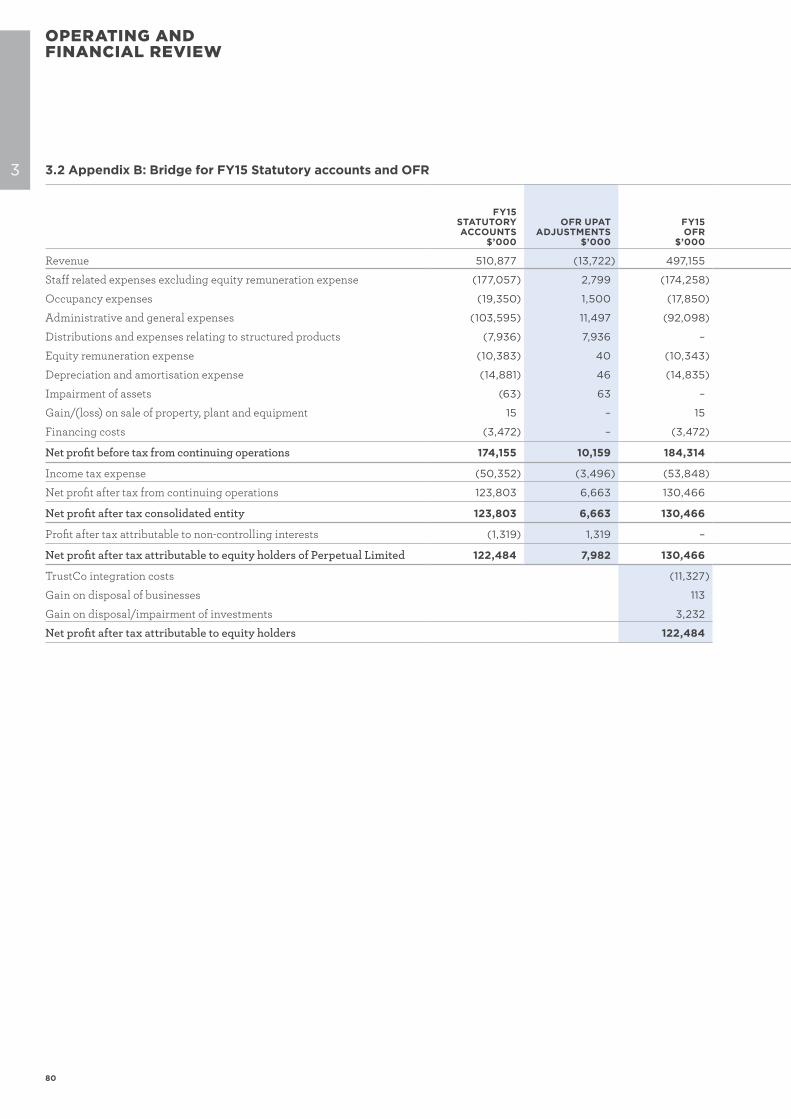
80
OPERATING AND FINANCIAL REVIEW
3 3.2 Appendix B: Bridge for FY15 Statutory accounts and OFR
FY15STATUTORYACCOUNTS
$’000
OFR UPAT ADJUSTMENTS
$’000
FY15OFR
$’000EMCF$’000
GAIN ON DISPOSAL
OF BUSINESSES
$’000
GAIN ON DISPOSAL/
IMPAIRMENT OF
INVESTMENTS$’000
TRUST COMPANY
INTEGRATION COSTS
$’000
TOTAL ADJUSTMENTS
$’000
Revenue 510,877 (13,722) 497,155 (7,936) (113) (5,673) (13,722)
Staff related expenses excluding equity remuneration expense (177,057) 2,799 (174,258) 2,799 2,799
Occupancy expenses (19,350) 1,500 (17,850) 1,500 1,500
Administrative and general expenses (103,595) 11,497 (92,098) 11,497 11,497
Distributions and expenses relating to structured products (7,936) 7,936 – 7,936 7,936
Equity remuneration expense (10,383) 40 (10,343) 40 40
Depreciation and amortisation expense (14,881) 46 (14,835) 46 46
Impairment of assets (63) 63 – 63 63
Gain/(loss) on sale of property, plant and equipment 15 – 15 –
Financing costs (3,472) – (3,472) –
Net profit before tax from continuing operations 174,155 10,159 184,314 – (113) (5,610) 15,882 10,159
Income tax expense (50,352) (3,496) (53,848) 1,059 (4,555) (3,496)
Net profit after tax from continuing operations 123,803 6,663 130,466 – (113) (4,551) 11,327 6,663
Net profit after tax consolidated entity 123,803 6,663 130,466 – (113) (4,551) 11,327 6,663
Profit after tax attributable to non-controlling interests (1,319) 1,319 – 1,319 1,319
Net profit after tax attributable to equity holders of Perpetual Limited 122,484 7,982 130,466 – (113) (3,232) 11,327 7,982
TrustCo integration costs (11,327)
Gain on disposal of businesses 113
Gain on disposal/impairment of investments 3,232
Net profit after tax attributable to equity holders 122,484
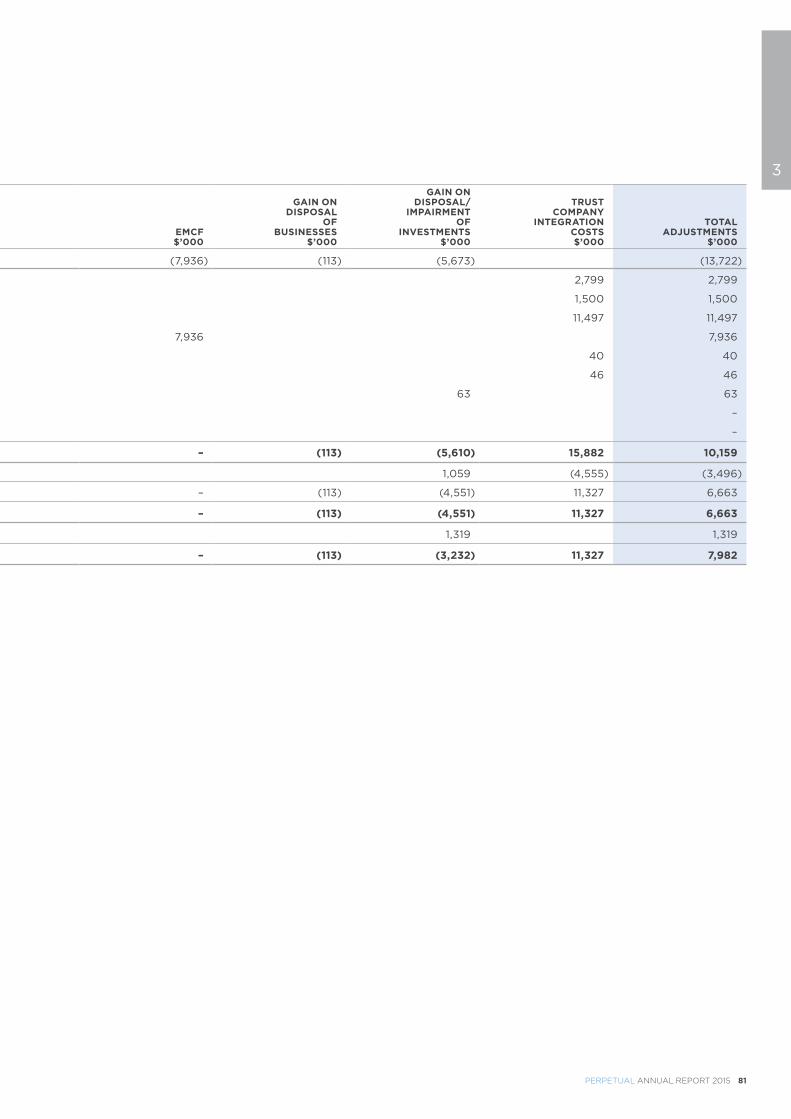
PERPETUAL ANNUAL REPORT 2015 81
33.2 Appendix B: Bridge for FY15 Statutory accounts and OFR
FY15STATUTORYACCOUNTS
$’000
OFR UPAT ADJUSTMENTS
$’000
FY15OFR
$’000EMCF$’000
GAIN ON DISPOSAL
OF BUSINESSES
$’000
GAIN ON DISPOSAL/
IMPAIRMENT OF
INVESTMENTS$’000
TRUST COMPANY
INTEGRATION COSTS
$’000
TOTAL ADJUSTMENTS
$’000
Revenue 510,877 (13,722) 497,155 (7,936) (113) (5,673) (13,722)
Staff related expenses excluding equity remuneration expense (177,057) 2,799 (174,258) 2,799 2,799
Occupancy expenses (19,350) 1,500 (17,850) 1,500 1,500
Administrative and general expenses (103,595) 11,497 (92,098) 11,497 11,497
Distributions and expenses relating to structured products (7,936) 7,936 – 7,936 7,936
Equity remuneration expense (10,383) 40 (10,343) 40 40
Depreciation and amortisation expense (14,881) 46 (14,835) 46 46
Impairment of assets (63) 63 – 63 63
Gain/(loss) on sale of property, plant and equipment 15 – 15 –
Financing costs (3,472) – (3,472) –
Net profit before tax from continuing operations 174,155 10,159 184,314 – (113) (5,610) 15,882 10,159
Income tax expense (50,352) (3,496) (53,848) 1,059 (4,555) (3,496)
Net profit after tax from continuing operations 123,803 6,663 130,466 – (113) (4,551) 11,327 6,663
Net profit after tax consolidated entity 123,803 6,663 130,466 – (113) (4,551) 11,327 6,663
Profit after tax attributable to non-controlling interests (1,319) 1,319 – 1,319 1,319
Net profit after tax attributable to equity holders of Perpetual Limited 122,484 7,982 130,466 – (113) (3,232) 11,327 7,982
TrustCo integration costs (11,327)
Gain on disposal of businesses 113
Gain on disposal/impairment of investments 3,232
Net profit after tax attributable to equity holders 122,484
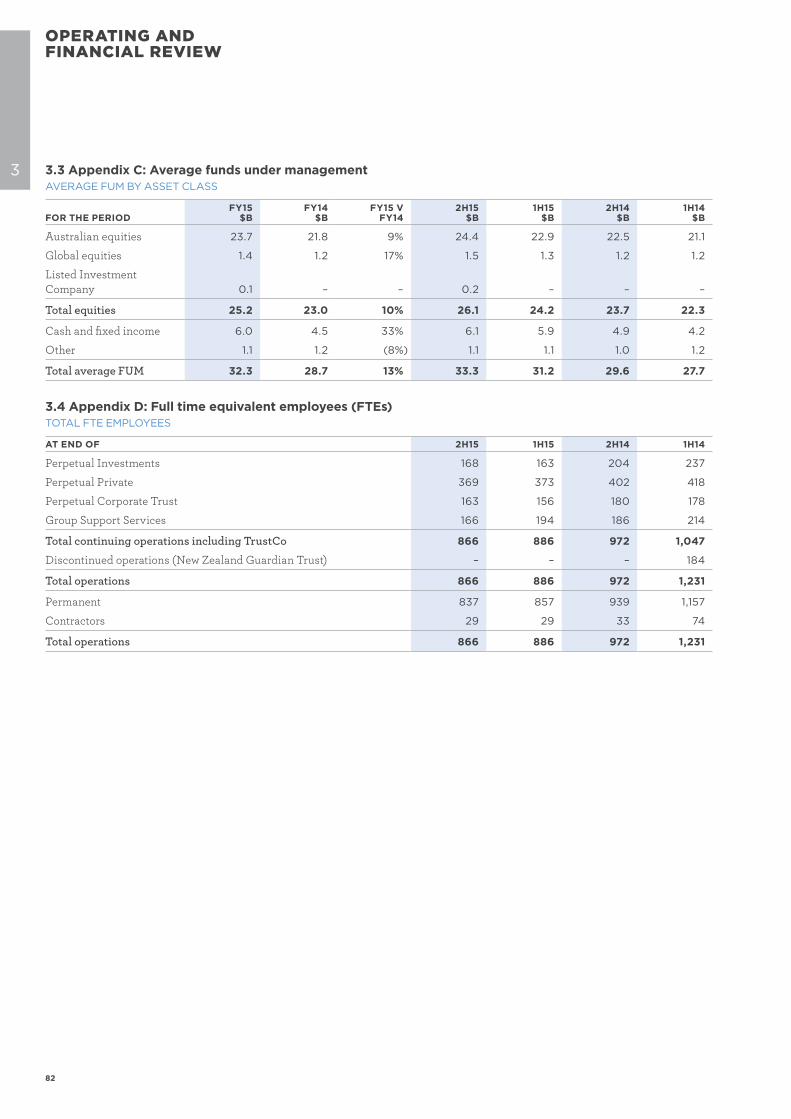
82
OPERATING AND FINANCIAL REVIEW
3 3.3 Appendix C: Average funds under managementAVERAGE FUM BY ASSET CLASS
FOR THE PERIODFY15
$BFY14
$BFY15 V
FY142H15
$B1H15
$B2H14
$B1H14
$B
Australian equities 23.7 21.8 9% 24.4 22.9 22.5 21.1
Global equities 1.4 1.2 17% 1.5 1.3 1.2 1.2
Listed Investment Company 0.1 – – 0.2 – – –
Total equities 25.2 23.0 10% 26.1 24.2 23.7 22.3
Cash and fixed income 6.0 4.5 33% 6.1 5.9 4.9 4.2
Other 1.1 1.2 (8%) 1.1 1.1 1.0 1.2
Total average FUM 32.3 28.7 13% 33.3 31.2 29.6 27.7
3.4 Appendix D: Full time equivalent employees (FTEs)TOTAL FTE EMPLOYEES
AT END OF 2H15 1H15 2H14 1H14
Perpetual Investments 168 163 204 237
Perpetual Private 369 373 402 418
Perpetual Corporate Trust 163 156 180 178
Group Support Services 166 194 186 214
Total continuing operations including TrustCo 866 886 972 1,047
Discontinued operations (New Zealand Guardian Trust) – – – 184
Total operations 866 886 972 1,231
Permanent 837 857 939 1,157
Contractors 29 29 33 74
Total operations 866 886 972 1,231
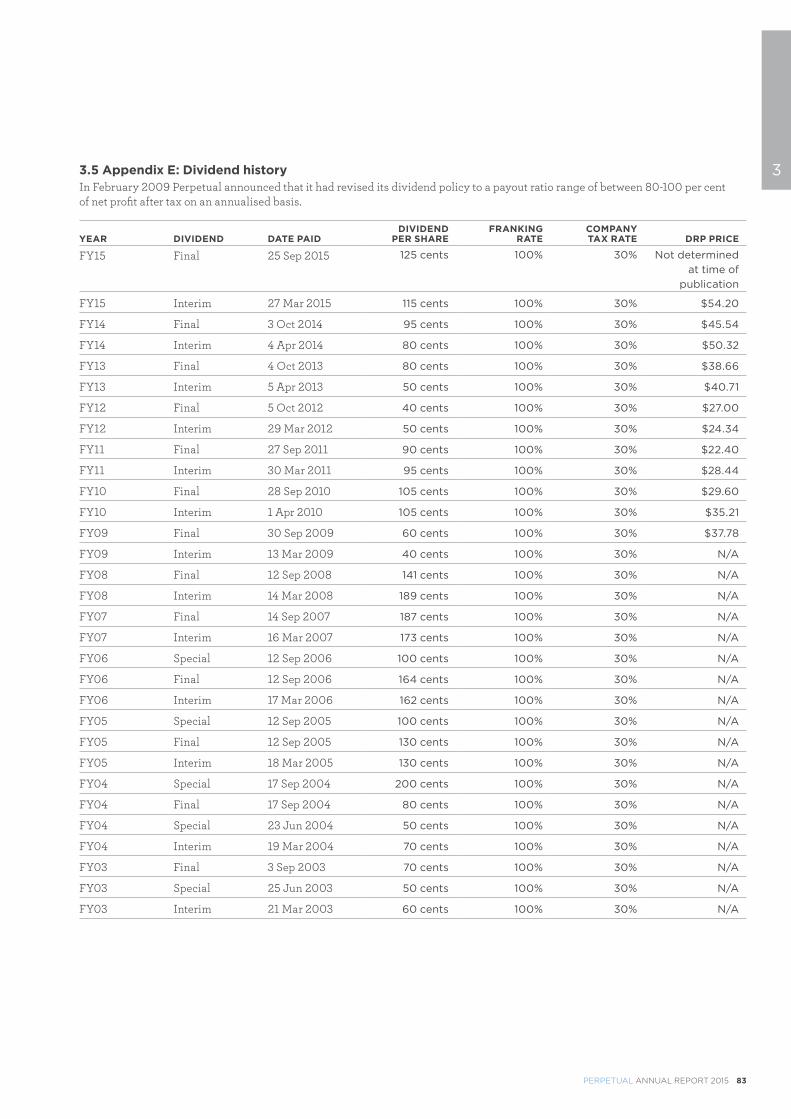
PERPETUAL ANNUAL REPORT 2015 83
33.5 Appendix E: Dividend historyIn February 2009 Perpetual announced that it had revised its dividend policy to a payout ratio range of between 80-100 per cent of net profit after tax on an annualised basis.
YEAR DIVIDEND DATE PAIDDIVIDEND
PER SHAREFRANKING
RATECOMPANYTAX RATE DRP PRICE
FY15 Final 25 Sep 2015 125 cents 100% 30% Not determined at time of
publication
FY15 Interim 27 Mar 2015 115 cents 100% 30% $54.20
FY14 Final 3 Oct 2014 95 cents 100% 30% $45.54
FY14 Interim 4 Apr 2014 80 cents 100% 30% $50.32
FY13 Final 4 Oct 2013 80 cents 100% 30% $38.66
FY13 Interim 5 Apr 2013 50 cents 100% 30% $40.71
FY12 Final 5 Oct 2012 40 cents 100% 30% $27.00
FY12 Interim 29 Mar 2012 50 cents 100% 30% $24.34
FY11 Final 27 Sep 2011 90 cents 100% 30% $22.40
FY11 Interim 30 Mar 2011 95 cents 100% 30% $28.44
FY10 Final 28 Sep 2010 105 cents 100% 30% $29.60
FY10 Interim 1 Apr 2010 105 cents 100% 30% $35.21
FY09 Final 30 Sep 2009 60 cents 100% 30% $37.78
FY09 Interim 13 Mar 2009 40 cents 100% 30% N/A
FY08 Final 12 Sep 2008 141 cents 100% 30% N/A
FY08 Interim 14 Mar 2008 189 cents 100% 30% N/A
FY07 Final 14 Sep 2007 187 cents 100% 30% N/A
FY07 Interim 16 Mar 2007 173 cents 100% 30% N/A
FY06 Special 12 Sep 2006 100 cents 100% 30% N/A
FY06 Final 12 Sep 2006 164 cents 100% 30% N/A
FY06 Interim 17 Mar 2006 162 cents 100% 30% N/A
FY05 Special 12 Sep 2005 100 cents 100% 30% N/A
FY05 Final 12 Sep 2005 130 cents 100% 30% N/A
FY05 Interim 18 Mar 2005 130 cents 100% 30% N/A
FY04 Special 17 Sep 2004 200 cents 100% 30% N/A
FY04 Final 17 Sep 2004 80 cents 100% 30% N/A
FY04 Special 23 Jun 2004 50 cents 100% 30% N/A
FY04 Interim 19 Mar 2004 70 cents 100% 30% N/A
FY03 Final 3 Sep 2003 70 cents 100% 30% N/A
FY03 Special 25 Jun 2003 50 cents 100% 30% N/A
FY03 Interim 21 Mar 2003 60 cents 100% 30% N/A
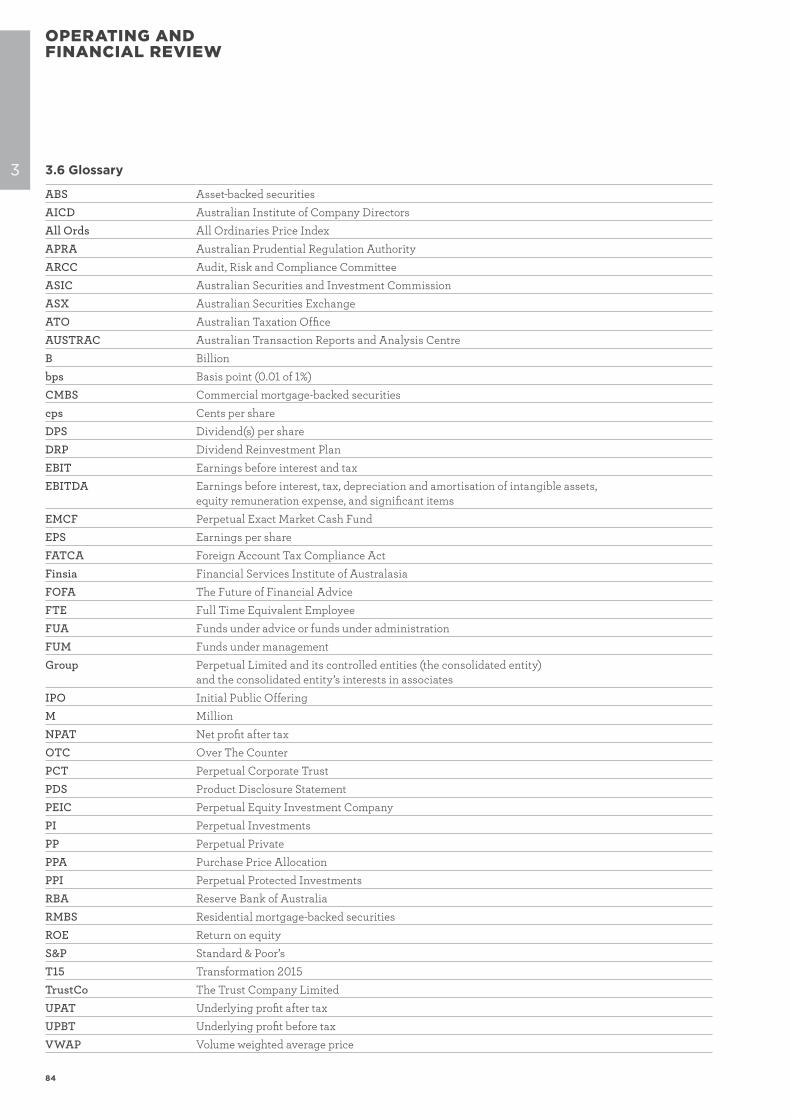
84
OPERATING AND FINANCIAL REVIEW
3.6 Glossary
ABS Asset-backed securities
AICD Australian Institute of Company Directors
All Ords All Ordinaries Price Index
APRA Australian Prudential Regulation Authority
ARCC Audit, Risk and Compliance Committee
ASIC Australian Securities and Investment Commission
ASX Australian Securities Exchange
ATO Australian Taxation Office
AUSTRAC Australian Transaction Reports and Analysis Centre
B Billion
bps Basis point (0.01 of 1%)
CMBS Commercial mortgage-backed securities
cps Cents per share
DPS Dividend(s) per share
DRP Dividend Reinvestment Plan
EBIT Earnings before interest and tax
EBITDA Earnings before interest, tax, depreciation and amortisation of intangible assets, equity remuneration expense, and significant items
EMCF Perpetual Exact Market Cash Fund
EPS Earnings per share
FATCA Foreign Account Tax Compliance Act
Finsia Financial Services Institute of Australasia
FOFA The Future of Financial Advice
FTE Full Time Equivalent Employee
FUA Funds under advice or funds under administration
FUM Funds under management
Group Perpetual Limited and its controlled entities (the consolidated entity) and the consolidated entity’s interests in associates
IPO Initial Public Offering
M Million
NPAT Net profit after tax
OTC Over The Counter
PCT Perpetual Corporate Trust
PDS Product Disclosure Statement
PEIC Perpetual Equity Investment Company
PI Perpetual Investments
PP Perpetual Private
PPA Purchase Price Allocation
PPI Perpetual Protected Investments
RBA Reserve Bank of Australia
RMBS Residential mortgage-backed securities
ROE Return on equity
S&P Standard & Poor’s
T15 Transformation 2015
TrustCo The Trust Company Limited
UPAT Underlying profit after tax
UPBT Underlying profit before tax
VWAP Volume weighted average price
3

FINANCIAL REPORT
PERPETUAL ANNUAL REPORT 2015 85
86
FINANCIAL REPORT
Financial Statements of Perpetual Limited and its controlled entitiesFor the year ended 30 June 2015
TABLE OF CONTENTSPrimary statements Consolidated Statement of Profit or Loss and Other Comprehensive Income 87Consolidated Statement of Financial Position 88Consolidated Statement of Changes in Equity 89Consolidated Statement of Cash Flows 90
Notes to and forming part of the financial statementsSection 1 Group performance 911-1 Operating segments 911-2 Revenue 941-3 Expenses 941-4 Income taxes 951-5 Earnings per share 971-6 Dividends 981-7 Net cash from operating activities 99
Section 2 Operating assets and liabilities 1002-1 Business combinations 1002-2 Receivables 1012-3 Other financial assets 1022-4 Property, plant and equipment 1022-5 Intangibles 1032-6 Provisions 1052-7 Employee benefits 106
Section 3 Capital management and financing 1073-1 Cash and cash equivalents 1073-2 Borrowings 1073-3 Contributed equity 1083-4 Reserves 1083-5 Commitments and contingencies 109
Section 4 Risk management 1104-1 Financial risk management 110
Section 5 Other disclosures 1185-1 Structured products assets and liabilities 1185-2 Parent entity disclosures 1215-3 Controlled entities 1225-4 Unconsolidated structured entities 1245-5 Non-controlling interest 1255-6 Share-based payments 1255-7 Key management personnel and related parties 1295-8 Auditor’s remuneration 1295-9 Assets and liabilities held for sale 1305-10 Discontinued operations 1305-11 Subsequent events 130
Section 6 Basis of preparation 1316-1 Reporting entity 1316-2 Basis of preparation 1316-3 Other significant accounting policies 1326-4 New standards and interpretations not yet adopted 135
Directors’ declaration 136Independent auditor’s report to the members of Perpetual Limited 137
Additional information Securities exchange and investor information 139
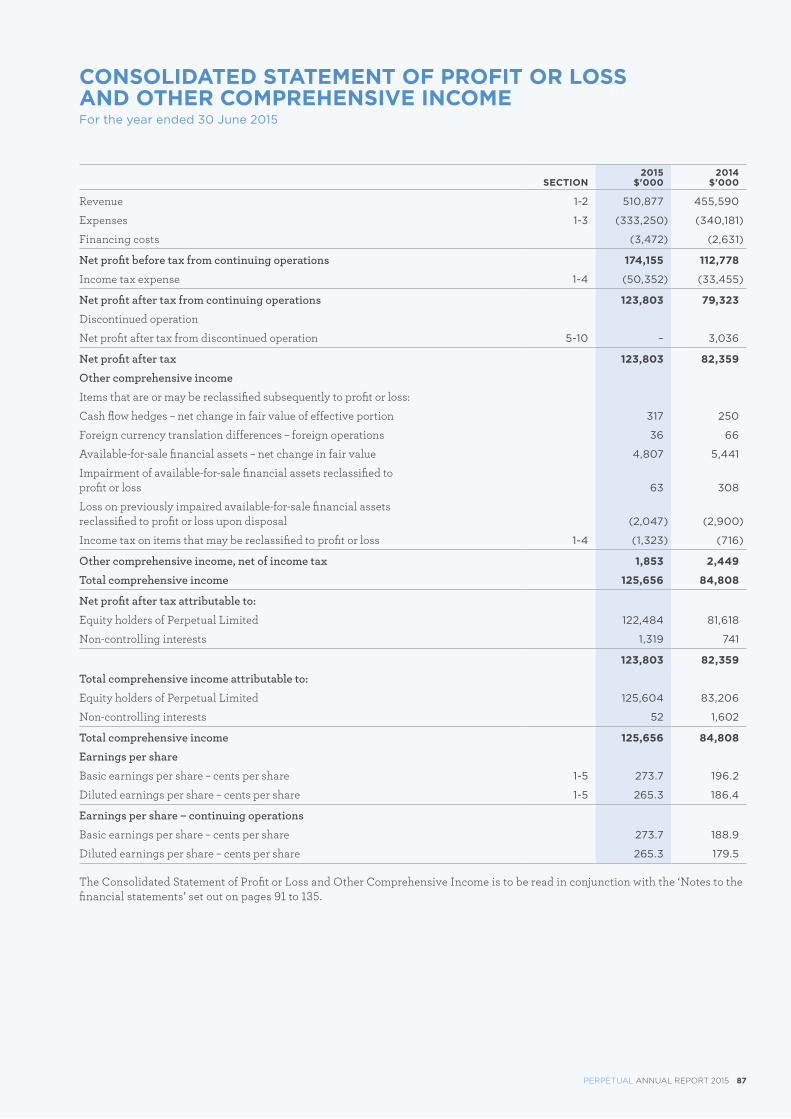
PERPETUAL ANNUAL REPORT 2015 87
CONSOLIDATED STATEMENT OF PROFIT OR LOSS AND OTHER COMPREHENSIVE INCOMEFor the year ended 30 June 2015
SECTION2015
$'0002014
$'000
Revenue 1-2 510,877 455,590
Expenses 1-3 (333,250) (340,181)
Financing costs (3,472) (2,631)
Net profit before tax from continuing operations 174,155 112,778
Income tax expense 1-4 (50,352) (33,455)
Net profit after tax from continuing operations 123,803 79,323
Discontinued operation
Net profit after tax from discontinued operation 5-10 – 3,036
Net profit after tax 123,803 82,359
Other comprehensive income
Items that are or may be reclassified subsequently to profit or loss:
Cash flow hedges – net change in fair value of effective portion 317 250
Foreign currency translation differences – foreign operations 36 66
Available-for-sale financial assets – net change in fair value 4,807 5,441
Impairment of available-for-sale financial assets reclassified toprofit or loss 63 308
Loss on previously impaired available-for-sale financial assets reclassified to profit or loss upon disposal (2,047) (2,900)
Income tax on items that may be reclassified to profit or loss 1-4 (1,323) (716)
Other comprehensive income, net of income tax 1,853 2,449
Total comprehensive income 125,656 84,808
Net profit after tax attributable to:
Equity holders of Perpetual Limited 122,484 81,618
Non-controlling interests 1,319 741
123,803 82,359
Total comprehensive income attributable to:
Equity holders of Perpetual Limited 125,604 83,206
Non-controlling interests 52 1,602
Total comprehensive income 125,656 84,808
Earnings per share
Basic earnings per share – cents per share 1-5 273.7 196.2
Diluted earnings per share – cents per share 1-5 265.3 186.4
Earnings per share – continuing operations
Basic earnings per share – cents per share 273.7 188.9
Diluted earnings per share – cents per share 265.3 179.5
The Consolidated Statement of Profit or Loss and Other Comprehensive Income is to be read in conjunction with the ‘Notes to the financial statements’ set out on pages 91 to 135.
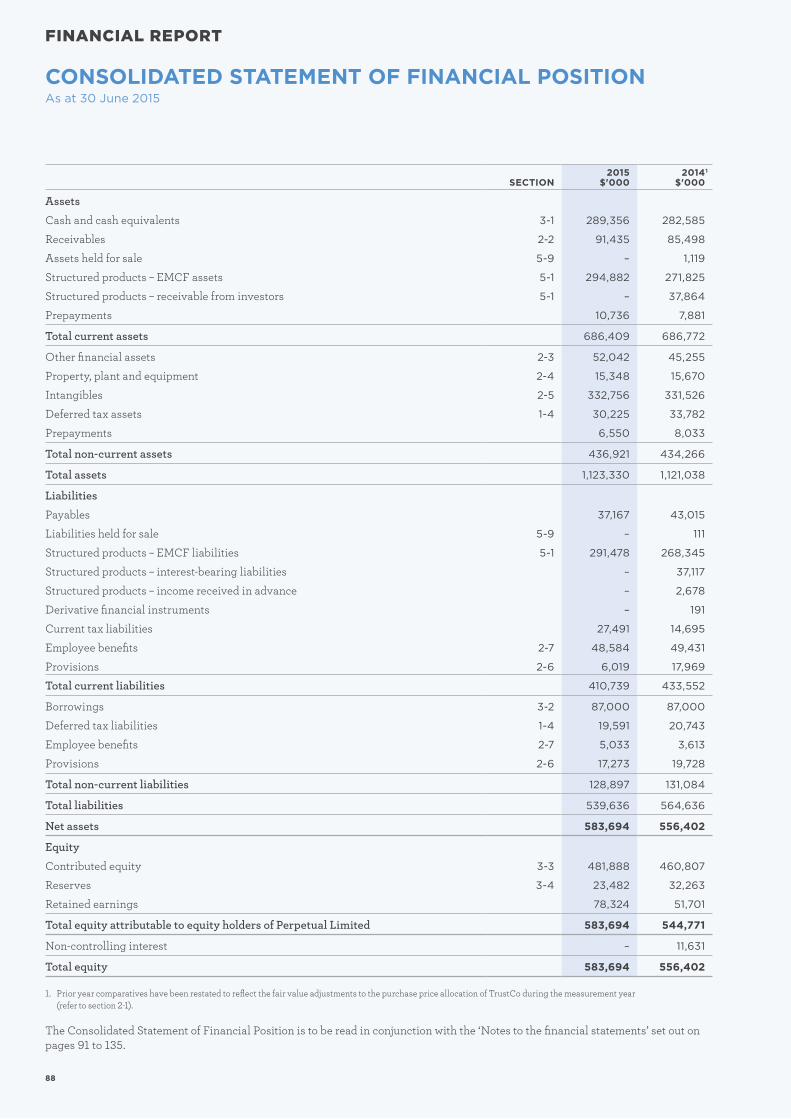
88
FINANCIAL REPORT
CONSOLIDATED STATEMENT OF FINANCIAL POSITION As at 30 June 2015
SECTION2015
$'0002014 1
$'000
Assets
Cash and cash equivalents 3-1 289,356 282,585
Receivables 2-2 91,435 85,498
Assets held for sale 5-9 – 1,119
Structured products – EMCF assets 5-1 294,882 271,825
Structured products – receivable from investors 5-1 – 37,864
Prepayments 10,736 7,881
Total current assets 686,409 686,772
Other financial assets 2-3 52,042 45,255
Property, plant and equipment 2-4 15,348 15,670
Intangibles 2-5 332,756 331,526
Deferred tax assets 1-4 30,225 33,782
Prepayments 6,550 8,033
Total non-current assets 436,921 434,266
Total assets 1,123,330 1,121,038
Liabilities
Payables 37,167 43,015
Liabilities held for sale 5-9 – 111
Structured products – EMCF liabilities 5-1 291,478 268,345
Structured products – interest-bearing liabilities – 37,117
Structured products – income received in advance – 2,678
Derivative financial instruments – 191
Current tax liabilities 27,491 14,695
Employee benefits 2-7 48,584 49,431
Provisions 2-6 6,019 17,969
Total current liabilities 410,739 433,552
Borrowings 3-2 87,000 87,000
Deferred tax liabilities 1-4 19,591 20,743
Employee benefits 2-7 5,033 3,613
Provisions 2-6 17,273 19,728
Total non-current liabilities 128,897 131,084
Total liabilities 539,636 564,636
Net assets 583,694 556,402
Equity
Contributed equity 3-3 481,888 460,807
Reserves 3-4 23,482 32,263
Retained earnings 78,324 51,701
Total equity attributable to equity holders of Perpetual Limited 583,694 544,771
Non-controlling interest – 11,631
Total equity 583,694 556,402
1. Prior year comparatives have been restated to reflect the fair value adjustments to the purchase price allocation of TrustCo during the measurement year (refer to section 2-1).
The Consolidated Statement of Financial Position is to be read in conjunction with the ‘Notes to the financial statements’ set out on pages 91 to 135.
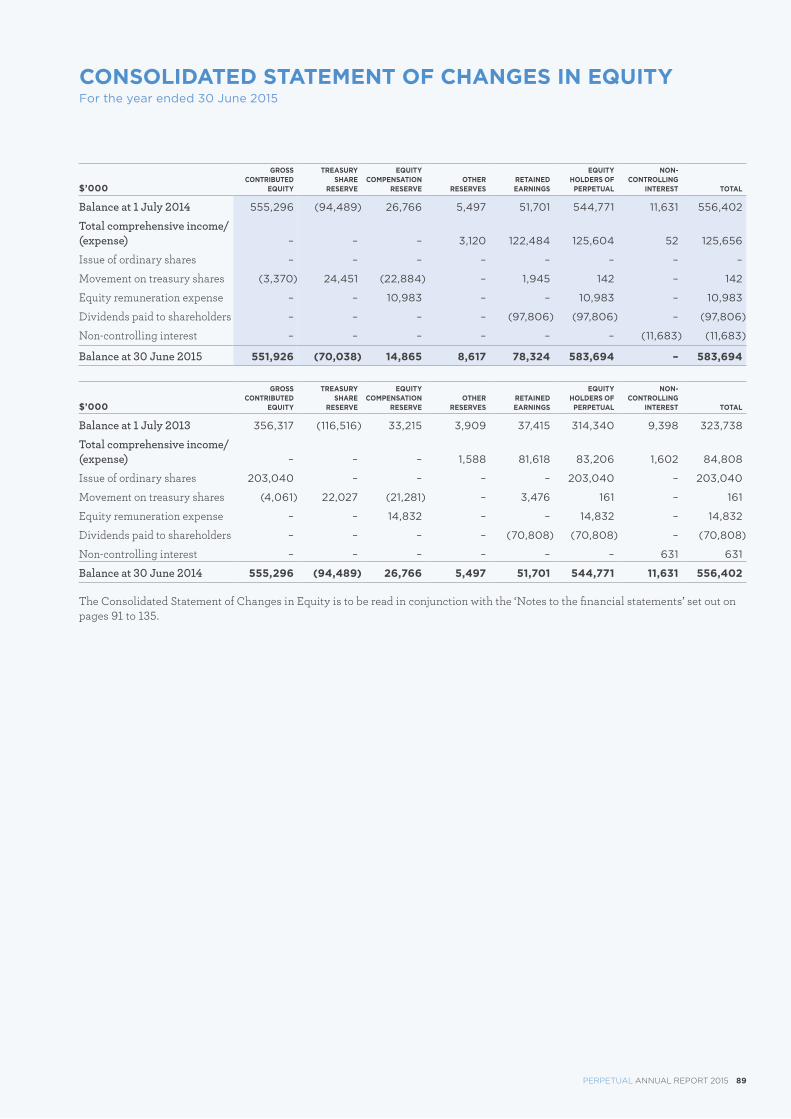
PERPETUAL ANNUAL REPORT 2015 89
CONSOLIDATED STATEMENT OF CHANGES IN EQUITY For the year ended 30 June 2015
$’000
GROSS CONTRIBUTED
EQUITY
TREASURY SHARE
RESERVE
EQUITY COMPENSATION
RESERVEOTHER
RESERVESRETAINED
EARNINGS
EQUITY HOLDERS OF PERPETUAL
NON- CONTROLLING
INTEREST TOTAL
Balance at 1 July 2014 555,296 (94,489) 26,766 5,497 51,701 544,771 11,631 556,402
Total comprehensive income/(expense) – – – 3,120 122,484 125,604 52 125,656
Issue of ordinary shares – – – – – – – –
Movement on treasury shares (3,370) 24,451 (22,884) – 1,945 142 – 142
Equity remuneration expense – – 10,983 – – 10,983 – 10,983
Dividends paid to shareholders – – – – (97,806) (97,806) – (97,806)
Non-controlling interest – – – – – – (11,683) (11,683)
Balance at 30 June 2015 551,926 (70,038) 14,865 8,617 78,324 583,694 – 583,694
$’000
GROSS CONTRIBUTED
EQUITY
TREASURY SHARE
RESERVE
EQUITY COMPENSATION
RESERVEOTHER
RESERVESRETAINED
EARNINGS
EQUITY HOLDERS OF
PERPETUAL
NON-CONTROLLING
INTEREST TOTAL
Balance at 1 July 2013 356,317 (116,516) 33,215 3,909 37,415 314,340 9,398 323,738
Total comprehensive income/(expense) – – – 1,588 81,618 83,206 1,602 84,808
Issue of ordinary shares 203,040 – – – – 203,040 – 203,040
Movement on treasury shares (4,061) 22,027 (21,281) – 3,476 161 – 161
Equity remuneration expense – – 14,832 – – 14,832 – 14,832
Dividends paid to shareholders – – – – (70,808) (70,808) – (70,808)
Non-controlling interest – – – – – – 631 631
Balance at 30 June 2014 555,296 (94,489) 26,766 5,497 51,701 544,771 11,631 556,402
The Consolidated Statement of Changes in Equity is to be read in conjunction with the ‘Notes to the financial statements’ set out on pages 91 to 135.
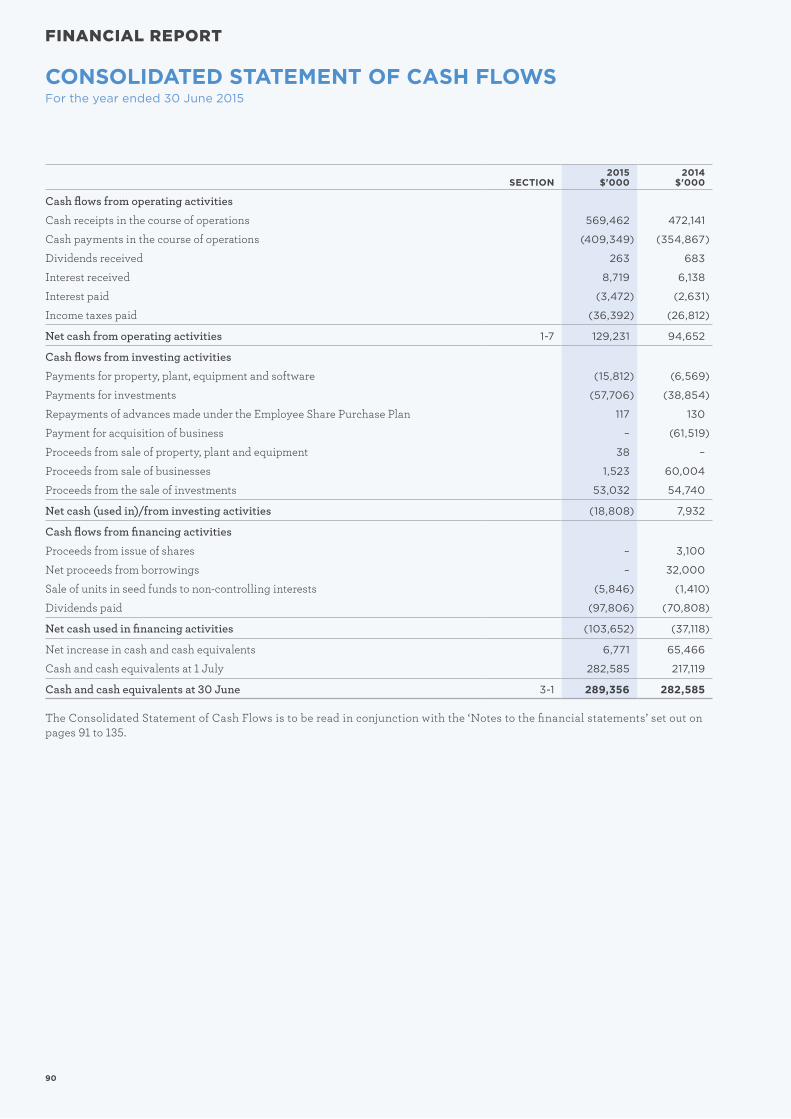
90
FINANCIAL REPORT
CONSOLIDATED STATEMENT OF CASH FLOWSFor the year ended 30 June 2015
SECTION2015
$'0002014
$'000
Cash flows from operating activities
Cash receipts in the course of operations 569,462 472,141
Cash payments in the course of operations (409,349) (354,867)
Dividends received 263 683
Interest received 8,719 6,138
Interest paid (3,472) (2,631)
Income taxes paid (36,392) (26,812)
Net cash from operating activities 1-7 129,231 94,652
Cash flows from investing activities
Payments for property, plant, equipment and software (15,812) (6,569)
Payments for investments (57,706) (38,854)
Repayments of advances made under the Employee Share Purchase Plan 117 130
Payment for acquisition of business – (61,519)
Proceeds from sale of property, plant and equipment 38 –
Proceeds from sale of businesses 1,523 60,004
Proceeds from the sale of investments 53,032 54,740
Net cash (used in)/from investing activities (18,808) 7,932
Cash flows from financing activities
Proceeds from issue of shares – 3,100
Net proceeds from borrowings – 32,000
Sale of units in seed funds to non-controlling interests (5,846) (1,410)
Dividends paid (97,806) (70,808)
Net cash used in financing activities (103,652) (37,118)
Net increase in cash and cash equivalents 6,771 65,466
Cash and cash equivalents at 1 July 282,585 217,119
Cash and cash equivalents at 30 June 3-1 289,356 282,585
The Consolidated Statement of Cash Flows is to be read in conjunction with the ‘Notes to the financial statements’ set out on pages 91 to 135.
PERPETUAL ANNUAL REPORT 2015 91
Notes to and forming part of the Financial StatementsFor the year ended 30 June 2015
FINANCIAL REPORT
1This section focuses on the results and performance of Perpetual as a consolidated entity. On the following pages you will find disclosures explaining Perpetual’s results for the year, segmental information, taxation, earnings per share and dividend information.
Where an accounting policy is specific to a single note, the policy is described in the section to which it relates.
1-1 OPERATING SEGMENTSAn operating segment is a component of the consolidated entity that engages in business activities from which it may earn revenues and incur expenses, including revenues and expenses that relate to transactions with any of the consolidated entity’s other components and for which discrete financial information is available. All operating segments’ operating results are regularly reviewed by the consolidated entity’s CEO to make decisions about resources to be allocated to the segment and assess their performance.
Segment results that are reported to the CEO include items directly attributable to a segment as well as those that can be allocated on a reasonable basis. Unallocated items comprise mainly corporate assets, head office expenses, income tax expenses, assets and liabilities.
The following summary describes the operations in each of the reportable segments:
i. Services providedThe consolidated entity operates in the financial services industry in Australia and Singapore and provides wealth management and corporate trust services. The major services from which the reportable segments derive revenue are:
Perpetual Investments Manufacturer of financial products, management and investment of monies on behalf of private, corporate, superannuation and institutional clients.
Perpetual Private Perpetual Private provides a wide range of investment and non-investment products and services. These include a comprehensive advisory service, portfolio management, philanthropic, executorial and trustee services to high net worth and emerging high net worth Australians. Perpetual Private also provides many of these services to charities, not for profit and other philanthropic organisations.
Perpetual Corporate Trust Perpetual Corporate Trust provides fiduciary services incorporating safe-keeping and recording of assets and transactions as custodian, responsible entity services, trustee services for securitisation, unit trusts, REITS and debt securities, data warehouse and investor reporting and registrar, or agent for corporate and financial services clients.
ii. Geographical informationThe consolidated entity operates in Australia and Singapore. Following the disposal on 7 April 2014 of the business in New Zealand (The New Zealand Guardian Trust Company Limited), the majority of the consolidated entity’s revenue and non-current assets relate to operations in Australia. The Singapore operation is not material.
iii. Major customer The consolidated entity does not rely on any major customer.
SECTION 1 GROUP PERFORMANCE
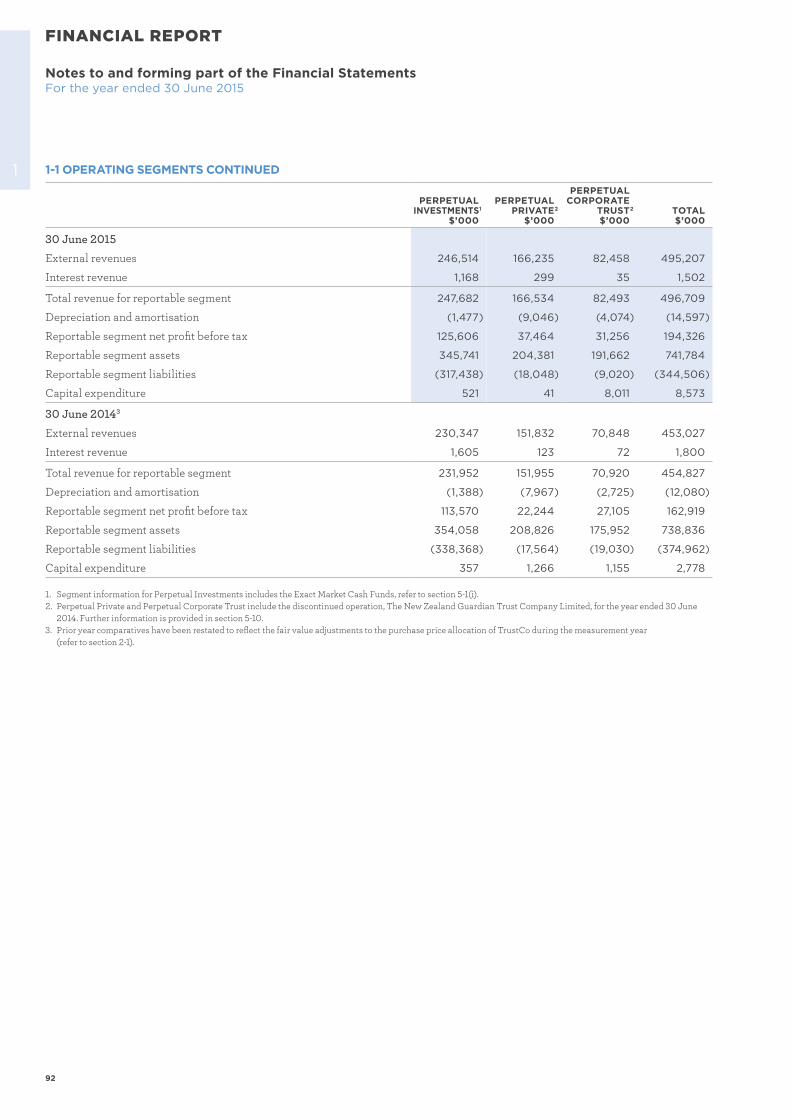
92
Notes to and forming part of the Financial StatementsFor the year ended 30 June 2015
FINANCIAL REPORT
1 1-1 OPERATING SEGMENTS CONTINUED
PERPETUAL INVESTMENTS 1
$’000
PERPETUAL PRIVATE 2
$’000
PERPETUAL CORPORATE
TRUST 2 $’000
TOTAL $’000
30 June 2015
External revenues 246,514 166,235 82,458 495,207
Interest revenue 1,168 299 35 1,502
Total revenue for reportable segment 247,682 166,534 82,493 496,709
Depreciation and amortisation (1,477) (9,046) (4,074) (14,597)
Reportable segment net profit before tax 125,606 37,464 31,256 194,326
Reportable segment assets 345,741 204,381 191,662 741,784
Reportable segment liabilities (317,438) (18,048) (9,020) (344,506)
Capital expenditure 521 41 8,011 8,573
30 June 20143
External revenues 230,347 151,832 70,848 453,027
Interest revenue 1,605 123 72 1,800
Total revenue for reportable segment 231,952 151,955 70,920 454,827
Depreciation and amortisation (1,388) (7,967) (2,725) (12,080)
Reportable segment net profit before tax 113,570 22,244 27,105 162,919
Reportable segment assets 354,058 208,826 175,952 738,836
Reportable segment liabilities (338,368) (17,564) (19,030) (374,962)
Capital expenditure 357 1,266 1,155 2,778
1. Segment information for Perpetual Investments includes the Exact Market Cash Funds, refer to section 5-1(i).2. Perpetual Private and Perpetual Corporate Trust include the discontinued operation, The New Zealand Guardian Trust Company Limited, for the year ended 30 June
2014. Further information is provided in section 5-10.3. Prior year comparatives have been restated to reflect the fair value adjustments to the purchase price allocation of TrustCo during the measurement year
(refer to section 2-1).
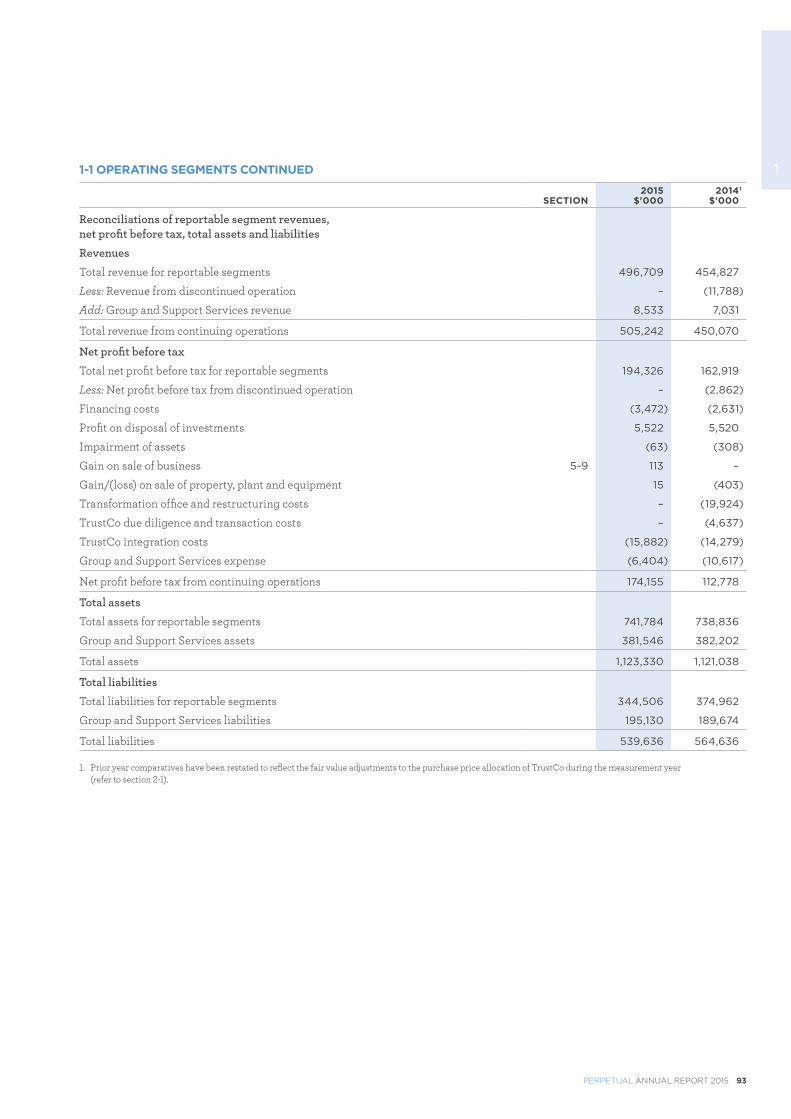
PERPETUAL ANNUAL REPORT 2015 93
11-1 OPERATING SEGMENTS CONTINUED
SECTION2015
$'0002014 1
$'000
Reconciliations of reportable segment revenues, net profit before tax, total assets and liabilities
Revenues
Total revenue for reportable segments 496,709 454,827
Less: Revenue from discontinued operation – (11,788)
Add: Group and Support Services revenue 8,533 7,031
Total revenue from continuing operations 505,242 450,070
Net profit before tax
Total net profit before tax for reportable segments 194,326 162,919
Less: Net profit before tax from discontinued operation – (2,862)
Financing costs (3,472) (2,631)
Profit on disposal of investments 5,522 5,520
Impairment of assets (63) (308)
Gain on sale of business 5-9 113 –
Gain/(loss) on sale of property, plant and equipment 15 (403)
Transformation office and restructuring costs – (19,924)
TrustCo due diligence and transaction costs – (4,637)
TrustCo integration costs (15,882) (14,279)
Group and Support Services expense (6,404) (10,617)
Net profit before tax from continuing operations 174,155 112,778
Total assets
Total assets for reportable segments 741,784 738,836
Group and Support Services assets 381,546 382,202
Total assets 1,123,330 1,121,038
Total liabilities
Total liabilities for reportable segments 344,506 374,962
Group and Support Services liabilities 195,130 189,674
Total liabilities 539,636 564,636
1. Prior year comparatives have been restated to reflect the fair value adjustments to the purchase price allocation of TrustCo during the measurement year (refer to section 2-1).
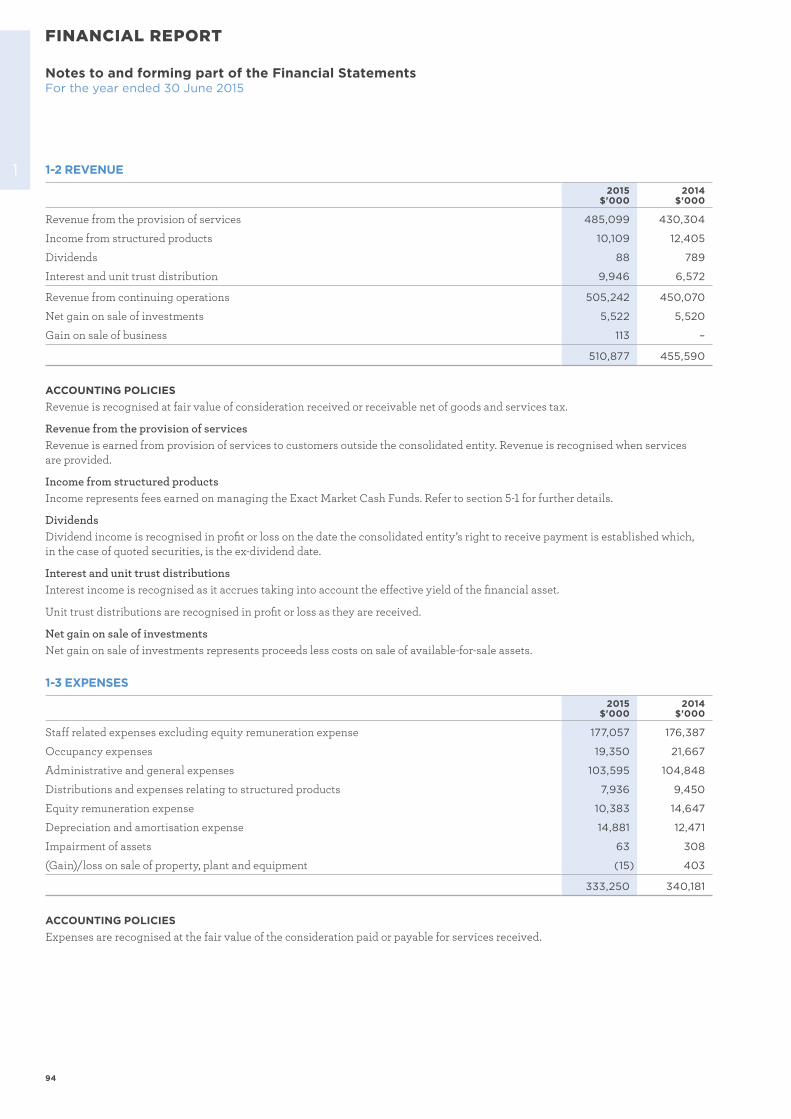
94
Notes to and forming part of the Financial StatementsFor the year ended 30 June 2015
FINANCIAL REPORT
1 1-2 REVENUE
2015$'000
2014$'000
Revenue from the provision of services 485,099 430,304
Income from structured products 10,109 12,405
Dividends 88 789
Interest and unit trust distribution 9,946 6,572
Revenue from continuing operations 505,242 450,070
Net gain on sale of investments 5,522 5,520
Gain on sale of business 113 –
510,877 455,590
ACCOUNTING POLICIESRevenue is recognised at fair value of consideration received or receivable net of goods and services tax.
Revenue from the provision of servicesRevenue is earned from provision of services to customers outside the consolidated entity. Revenue is recognised when services are provided.
Income from structured productsIncome represents fees earned on managing the Exact Market Cash Funds. Refer to section 5-1 for further details.
DividendsDividend income is recognised in profit or loss on the date the consolidated entity’s right to receive payment is established which, in the case of quoted securities, is the ex-dividend date.
Interest and unit trust distributionsInterest income is recognised as it accrues taking into account the effective yield of the financial asset.
Unit trust distributions are recognised in profit or loss as they are received.
Net gain on sale of investmentsNet gain on sale of investments represents proceeds less costs on sale of available-for-sale assets.
1-3 EXPENSES
2015$'000
2014$'000
Staff related expenses excluding equity remuneration expense 177,057 176,387
Occupancy expenses 19,350 21,667
Administrative and general expenses 103,595 104,848
Distributions and expenses relating to structured products 7,936 9,450
Equity remuneration expense 10,383 14,647
Depreciation and amortisation expense 14,881 12,471
Impairment of assets 63 308
(Gain)/loss on sale of property, plant and equipment (15) 403
333,250 340,181
ACCOUNTING POLICIESExpenses are recognised at the fair value of the consideration paid or payable for services received.
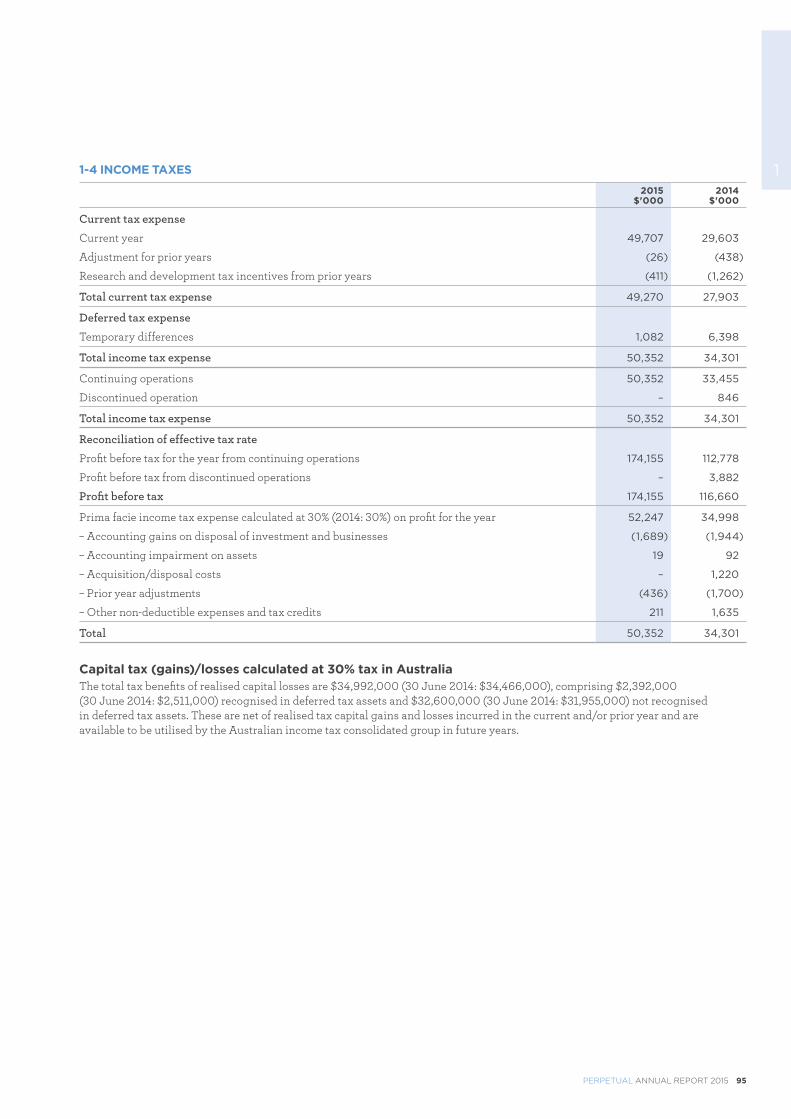
PERPETUAL ANNUAL REPORT 2015 95
11-4 INCOME TAXES
2015$'000
2014$'000
Current tax expense
Current year 49,707 29,603
Adjustment for prior years (26) (438)
Research and development tax incentives from prior years (411) (1,262)
Total current tax expense 49,270 27,903
Deferred tax expense
Temporary differences 1,082 6,398
Total income tax expense 50,352 34,301
Continuing operations 50,352 33,455
Discontinued operation – 846
Total income tax expense 50,352 34,301
Reconciliation of effective tax rate
Profit before tax for the year from continuing operations 174,155 112,778
Profit before tax from discontinued operations – 3,882
Profit before tax 174,155 116,660
Prima facie income tax expense calculated at 30% (2014: 30%) on profit for the year 52,247 34,998
– Accounting gains on disposal of investment and businesses (1,689) (1,944)
– Accounting impairment on assets 19 92
– Acquisition/disposal costs – 1,220
– Prior year adjustments (436) (1,700)
– Other non-deductible expenses and tax credits 211 1,635
Total 50,352 34,301
Capital tax (gains)/losses calculated at 30% tax in Australia The total tax benefits of realised capital losses are $34,992,000 (30 June 2014: $34,466,000), comprising $2,392,000 (30 June 2014: $2,511,000) recognised in deferred tax assets and $32,600,000 (30 June 2014: $31,955,000) not recognised in deferred tax assets. These are net of realised tax capital gains and losses incurred in the current and/or prior year and are available to be utilised by the Australian income tax consolidated group in future years.
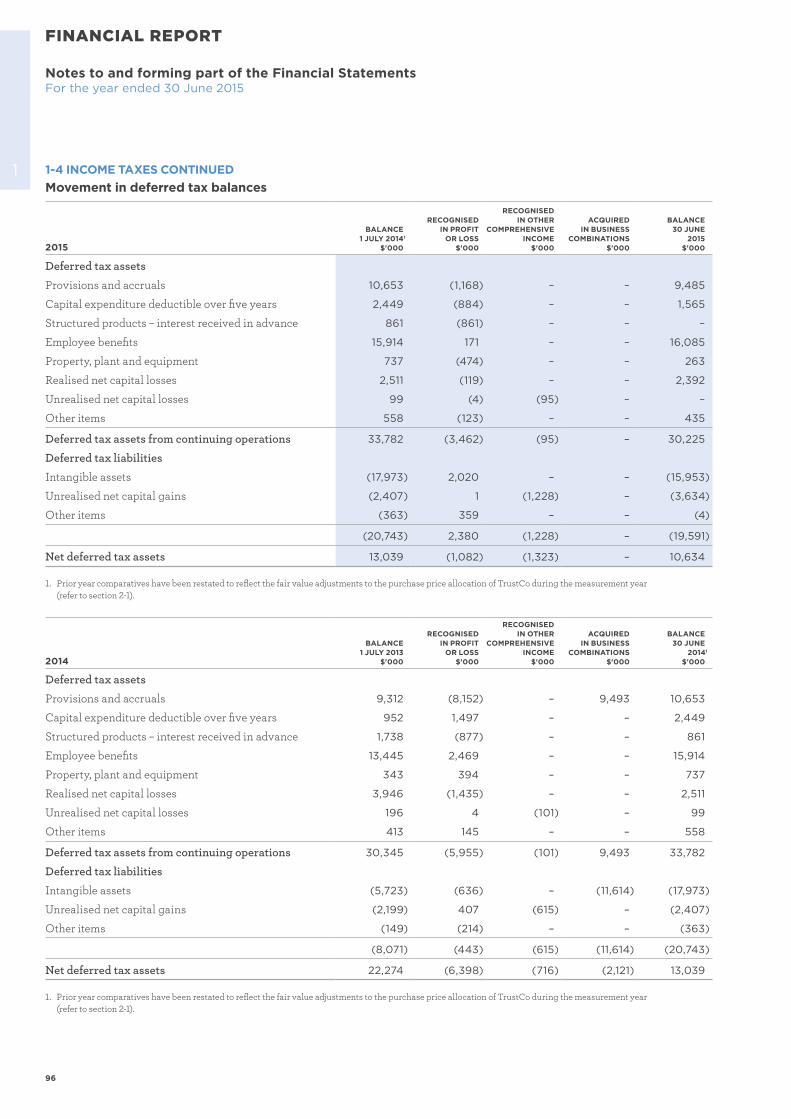
96
FINANCIAL REPORT
Notes to and forming part of the Financial StatementsFor the year ended 30 June 2015
1 1-4 INCOME TAXES CONTINUEDMovement in deferred tax balances
2015
BALANCE 1 JULY 2014 1
$'000
RECOGNISED IN PROFIT
OR LOSS$’000
RECOGNISED IN OTHER
COMPREHENSIVE INCOME
$'000
ACQUIRED IN BUSINESS
COMBINATIONS $'000
BALANCE 30 JUNE
2015 $'000
Deferred tax assets
Provisions and accruals 10,653 (1,168) – – 9,485
Capital expenditure deductible over five years 2,449 (884) – – 1,565
Structured products – interest received in advance 861 (861) – – –
Employee benefits 15,914 171 – – 16,085
Property, plant and equipment 737 (474) – – 263
Realised net capital losses 2,511 (119) – – 2,392
Unrealised net capital losses 99 (4) (95) – –
Other items 558 (123) – – 435
Deferred tax assets from continuing operations 33,782 (3,462) (95) – 30,225
Deferred tax liabilities
Intangible assets (17,973) 2,020 – – (15,953)
Unrealised net capital gains (2,407) 1 (1,228) – (3,634)
Other items (363) 359 – – (4)
(20,743) 2,380 (1,228) – (19,591)
Net deferred tax assets 13,039 (1,082) (1,323) – 10,634
1. Prior year comparatives have been restated to reflect the fair value adjustments to the purchase price allocation of TrustCo during the measurement year (refer to section 2-1).
2014
BALANCE 1 JULY 2013
$'000
RECOGNISED IN PROFIT
OR LOSS$’000
RECOGNISED IN OTHER
COMPREHENSIVE INCOME
$'000
ACQUIRED IN BUSINESS
COMBINATIONS $'000
BALANCE 30 JUNE
20141
$'000
Deferred tax assets
Provisions and accruals 9,312 (8,152) – 9,493 10,653
Capital expenditure deductible over five years 952 1,497 – – 2,449
Structured products – interest received in advance 1,738 (877) – – 861
Employee benefits 13,445 2,469 – – 15,914
Property, plant and equipment 343 394 – – 737
Realised net capital losses 3,946 (1,435) – – 2,511
Unrealised net capital losses 196 4 (101) – 99
Other items 413 145 – – 558
Deferred tax assets from continuing operations 30,345 (5,955) (101) 9,493 33,782
Deferred tax liabilities
Intangible assets (5,723) (636) – (11,614) (17,973)
Unrealised net capital gains (2,199) 407 (615) – (2,407)
Other items (149) (214) – – (363)
(8,071) (443) (615) (11,614) (20,743)
Net deferred tax assets 22,274 (6,398) (716) (2,121) 13,039
1. Prior year comparatives have been restated to reflect the fair value adjustments to the purchase price allocation of TrustCo during the measurement year (refer to section 2-1).
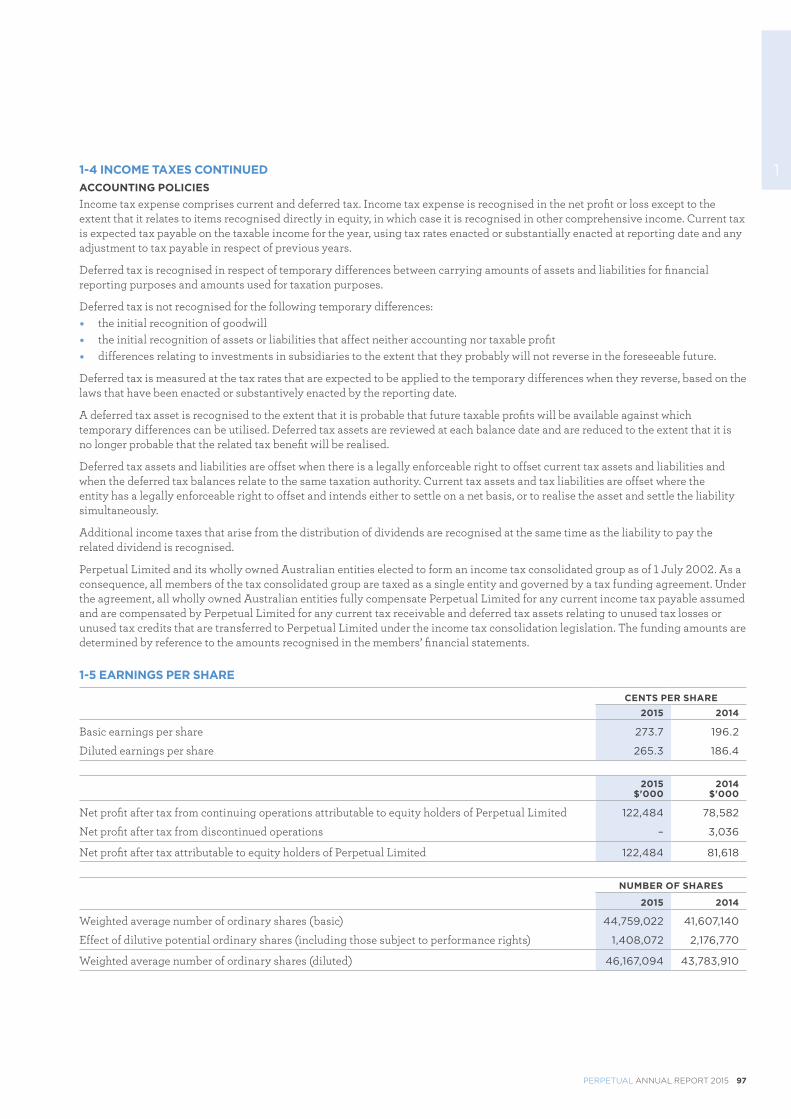
PERPETUAL ANNUAL REPORT 2015 97
11-4 INCOME TAXES CONTINUEDACCOUNTING POLICIESIncome tax expense comprises current and deferred tax. Income tax expense is recognised in the net profit or loss except to the extent that it relates to items recognised directly in equity, in which case it is recognised in other comprehensive income. Current tax is expected tax payable on the taxable income for the year, using tax rates enacted or substantially enacted at reporting date and any adjustment to tax payable in respect of previous years.
Deferred tax is recognised in respect of temporary differences between carrying amounts of assets and liabilities for financial reporting purposes and amounts used for taxation purposes.
Deferred tax is not recognised for the following temporary differences: � the initial recognition of goodwill � the initial recognition of assets or liabilities that affect neither accounting nor taxable profit � differences relating to investments in subsidiaries to the extent that they probably will not reverse in the foreseeable future.
Deferred tax is measured at the tax rates that are expected to be applied to the temporary differences when they reverse, based on the laws that have been enacted or substantively enacted by the reporting date.
A deferred tax asset is recognised to the extent that it is probable that future taxable profits will be available against which temporary differences can be utilised. Deferred tax assets are reviewed at each balance date and are reduced to the extent that it is no longer probable that the related tax benefit will be realised.
Deferred tax assets and liabilities are offset when there is a legally enforceable right to offset current tax assets and liabilities and when the deferred tax balances relate to the same taxation authority. Current tax assets and tax liabilities are offset where the entity has a legally enforceable right to offset and intends either to settle on a net basis, or to realise the asset and settle the liability simultaneously.
Additional income taxes that arise from the distribution of dividends are recognised at the same time as the liability to pay the related dividend is recognised.
Perpetual Limited and its wholly owned Australian entities elected to form an income tax consolidated group as of 1 July 2002. As a consequence, all members of the tax consolidated group are taxed as a single entity and governed by a tax funding agreement. Under the agreement, all wholly owned Australian entities fully compensate Perpetual Limited for any current income tax payable assumed and are compensated by Perpetual Limited for any current tax receivable and deferred tax assets relating to unused tax losses or unused tax credits that are transferred to Perpetual Limited under the income tax consolidation legislation. The funding amounts are determined by reference to the amounts recognised in the members’ financial statements.
1-5 EARNINGS PER SHARE
CENTS PER SHARE2015 2014
Basic earnings per share 273.7 196.2
Diluted earnings per share 265.3 186.4
2015$'000
2014 $'000
Net profit after tax from continuing operations attributable to equity holders of Perpetual Limited 122,484 78,582
Net profit after tax from discontinued operations – 3,036
Net profit after tax attributable to equity holders of Perpetual Limited 122,484 81,618
NUMBER OF SHARES
2015 2014
Weighted average number of ordinary shares (basic) 44,759,022 41,607,140
Effect of dilutive potential ordinary shares (including those subject to performance rights) 1,408,072 2,176,770
Weighted average number of ordinary shares (diluted) 46,167,094 43,783,910
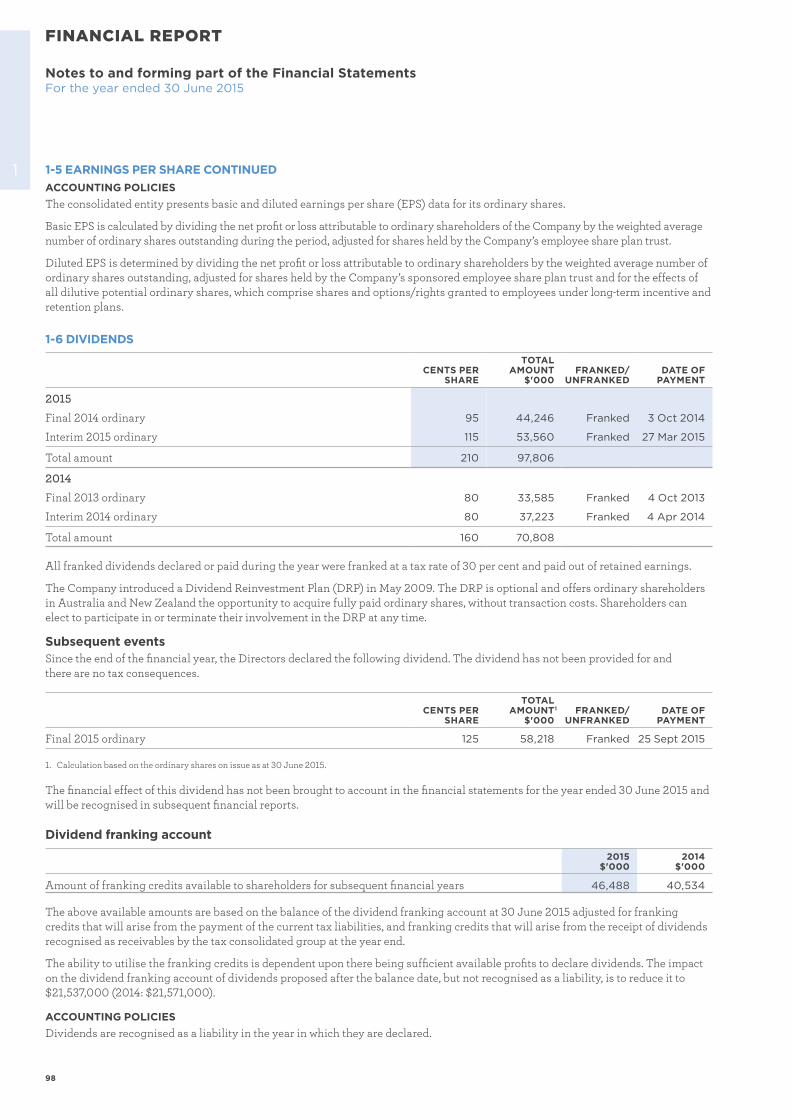
98
Notes to and forming part of the Financial StatementsFor the year ended 30 June 2015
FINANCIAL REPORT
1 1-5 EARNINGS PER SHARE CONTINUEDACCOUNTING POLICIESThe consolidated entity presents basic and diluted earnings per share (EPS) data for its ordinary shares.
Basic EPS is calculated by dividing the net profit or loss attributable to ordinary shareholders of the Company by the weighted average number of ordinary shares outstanding during the period, adjusted for shares held by the Company’s employee share plan trust.
Diluted EPS is determined by dividing the net profit or loss attributable to ordinary shareholders by the weighted average number of ordinary shares outstanding, adjusted for shares held by the Company’s sponsored employee share plan trust and for the effects of all dilutive potential ordinary shares, which comprise shares and options/rights granted to employees under long-term incentive and retention plans.
1-6 DIVIDENDS
CENTS PER SHARE
TOTAL AMOUNT
$'000FRANKED/
UNFRANKEDDATE OF
PAYMENT
2015
Final 2014 ordinary 95 44,246 Franked 3 Oct 2014
Interim 2015 ordinary 115 53,560 Franked 27 Mar 2015
Total amount 210 97,806
2014
Final 2013 ordinary 80 33,585 Franked 4 Oct 2013
Interim 2014 ordinary 80 37,223 Franked 4 Apr 2014
Total amount 160 70,808
All franked dividends declared or paid during the year were franked at a tax rate of 30 per cent and paid out of retained earnings.
The Company introduced a Dividend Reinvestment Plan (DRP) in May 2009. The DRP is optional and offers ordinary shareholders in Australia and New Zealand the opportunity to acquire fully paid ordinary shares, without transaction costs. Shareholders can elect to participate in or terminate their involvement in the DRP at any time.
Subsequent eventsSince the end of the financial year, the Directors declared the following dividend. The dividend has not been provided for and there are no tax consequences.
CENTS PER SHARE
TOTAL AMOUNT 1
$'000FRANKED/
UNFRANKEDDATE OF
PAYMENT
Final 2015 ordinary 125 58,218 Franked 25 Sept 2015
1. Calculation based on the ordinary shares on issue as at 30 June 2015.
The financial effect of this dividend has not been brought to account in the financial statements for the year ended 30 June 2015 and will be recognised in subsequent financial reports.
Dividend franking account
2015$'000
2014$'000
Amount of franking credits available to shareholders for subsequent financial years 46,488 40,534
The above available amounts are based on the balance of the dividend franking account at 30 June 2015 adjusted for franking credits that will arise from the payment of the current tax liabilities, and franking credits that will arise from the receipt of dividends recognised as receivables by the tax consolidated group at the year end.
The ability to utilise the franking credits is dependent upon there being sufficient available profits to declare dividends. The impact on the dividend franking account of dividends proposed after the balance date, but not recognised as a liability, is to reduce it to $21,537,000 (2014: $21,571,000).
ACCOUNTING POLICIESDividends are recognised as a liability in the year in which they are declared.
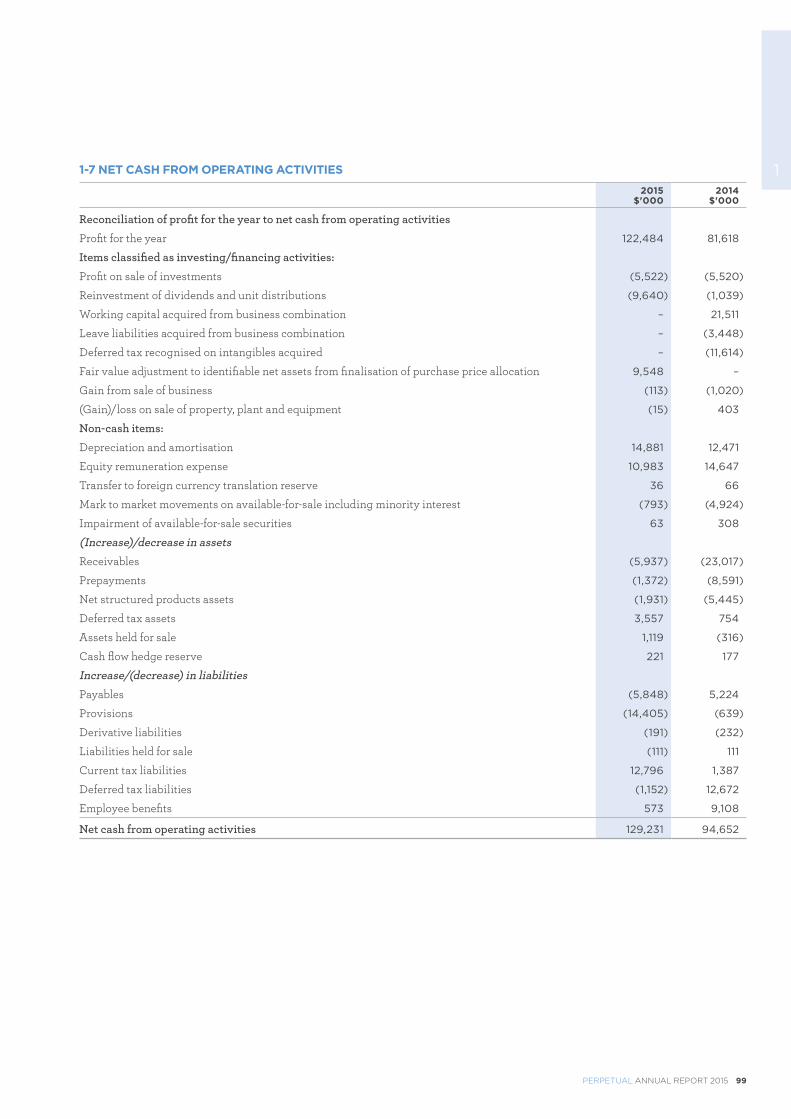
PERPETUAL ANNUAL REPORT 2015 99
11-7 NET CASH FROM OPERATING ACTIVITIES
2015$'000
2014$'000
Reconciliation of profit for the year to net cash from operating activities
Profit for the year 122,484 81,618
Items classified as investing/financing activities:
Profit on sale of investments (5,522) (5,520)
Reinvestment of dividends and unit distributions (9,640) (1,039)
Working capital acquired from business combination – 21,511
Leave liabilities acquired from business combination – (3,448)
Deferred tax recognised on intangibles acquired – (11,614)
Fair value adjustment to identifiable net assets from finalisation of purchase price allocation 9,548 –
Gain from sale of business (113) (1,020)
(Gain)/loss on sale of property, plant and equipment (15) 403
Non-cash items:
Depreciation and amortisation 14,881 12,471
Equity remuneration expense 10,983 14,647
Transfer to foreign currency translation reserve 36 66
Mark to market movements on available-for-sale including minority interest (793) (4,924)
Impairment of available-for-sale securities 63 308
(Increase)/decrease in assets
Receivables (5,937) (23,017)
Prepayments (1,372) (8,591)
Net structured products assets (1,931) (5,445)
Deferred tax assets 3,557 754
Assets held for sale 1,119 (316)
Cash flow hedge reserve 221 177
Increase/(decrease) in liabilities
Payables (5,848) 5,224
Provisions (14,405) (639)
Derivative liabilities (191) (232)
Liabilities held for sale (111) 111
Current tax liabilities 12,796 1,387
Deferred tax liabilities (1,152) 12,672
Employee benefits 573 9,108
Net cash from operating activities 129,231 94,652
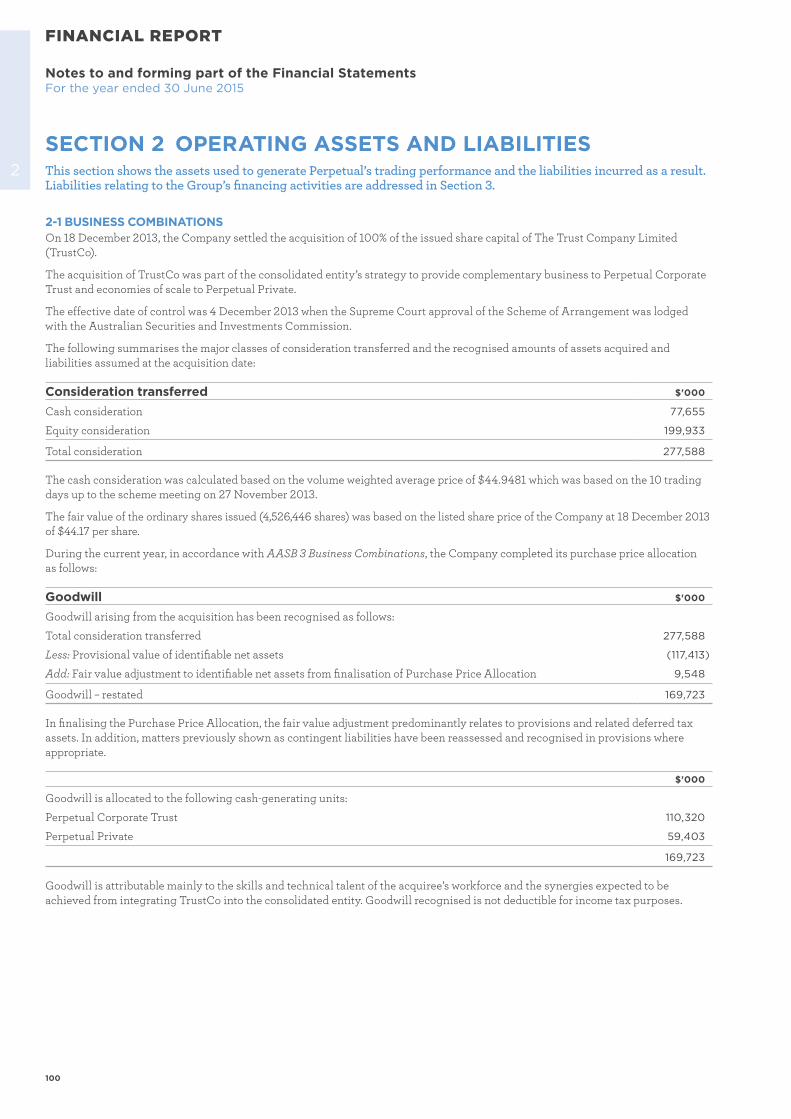
100
FINANCIAL REPORT
Notes to and forming part of the Financial StatementsFor the year ended 30 June 2015
2 This section shows the assets used to generate Perpetual’s trading performance and the liabilities incurred as a result. Liabilities relating to the Group’s financing activities are addressed in Section 3.
2-1 BUSINESS COMBINATIONSOn 18 December 2013, the Company settled the acquisition of 100% of the issued share capital of The Trust Company Limited (TrustCo).
The acquisition of TrustCo was part of the consolidated entity’s strategy to provide complementary business to Perpetual Corporate Trust and economies of scale to Perpetual Private.
The effective date of control was 4 December 2013 when the Supreme Court approval of the Scheme of Arrangement was lodged with the Australian Securities and Investments Commission.
The following summarises the major classes of consideration transferred and the recognised amounts of assets acquired and liabilities assumed at the acquisition date:
Consideration transferred $'000
Cash consideration 77,655
Equity consideration 199,933
Total consideration 277,588
The cash consideration was calculated based on the volume weighted average price of $44.9481 which was based on the 10 trading days up to the scheme meeting on 27 November 2013.
The fair value of the ordinary shares issued (4,526,446 shares) was based on the listed share price of the Company at 18 December 2013 of $44.17 per share.
During the current year, in accordance with AASB 3 Business Combinations, the Company completed its purchase price allocation as follows:
Goodwill $'000
Goodwill arising from the acquisition has been recognised as follows:
Total consideration transferred 277,588
Less: Provisional value of identifiable net assets (117,413)
Add: Fair value adjustment to identifiable net assets from finalisation of Purchase Price Allocation 9,548
Goodwill – restated 169,723
In finalising the Purchase Price Allocation, the fair value adjustment predominantly relates to provisions and related deferred tax assets. In addition, matters previously shown as contingent liabilities have been reassessed and recognised in provisions where appropriate.
$'000
Goodwill is allocated to the following cash-generating units:
Perpetual Corporate Trust 110,320
Perpetual Private 59,403
169,723
Goodwill is attributable mainly to the skills and technical talent of the acquiree’s workforce and the synergies expected to be achieved from integrating TrustCo into the consolidated entity. Goodwill recognised is not deductible for income tax purposes.
SECTION 2 OPERATING ASSETS AND LIABILITIES
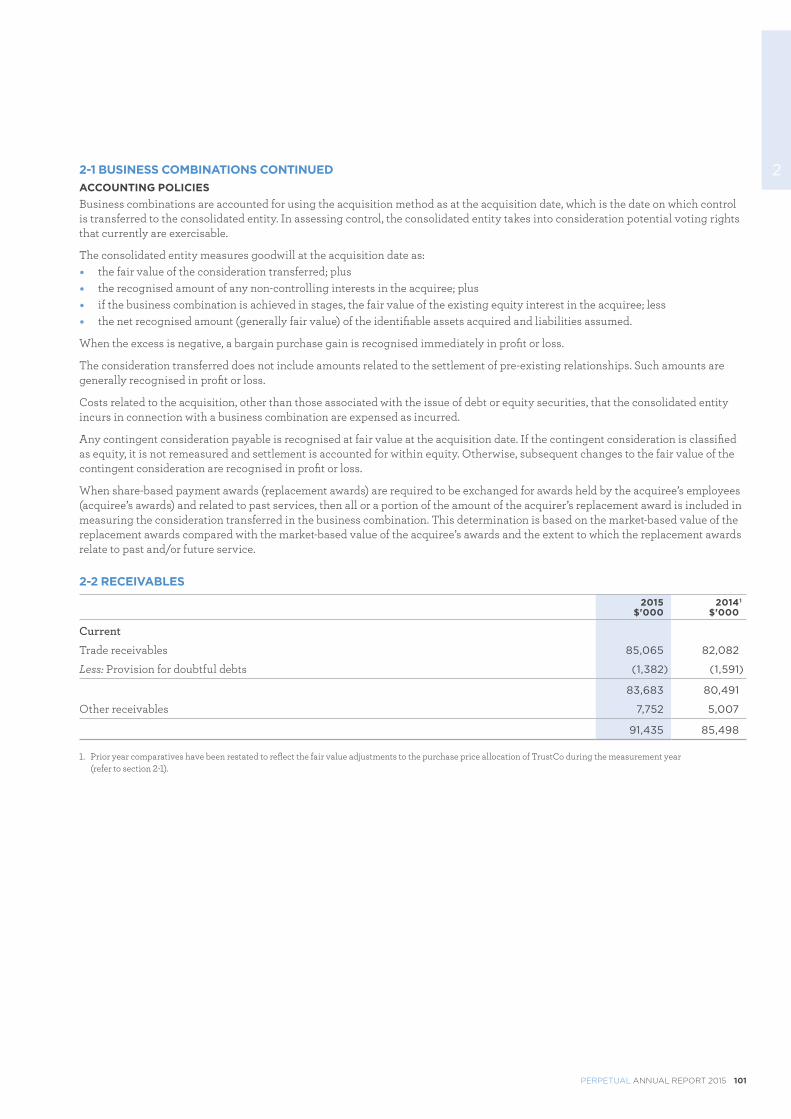
PERPETUAL ANNUAL REPORT 2015 101
22-1 BUSINESS COMBINATIONS CONTINUEDACCOUNTING POLICIESBusiness combinations are accounted for using the acquisition method as at the acquisition date, which is the date on which control is transferred to the consolidated entity. In assessing control, the consolidated entity takes into consideration potential voting rights that currently are exercisable.
The consolidated entity measures goodwill at the acquisition date as: � the fair value of the consideration transferred; plus � the recognised amount of any non-controlling interests in the acquiree; plus � if the business combination is achieved in stages, the fair value of the existing equity interest in the acquiree; less � the net recognised amount (generally fair value) of the identifiable assets acquired and liabilities assumed.
When the excess is negative, a bargain purchase gain is recognised immediately in profit or loss.
The consideration transferred does not include amounts related to the settlement of pre-existing relationships. Such amounts are generally recognised in profit or loss.
Costs related to the acquisition, other than those associated with the issue of debt or equity securities, that the consolidated entity incurs in connection with a business combination are expensed as incurred.
Any contingent consideration payable is recognised at fair value at the acquisition date. If the contingent consideration is classified as equity, it is not remeasured and settlement is accounted for within equity. Otherwise, subsequent changes to the fair value of the contingent consideration are recognised in profit or loss.
When share-based payment awards (replacement awards) are required to be exchanged for awards held by the acquiree’s employees (acquiree’s awards) and related to past services, then all or a portion of the amount of the acquirer’s replacement award is included in measuring the consideration transferred in the business combination. This determination is based on the market-based value of the replacement awards compared with the market-based value of the acquiree’s awards and the extent to which the replacement awards relate to past and/or future service.
2-2 RECEIVABLES
2015$'000
2014 1
$'000
Current
Trade receivables 85,065 82,082
Less: Provision for doubtful debts (1,382) (1,591)
83,683 80,491
Other receivables 7,752 5,007
91,435 85,498
1. Prior year comparatives have been restated to reflect the fair value adjustments to the purchase price allocation of TrustCo during the measurement year (refer to section 2-1).
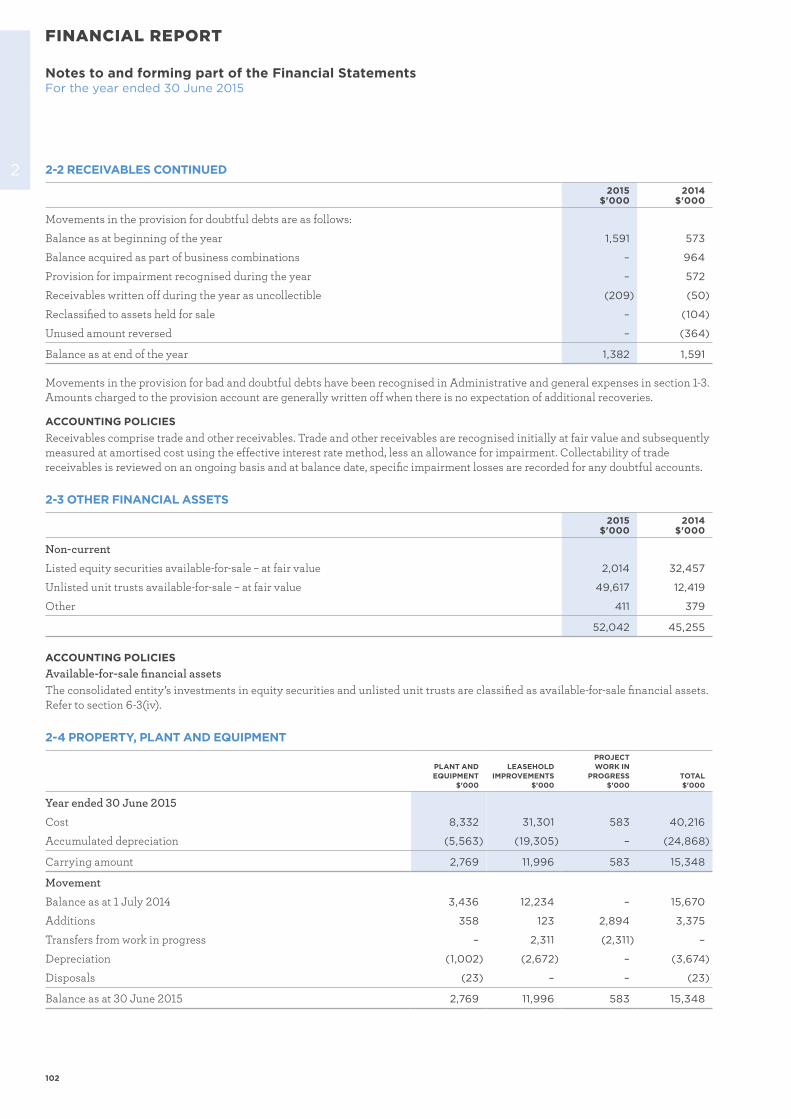
102
Notes to and forming part of the Financial StatementsFor the year ended 30 June 2015
FINANCIAL REPORT
2 2-2 RECEIVABLES CONTINUED
2015$'000
2014$'000
Movements in the provision for doubtful debts are as follows:
Balance as at beginning of the year 1,591 573
Balance acquired as part of business combinations – 964
Provision for impairment recognised during the year – 572
Receivables written off during the year as uncollectible (209) (50)
Reclassified to assets held for sale – (104)
Unused amount reversed – (364)
Balance as at end of the year 1,382 1,591
Movements in the provision for bad and doubtful debts have been recognised in Administrative and general expenses in section 1-3. Amounts charged to the provision account are generally written off when there is no expectation of additional recoveries.
ACCOUNTING POLICIESReceivables comprise trade and other receivables. Trade and other receivables are recognised initially at fair value and subsequently measured at amortised cost using the effective interest rate method, less an allowance for impairment. Collectability of trade receivables is reviewed on an ongoing basis and at balance date, specific impairment losses are recorded for any doubtful accounts.
2-3 OTHER FINANCIAL ASSETS
2015$'000
2014$'000
Non-current
Listed equity securities available-for-sale – at fair value 2,014 32,457
Unlisted unit trusts available-for-sale – at fair value 49,617 12,419
Other 411 379
52,042 45,255
ACCOUNTING POLICIESAvailable-for-sale financial assetsThe consolidated entity’s investments in equity securities and unlisted unit trusts are classified as available-for-sale financial assets. Refer to section 6-3(iv).
2-4 PROPERTY, PLANT AND EQUIPMENT
PLANT ANDEQUIPMENT
$'000
LEASEHOLDIMPROVEMENTS
$’000
PROJECT WORK IN
PROGRESS$'000
TOTAL$'000
Year ended 30 June 2015
Cost 8,332 31,301 583 40,216
Accumulated depreciation (5,563) (19,305) – (24,868)
Carrying amount 2,769 11,996 583 15,348
Movement
Balance as at 1 July 2014 3,436 12,234 – 15,670
Additions 358 123 2,894 3,375
Transfers from work in progress – 2,311 (2,311) –
Depreciation (1,002) (2,672) – (3,674)
Disposals (23) – – (23)
Balance as at 30 June 2015 2,769 11,996 583 15,348
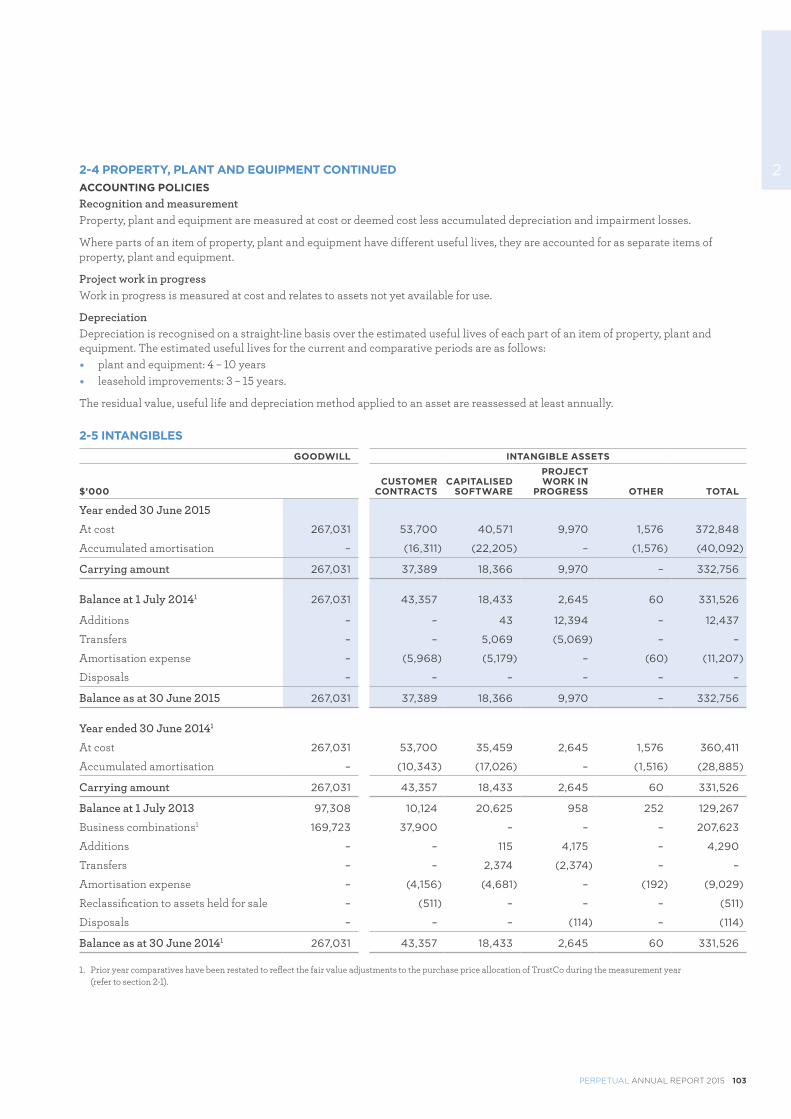
PERPETUAL ANNUAL REPORT 2015 103
22-4 PROPERTY, PLANT AND EQUIPMENT CONTINUEDACCOUNTING POLICIESRecognition and measurementProperty, plant and equipment are measured at cost or deemed cost less accumulated depreciation and impairment losses.
Where parts of an item of property, plant and equipment have different useful lives, they are accounted for as separate items of property, plant and equipment.
Project work in progressWork in progress is measured at cost and relates to assets not yet available for use.
DepreciationDepreciation is recognised on a straight-line basis over the estimated useful lives of each part of an item of property, plant and equipment. The estimated useful lives for the current and comparative periods are as follows: � plant and equipment: 4 – 10 years � leasehold improvements: 3 – 15 years.
The residual value, useful life and depreciation method applied to an asset are reassessed at least annually.
2-5 INTANGIBLES
GOODWILL INTANGIBLE ASSETS
$’000CUSTOMER
CONTRACTSCAPITALISED
SOFTWARE
PROJECT WORK IN
PROGRESS OTHER TOTAL
Year ended 30 June 2015
At cost 267,031 53,700 40,571 9,970 1,576 372,848
Accumulated amortisation – (16,311) (22,205) – (1,576) (40,092)
Carrying amount 267,031 37,389 18,366 9,970 – 332,756
Balance at 1 July 20141 267,031 43,357 18,433 2,645 60 331,526
Additions – – 43 12,394 – 12,437
Transfers – – 5,069 (5,069) – –
Amortisation expense – (5,968) (5,179) – (60) (11,207)
Disposals – – – – – –
Balance as at 30 June 2015 267,031 37,389 18,366 9,970 – 332,756
Year ended 30 June 20141
At cost 267,031 53,700 35,459 2,645 1,576 360,411
Accumulated amortisation – (10,343) (17,026) – (1,516) (28,885)
Carrying amount 267,031 43,357 18,433 2,645 60 331,526
Balance at 1 July 2013 97,308 10,124 20,625 958 252 129,267
Business combinations1 169,723 37,900 – – – 207,623
Additions – – 115 4,175 – 4,290
Transfers – – 2,374 (2,374) – –
Amortisation expense – (4,156) (4,681) – (192) (9,029)
Reclassification to assets held for sale – (511) – – – (511)
Disposals – – – (114) – (114)
Balance as at 30 June 20141 267,031 43,357 18,433 2,645 60 331,526
1. Prior year comparatives have been restated to reflect the fair value adjustments to the purchase price allocation of TrustCo during the measurement year (refer to section 2-1).
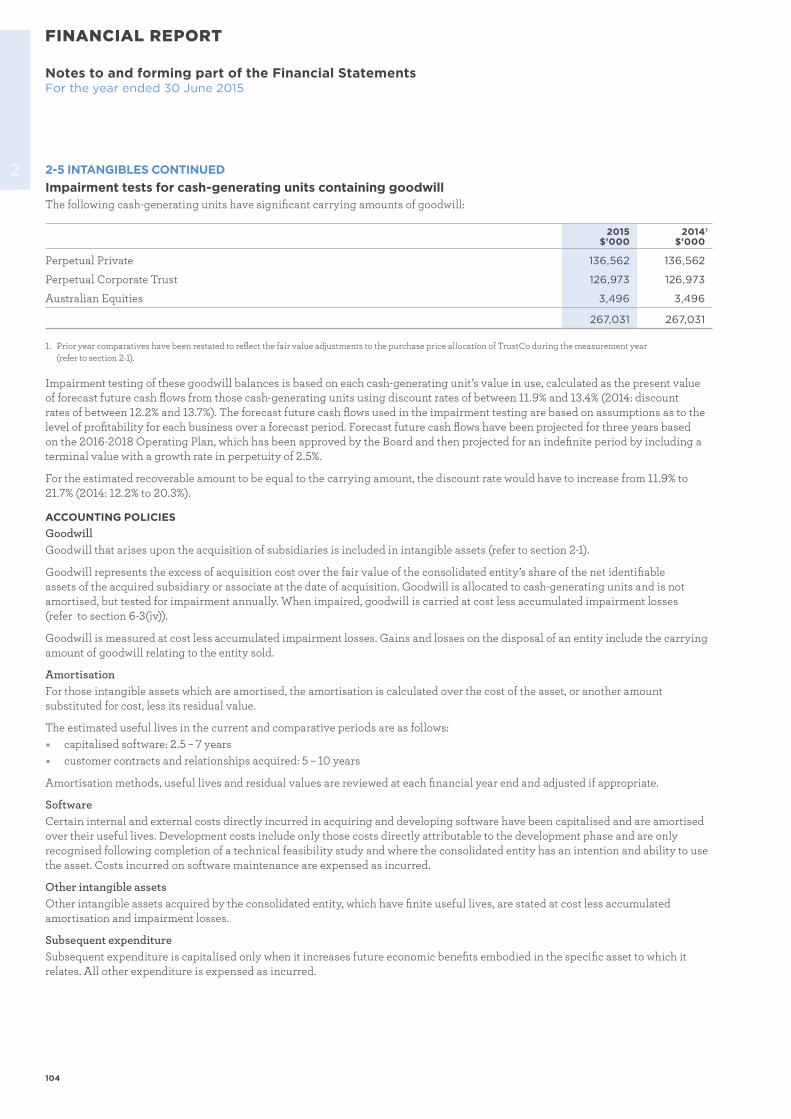
104
FINANCIAL REPORT
Notes to and forming part of the Financial StatementsFor the year ended 30 June 2015
2 2-5 INTANGIBLES CONTINUEDImpairment tests for cash-generating units containing goodwill The following cash-generating units have significant carrying amounts of goodwill:
2015$'000
2014 1
$'000
Perpetual Private 136,562 136,562
Perpetual Corporate Trust 126,973 126,973
Australian Equities 3,496 3,496
267,031 267,031
1. Prior year comparatives have been restated to reflect the fair value adjustments to the purchase price allocation of TrustCo during the measurement year (refer to section 2-1).
Impairment testing of these goodwill balances is based on each cash-generating unit’s value in use, calculated as the present value of forecast future cash flows from those cash-generating units using discount rates of between 11.9% and 13.4% (2014: discount rates of between 12.2% and 13.7%). The forecast future cash flows used in the impairment testing are based on assumptions as to the level of profitability for each business over a forecast period. Forecast future cash flows have been projected for three years based on the 2016-2018 Operating Plan, which has been approved by the Board and then projected for an indefinite period by including a terminal value with a growth rate in perpetuity of 2.5%.
For the estimated recoverable amount to be equal to the carrying amount, the discount rate would have to increase from 11.9% to 21.7% (2014: 12.2% to 20.3%).
ACCOUNTING POLICIESGoodwillGoodwill that arises upon the acquisition of subsidiaries is included in intangible assets (refer to section 2-1).
Goodwill represents the excess of acquisition cost over the fair value of the consolidated entity’s share of the net identifiable assets of the acquired subsidiary or associate at the date of acquisition. Goodwill is allocated to cash-generating units and is not amortised, but tested for impairment annually. When impaired, goodwill is carried at cost less accumulated impairment losses (refer to section 6-3(iv)).
Goodwill is measured at cost less accumulated impairment losses. Gains and losses on the disposal of an entity include the carrying amount of goodwill relating to the entity sold.
AmortisationFor those intangible assets which are amortised, the amortisation is calculated over the cost of the asset, or another amount substituted for cost, less its residual value.
The estimated useful lives in the current and comparative periods are as follows: � capitalised software: 2.5 – 7 years � customer contracts and relationships acquired: 5 – 10 years
Amortisation methods, useful lives and residual values are reviewed at each financial year end and adjusted if appropriate.
SoftwareCertain internal and external costs directly incurred in acquiring and developing software have been capitalised and are amortised over their useful lives. Development costs include only those costs directly attributable to the development phase and are only recognised following completion of a technical feasibility study and where the consolidated entity has an intention and ability to use the asset. Costs incurred on software maintenance are expensed as incurred.
Other intangible assetsOther intangible assets acquired by the consolidated entity, which have finite useful lives, are stated at cost less accumulated amortisation and impairment losses.
Subsequent expenditureSubsequent expenditure is capitalised only when it increases future economic benefits embodied in the specific asset to which it relates. All other expenditure is expensed as incurred.
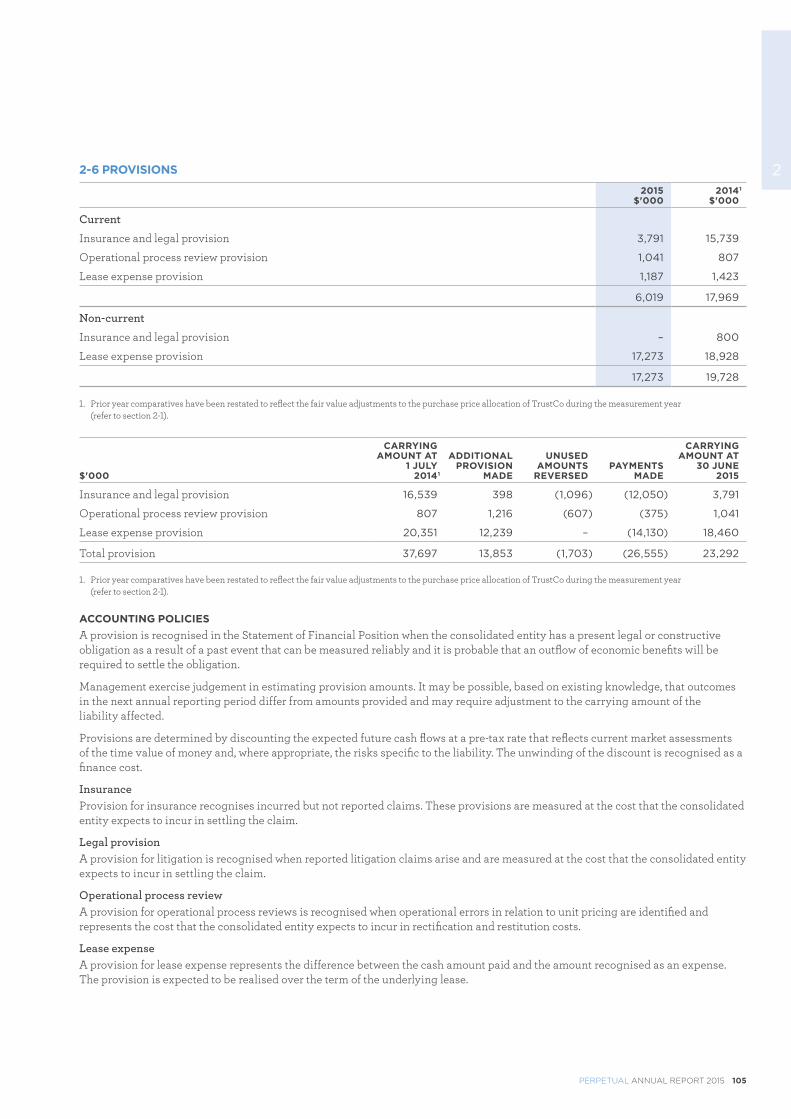
PERPETUAL ANNUAL REPORT 2015 105
22-6 PROVISIONS
2015$'000
2014 1
$'000
Current
Insurance and legal provision 3,791 15,739
Operational process review provision 1,041 807
Lease expense provision 1,187 1,423
6,019 17,969
Non-current
Insurance and legal provision – 800
Lease expense provision 17,273 18,928
17,273 19,728
1. Prior year comparatives have been restated to reflect the fair value adjustments to the purchase price allocation of TrustCo during the measurement year (refer to section 2-1).
$'000
CARRYING AMOUNT AT
1 JULY 2014 1
ADDITIONAL PROVISION
MADE
UNUSED AMOUNTS
REVERSEDPAYMENTS
MADE
CARRYING AMOUNT AT
30 JUNE 2015
Insurance and legal provision 16,539 398 (1,096) (12,050) 3,791
Operational process review provision 807 1,216 (607) (375) 1,041
Lease expense provision 20,351 12,239 – (14,130) 18,460
Total provision 37,697 13,853 (1,703) (26,555) 23,292
1. Prior year comparatives have been restated to reflect the fair value adjustments to the purchase price allocation of TrustCo during the measurement year (refer to section 2-1).
ACCOUNTING POLICIESA provision is recognised in the Statement of Financial Position when the consolidated entity has a present legal or constructive obligation as a result of a past event that can be measured reliably and it is probable that an outflow of economic benefits will be required to settle the obligation.
Management exercise judgement in estimating provision amounts. It may be possible, based on existing knowledge, that outcomes in the next annual reporting period differ from amounts provided and may require adjustment to the carrying amount of the liability affected.
Provisions are determined by discounting the expected future cash flows at a pre-tax rate that reflects current market assessments of the time value of money and, where appropriate, the risks specific to the liability. The unwinding of the discount is recognised as a finance cost.
InsuranceProvision for insurance recognises incurred but not reported claims. These provisions are measured at the cost that the consolidated entity expects to incur in settling the claim.
Legal provisionA provision for litigation is recognised when reported litigation claims arise and are measured at the cost that the consolidated entity expects to incur in settling the claim.
Operational process reviewA provision for operational process reviews is recognised when operational errors in relation to unit pricing are identified and represents the cost that the consolidated entity expects to incur in rectification and restitution costs.
Lease expenseA provision for lease expense represents the difference between the cash amount paid and the amount recognised as an expense. The provision is expected to be realised over the term of the underlying lease.
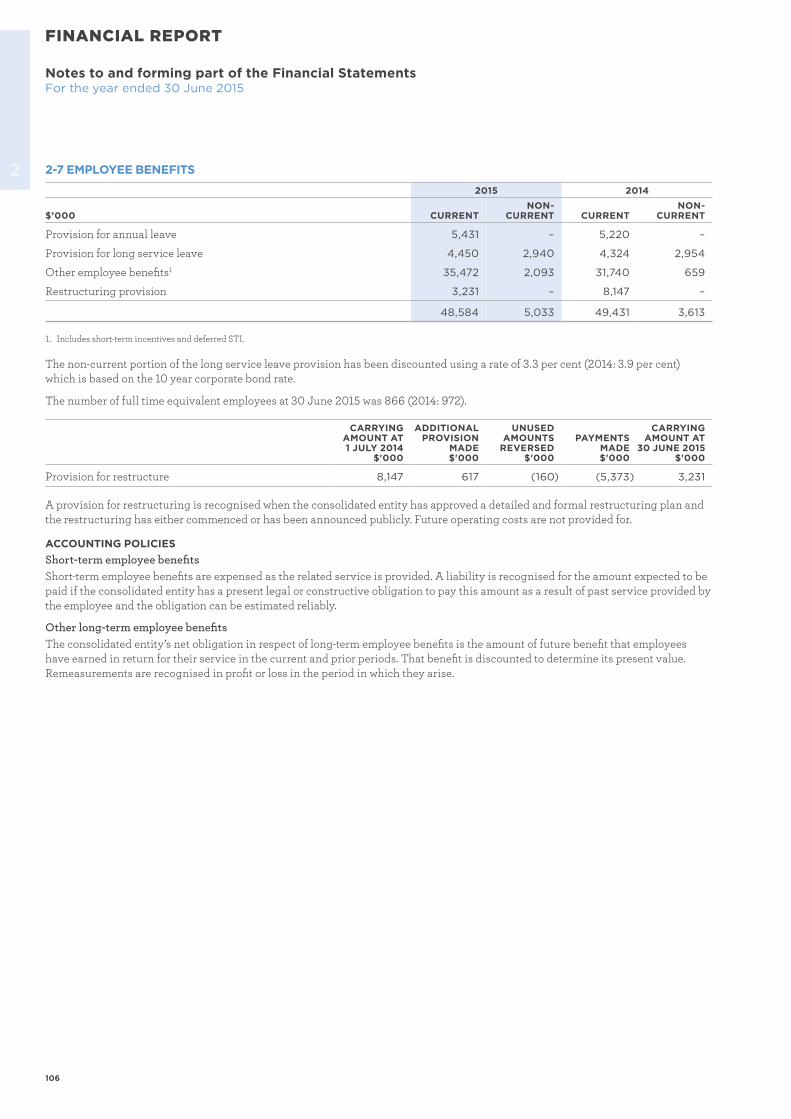
106
Notes to and forming part of the Financial StatementsFor the year ended 30 June 2015
FINANCIAL REPORT
2 2-7 EMPLOYEE BENEFITS
2015 2014
$’000 CURRENTNON-
CURRENT CURRENTNON-
CURRENT
Provision for annual leave 5,431 – 5,220 –
Provision for long service leave 4,450 2,940 4,324 2,954
Other employee benefits1 35,472 2,093 31,740 659
Restructuring provision 3,231 – 8,147 –
48,584 5,033 49,431 3,613
1. Includes short-term incentives and deferred STI.
The non-current portion of the long service leave provision has been discounted using a rate of 3.3 per cent (2014: 3.9 per cent) which is based on the 10 year corporate bond rate.
The number of full time equivalent employees at 30 June 2015 was 866 (2014: 972).
CARRYING AMOUNT AT
1 JULY 2014$'000
ADDITIONAL PROVISION
MADE$'000
UNUSED AMOUNTS
REVERSED$'000
PAYMENTS MADE$'000
CARRYING AMOUNT AT
30 JUNE 2015$'000
Provision for restructure 8,147 617 (160) (5,373) 3,231
A provision for restructuring is recognised when the consolidated entity has approved a detailed and formal restructuring plan and the restructuring has either commenced or has been announced publicly. Future operating costs are not provided for.
ACCOUNTING POLICIESShort-term employee benefitsShort-term employee benefits are expensed as the related service is provided. A liability is recognised for the amount expected to be paid if the consolidated entity has a present legal or constructive obligation to pay this amount as a result of past service provided by the employee and the obligation can be estimated reliably.
Other long-term employee benefitsThe consolidated entity’s net obligation in respect of long-term employee benefits is the amount of future benefit that employees have earned in return for their service in the current and prior periods. That benefit is discounted to determine its present value. Remeasurements are recognised in profit or loss in the period in which they arise.
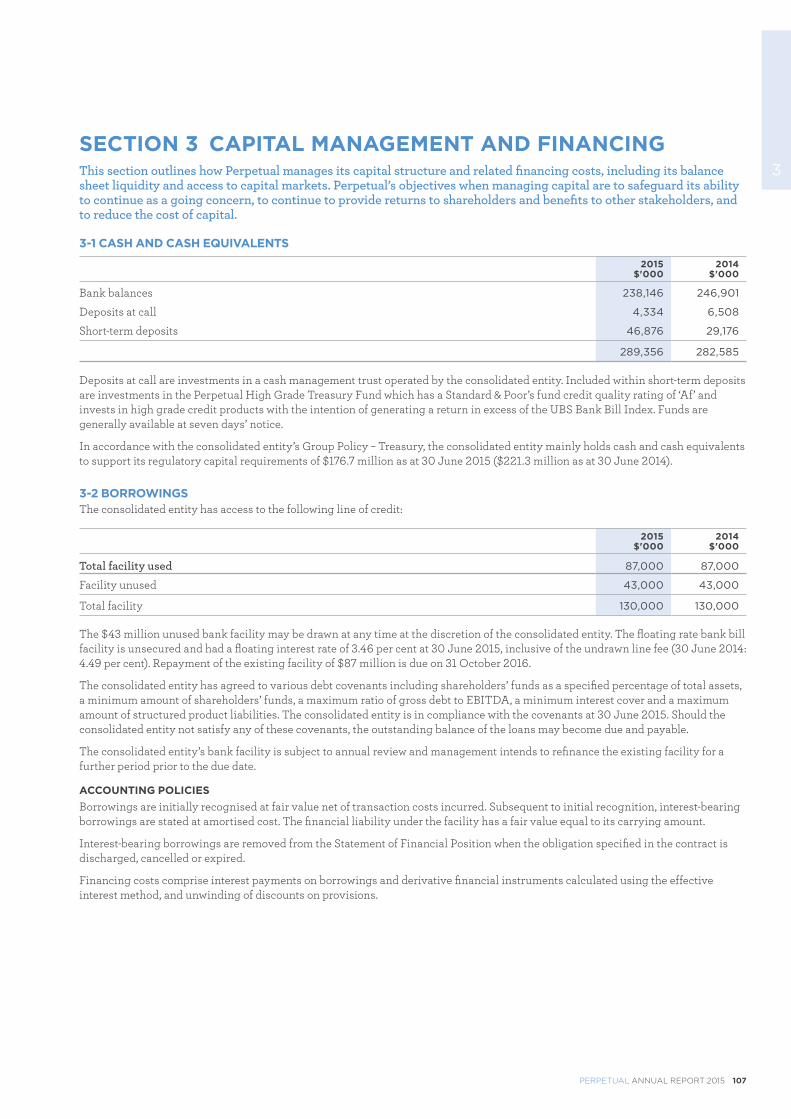
PERPETUAL ANNUAL REPORT 2015 107
3
3-1 CASH AND CASH EQUIVALENTS
2015$'000
2014$'000
Bank balances 238,146 246,901
Deposits at call 4,334 6,508
Short-term deposits 46,876 29,176
289,356 282,585
Deposits at call are investments in a cash management trust operated by the consolidated entity. Included within short-term deposits are investments in the Perpetual High Grade Treasury Fund which has a Standard & Poor’s fund credit quality rating of ‘Af’ and invests in high grade credit products with the intention of generating a return in excess of the UBS Bank Bill Index. Funds are generally available at seven days’ notice.
In accordance with the consolidated entity’s Group Policy – Treasury, the consolidated entity mainly holds cash and cash equivalents to support its regulatory capital requirements of $176.7 million as at 30 June 2015 ($221.3 million as at 30 June 2014).
3-2 BORROWINGSThe consolidated entity has access to the following line of credit:
2015$'000
2014$'000
Total facility used 87,000 87,000
Facility unused 43,000 43,000
Total facility 130,000 130,000
The $43 million unused bank facility may be drawn at any time at the discretion of the consolidated entity. The floating rate bank bill facility is unsecured and had a floating interest rate of 3.46 per cent at 30 June 2015, inclusive of the undrawn line fee (30 June 2014: 4.49 per cent). Repayment of the existing facility of $87 million is due on 31 October 2016.
The consolidated entity has agreed to various debt covenants including shareholders’ funds as a specified percentage of total assets, a minimum amount of shareholders’ funds, a maximum ratio of gross debt to EBITDA, a minimum interest cover and a maximum amount of structured product liabilities. The consolidated entity is in compliance with the covenants at 30 June 2015. Should the consolidated entity not satisfy any of these covenants, the outstanding balance of the loans may become due and payable.
The consolidated entity’s bank facility is subject to annual review and management intends to refinance the existing facility for a further period prior to the due date.
ACCOUNTING POLICIESBorrowings are initially recognised at fair value net of transaction costs incurred. Subsequent to initial recognition, interest-bearing borrowings are stated at amortised cost. The financial liability under the facility has a fair value equal to its carrying amount.
Interest-bearing borrowings are removed from the Statement of Financial Position when the obligation specified in the contract is discharged, cancelled or expired.
Financing costs comprise interest payments on borrowings and derivative financial instruments calculated using the effective interest method, and unwinding of discounts on provisions.
This section outlines how Perpetual manages its capital structure and related financing costs, including its balance sheet liquidity and access to capital markets. Perpetual’s objectives when managing capital are to safeguard its ability to continue as a going concern, to continue to provide returns to shareholders and benefits to other stakeholders, and to reduce the cost of capital.
SECTION 3 CAPITAL MANAGEMENT AND FINANCING
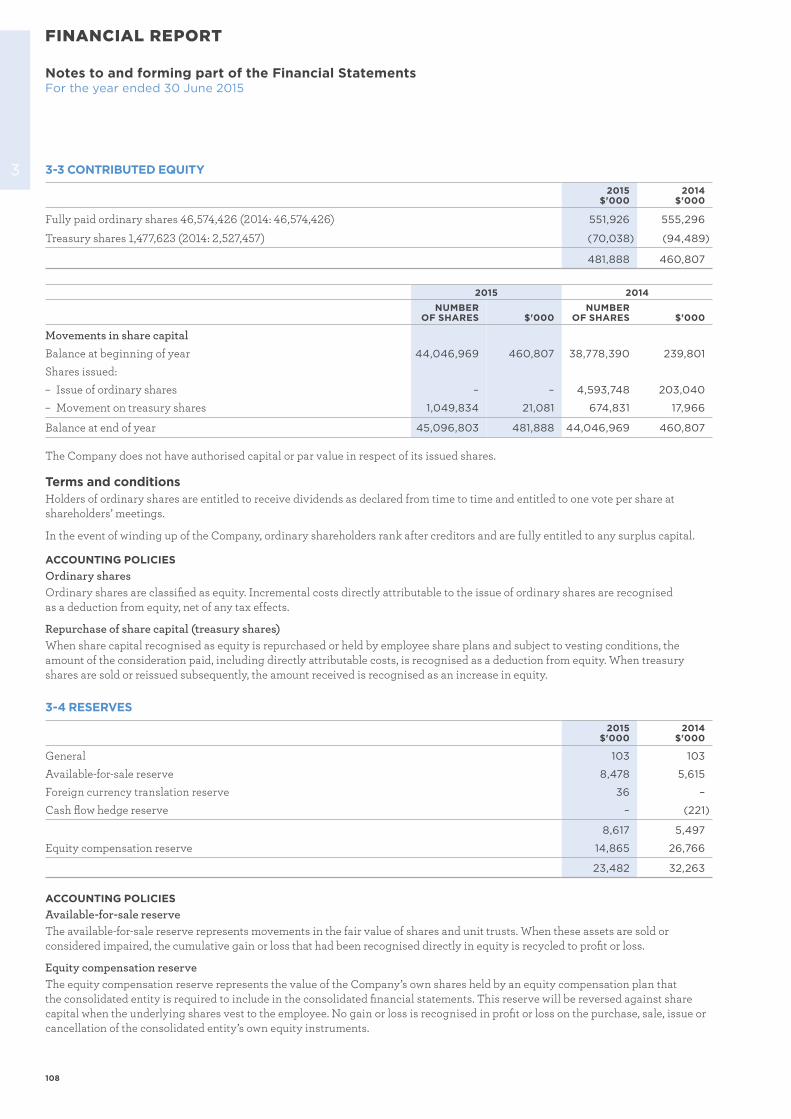
108
FINANCIAL REPORT
Notes to and forming part of the Financial StatementsFor the year ended 30 June 2015
3 3-3 CONTRIBUTED EQUITY
2015$'000
2014$'000
Fully paid ordinary shares 46,574,426 (2014: 46,574,426) 551,926 555,296
Treasury shares 1,477,623 (2014: 2,527,457) (70,038) (94,489)
481,888 460,807
2015 2014 NUMBER
OF SHARES $'000 NUMBER
OF SHARES $'000
Movements in share capital
Balance at beginning of year 44,046,969 460,807 38,778,390 239,801
Shares issued:
– Issue of ordinary shares – – 4,593,748 203,040
– Movement on treasury shares 1,049,834 21,081 674,831 17,966
Balance at end of year 45,096,803 481,888 44,046,969 460,807
The Company does not have authorised capital or par value in respect of its issued shares.
Terms and conditionsHolders of ordinary shares are entitled to receive dividends as declared from time to time and entitled to one vote per share at shareholders’ meetings.
In the event of winding up of the Company, ordinary shareholders rank after creditors and are fully entitled to any surplus capital.
ACCOUNTING POLICIESOrdinary sharesOrdinary shares are classified as equity. Incremental costs directly attributable to the issue of ordinary shares are recognised as a deduction from equity, net of any tax effects.
Repurchase of share capital (treasury shares)When share capital recognised as equity is repurchased or held by employee share plans and subject to vesting conditions, the amount of the consideration paid, including directly attributable costs, is recognised as a deduction from equity. When treasury shares are sold or reissued subsequently, the amount received is recognised as an increase in equity.
3-4 RESERVES
2015$'000
2014$'000
General 103 103
Available-for-sale reserve 8,478 5,615
Foreign currency translation reserve 36 –
Cash flow hedge reserve – (221)
8,617 5,497
Equity compensation reserve 14,865 26,766
23,482 32,263
ACCOUNTING POLICIESAvailable-for-sale reserveThe available-for-sale reserve represents movements in the fair value of shares and unit trusts. When these assets are sold or considered impaired, the cumulative gain or loss that had been recognised directly in equity is recycled to profit or loss.
Equity compensation reserveThe equity compensation reserve represents the value of the Company’s own shares held by an equity compensation plan that the consolidated entity is required to include in the consolidated financial statements. This reserve will be reversed against share capital when the underlying shares vest to the employee. No gain or loss is recognised in profit or loss on the purchase, sale, issue or cancellation of the consolidated entity’s own equity instruments.
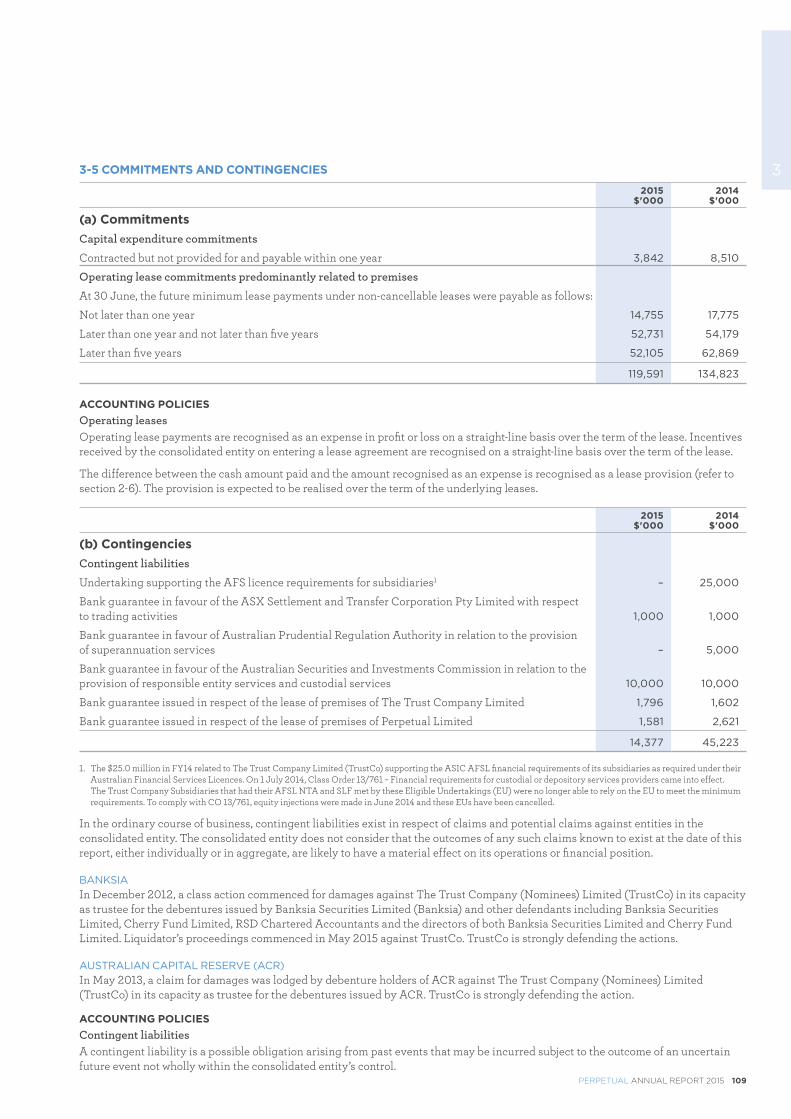
PERPETUAL ANNUAL REPORT 2015 109
33-5 COMMITMENTS AND CONTINGENCIES
2015$'000
2014$'000
(a) CommitmentsCapital expenditure commitments
Contracted but not provided for and payable within one year 3,842 8,510
Operating lease commitments predominantly related to premises
At 30 June, the future minimum lease payments under non-cancellable leases were payable as follows:
Not later than one year 14,755 17,775
Later than one year and not later than five years 52,731 54,179
Later than five years 52,105 62,869
119,591 134,823
ACCOUNTING POLICIESOperating leasesOperating lease payments are recognised as an expense in profit or loss on a straight-line basis over the term of the lease. Incentives received by the consolidated entity on entering a lease agreement are recognised on a straight-line basis over the term of the lease.
The difference between the cash amount paid and the amount recognised as an expense is recognised as a lease provision (refer to section 2-6). The provision is expected to be realised over the term of the underlying leases.
2015$'000
2014$'000
(b) ContingenciesContingent liabilities
Undertaking supporting the AFS licence requirements for subsidiaries1 – 25,000
Bank guarantee in favour of the ASX Settlement and Transfer Corporation Pty Limited with respect to trading activities 1,000 1,000
Bank guarantee in favour of Australian Prudential Regulation Authority in relation to the provision of superannuation services – 5,000
Bank guarantee in favour of the Australian Securities and Investments Commission in relation to the provision of responsible entity services and custodial services 10,000 10,000
Bank guarantee issued in respect of the lease of premises of The Trust Company Limited 1,796 1,602
Bank guarantee issued in respect of the lease of premises of Perpetual Limited 1,581 2,621
14,377 45,223
1. The $25.0 million in FY14 related to The Trust Company Limited (TrustCo) supporting the ASIC AFSL financial requirements of its subsidiaries as required under their Australian Financial Services Licences. On 1 July 2014, Class Order 13/761 – Financial requirements for custodial or depository services providers came into effect. The Trust Company Subsidiaries that had their AFSL NTA and SLF met by these Eligible Undertakings (EU) were no longer able to rely on the EU to meet the minimum requirements. To comply with CO 13/761, equity injections were made in June 2014 and these EUs have been cancelled.
In the ordinary course of business, contingent liabilities exist in respect of claims and potential claims against entities in the consolidated entity. The consolidated entity does not consider that the outcomes of any such claims known to exist at the date of this report, either individually or in aggregate, are likely to have a material effect on its operations or financial position.
BANKSIAIn December 2012, a class action commenced for damages against The Trust Company (Nominees) Limited (TrustCo) in its capacity as trustee for the debentures issued by Banksia Securities Limited (Banksia) and other defendants including Banksia Securities Limited, Cherry Fund Limited, RSD Chartered Accountants and the directors of both Banksia Securities Limited and Cherry Fund Limited. Liquidator’s proceedings commenced in May 2015 against TrustCo. TrustCo is strongly defending the actions.
AUSTRALIAN CAPITAL RESERVE (ACR)In May 2013, a claim for damages was lodged by debenture holders of ACR against The Trust Company (Nominees) Limited (TrustCo) in its capacity as trustee for the debentures issued by ACR. TrustCo is strongly defending the action.
ACCOUNTING POLICIESContingent liabilitiesA contingent liability is a possible obligation arising from past events that may be incurred subject to the outcome of an uncertain future event not wholly within the consolidated entity’s control.
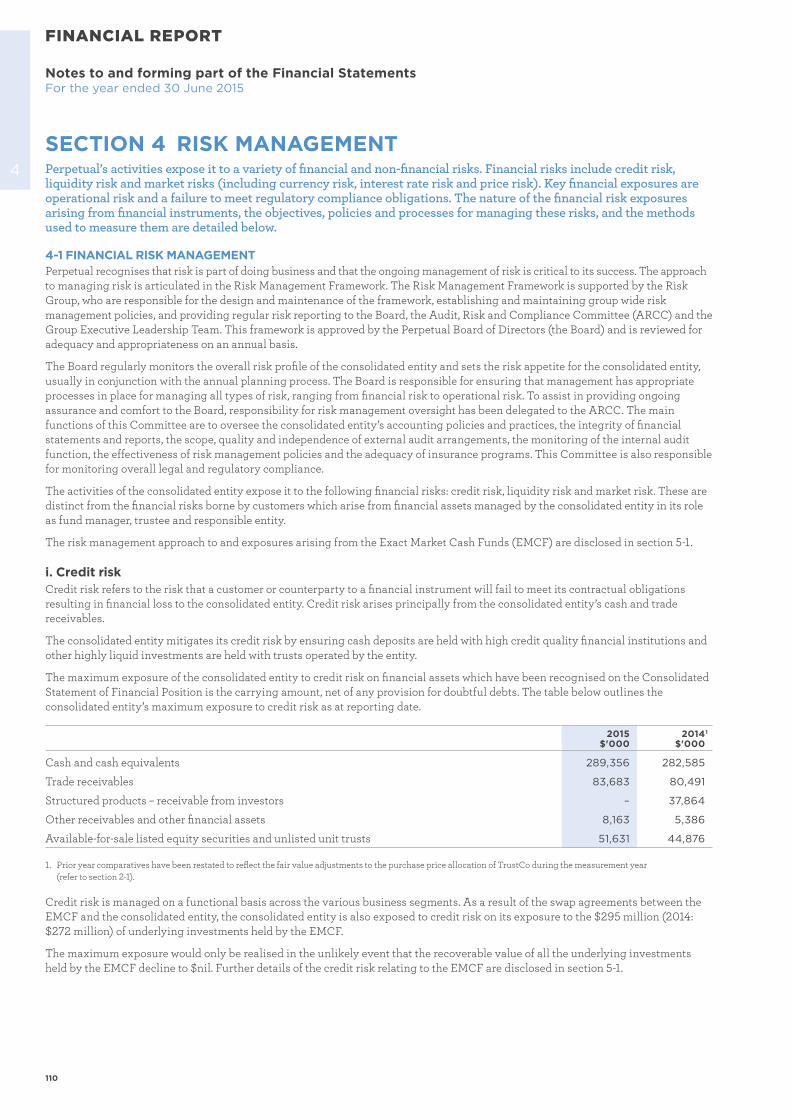
110
FINANCIAL REPORT
Notes to and forming part of the Financial StatementsFor the year ended 30 June 2015
4
4-1 FINANCIAL RISK MANAGEMENTPerpetual recognises that risk is part of doing business and that the ongoing management of risk is critical to its success. The approach to managing risk is articulated in the Risk Management Framework. The Risk Management Framework is supported by the Risk Group, who are responsible for the design and maintenance of the framework, establishing and maintaining group wide risk management policies, and providing regular risk reporting to the Board, the Audit, Risk and Compliance Committee (ARCC) and the Group Executive Leadership Team. This framework is approved by the Perpetual Board of Directors (the Board) and is reviewed for adequacy and appropriateness on an annual basis.
The Board regularly monitors the overall risk profile of the consolidated entity and sets the risk appetite for the consolidated entity, usually in conjunction with the annual planning process. The Board is responsible for ensuring that management has appropriate processes in place for managing all types of risk, ranging from financial risk to operational risk. To assist in providing ongoing assurance and comfort to the Board, responsibility for risk management oversight has been delegated to the ARCC. The main functions of this Committee are to oversee the consolidated entity’s accounting policies and practices, the integrity of financial statements and reports, the scope, quality and independence of external audit arrangements, the monitoring of the internal audit function, the effectiveness of risk management policies and the adequacy of insurance programs. This Committee is also responsible for monitoring overall legal and regulatory compliance.
The activities of the consolidated entity expose it to the following financial risks: credit risk, liquidity risk and market risk. These are distinct from the financial risks borne by customers which arise from financial assets managed by the consolidated entity in its role as fund manager, trustee and responsible entity.
The risk management approach to and exposures arising from the Exact Market Cash Funds (EMCF) are disclosed in section 5-1.
i. Credit riskCredit risk refers to the risk that a customer or counterparty to a financial instrument will fail to meet its contractual obligations resulting in financial loss to the consolidated entity. Credit risk arises principally from the consolidated entity’s cash and trade receivables.
The consolidated entity mitigates its credit risk by ensuring cash deposits are held with high credit quality financial institutions and other highly liquid investments are held with trusts operated by the entity.
The maximum exposure of the consolidated entity to credit risk on financial assets which have been recognised on the Consolidated Statement of Financial Position is the carrying amount, net of any provision for doubtful debts. The table below outlines the consolidated entity’s maximum exposure to credit risk as at reporting date.
2015$'000
2014 1
$'000
Cash and cash equivalents 289,356 282,585
Trade receivables 83,683 80,491
Structured products – receivable from investors – 37,864
Other receivables and other financial assets 8,163 5,386
Available-for-sale listed equity securities and unlisted unit trusts 51,631 44,876
1. Prior year comparatives have been restated to reflect the fair value adjustments to the purchase price allocation of TrustCo during the measurement year (refer to section 2-1).
Credit risk is managed on a functional basis across the various business segments. As a result of the swap agreements between the EMCF and the consolidated entity, the consolidated entity is also exposed to credit risk on its exposure to the $295 million (2014: $272 million) of underlying investments held by the EMCF.
The maximum exposure would only be realised in the unlikely event that the recoverable value of all the underlying investments held by the EMCF decline to $nil. Further details of the credit risk relating to the EMCF are disclosed in section 5-1.
Perpetual’s activities expose it to a variety of financial and non-financial risks. Financial risks include credit risk, liquidity risk and market risks (including currency risk, interest rate risk and price risk). Key financial exposures are operational risk and a failure to meet regulatory compliance obligations. The nature of the financial risk exposures arising from financial instruments, the objectives, policies and processes for managing these risks, and the methods used to measure them are detailed below.
SECTION 4 RISK MANAGEMENT
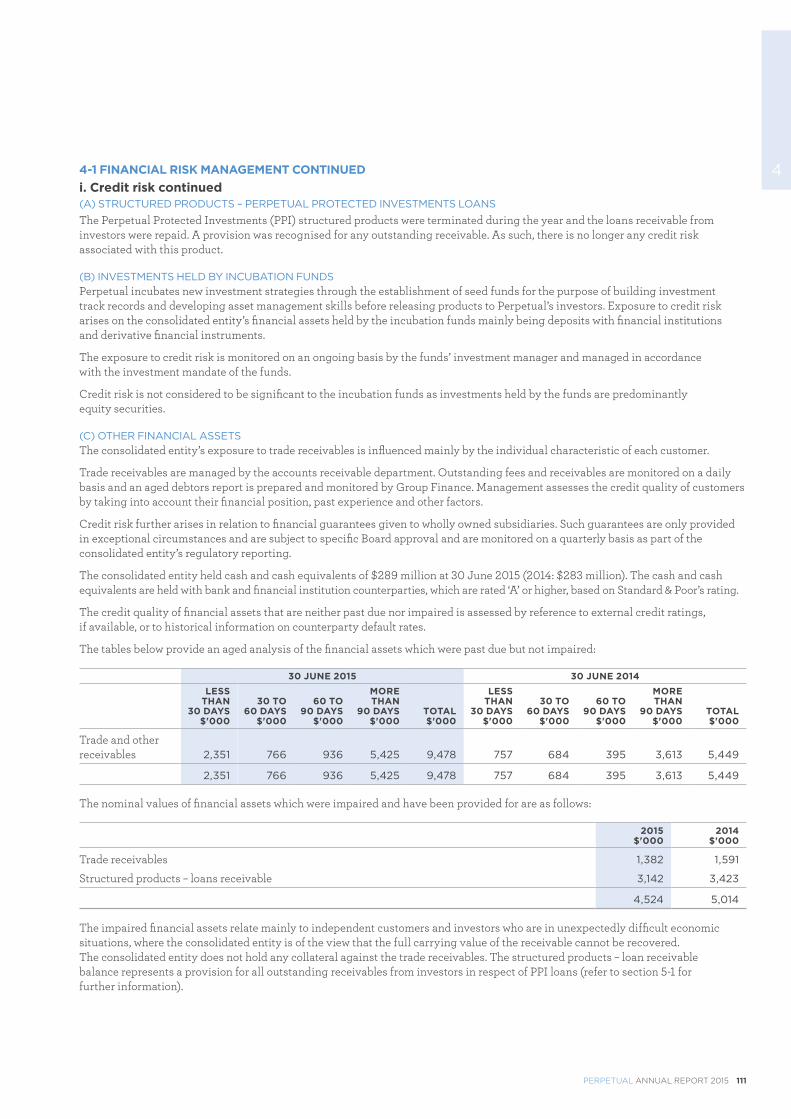
PERPETUAL ANNUAL REPORT 2015 111
44-1 FINANCIAL RISK MANAGEMENT CONTINUEDi. Credit risk continued(A) STRUCTURED PRODUCTS – PERPETUAL PROTECTED INVESTMENTS LOANS
The Perpetual Protected Investments (PPI) structured products were terminated during the year and the loans receivable from investors were repaid. A provision was recognised for any outstanding receivable. As such, there is no longer any credit risk associated with this product.
(B) INVESTMENTS HELD BY INCUBATION FUNDSPerpetual incubates new investment strategies through the establishment of seed funds for the purpose of building investment track records and developing asset management skills before releasing products to Perpetual’s investors. Exposure to credit risk arises on the consolidated entity’s financial assets held by the incubation funds mainly being deposits with financial institutions and derivative financial instruments.
The exposure to credit risk is monitored on an ongoing basis by the funds’ investment manager and managed in accordance with the investment mandate of the funds.
Credit risk is not considered to be significant to the incubation funds as investments held by the funds are predominantly equity securities.
(C) OTHER FINANCIAL ASSETSThe consolidated entity’s exposure to trade receivables is influenced mainly by the individual characteristic of each customer.
Trade receivables are managed by the accounts receivable department. Outstanding fees and receivables are monitored on a daily basis and an aged debtors report is prepared and monitored by Group Finance. Management assesses the credit quality of customers by taking into account their financial position, past experience and other factors.
Credit risk further arises in relation to financial guarantees given to wholly owned subsidiaries. Such guarantees are only provided in exceptional circumstances and are subject to specific Board approval and are monitored on a quarterly basis as part of the consolidated entity’s regulatory reporting.
The consolidated entity held cash and cash equivalents of $289 million at 30 June 2015 (2014: $283 million). The cash and cash equivalents are held with bank and financial institution counterparties, which are rated ‘A’ or higher, based on Standard & Poor’s rating.
The credit quality of financial assets that are neither past due nor impaired is assessed by reference to external credit ratings, if available, or to historical information on counterparty default rates.
The tables below provide an aged analysis of the financial assets which were past due but not impaired:
30 JUNE 2015 30 JUNE 2014LESS
THAN30 DAYS
$'000
30 TO 60 DAYS
$'000
60 TO 90 DAYS
$'000
MORETHAN
90 DAYS$'000
TOTAL$'000
LESS THAN
30 DAYS$'000
30 TO 60 DAYS
$'000
60 TO 90 DAYS
$'000
MORETHAN
90 DAYS$'000
TOTAL$'000
Trade and other receivables 2,351 766 936 5,425 9,478 757 684 395 3,613 5,449
2,351 766 936 5,425 9,478 757 684 395 3,613 5,449
The nominal values of financial assets which were impaired and have been provided for are as follows:
2015$'000
2014$'000
Trade receivables 1,382 1,591
Structured products – loans receivable 3,142 3,423
4,524 5,014
The impaired financial assets relate mainly to independent customers and investors who are in unexpectedly difficult economic situations, where the consolidated entity is of the view that the full carrying value of the receivable cannot be recovered. The consolidated entity does not hold any collateral against the trade receivables. The structured products – loan receivable balance represents a provision for all outstanding receivables from investors in respect of PPI loans (refer to section 5-1 for further information).
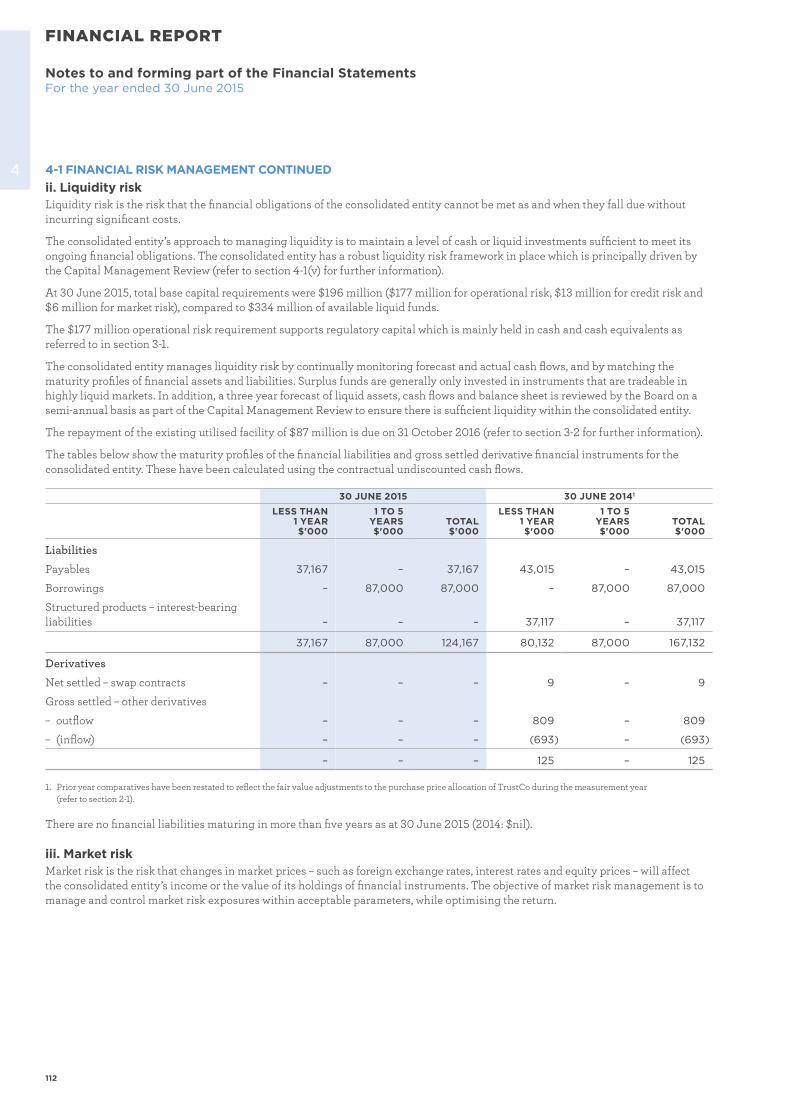
112
Notes to and forming part of the Financial StatementsFor the year ended 30 June 2015
FINANCIAL REPORT
4 4-1 FINANCIAL RISK MANAGEMENT CONTINUEDii. Liquidity riskLiquidity risk is the risk that the financial obligations of the consolidated entity cannot be met as and when they fall due without incurring significant costs.
The consolidated entity’s approach to managing liquidity is to maintain a level of cash or liquid investments sufficient to meet its ongoing financial obligations. The consolidated entity has a robust liquidity risk framework in place which is principally driven by the Capital Management Review (refer to section 4-1(v) for further information).
At 30 June 2015, total base capital requirements were $196 million ($177 million for operational risk, $13 million for credit risk and $6 million for market risk), compared to $334 million of available liquid funds.
The $177 million operational risk requirement supports regulatory capital which is mainly held in cash and cash equivalents as referred to in section 3-1.
The consolidated entity manages liquidity risk by continually monitoring forecast and actual cash flows, and by matching the maturity profiles of financial assets and liabilities. Surplus funds are generally only invested in instruments that are tradeable in highly liquid markets. In addition, a three year forecast of liquid assets, cash flows and balance sheet is reviewed by the Board on a semi-annual basis as part of the Capital Management Review to ensure there is sufficient liquidity within the consolidated entity.
The repayment of the existing utilised facility of $87 million is due on 31 October 2016 (refer to section 3-2 for further information).
The tables below show the maturity profiles of the financial liabilities and gross settled derivative financial instruments for the consolidated entity. These have been calculated using the contractual undiscounted cash flows.
30 JUNE 2015 30 JUNE 20141
LESS THAN 1 YEAR$'000
1 TO 5 YEARS $'000
TOTAL $'000
LESS THAN 1 YEAR$'000
1 TO 5YEARS$'000
TOTAL $'000
Liabilities
Payables 37,167 – 37,167 43,015 – 43,015
Borrowings – 87,000 87,000 – 87,000 87,000
Structured products – interest-bearing liabilities – – – 37,117 – 37,117
37,167 87,000 124,167 80,132 87,000 167,132
Derivatives
Net settled – swap contracts – – – 9 – 9
Gross settled – other derivatives
– outflow – – – 809 – 809
– (inflow) – – – (693) – (693)
– – – 125 – 125
1. Prior year comparatives have been restated to reflect the fair value adjustments to the purchase price allocation of TrustCo during the measurement year (refer to section 2-1).
There are no financial liabilities maturing in more than five years as at 30 June 2015 (2014: $nil).
iii. Market riskMarket risk is the risk that changes in market prices – such as foreign exchange rates, interest rates and equity prices – will affect the consolidated entity’s income or the value of its holdings of financial instruments. The objective of market risk management is to manage and control market risk exposures within acceptable parameters, while optimising the return.
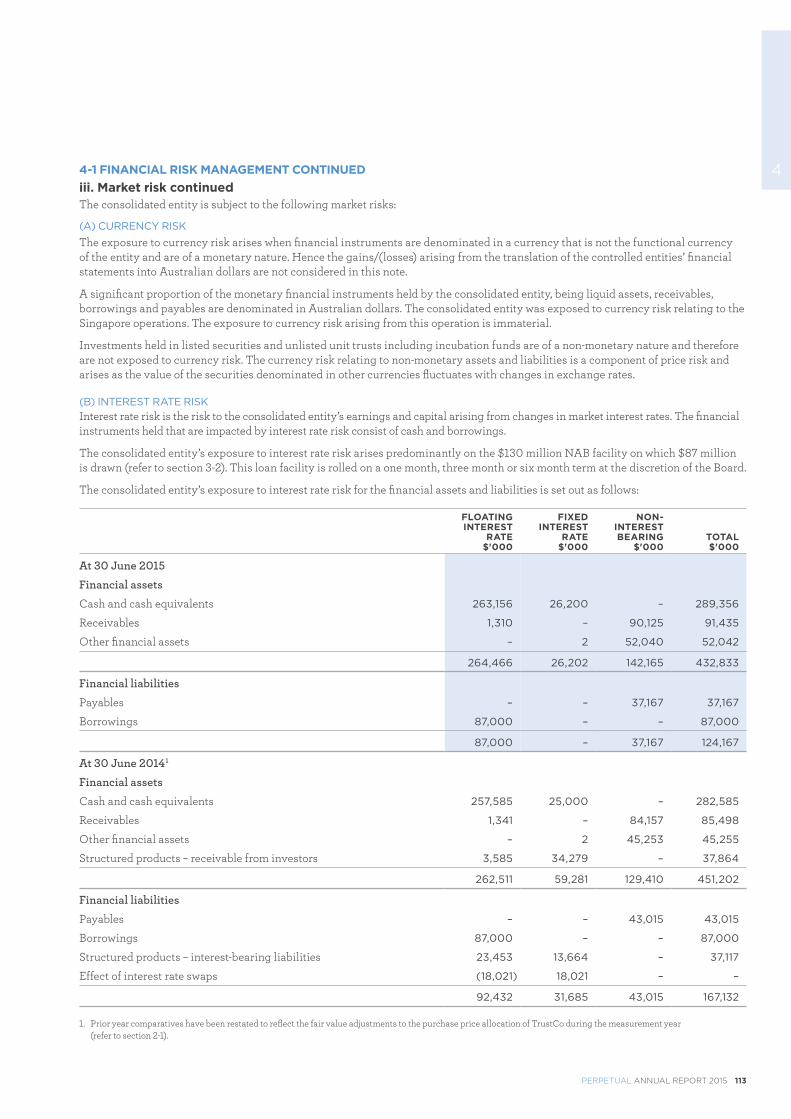
PERPETUAL ANNUAL REPORT 2015 113
44-1 FINANCIAL RISK MANAGEMENT CONTINUEDiii. Market risk continuedThe consolidated entity is subject to the following market risks:
(A) CURRENCY RISK
The exposure to currency risk arises when financial instruments are denominated in a currency that is not the functional currency of the entity and are of a monetary nature. Hence the gains/(losses) arising from the translation of the controlled entities’ financial statements into Australian dollars are not considered in this note.
A significant proportion of the monetary financial instruments held by the consolidated entity, being liquid assets, receivables, borrowings and payables are denominated in Australian dollars. The consolidated entity was exposed to currency risk relating to the Singapore operations. The exposure to currency risk arising from this operation is immaterial.
Investments held in listed securities and unlisted unit trusts including incubation funds are of a non-monetary nature and therefore are not exposed to currency risk. The currency risk relating to non-monetary assets and liabilities is a component of price risk and arises as the value of the securities denominated in other currencies fluctuates with changes in exchange rates.
(B) INTEREST RATE RISKInterest rate risk is the risk to the consolidated entity’s earnings and capital arising from changes in market interest rates. The financial instruments held that are impacted by interest rate risk consist of cash and borrowings.
The consolidated entity’s exposure to interest rate risk arises predominantly on the $130 million NAB facility on which $87 million is drawn (refer to section 3-2). This loan facility is rolled on a one month, three month or six month term at the discretion of the Board.
The consolidated entity’s exposure to interest rate risk for the financial assets and liabilities is set out as follows:
FLOATING INTEREST
RATE$'000
FIXED INTEREST
RATE$'000
NON-INTERESTBEARING
$'000TOTAL$'000
At 30 June 2015
Financial assets
Cash and cash equivalents 263,156 26,200 – 289,356
Receivables 1,310 – 90,125 91,435
Other financial assets – 2 52,040 52,042
264,466 26,202 142,165 432,833
Financial liabilities
Payables – – 37,167 37,167
Borrowings 87,000 – – 87,000
87,000 – 37,167 124,167
At 30 June 20141
Financial assets
Cash and cash equivalents 257,585 25,000 – 282,585
Receivables 1,341 – 84,157 85,498
Other financial assets – 2 45,253 45,255
Structured products – receivable from investors 3,585 34,279 – 37,864
262,511 59,281 129,410 451,202
Financial liabilities
Payables – – 43,015 43,015
Borrowings 87,000 – – 87,000
Structured products – interest-bearing liabilities 23,453 13,664 – 37,117
Effect of interest rate swaps (18,021) 18,021 – –
92,432 31,685 43,015 167,132
1. Prior year comparatives have been restated to reflect the fair value adjustments to the purchase price allocation of TrustCo during the measurement year (refer to section 2-1).
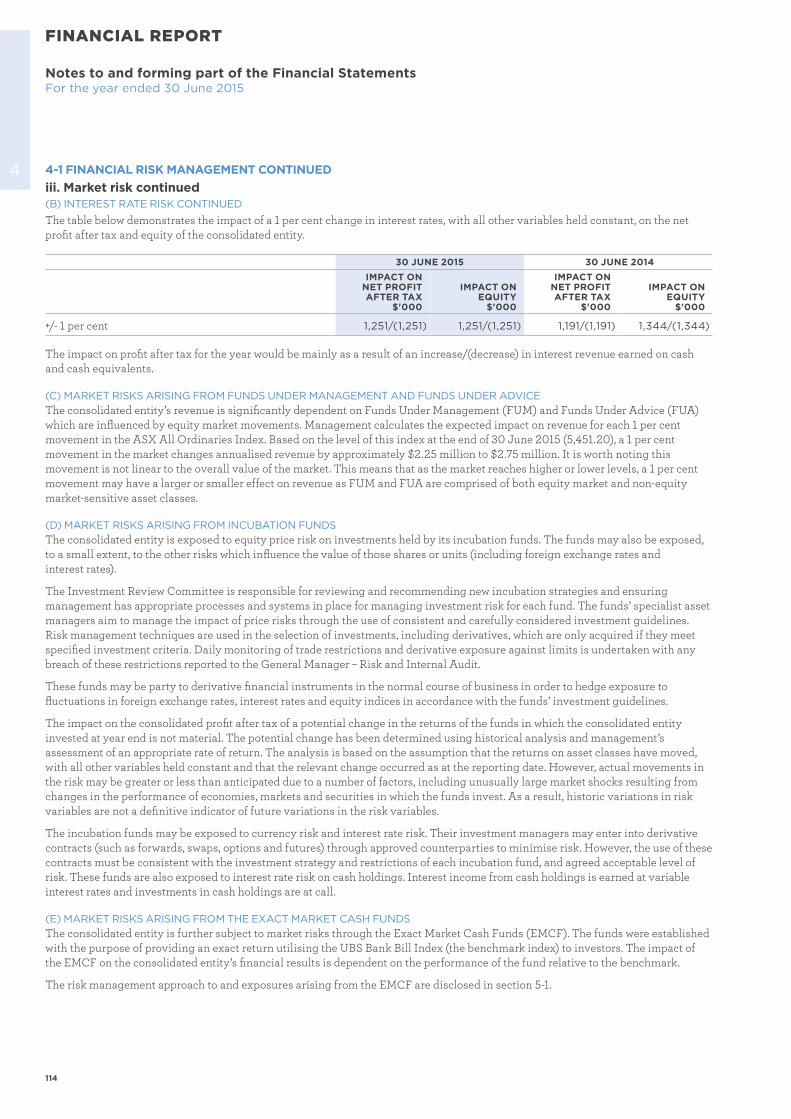
114
FINANCIAL REPORT
Notes to and forming part of the Financial StatementsFor the year ended 30 June 2015
4 4-1 FINANCIAL RISK MANAGEMENT CONTINUEDiii. Market risk continued(B) INTEREST RATE RISK CONTINUED
The table below demonstrates the impact of a 1 per cent change in interest rates, with all other variables held constant, on the net profit after tax and equity of the consolidated entity.
30 JUNE 2015 30 JUNE 2014IMPACT ON
NET PROFIT AFTER TAX
$'000
IMPACT ONEQUITY
$'000
IMPACT ON NET PROFIT AFTER TAX
$'000
IMPACT ONEQUITY
$'000
+/- 1 per cent 1,251/(1,251) 1,251/(1,251) 1,191/(1,191) 1,344/(1,344)
The impact on profit after tax for the year would be mainly as a result of an increase/(decrease) in interest revenue earned on cash and cash equivalents.
(C) MARKET RISKS ARISING FROM FUNDS UNDER MANAGEMENT AND FUNDS UNDER ADVICEThe consolidated entity’s revenue is significantly dependent on Funds Under Management (FUM) and Funds Under Advice (FUA) which are influenced by equity market movements. Management calculates the expected impact on revenue for each 1 per cent movement in the ASX All Ordinaries Index. Based on the level of this index at the end of 30 June 2015 (5,451.20), a 1 per cent movement in the market changes annualised revenue by approximately $2.25 million to $2.75 million. It is worth noting this movement is not linear to the overall value of the market. This means that as the market reaches higher or lower levels, a 1 per cent movement may have a larger or smaller effect on revenue as FUM and FUA are comprised of both equity market and non-equity market-sensitive asset classes.
(D) MARKET RISKS ARISING FROM INCUBATION FUNDSThe consolidated entity is exposed to equity price risk on investments held by its incubation funds. The funds may also be exposed, to a small extent, to the other risks which influence the value of those shares or units (including foreign exchange rates and interest rates).
The Investment Review Committee is responsible for reviewing and recommending new incubation strategies and ensuring management has appropriate processes and systems in place for managing investment risk for each fund. The funds’ specialist asset managers aim to manage the impact of price risks through the use of consistent and carefully considered investment guidelines. Risk management techniques are used in the selection of investments, including derivatives, which are only acquired if they meet specified investment criteria. Daily monitoring of trade restrictions and derivative exposure against limits is undertaken with any breach of these restrictions reported to the General Manager – Risk and Internal Audit.
These funds may be party to derivative financial instruments in the normal course of business in order to hedge exposure to fluctuations in foreign exchange rates, interest rates and equity indices in accordance with the funds’ investment guidelines.
The impact on the consolidated profit after tax of a potential change in the returns of the funds in which the consolidated entity invested at year end is not material. The potential change has been determined using historical analysis and management’s assessment of an appropriate rate of return. The analysis is based on the assumption that the returns on asset classes have moved, with all other variables held constant and that the relevant change occurred as at the reporting date. However, actual movements in the risk may be greater or less than anticipated due to a number of factors, including unusually large market shocks resulting from changes in the performance of economies, markets and securities in which the funds invest. As a result, historic variations in risk variables are not a definitive indicator of future variations in the risk variables.
The incubation funds may be exposed to currency risk and interest rate risk. Their investment managers may enter into derivative contracts (such as forwards, swaps, options and futures) through approved counterparties to minimise risk. However, the use of these contracts must be consistent with the investment strategy and restrictions of each incubation fund, and agreed acceptable level of risk. These funds are also exposed to interest rate risk on cash holdings. Interest income from cash holdings is earned at variable interest rates and investments in cash holdings are at call.
(E) MARKET RISKS ARISING FROM THE EXACT MARKET CASH FUNDSThe consolidated entity is further subject to market risks through the Exact Market Cash Funds (EMCF). The funds were established with the purpose of providing an exact return utilising the UBS Bank Bill Index (the benchmark index) to investors. The impact of the EMCF on the consolidated entity’s financial results is dependent on the performance of the fund relative to the benchmark.
The risk management approach to and exposures arising from the EMCF are disclosed in section 5-1.
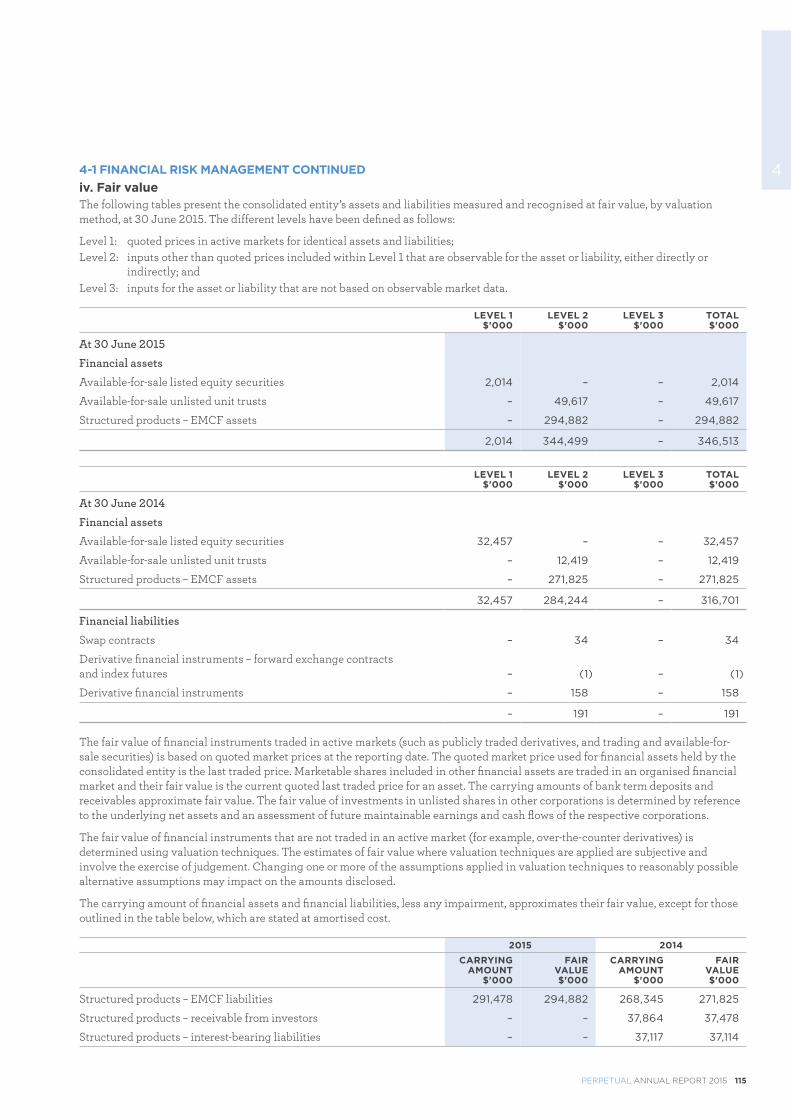
PERPETUAL ANNUAL REPORT 2015 115
44-1 FINANCIAL RISK MANAGEMENT CONTINUEDiv. Fair valueThe following tables present the consolidated entity’s assets and liabilities measured and recognised at fair value, by valuation method, at 30 June 2015. The different levels have been defined as follows:
Level 1: quoted prices in active markets for identical assets and liabilities;Level 2: inputs other than quoted prices included within Level 1 that are observable for the asset or liability, either directly or
indirectly; andLevel 3: inputs for the asset or liability that are not based on observable market data.
LEVEL 1$'000
LEVEL 2$'000
LEVEL 3 $'000
TOTAL$'000
At 30 June 2015
Financial assets
Available-for-sale listed equity securities 2,014 – – 2,014
Available-for-sale unlisted unit trusts – 49,617 – 49,617
Structured products – EMCF assets – 294,882 – 294,882
2,014 344,499 – 346,513
LEVEL 1$'000
LEVEL 2$'000
LEVEL 3 $'000
TOTAL$'000
At 30 June 2014
Financial assets
Available-for-sale listed equity securities 32,457 – – 32,457
Available-for-sale unlisted unit trusts – 12,419 – 12,419
Structured products – EMCF assets – 271,825 – 271,825
32,457 284,244 – 316,701
Financial liabilities
Swap contracts – 34 – 34
Derivative financial instruments – forward exchange contracts and index futures – (1) – (1)
Derivative financial instruments – 158 – 158
– 191 – 191
The fair value of financial instruments traded in active markets (such as publicly traded derivatives, and trading and available-for-sale securities) is based on quoted market prices at the reporting date. The quoted market price used for financial assets held by the consolidated entity is the last traded price. Marketable shares included in other financial assets are traded in an organised financial market and their fair value is the current quoted last traded price for an asset. The carrying amounts of bank term deposits and receivables approximate fair value. The fair value of investments in unlisted shares in other corporations is determined by reference to the underlying net assets and an assessment of future maintainable earnings and cash flows of the respective corporations.
The fair value of financial instruments that are not traded in an active market (for example, over-the-counter derivatives) is determined using valuation techniques. The estimates of fair value where valuation techniques are applied are subjective and involve the exercise of judgement. Changing one or more of the assumptions applied in valuation techniques to reasonably possible alternative assumptions may impact on the amounts disclosed.
The carrying amount of financial assets and financial liabilities, less any impairment, approximates their fair value, except for those outlined in the table below, which are stated at amortised cost.
2015 2014CARRYING
AMOUNT$'000
FAIRVALUE$'000
CARRYING AMOUNT
$'000
FAIRVALUE$'000
Structured products – EMCF liabilities 291,478 294,882 268,345 271,825
Structured products – receivable from investors – – 37,864 37,478
Structured products – interest-bearing liabilities – – 37,117 37,114
116
Notes to and forming part of the Financial StatementsFor the year ended 30 June 2015
FINANCIAL REPORT
4 4-1 FINANCIAL RISK MANAGEMENT CONTINUEDv. Capital risk managementA Capital Management Review is carried out on a semi-annual basis and is submitted to the Board for review and approval. The Group Policy – Treasury ensures that the level of financial conservatism is appropriate for the Company’s businesses including acting as custodian and manager of clients’ assets and operation as a trustee company. This policy also aims to provide business stability and accommodate the growth needs of the consolidated entity. This policy comprises three parts:
(A) DIVIDEND POLICYDividends paid to shareholders are typically in the range of 80-100 per cent of the consolidated entity’s net profit after tax attributable to members of the Company, which is in line with the historical dividend range paid to shareholders. In certain circumstances, the Board may declare a dividend outside that range.
(B) REVIEW OF CAPITAL AND DISTRIBUTION OF EXCESS CAPITALA review of the consolidated entity’s capital base is performed at least semi-annually and excess capital that is surplus to the consolidated entity’s current requirements may potentially be returned to shareholders in the absence of a strategically aligned, value accretive investment opportunity.
(C) GEARING POLICYThe current gearing policy aims to target an investment grade credit rating by maintaining a corporate debt to capital ratio (corporate debt/(corporate debt + equity) of 30% or less and EBITDA interest cover (EBITDA/interest expense) of more than 10 times. Based on the corporate debt of $87.0 million, the gearing ratio is 13.0% as at 30 June 2015 (2014: 13.5%) and well within the stated gearing policy. The EBIT interest cover ratio for the consolidated entity as at 30 June 2015 was 51 times (2014: 44 times).
ACCOUNTING POLICIESThe consolidated entity initially recognises loans and receivables and deposits on the date that they are originated. All other financial assets (including assets designated at fair value through profit or loss) are recognised initially on the trade date at which the consolidated entity becomes a party to the contractual provisions of the instrument.
Financial liabilities (including liabilities designated at fair value through profit or loss) are recognised initially on the trade date at which the consolidated entity becomes a party to the contractual provisions of the instrument. The consolidated entity derecognises a financial liability when its contractual obligations are discharged or cancelled or expire.
(a) Available-for-sale financial assetsThese assets are initially recognised at fair value plus any directly attributable transaction costs. Subsequent to initial recognition, they are measured at fair value and changes therein, other than impairment losses, are recognised in other comprehensive income. When an investment is derecognised, the cumulative gain or loss in equity is transferred to profit or loss. The fair value of financial instruments classified as available-for-sale is their quoted bid price at the reporting date.
(b) Investments at fair value through profit or lossInvestments are classified at fair value through profit or loss if they are held for trading or designated as such upon initial recognition. The consolidated entity’s derivative instruments within asset management incubation funds are classified as held for trading financial assets. On initial recognition, attributable transaction costs are recognised in profit or loss when incurred. Financial instruments designated at fair value through profit or loss are measured at fair value and changes recognised in profit or loss.
(c) LoansLoans are recognised initially at fair value plus any directly attributable transaction costs. Subsequent to initial recognition, loans and receivables are measured at amortised cost using the effective interest method less impairment losses.
The consolidated entity derecognises a financial asset when the contractual rights to the cash flows from the asset expire, or it transfers the rights to receive the contractual cash flows on the financial asset in a transaction in which substantially all the risks and rewards of ownership of the financial asset are transferred. Any interest in transferred financial assets that is created or retained by the consolidated entity is recognised as a separate asset or liability.
Financial assets and liabilities are offset and the net amount presented in the Consolidated Statement of Financial Position when, and only when, the consolidated entity has a legal right to offset the amounts and intends either to settle on a net basis or to realise the asset and settle the liability simultaneously.
PERPETUAL ANNUAL REPORT 2015 117
44-1 FINANCIAL RISK MANAGEMENT CONTINUEDACCOUNTING POLICIES CONTINUED(d) Derivative financial instrumentsThe consolidated entity holds derivative financial instruments within incubation funds to hedge its interest rate, foreign exchange and market risk exposures.
On initial designation of the hedge, the consolidated entity formally documents the relationship between the hedging instrument and the hedged item, including the risk management objectives and strategy in undertaking the hedge transaction, together with the methods that will be used to assess the effectiveness of the hedging relationship. The consolidated entity makes an assessment, both at the inception of the hedge relationship as well as on an ongoing basis, whether the hedging instruments are expected to be ‘highly effective’ in offsetting the changes in the fair value or cash flows of the respective hedged items during the period for which the hedge is designated, and whether the actual results of each hedge are within a range of 80-125 per cent. For a cash flow hedge of a forecast transaction, the transaction should be highly probable to occur and should present an exposure to variations in cash flows that could ultimately affect reported net income.
Derivatives are recognised initially at fair value. Attributable transaction costs are recognised in profit or loss when incurred.
(e) Financial guarantee contractsFinancial guarantee contracts are recognised as a financial liability at the time the guarantee is issued. Financial guarantees are given to wholly owned subsidiaries, within the consolidated entity. Such guarantees are only provided in exceptional circumstances and are subject to specific Board approval and are monitored on a quarterly basis as part of the consolidated entity’s regulatory reporting.
The liability is initially measured at fair value and subsequently at the higher of the amount determined in accordance with AASB 137 Provisions, Contingent Liabilities and Contingent Assets and the amount initially recognised less cumulative amortisation, where appropriate.
Where guarantees in relation to loans or other payables of subsidiaries are provided for no compensation, the fair values are accounted for as contributions and recognised as part of the cost of the investment.
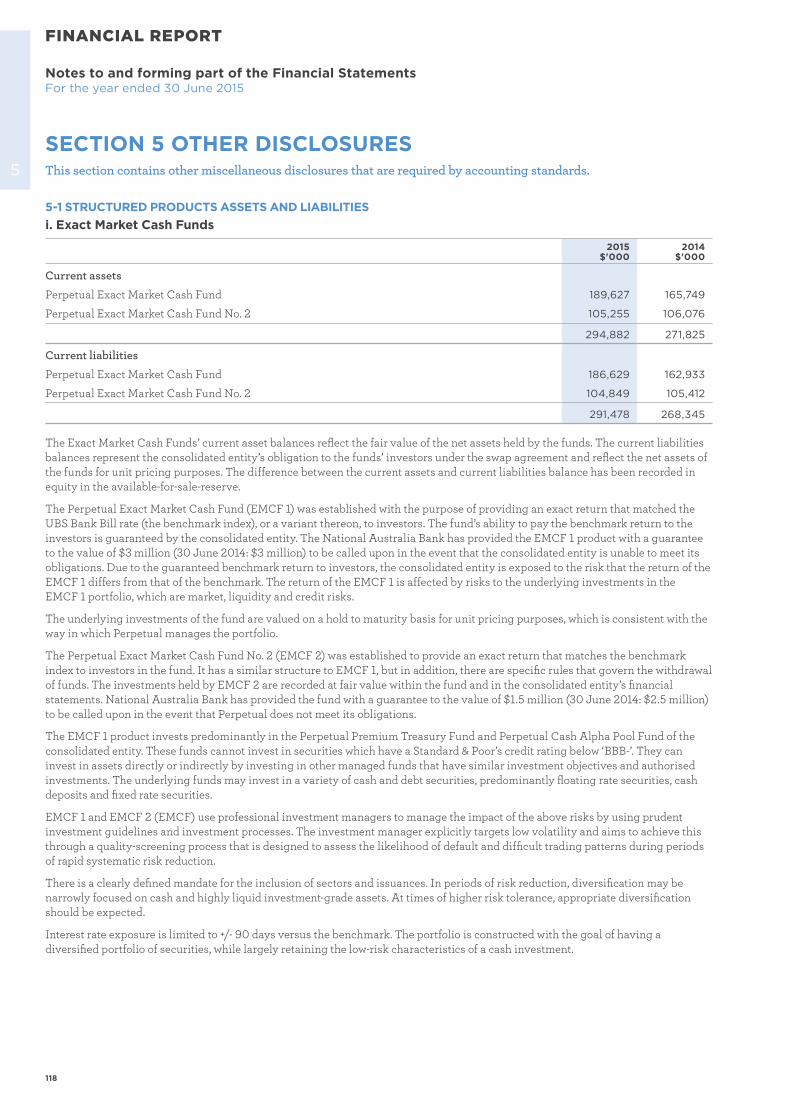
118
FINANCIAL REPORT
Notes to and forming part of the Financial StatementsFor the year ended 30 June 2015
5 This section contains other miscellaneous disclosures that are required by accounting standards.
5-1 STRUCTURED PRODUCTS ASSETS AND LIABILITIESi. Exact Market Cash Funds
2015$'000
2014$'000
Current assets
Perpetual Exact Market Cash Fund 189,627 165,749
Perpetual Exact Market Cash Fund No. 2 105,255 106,076
294,882 271,825
Current liabilities
Perpetual Exact Market Cash Fund 186,629 162,933
Perpetual Exact Market Cash Fund No. 2 104,849 105,412
291,478 268,345
The Exact Market Cash Funds’ current asset balances reflect the fair value of the net assets held by the funds. The current liabilities balances represent the consolidated entity’s obligation to the funds’ investors under the swap agreement and reflect the net assets of the funds for unit pricing purposes. The difference between the current assets and current liabilities balance has been recorded in equity in the available-for-sale-reserve.
The Perpetual Exact Market Cash Fund (EMCF 1) was established with the purpose of providing an exact return that matched the UBS Bank Bill rate (the benchmark index), or a variant thereon, to investors. The fund’s ability to pay the benchmark return to the investors is guaranteed by the consolidated entity. The National Australia Bank has provided the EMCF 1 product with a guarantee to the value of $3 million (30 June 2014: $3 million) to be called upon in the event that the consolidated entity is unable to meet its obligations. Due to the guaranteed benchmark return to investors, the consolidated entity is exposed to the risk that the return of the EMCF 1 differs from that of the benchmark. The return of the EMCF 1 is affected by risks to the underlying investments in the EMCF 1 portfolio, which are market, liquidity and credit risks.
The underlying investments of the fund are valued on a hold to maturity basis for unit pricing purposes, which is consistent with the way in which Perpetual manages the portfolio.
The Perpetual Exact Market Cash Fund No. 2 (EMCF 2) was established to provide an exact return that matches the benchmark index to investors in the fund. It has a similar structure to EMCF 1, but in addition, there are specific rules that govern the withdrawal of funds. The investments held by EMCF 2 are recorded at fair value within the fund and in the consolidated entity’s financial statements. National Australia Bank has provided the fund with a guarantee to the value of $1.5 million (30 June 2014: $2.5 million) to be called upon in the event that Perpetual does not meet its obligations.
The EMCF 1 product invests predominantly in the Perpetual Premium Treasury Fund and Perpetual Cash Alpha Pool Fund of the consolidated entity. These funds cannot invest in securities which have a Standard & Poor’s credit rating below ‘BBB-’. They can invest in assets directly or indirectly by investing in other managed funds that have similar investment objectives and authorised investments. The underlying funds may invest in a variety of cash and debt securities, predominantly floating rate securities, cash deposits and fixed rate securities.
EMCF 1 and EMCF 2 (EMCF) use professional investment managers to manage the impact of the above risks by using prudent investment guidelines and investment processes. The investment manager explicitly targets low volatility and aims to achieve this through a quality-screening process that is designed to assess the likelihood of default and difficult trading patterns during periods of rapid systematic risk reduction.
There is a clearly defined mandate for the inclusion of sectors and issuances. In periods of risk reduction, diversification may be narrowly focused on cash and highly liquid investment-grade assets. At times of higher risk tolerance, appropriate diversification should be expected.
Interest rate exposure is limited to +/- 90 days versus the benchmark. The portfolio is constructed with the goal of having a diversified portfolio of securities, while largely retaining the low-risk characteristics of a cash investment.
SECTION 5 OTHER DISCLOSURES
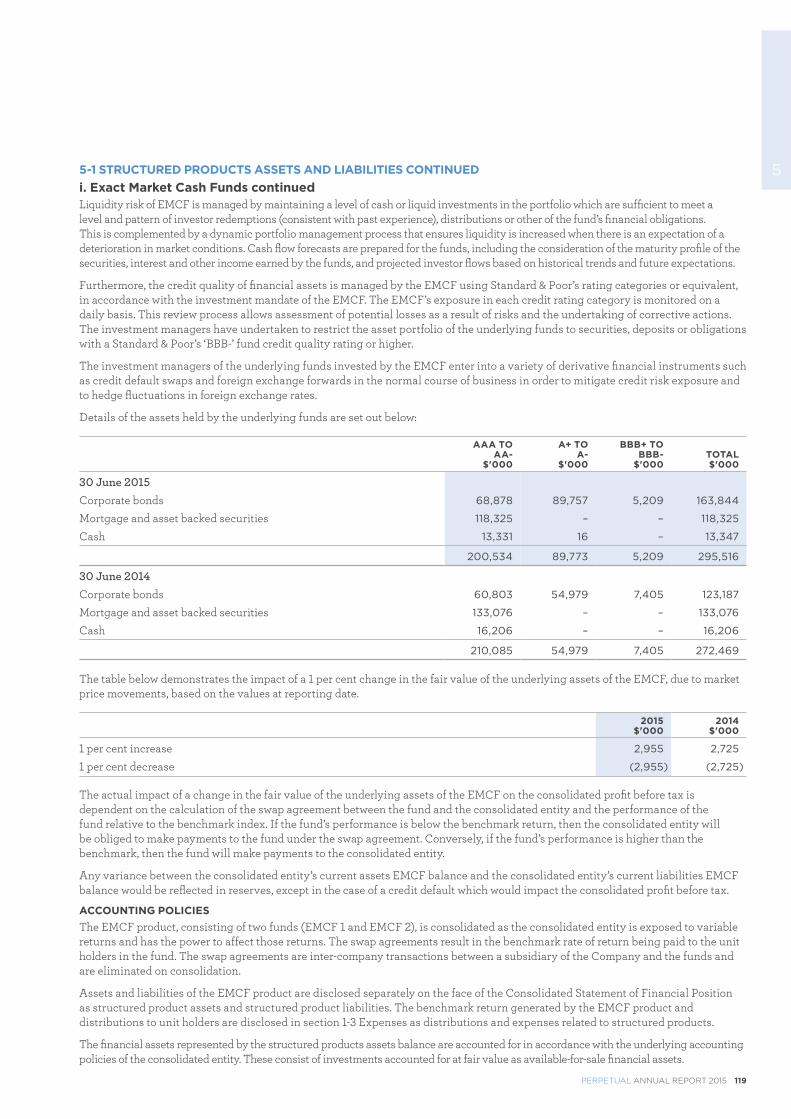
PERPETUAL ANNUAL REPORT 2015 119
55-1 STRUCTURED PRODUCTS ASSETS AND LIABILITIES CONTINUEDi. Exact Market Cash Funds continuedLiquidity risk of EMCF is managed by maintaining a level of cash or liquid investments in the portfolio which are sufficient to meet a level and pattern of investor redemptions (consistent with past experience), distributions or other of the fund’s financial obligations. This is complemented by a dynamic portfolio management process that ensures liquidity is increased when there is an expectation of a deterioration in market conditions. Cash flow forecasts are prepared for the funds, including the consideration of the maturity profile of the securities, interest and other income earned by the funds, and projected investor flows based on historical trends and future expectations.
Furthermore, the credit quality of financial assets is managed by the EMCF using Standard & Poor’s rating categories or equivalent, in accordance with the investment mandate of the EMCF. The EMCF’s exposure in each credit rating category is monitored on a daily basis. This review process allows assessment of potential losses as a result of risks and the undertaking of corrective actions. The investment managers have undertaken to restrict the asset portfolio of the underlying funds to securities, deposits or obligations with a Standard & Poor’s ‘BBB-’ fund credit quality rating or higher.
The investment managers of the underlying funds invested by the EMCF enter into a variety of derivative financial instruments such as credit default swaps and foreign exchange forwards in the normal course of business in order to mitigate credit risk exposure and to hedge fluctuations in foreign exchange rates.
Details of the assets held by the underlying funds are set out below:
AAA TOAA-
$'000
A+ TOA-
$'000
BBB+ TOBBB-
$'000 TOTAL
$'000
30 June 2015
Corporate bonds 68,878 89,757 5,209 163,844
Mortgage and asset backed securities 118,325 – – 118,325
Cash 13,331 16 – 13,347
200,534 89,773 5,209 295,516
30 June 2014
Corporate bonds 60,803 54,979 7,405 123,187
Mortgage and asset backed securities 133,076 – – 133,076
Cash 16,206 – – 16,206
210,085 54,979 7,405 272,469
The table below demonstrates the impact of a 1 per cent change in the fair value of the underlying assets of the EMCF, due to market price movements, based on the values at reporting date.
2015$'000
2014$'000
1 per cent increase 2,955 2,725
1 per cent decrease (2,955) (2,725)
The actual impact of a change in the fair value of the underlying assets of the EMCF on the consolidated profit before tax is dependent on the calculation of the swap agreement between the fund and the consolidated entity and the performance of the fund relative to the benchmark index. If the fund’s performance is below the benchmark return, then the consolidated entity will be obliged to make payments to the fund under the swap agreement. Conversely, if the fund’s performance is higher than the benchmark, then the fund will make payments to the consolidated entity.
Any variance between the consolidated entity’s current assets EMCF balance and the consolidated entity’s current liabilities EMCF balance would be reflected in reserves, except in the case of a credit default which would impact the consolidated profit before tax.
ACCOUNTING POLICIESThe EMCF product, consisting of two funds (EMCF 1 and EMCF 2), is consolidated as the consolidated entity is exposed to variable returns and has the power to affect those returns. The swap agreements result in the benchmark rate of return being paid to the unit holders in the fund. The swap agreements are inter-company transactions between a subsidiary of the Company and the funds and are eliminated on consolidation.
Assets and liabilities of the EMCF product are disclosed separately on the face of the Consolidated Statement of Financial Position as structured product assets and structured product liabilities. The benchmark return generated by the EMCF product and distributions to unit holders are disclosed in section 1-3 Expenses as distributions and expenses related to structured products.
The financial assets represented by the structured products assets balance are accounted for in accordance with the underlying accounting policies of the consolidated entity. These consist of investments accounted for at fair value as available-for-sale financial assets.
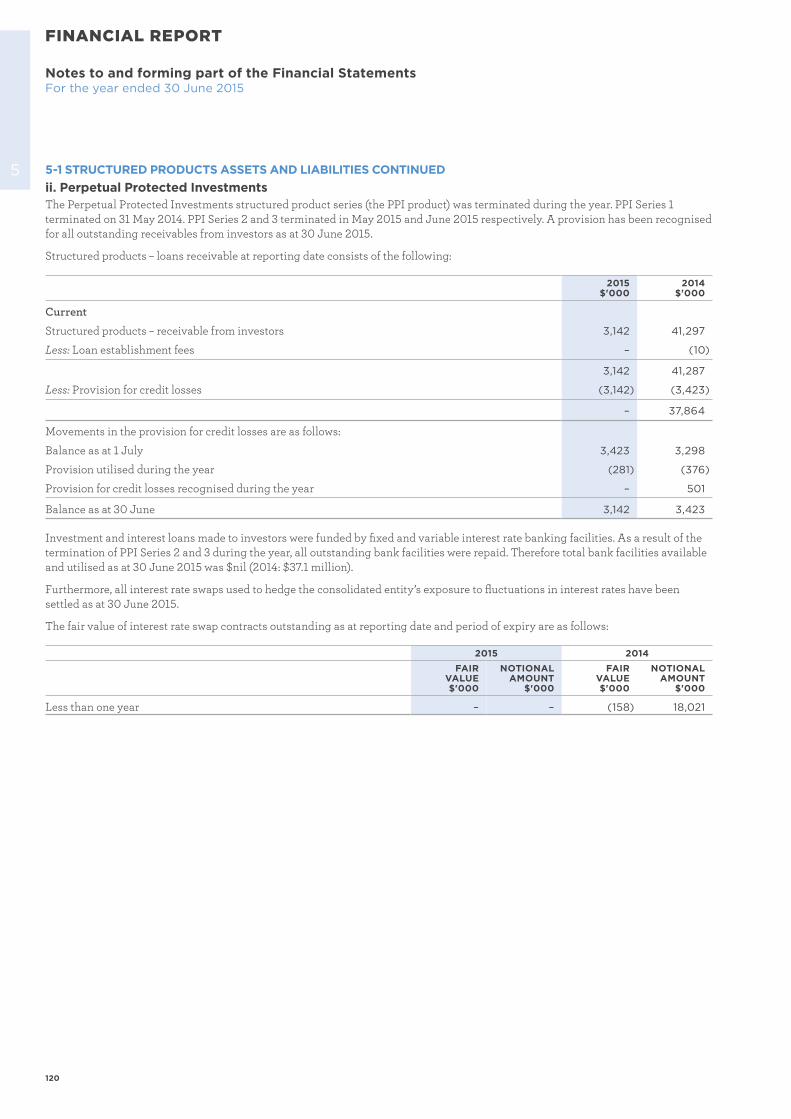
120
Notes to and forming part of the Financial StatementsFor the year ended 30 June 2015
FINANCIAL REPORT
5 5-1 STRUCTURED PRODUCTS ASSETS AND LIABILITIES CONTINUEDii. Perpetual Protected InvestmentsThe Perpetual Protected Investments structured product series (the PPI product) was terminated during the year. PPI Series 1 terminated on 31 May 2014. PPI Series 2 and 3 terminated in May 2015 and June 2015 respectively. A provision has been recognised for all outstanding receivables from investors as at 30 June 2015.
Structured products – loans receivable at reporting date consists of the following:
2015$'000
2014$'000
Current
Structured products – receivable from investors 3,142 41,297
Less: Loan establishment fees – (10)
3,142 41,287
Less: Provision for credit losses (3,142) (3,423)
– 37,864
Movements in the provision for credit losses are as follows:
Balance as at 1 July 3,423 3,298
Provision utilised during the year (281) (376)
Provision for credit losses recognised during the year – 501
Balance as at 30 June 3,142 3,423
Investment and interest loans made to investors were funded by fixed and variable interest rate banking facilities. As a result of the termination of PPI Series 2 and 3 during the year, all outstanding bank facilities were repaid. Therefore total bank facilities available and utilised as at 30 June 2015 was $nil (2014: $37.1 million).
Furthermore, all interest rate swaps used to hedge the consolidated entity’s exposure to fluctuations in interest rates have been settled as at 30 June 2015.
The fair value of interest rate swap contracts outstanding as at reporting date and period of expiry are as follows:
2015 2014FAIR
VALUE $'000
NOTIONAL AMOUNT
$'000
FAIR VALUE $'000
NOTIONAL AMOUNT
$'000
Less than one year – – (158) 18,021
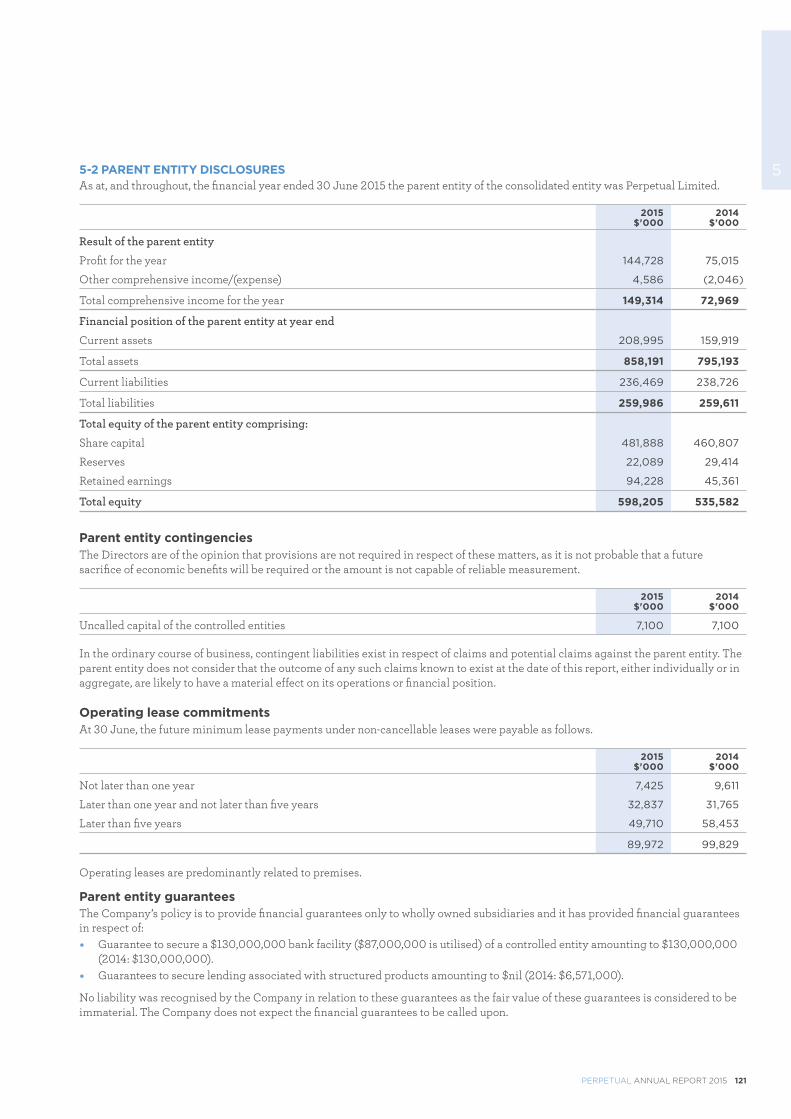
PERPETUAL ANNUAL REPORT 2015 121
55-2 PARENT ENTITY DISCLOSURESAs at, and throughout, the financial year ended 30 June 2015 the parent entity of the consolidated entity was Perpetual Limited.
2015$'000
2014$'000
Result of the parent entity
Profit for the year 144,728 75,015
Other comprehensive income/(expense) 4,586 (2,046)
Total comprehensive income for the year 149,314 72,969
Financial position of the parent entity at year end
Current assets 208,995 159,919
Total assets 858,191 795,193
Current liabilities 236,469 238,726
Total liabilities 259,986 259,611
Total equity of the parent entity comprising:
Share capital 481,888 460,807
Reserves 22,089 29,414
Retained earnings 94,228 45,361
Total equity 598,205 535,582
Parent entity contingenciesThe Directors are of the opinion that provisions are not required in respect of these matters, as it is not probable that a future sacrifice of economic benefits will be required or the amount is not capable of reliable measurement.
2015$'000
2014$'000
Uncalled capital of the controlled entities 7,100 7,100
In the ordinary course of business, contingent liabilities exist in respect of claims and potential claims against the parent entity. The parent entity does not consider that the outcome of any such claims known to exist at the date of this report, either individually or in aggregate, are likely to have a material effect on its operations or financial position.
Operating lease commitmentsAt 30 June, the future minimum lease payments under non-cancellable leases were payable as follows.
2015$'000
2014$'000
Not later than one year 7,425 9,611
Later than one year and not later than five years 32,837 31,765
Later than five years 49,710 58,453
89,972 99,829
Operating leases are predominantly related to premises.
Parent entity guaranteesThe Company’s policy is to provide financial guarantees only to wholly owned subsidiaries and it has provided financial guarantees in respect of: � Guarantee to secure a $130,000,000 bank facility ($87,000,000 is utilised) of a controlled entity amounting to $130,000,000
(2014: $130,000,000). � Guarantees to secure lending associated with structured products amounting to $nil (2014: $6,571,000).
No liability was recognised by the Company in relation to these guarantees as the fair value of these guarantees is considered to be immaterial. The Company does not expect the financial guarantees to be called upon.
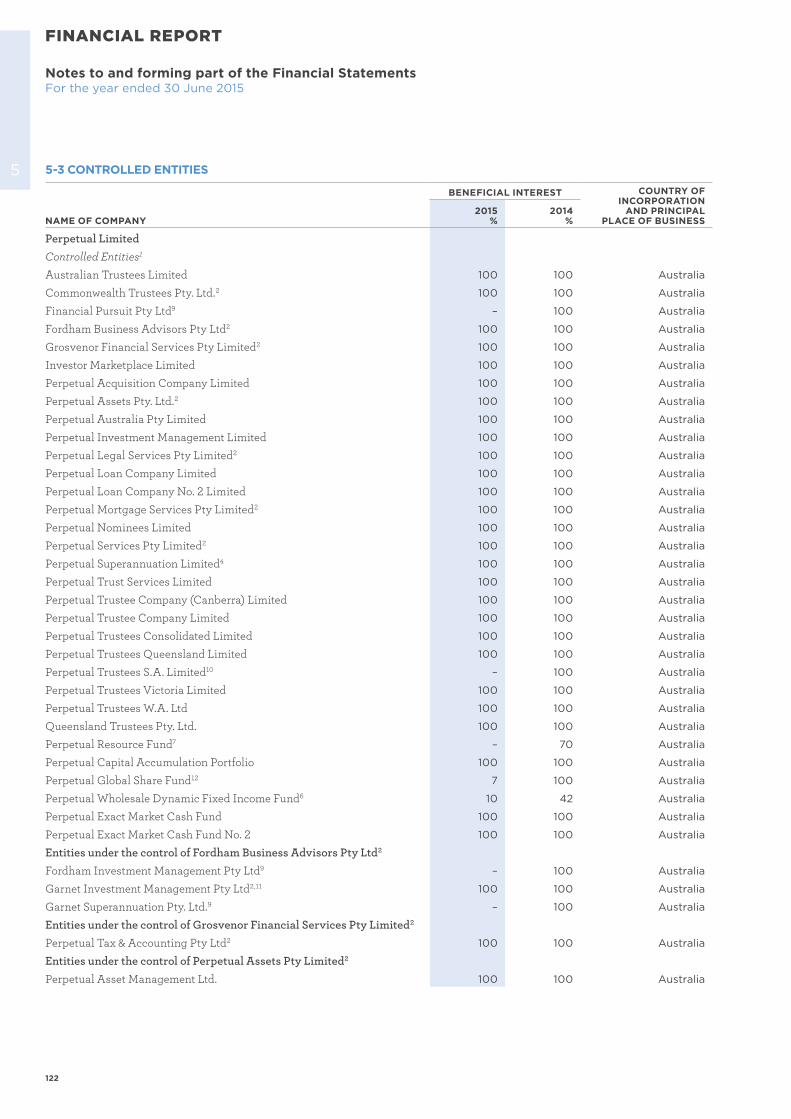
122
FINANCIAL REPORT
Notes to and forming part of the Financial StatementsFor the year ended 30 June 2015
5 5-3 CONTROLLED ENTITIES
NAME OF COMPANY
BENEFICIAL INTEREST COUNTRY OF INCORPORATION
AND PRINCIPAL PLACE OF BUSINESS
2015%
2014%
Perpetual Limited
Controlled Entities1
Australian Trustees Limited 100 100 Australia
Commonwealth Trustees Pty. Ltd.2 100 100 Australia
Financial Pursuit Pty Ltd9 – 100 Australia
Fordham Business Advisors Pty Ltd2 100 100 Australia
Grosvenor Financial Services Pty Limited2 100 100 Australia
Investor Marketplace Limited 100 100 Australia
Perpetual Acquisition Company Limited 100 100 Australia
Perpetual Assets Pty. Ltd.2 100 100 Australia
Perpetual Australia Pty Limited 100 100 Australia
Perpetual Investment Management Limited 100 100 Australia
Perpetual Legal Services Pty Limited2 100 100 Australia
Perpetual Loan Company Limited 100 100 Australia
Perpetual Loan Company No. 2 Limited 100 100 Australia
Perpetual Mortgage Services Pty Limited2 100 100 Australia
Perpetual Nominees Limited 100 100 Australia
Perpetual Services Pty Limited2 100 100 Australia
Perpetual Superannuation Limited4 100 100 Australia
Perpetual Trust Services Limited 100 100 Australia
Perpetual Trustee Company (Canberra) Limited 100 100 Australia
Perpetual Trustee Company Limited 100 100 Australia
Perpetual Trustees Consolidated Limited 100 100 Australia
Perpetual Trustees Queensland Limited 100 100 Australia
Perpetual Trustees S.A. Limited10 – 100 Australia
Perpetual Trustees Victoria Limited 100 100 Australia
Perpetual Trustees W.A. Ltd 100 100 Australia
Queensland Trustees Pty. Ltd. 100 100 Australia
Perpetual Resource Fund7 – 70 Australia
Perpetual Capital Accumulation Portfolio 100 100 Australia
Perpetual Global Share Fund12 7 100 Australia
Perpetual Wholesale Dynamic Fixed Income Fund6 10 42 Australia
Perpetual Exact Market Cash Fund 100 100 Australia
Perpetual Exact Market Cash Fund No. 2 100 100 Australia
Entities under the control of Fordham Business Advisors Pty Ltd2
Fordham Investment Management Pty Ltd9 – 100 Australia
Garnet Investment Management Pty Ltd2,11 100 100 Australia
Garnet Superannuation Pty. Ltd.9 – 100 Australia
Entities under the control of Grosvenor Financial Services Pty Limited2
Perpetual Tax & Accounting Pty Ltd2 100 100 Australia
Entities under the control of Perpetual Assets Pty Limited2
Perpetual Asset Management Ltd. 100 100 Australia
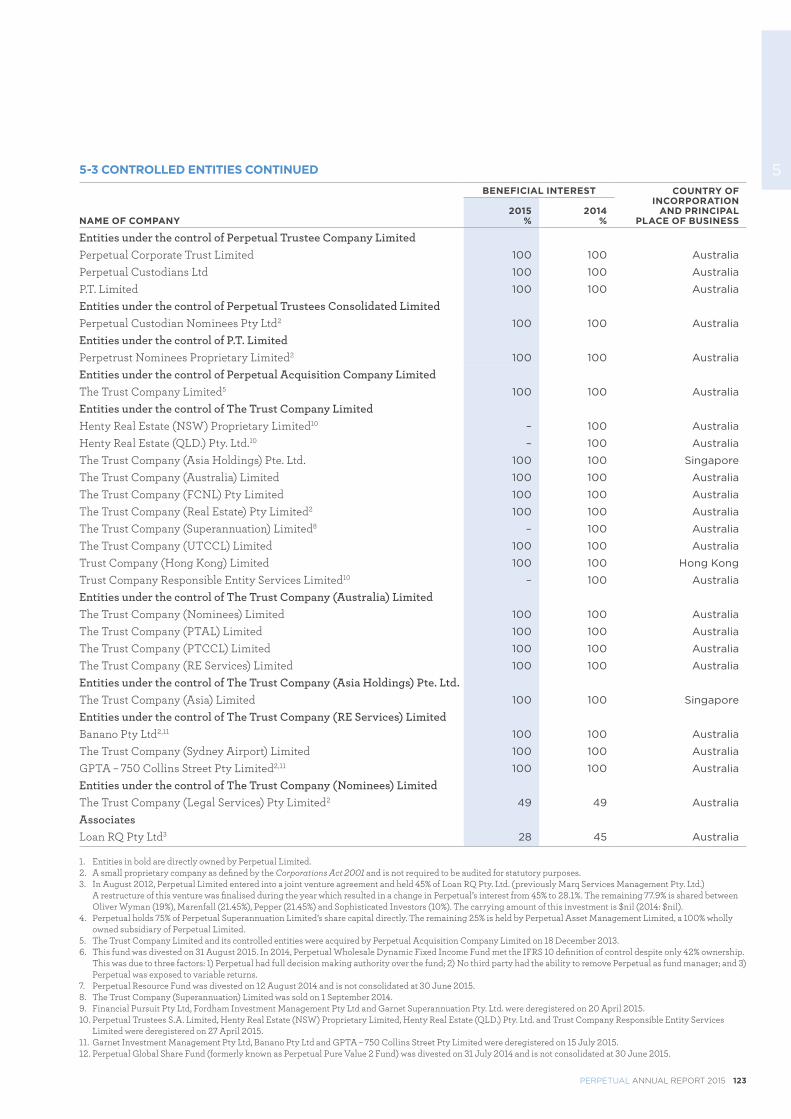
PERPETUAL ANNUAL REPORT 2015 123
55-3 CONTROLLED ENTITIES CONTINUED
NAME OF COMPANY
BENEFICIAL INTEREST COUNTRY OF INCORPORATION
AND PRINCIPAL PLACE OF BUSINESS
2015%
2014%
Entities under the control of Perpetual Trustee Company Limited Perpetual Corporate Trust Limited 100 100 Australia
Perpetual Custodians Ltd 100 100 Australia
P.T. Limited 100 100 Australia
Entities under the control of Perpetual Trustees Consolidated LimitedPerpetual Custodian Nominees Pty Ltd2 100 100 Australia
Entities under the control of P.T. LimitedPerpetrust Nominees Proprietary Limited2 100 100 Australia
Entities under the control of Perpetual Acquisition Company LimitedThe Trust Company Limited5 100 100 Australia
Entities under the control of The Trust Company LimitedHenty Real Estate (NSW) Proprietary Limited10 – 100 Australia
Henty Real Estate (QLD.) Pty. Ltd.10 – 100 Australia
The Trust Company (Asia Holdings) Pte. Ltd. 100 100 Singapore
The Trust Company (Australia) Limited 100 100 Australia
The Trust Company (FCNL) Pty Limited 100 100 Australia
The Trust Company (Real Estate) Pty Limited2 100 100 Australia
The Trust Company (Superannuation) Limited8 – 100 Australia
The Trust Company (UTCCL) Limited 100 100 Australia
Trust Company (Hong Kong) Limited 100 100 Hong Kong
Trust Company Responsible Entity Services Limited10 – 100 Australia
Entities under the control of The Trust Company (Australia) LimitedThe Trust Company (Nominees) Limited 100 100 Australia
The Trust Company (PTAL) Limited 100 100 Australia
The Trust Company (PTCCL) Limited 100 100 Australia
The Trust Company (RE Services) Limited 100 100 Australia
Entities under the control of The Trust Company (Asia Holdings) Pte. Ltd.The Trust Company (Asia) Limited 100 100 Singapore
Entities under the control of The Trust Company (RE Services) LimitedBanano Pty Ltd2,11 100 100 Australia
The Trust Company (Sydney Airport) Limited 100 100 Australia
GPTA – 750 Collins Street Pty Limited2,11 100 100 Australia
Entities under the control of The Trust Company (Nominees) LimitedThe Trust Company (Legal Services) Pty Limited2 49 49 Australia
AssociatesLoan RQ Pty Ltd3 28 45 Australia
1. Entities in bold are directly owned by Perpetual Limited.2. A small proprietary company as defined by the Corporations Act 2001 and is not required to be audited for statutory purposes.3. In August 2012, Perpetual Limited entered into a joint venture agreement and held 45% of Loan RQ Pty. Ltd. (previously Marq Services Management Pty. Ltd.)
A restructure of this venture was finalised during the year which resulted in a change in Perpetual’s interest from 45% to 28.1%. The remaining 77.9% is shared between Oliver Wyman (19%), Marenfall (21.45%), Pepper (21.45%) and Sophisticated Investors (10%). The carrying amount of this investment is $nil (2014: $nil).
4. Perpetual holds 75% of Perpetual Superannuation Limited’s share capital directly. The remaining 25% is held by Perpetual Asset Management Limited, a 100% wholly owned subsidiary of Perpetual Limited.
5. The Trust Company Limited and its controlled entities were acquired by Perpetual Acquisition Company Limited on 18 December 2013.6. This fund was divested on 31 August 2015. In 2014, Perpetual Wholesale Dynamic Fixed Income Fund met the IFRS 10 definition of control despite only 42% ownership.
This was due to three factors: 1) Perpetual had full decision making authority over the fund; 2) No third party had the ability to remove Perpetual as fund manager; and 3) Perpetual was exposed to variable returns.
7. Perpetual Resource Fund was divested on 12 August 2014 and is not consolidated at 30 June 2015.8. The Trust Company (Superannuation) Limited was sold on 1 September 2014.9. Financial Pursuit Pty Ltd, Fordham Investment Management Pty Ltd and Garnet Superannuation Pty. Ltd. were deregistered on 20 April 2015.10. Perpetual Trustees S.A. Limited, Henty Real Estate (NSW) Proprietary Limited, Henty Real Estate (QLD.) Pty. Ltd. and Trust Company Responsible Entity Services
Limited were deregistered on 27 April 2015.11. Garnet Investment Management Pty Ltd, Banano Pty Ltd and GPTA – 750 Collins Street Pty Limited were deregistered on 15 July 2015.12. Perpetual Global Share Fund (formerly known as Perpetual Pure Value 2 Fund) was divested on 31 July 2014 and is not consolidated at 30 June 2015.
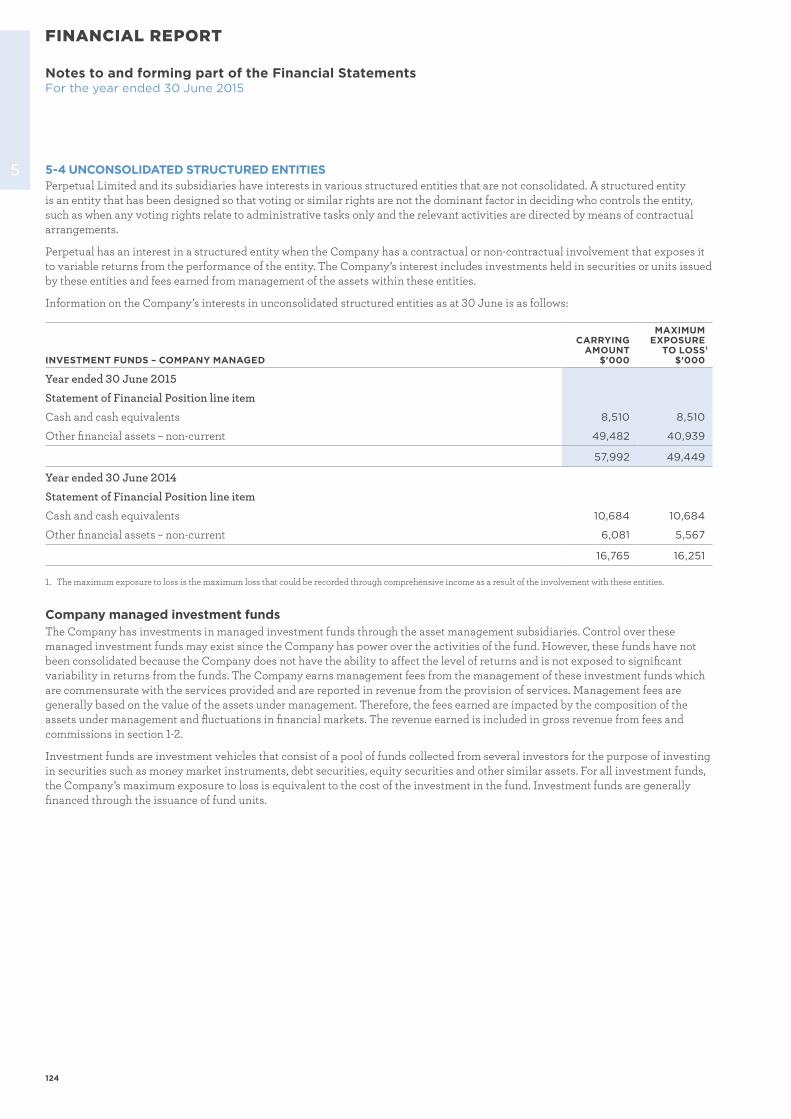
124
FINANCIAL REPORT
Notes to and forming part of the Financial StatementsFor the year ended 30 June 2015
5 5-4 UNCONSOLIDATED STRUCTURED ENTITIESPerpetual Limited and its subsidiaries have interests in various structured entities that are not consolidated. A structured entity is an entity that has been designed so that voting or similar rights are not the dominant factor in deciding who controls the entity, such as when any voting rights relate to administrative tasks only and the relevant activities are directed by means of contractual arrangements.
Perpetual has an interest in a structured entity when the Company has a contractual or non-contractual involvement that exposes it to variable returns from the performance of the entity. The Company’s interest includes investments held in securities or units issued by these entities and fees earned from management of the assets within these entities.
Information on the Company’s interests in unconsolidated structured entities as at 30 June is as follows:
INVESTMENT FUNDS – COMPANY MANAGED
CARRYING AMOUNT
$'000
MAXIMUMEXPOSURE
TO LOSS 1
$'000
Year ended 30 June 2015
Statement of Financial Position line item
Cash and cash equivalents 8,510 8,510
Other financial assets – non-current 49,482 40,939
57,992 49,449
Year ended 30 June 2014
Statement of Financial Position line item
Cash and cash equivalents 10,684 10,684
Other financial assets – non-current 6,081 5,567
16,765 16,251
1. The maximum exposure to loss is the maximum loss that could be recorded through comprehensive income as a result of the involvement with these entities.
Company managed investment fundsThe Company has investments in managed investment funds through the asset management subsidiaries. Control over these managed investment funds may exist since the Company has power over the activities of the fund. However, these funds have not been consolidated because the Company does not have the ability to affect the level of returns and is not exposed to significant variability in returns from the funds. The Company earns management fees from the management of these investment funds which are commensurate with the services provided and are reported in revenue from the provision of services. Management fees are generally based on the value of the assets under management. Therefore, the fees earned are impacted by the composition of the assets under management and fluctuations in financial markets. The revenue earned is included in gross revenue from fees and commissions in section 1-2.
Investment funds are investment vehicles that consist of a pool of funds collected from several investors for the purpose of investing in securities such as money market instruments, debt securities, equity securities and other similar assets. For all investment funds, the Company’s maximum exposure to loss is equivalent to the cost of the investment in the fund. Investment funds are generally financed through the issuance of fund units.
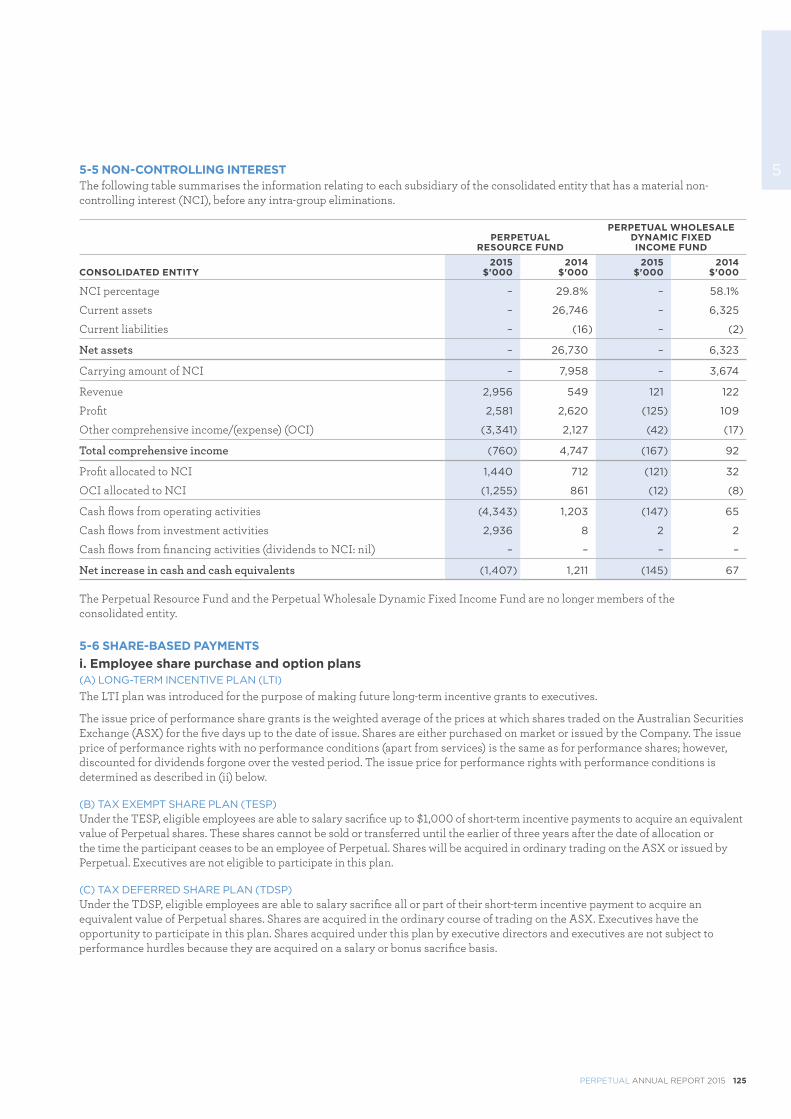
PERPETUAL ANNUAL REPORT 2015 125
55-5 NON-CONTROLLING INTERESTThe following table summarises the information relating to each subsidiary of the consolidated entity that has a material non-controlling interest (NCI), before any intra-group eliminations.
PERPETUALRESOURCE FUND
PERPETUAL WHOLESALE DYNAMIC FIXED INCOME FUND
CONSOLIDATED ENTITY2015
$'0002014
$'0002015
$'0002014
$'000
NCI percentage – 29.8% – 58.1%
Current assets – 26,746 – 6,325
Current liabilities – (16) – (2)
Net assets – 26,730 – 6,323
Carrying amount of NCI – 7,958 – 3,674
Revenue 2,956 549 121 122
Profit 2,581 2,620 (125) 109
Other comprehensive income/(expense) (OCI) (3,341) 2,127 (42) (17)
Total comprehensive income (760) 4,747 (167) 92
Profit allocated to NCI 1,440 712 (121) 32
OCI allocated to NCI (1,255) 861 (12) (8)
Cash flows from operating activities (4,343) 1,203 (147) 65
Cash flows from investment activities 2,936 8 2 2
Cash flows from financing activities (dividends to NCI: nil) – – – –
Net increase in cash and cash equivalents (1,407) 1,211 (145) 67
The Perpetual Resource Fund and the Perpetual Wholesale Dynamic Fixed Income Fund are no longer members of the consolidated entity.
5-6 SHARE-BASED PAYMENTSi. Employee share purchase and option plans(A) LONG-TERM INCENTIVE PLAN (LTI)
The LTI plan was introduced for the purpose of making future long-term incentive grants to executives.
The issue price of performance share grants is the weighted average of the prices at which shares traded on the Australian Securities Exchange (ASX) for the five days up to the date of issue. Shares are either purchased on market or issued by the Company. The issue price of performance rights with no performance conditions (apart from services) is the same as for performance shares; however, discounted for dividends forgone over the vested period. The issue price for performance rights with performance conditions is determined as described in (ii) below.
(B) TAX EXEMPT SHARE PLAN (TESP)Under the TESP, eligible employees are able to salary sacrifice up to $1,000 of short-term incentive payments to acquire an equivalent value of Perpetual shares. These shares cannot be sold or transferred until the earlier of three years after the date of allocation or the time the participant ceases to be an employee of Perpetual. Shares will be acquired in ordinary trading on the ASX or issued by Perpetual. Executives are not eligible to participate in this plan.
(C) TAX DEFERRED SHARE PLAN (TDSP)Under the TDSP, eligible employees are able to salary sacrifice all or part of their short-term incentive payment to acquire an equivalent value of Perpetual shares. Shares are acquired in the ordinary course of trading on the ASX. Executives have the opportunity to participate in this plan. Shares acquired under this plan by executive directors and executives are not subject to performance hurdles because they are acquired on a salary or bonus sacrifice basis.
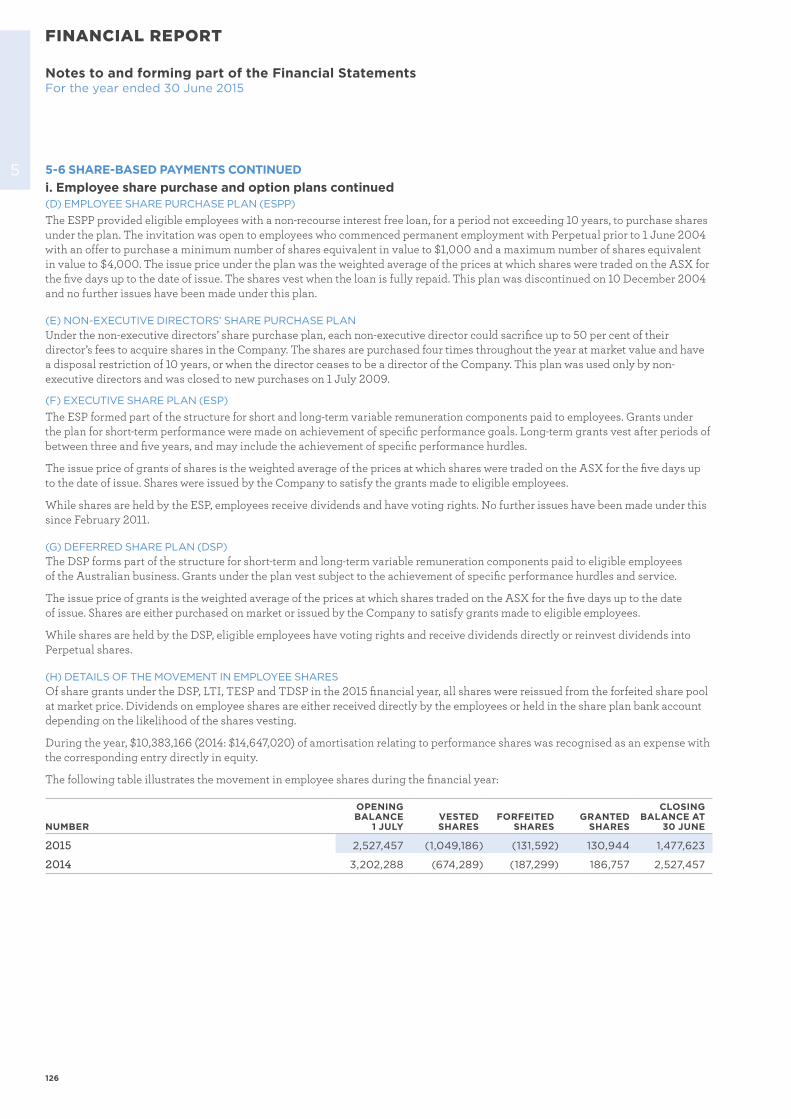
126
Notes to and forming part of the Financial StatementsFor the year ended 30 June 2015
FINANCIAL REPORT
5 5-6 SHARE-BASED PAYMENTS CONTINUEDi. Employee share purchase and option plans continued(D) EMPLOYEE SHARE PURCHASE PLAN (ESPP)
The ESPP provided eligible employees with a non-recourse interest free loan, for a period not exceeding 10 years, to purchase shares under the plan. The invitation was open to employees who commenced permanent employment with Perpetual prior to 1 June 2004 with an offer to purchase a minimum number of shares equivalent in value to $1,000 and a maximum number of shares equivalent in value to $4,000. The issue price under the plan was the weighted average of the prices at which shares were traded on the ASX for the five days up to the date of issue. The shares vest when the loan is fully repaid. This plan was discontinued on 10 December 2004 and no further issues have been made under this plan.
(E) NON-EXECUTIVE DIRECTORS’ SHARE PURCHASE PLANUnder the non-executive directors’ share purchase plan, each non-executive director could sacrifice up to 50 per cent of their director’s fees to acquire shares in the Company. The shares are purchased four times throughout the year at market value and have a disposal restriction of 10 years, or when the director ceases to be a director of the Company. This plan was used only by non-executive directors and was closed to new purchases on 1 July 2009.
(F) EXECUTIVE SHARE PLAN (ESP)
The ESP formed part of the structure for short and long-term variable remuneration components paid to employees. Grants under the plan for short-term performance were made on achievement of specific performance goals. Long-term grants vest after periods of between three and five years, and may include the achievement of specific performance hurdles.
The issue price of grants of shares is the weighted average of the prices at which shares were traded on the ASX for the five days up to the date of issue. Shares were issued by the Company to satisfy the grants made to eligible employees.
While shares are held by the ESP, employees receive dividends and have voting rights. No further issues have been made under this since February 2011.
(G) DEFERRED SHARE PLAN (DSP)The DSP forms part of the structure for short-term and long-term variable remuneration components paid to eligible employees of the Australian business. Grants under the plan vest subject to the achievement of specific performance hurdles and service.
The issue price of grants is the weighted average of the prices at which shares traded on the ASX for the five days up to the date of issue. Shares are either purchased on market or issued by the Company to satisfy grants made to eligible employees.
While shares are held by the DSP, eligible employees have voting rights and receive dividends directly or reinvest dividends into Perpetual shares.
(H) DETAILS OF THE MOVEMENT IN EMPLOYEE SHARESOf share grants under the DSP, LTI, TESP and TDSP in the 2015 financial year, all shares were reissued from the forfeited share pool at market price. Dividends on employee shares are either received directly by the employees or held in the share plan bank account depending on the likelihood of the shares vesting.
During the year, $10,383,166 (2014: $14,647,020) of amortisation relating to performance shares was recognised as an expense with the corresponding entry directly in equity.
The following table illustrates the movement in employee shares during the financial year:
NUMBER
OPENING BALANCE
1 JULYVESTED SHARES
FORFEITED SHARES
GRANTED SHARES
CLOSING BALANCE AT
30 JUNE
2015 2,527,457 (1,049,186) (131,592) 130,944 1,477,623
2014 3,202,288 (674,289) (187,299) 186,757 2,527,457
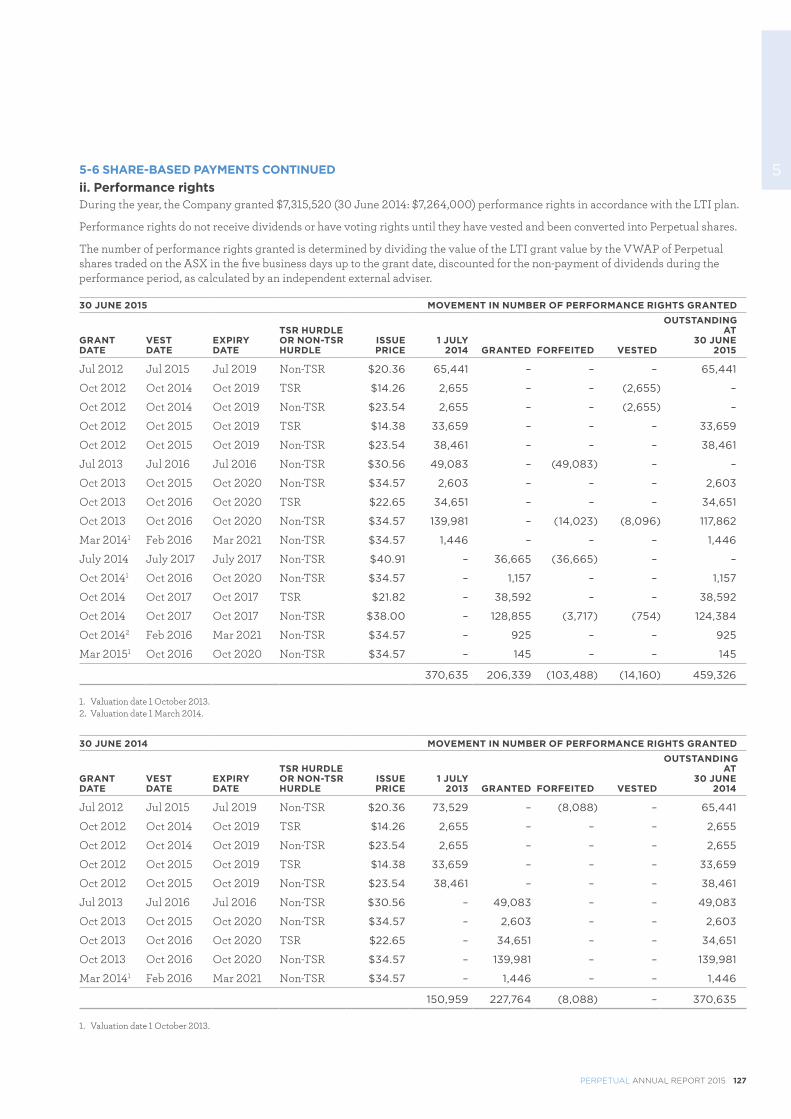
PERPETUAL ANNUAL REPORT 2015 127
55-6 SHARE-BASED PAYMENTS CONTINUEDii. Performance rightsDuring the year, the Company granted $7,315,520 (30 June 2014: $7,264,000) performance rights in accordance with the LTI plan.
Performance rights do not receive dividends or have voting rights until they have vested and been converted into Perpetual shares.
The number of performance rights granted is determined by dividing the value of the LTI grant value by the VWAP of Perpetual shares traded on the ASX in the five business days up to the grant date, discounted for the non-payment of dividends during the performance period, as calculated by an independent external adviser.
30 JUNE 2015 MOVEMENT IN NUMBER OF PERFORMANCE RIGHTS GRANTED
GRANT DATE
VEST DATE
EXPIRY DATE
TSR HURDLE OR NON-TSR HURDLE
ISSUE PRICE
1 JULY 2014 GRANTED FORFEITED VESTED
OUTSTANDING AT
30 JUNE 2015
Jul 2012 Jul 2015 Jul 2019 Non-TSR $20.36 65,441 – – – 65,441
Oct 2012 Oct 2014 Oct 2019 TSR $14.26 2,655 – – (2,655) –
Oct 2012 Oct 2014 Oct 2019 Non-TSR $23.54 2,655 – – (2,655) –
Oct 2012 Oct 2015 Oct 2019 TSR $14.38 33,659 – – – 33,659
Oct 2012 Oct 2015 Oct 2019 Non-TSR $23.54 38,461 – – – 38,461
Jul 2013 Jul 2016 Jul 2016 Non-TSR $30.56 49,083 – (49,083) – –
Oct 2013 Oct 2015 Oct 2020 Non-TSR $34.57 2,603 – – – 2,603
Oct 2013 Oct 2016 Oct 2020 TSR $22.65 34,651 – – – 34,651
Oct 2013 Oct 2016 Oct 2020 Non-TSR $34.57 139,981 – (14,023) (8,096) 117,862
Mar 20141 Feb 2016 Mar 2021 Non-TSR $34.57 1,446 – – – 1,446
July 2014 July 2017 July 2017 Non-TSR $40.91 – 36,665 (36,665) – –
Oct 20141 Oct 2016 Oct 2020 Non-TSR $34.57 – 1,157 – – 1,157
Oct 2014 Oct 2017 Oct 2017 TSR $21.82 – 38,592 – – 38,592
Oct 2014 Oct 2017 Oct 2017 Non-TSR $38.00 – 128,855 (3,717) (754) 124,384
Oct 20142 Feb 2016 Mar 2021 Non-TSR $34.57 – 925 – – 925
Mar 20151 Oct 2016 Oct 2020 Non-TSR $34.57 – 145 – – 145
370,635 206,339 (103,488) (14,160) 459,326
1. Valuation date 1 October 2013.2. Valuation date 1 March 2014.
30 JUNE 2014 MOVEMENT IN NUMBER OF PERFORMANCE RIGHTS GRANTED
GRANT DATE
VEST DATE
EXPIRY DATE
TSR HURDLE OR NON-TSR HURDLE
ISSUE PRICE
1 JULY 2013 GRANTED FORFEITED VESTED
OUTSTANDING AT
30 JUNE 2014
Jul 2012 Jul 2015 Jul 2019 Non-TSR $20.36 73,529 – (8,088) – 65,441
Oct 2012 Oct 2014 Oct 2019 TSR $14.26 2,655 – – – 2,655
Oct 2012 Oct 2014 Oct 2019 Non-TSR $23.54 2,655 – – – 2,655
Oct 2012 Oct 2015 Oct 2019 TSR $14.38 33,659 – – – 33,659
Oct 2012 Oct 2015 Oct 2019 Non-TSR $23.54 38,461 – – – 38,461
Jul 2013 Jul 2016 Jul 2016 Non-TSR $30.56 – 49,083 – – 49,083
Oct 2013 Oct 2015 Oct 2020 Non-TSR $34.57 – 2,603 – – 2,603
Oct 2013 Oct 2016 Oct 2020 TSR $22.65 – 34,651 – – 34,651
Oct 2013 Oct 2016 Oct 2020 Non-TSR $34.57 – 139,981 – – 139,981
Mar 20141 Feb 2016 Mar 2021 Non-TSR $34.57 – 1,446 – – 1,446
150,959 227,764 (8,088) – 370,635
1. Valuation date 1 October 2013.
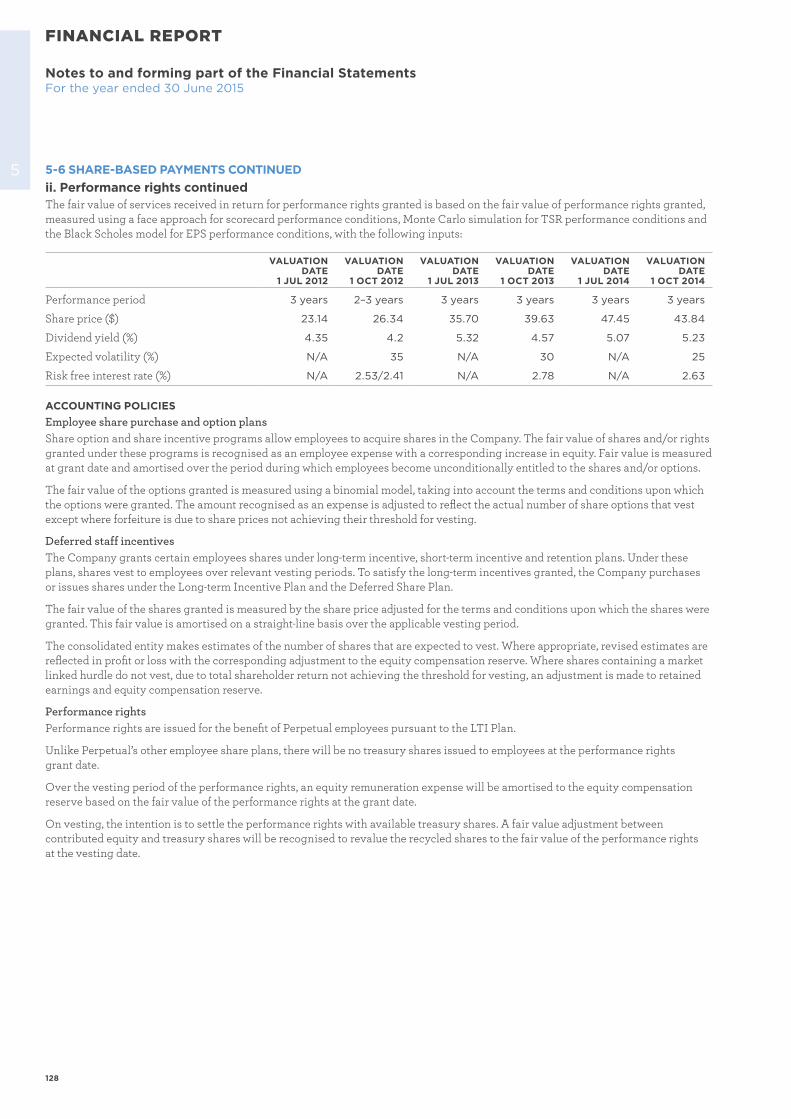
128
FINANCIAL REPORT
Notes to and forming part of the Financial StatementsFor the year ended 30 June 2015
5 5-6 SHARE-BASED PAYMENTS CONTINUEDii. Performance rights continuedThe fair value of services received in return for performance rights granted is based on the fair value of performance rights granted, measured using a face approach for scorecard performance conditions, Monte Carlo simulation for TSR performance conditions and the Black Scholes model for EPS performance conditions, with the following inputs:
VALUATION DATE
1 JUL 2012
VALUATION DATE
1 OCT 2012
VALUATION DATE
1 JUL 2013
VALUATION DATE
1 OCT 2013
VALUATION DATE
1 JUL 2014
VALUATION DATE
1 OCT 2014
Performance period 3 years 2–3 years 3 years 3 years 3 years 3 years
Share price ($) 23.14 26.34 35.70 39.63 47.45 43.84
Dividend yield (%) 4.35 4.2 5.32 4.57 5.07 5.23
Expected volatility (%) N/A 35 N/A 30 N/A 25
Risk free interest rate (%) N/A 2.53/2.41 N/A 2.78 N/A 2.63
ACCOUNTING POLICIESEmployee share purchase and option plansShare option and share incentive programs allow employees to acquire shares in the Company. The fair value of shares and/or rights granted under these programs is recognised as an employee expense with a corresponding increase in equity. Fair value is measured at grant date and amortised over the period during which employees become unconditionally entitled to the shares and/or options.
The fair value of the options granted is measured using a binomial model, taking into account the terms and conditions upon which the options were granted. The amount recognised as an expense is adjusted to reflect the actual number of share options that vest except where forfeiture is due to share prices not achieving their threshold for vesting.
Deferred staff incentivesThe Company grants certain employees shares under long-term incentive, short-term incentive and retention plans. Under these plans, shares vest to employees over relevant vesting periods. To satisfy the long-term incentives granted, the Company purchases or issues shares under the Long-term Incentive Plan and the Deferred Share Plan.
The fair value of the shares granted is measured by the share price adjusted for the terms and conditions upon which the shares were granted. This fair value is amortised on a straight-line basis over the applicable vesting period.
The consolidated entity makes estimates of the number of shares that are expected to vest. Where appropriate, revised estimates are reflected in profit or loss with the corresponding adjustment to the equity compensation reserve. Where shares containing a market linked hurdle do not vest, due to total shareholder return not achieving the threshold for vesting, an adjustment is made to retained earnings and equity compensation reserve.
Performance rightsPerformance rights are issued for the benefit of Perpetual employees pursuant to the LTI Plan.
Unlike Perpetual’s other employee share plans, there will be no treasury shares issued to employees at the performance rights grant date.
Over the vesting period of the performance rights, an equity remuneration expense will be amortised to the equity compensation reserve based on the fair value of the performance rights at the grant date.
On vesting, the intention is to settle the performance rights with available treasury shares. A fair value adjustment between contributed equity and treasury shares will be recognised to revalue the recycled shares to the fair value of the performance rights at the vesting date.
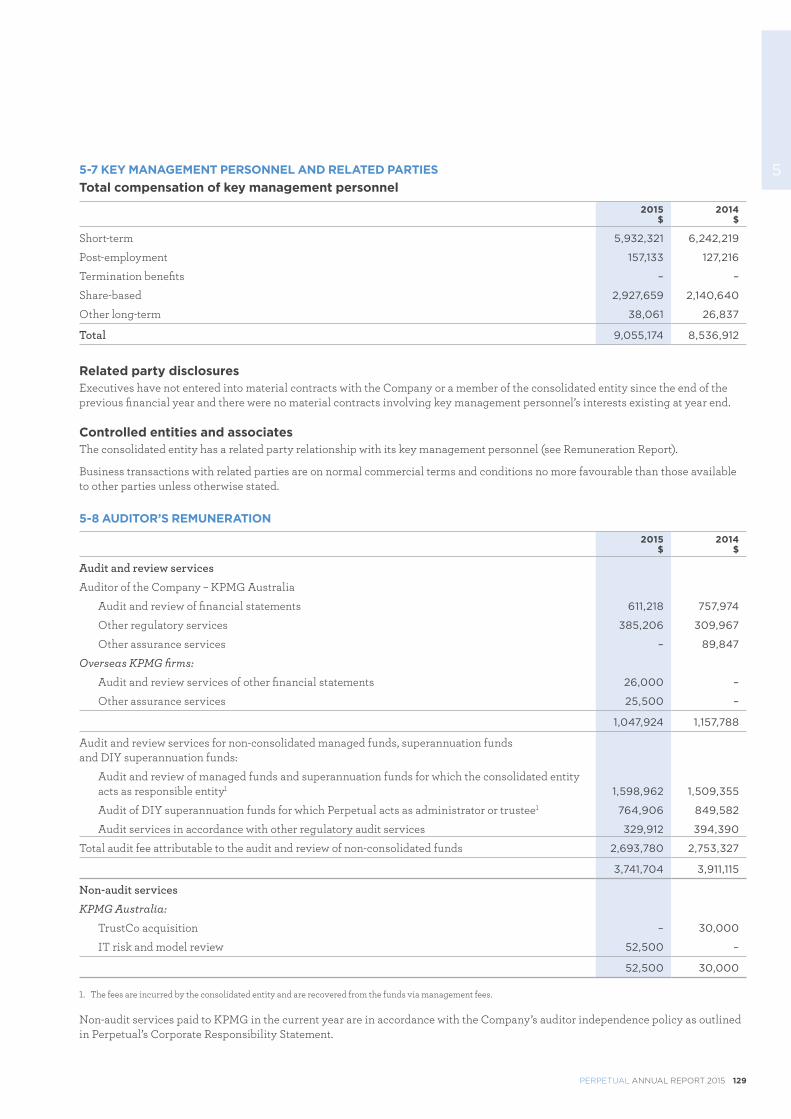
PERPETUAL ANNUAL REPORT 2015 129
55-7 KEY MANAGEMENT PERSONNEL AND RELATED PARTIESTotal compensation of key management personnel
2015$
2014$
Short-term 5,932,321 6,242,219
Post-employment 157,133 127,216
Termination benefits – –
Share-based 2,927,659 2,140,640
Other long-term 38,061 26,837
Total 9,055,174 8,536,912
Related party disclosuresExecutives have not entered into material contracts with the Company or a member of the consolidated entity since the end of the previous financial year and there were no material contracts involving key management personnel’s interests existing at year end.
Controlled entities and associatesThe consolidated entity has a related party relationship with its key management personnel (see Remuneration Report).
Business transactions with related parties are on normal commercial terms and conditions no more favourable than those available to other parties unless otherwise stated.
5-8 AUDITOR’S REMUNERATION
2015$
2014$
Audit and review services
Auditor of the Company – KPMG Australia
Audit and review of financial statements 611,218 757,974
Other regulatory services 385,206 309,967
Other assurance services – 89,847
Overseas KPMG firms:
Audit and review services of other financial statements 26,000 –
Other assurance services 25,500 –
1,047,924 1,157,788
Audit and review services for non-consolidated managed funds, superannuation funds and DIY superannuation funds:
Audit and review of managed funds and superannuation funds for which the consolidated entity acts as responsible entity1 1,598,962 1,509,355
Audit of DIY superannuation funds for which Perpetual acts as administrator or trustee1 764,906 849,582
Audit services in accordance with other regulatory audit services 329,912 394,390
Total audit fee attributable to the audit and review of non-consolidated funds 2,693,780 2,753,327
3,741,704 3,911,115
Non-audit services
KPMG Australia:
TrustCo acquisition – 30,000
IT risk and model review 52,500 –
52,500 30,000
1. The fees are incurred by the consolidated entity and are recovered from the funds via management fees.
Non-audit services paid to KPMG in the current year are in accordance with the Company’s auditor independence policy as outlined in Perpetual’s Corporate Responsibility Statement.
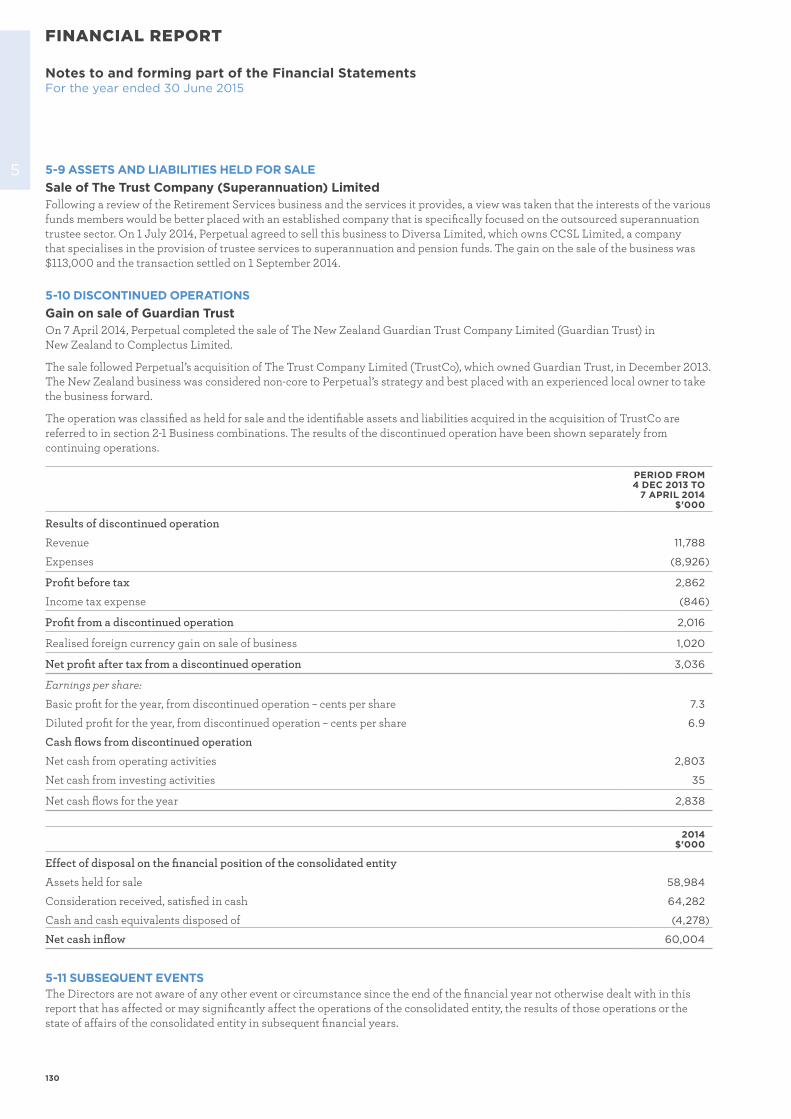
130
FINANCIAL REPORT
Notes to and forming part of the Financial StatementsFor the year ended 30 June 2015
5 5-9 ASSETS AND LIABILITIES HELD FOR SALESale of The Trust Company (Superannuation) LimitedFollowing a review of the Retirement Services business and the services it provides, a view was taken that the interests of the various funds members would be better placed with an established company that is specifically focused on the outsourced superannuation trustee sector. On 1 July 2014, Perpetual agreed to sell this business to Diversa Limited, which owns CCSL Limited, a company that specialises in the provision of trustee services to superannuation and pension funds. The gain on the sale of the business was $113,000 and the transaction settled on 1 September 2014.
5-10 DISCONTINUED OPERATIONSGain on sale of Guardian TrustOn 7 April 2014, Perpetual completed the sale of The New Zealand Guardian Trust Company Limited (Guardian Trust) in New Zealand to Complectus Limited.
The sale followed Perpetual’s acquisition of The Trust Company Limited (TrustCo), which owned Guardian Trust, in December 2013. The New Zealand business was considered non-core to Perpetual’s strategy and best placed with an experienced local owner to take the business forward.
The operation was classified as held for sale and the identifiable assets and liabilities acquired in the acquisition of TrustCo are referred to in section 2-1 Business combinations. The results of the discontinued operation have been shown separately from continuing operations.
PERIOD FROM 4 DEC 2013 TO
7 APRIL 2014$'000
Results of discontinued operation
Revenue 11,788
Expenses (8,926)
Profit before tax 2,862
Income tax expense (846)
Profit from a discontinued operation 2,016
Realised foreign currency gain on sale of business 1,020
Net profit after tax from a discontinued operation 3,036
Earnings per share:
Basic profit for the year, from discontinued operation – cents per share 7.3
Diluted profit for the year, from discontinued operation – cents per share 6.9
Cash flows from discontinued operation
Net cash from operating activities 2,803
Net cash from investing activities 35
Net cash flows for the year 2,838
2014$'000
Effect of disposal on the financial position of the consolidated entity
Assets held for sale 58,984
Consideration received, satisfied in cash 64,282
Cash and cash equivalents disposed of (4,278)
Net cash inflow 60,004
5-11 SUBSEQUENT EVENTSThe Directors are not aware of any other event or circumstance since the end of the financial year not otherwise dealt with in this report that has affected or may significantly affect the operations of the consolidated entity, the results of those operations or the state of affairs of the consolidated entity in subsequent financial years.
PERPETUAL ANNUAL REPORT 2015 131
6This section sets out Perpetual’s accounting policies that relate to the financial statements as a whole. Where an accounting policy is specific to a single note, the policy is described in the note to which it relates. This section also shows new accounting standards, amendments and interpretations, and whether they are effective in 2015 or later years. We explain how these changes are expected to impact the financial position and performance of Perpetual.
6-1 REPORTING ENTITYPerpetual Limited (‘the Company’) is domiciled in Australia. The consolidated financial report of the Company as at and for the year ended 30 June 2015 comprises the Company and its controlled entities (together referred to as ‘the consolidated entity’) and the consolidated entity’s interests in associates.
Perpetual is a for-profit entity and primarily involved in funds management, portfolio management, financial planning, trustee, responsible entity and compliance services, executor services, investment administration and custody services.
The financial report was authorised for issue by the Directors on 27 August 2015.
The Company is a public company listed on the Australian Securities Exchange (code: PPT), incorporated in Australia and operating in Australia and Singapore.
The consolidated annual report for the consolidated entity as at and for the year ended 30 June 2015 is available at www.perpetual.com.au.
6-2 BASIS OF PREPARATIONi. Statement of complianceThe financial report is a general purpose financial report prepared in accordance with Australian Accounting Standards adopted by the Australian Accounting Standards Board (AASB) and the Corporations Act 2001.
The financial report of the consolidated entity also complies with International Financial Reporting Standards (IFRS) adopted by the International Accounting Standards Board (IASB).
ii. Basis of preparationThe consolidated financial statements have been prepared on a historical cost basis, except for available-for-sale financial assets and derivative financial instruments which are measured at fair value. Non-current assets are stated at the lower of carrying amount or fair value less selling costs.
The consolidated financial statements are presented in Australian dollars, which is the functional currency of the majority of the consolidated entity.
The Company is of a kind referred to in ASIC Class Order 98/100 dated 10 July 1998 and in accordance with that Class Order, all financial information presented in Australian dollars has been rounded to the nearest thousand unless otherwise stated.
USE OF JUDGEMENTS AND ESTIMATESIn preparing these consolidated financial statements, management has made judgements, estimates and assumptions that affect the application of the consolidated entity’s accounting policies and the reported amounts of assets, liabilities, income and expenses. Actual results may differ from these estimates. Estimates and underlying assumptions are reviewed on an ongoing basis. Revisions to accounting estimates are recognised prospectively.
(a) JudgementsInformation about critical judgements in applying accounting policies in accordance with Australian Accounting Standard AASB 10 Consolidated Financial Statements is included in section 5-3 Controlled entities.
(b) Assumptions and estimation uncertaintiesInformation about assumptions and estimation uncertainties that have a significant risk of resulting in a material adjustment within the year ended 30 June 2015 are included in the following notes: � Section 1-4 Income taxes � Section 2-1 Business combinations � Section 2-5 Intangibles � Section 2-6 Provisions � Section 2-7 Employee benefits � Section 3-5 Commitments and contingencies � Section 5-1 Structured products assets and liabilities � Section 5-6 Share-based payments
SECTION 6 BASIS OF PREPARATION
132
Notes to and forming part of the Financial StatementsFor the year ended 30 June 2015
FINANCIAL REPORT
6 6-2 BASIS OF PREPARATION CONTINUEDii. Basis of preparation continuedMEASUREMENT OF FAIR VALUES
A number of the consolidated entity’s accounting policies and disclosures require the measurement of fair values for both financial and non-financial assets and liabilities.
The consolidated entity has an established control framework with respect to the measurement of fair values. This includes overseeing all significant fair value measurements.
Significant unobservable inputs and valuation adjustments are regularly reviewed. If third party information, such as broker quotes or pricing services, is used to measure fair values, an assessment is made of the evidence obtained from the third parties. This is used to support the conclusion that such valuations meet the requirements of IFRS, including the level in the fair value hierarchy in which such valuations should be classified.
Significant valuation issues are reported to the Audit, Risk and Compliance Committee.
When measuring the fair value of an asset or a liability, the consolidated entity uses market observable data as far as possible. Fair values are categorised into different levels in a fair value hierarchy based on the inputs used in the valuation techniques as follows: � Level 1: quoted prices (unadjusted) in active markets for identical assets or liabilities. � Level 2: inputs other than quoted prices included in Level 1 that are observable for the asset or liability, either directly
(i.e. as prices) or indirectly (i.e. derived from prices). � Level 3: inputs for the asset or liability that are not based on observable market data (unobservable inputs).
If the inputs used to measure the fair value of an asset or a liability might be categorised in different levels of the fair value hierarchy, then the fair value measurement is categorised in its entirety in the same level of the fair value hierarchy as the lowest level input that is significant to the entire measurement.
The consolidated entity recognises transfers between levels of the fair value hierarchy at the end of the reporting period during which the change has occurred.
Further information about the assumptions made in measuring fair values is included in the following notes: � Section 2-7 Employee benefits � Section 4-1 Financial risk management � Section 5-1 Structured products assets and liabilities � Section 5-6 Share-based payments
6-3 OTHER SIGNIFICANT ACCOUNTING POLICIESSignificant accounting policies have been included in the relevant notes to which the policies relate. Other significant accounting policies are listed below:
i. Basis of consolidation(A) SUBSIDIARIES AND SHARE PLAN ENTITIES
Subsidiaries are entities controlled by the consolidated entity. The consolidated entity controls an entity when it is exposed to, or has rights to, variable returns from its involvement with the entity and has the ability to affect those returns through its power over the entity. The financial statements of subsidiaries are included in the consolidated financial statements from the date control commences until the date control ceases.
(B) TRANSACTIONS ELIMINATED ON CONSOLIDATIONIntra-group balances and transactions, and any unrealised income and expenses arising from intra-group transactions, are eliminated in preparing consolidated financial statements. Unrealised gains arising from transactions with associates are eliminated against the investment to the extent of the consolidated entity’s interest in the associate. Unrealised losses are eliminated in the same way as unrealised gains, but only to the extent that there is no evidence of impairment. Gains and losses are recognised when the contributed assets are consumed or sold by the associates or, if not consumed or sold, when the consolidated entity’s interest in such entities is disposed of.
PERPETUAL ANNUAL REPORT 2015 133
66-3 OTHER SIGNIFICANT ACCOUNTING POLICIES CONTINUED ii. Foreign currency(A) FOREIGN CURRENCY TRANSACTIONS AND BALANCES
Foreign currency transactions are translated into the functional currency using the exchange rates prevailing at the dates of the transactions. Foreign exchange gains and losses resulting from the settlement of such transactions and from the translation at year end exchange rates of monetary assets and liabilities denominated in foreign currencies are recognised in the profit or loss.
Translation differences on financial assets and liabilities carried at fair value are reported as part of their fair value gain or loss. Translation differences on non-monetary financial assets and liabilities such as equities held at fair value through profit or loss are recognised in profit or loss as part of the fair value gain or loss. Translation differences on non-monetary financial assets such as equities classified as available-for-sale financial assets are included in the available-for-sale reserve in equity.
(B) FOREIGN OPERATIONSThe results and financial position of subsidiaries that have a functional currency different from the presentation currency are translated into Australian dollars as follows: � Assets and liabilities for each statement of financial position presented are translated at the closing rate at the date of that
statement of financial position. � Income and expenses for each statement of comprehensive income are translated at average exchange rates (unless this is not
a reasonable approximation of the cumulative effect of the rates prevailing on the transaction dates, in which case income and expenses are translated at the dates of the transactions).
Foreign currency differences are recognised in other comprehensive income. When a foreign operation is disposed of, in part or in full, the relevant amount in the foreign currency translation reserve is transferred to profit or loss or to non-controlling interest as part of the profit or loss on disposal.
iii. PayablesPayables are non-interest-bearing and are stated at amortised cost, with the exception of contingent consideration recognised in business combinations, which is recorded at fair value at the acquisition date.
Contingent consideration recognised in business combinations is classified as a financial liability and is subsequently remeasured to fair value with changes in fair value recognised in profit or loss.
134
FINANCIAL REPORT
Notes to and forming part of the Financial StatementsFor the year ended 30 June 2015
6 6-3 OTHER SIGNIFICANT ACCOUNTING POLICIES CONTINUED iv. Impairment(A) FINANCIAL ASSETS (INCLUDING RECEIVABLES)
A financial asset not carried at fair value through profit or loss is assessed at each reporting date to determine whether there is any objective evidence of impairment. A financial asset is considered to be impaired if objective evidence indicates that one or more events have had a negative effect on the estimated future cash flows of that asset.
Objective evidence that financial assets (including equity securities) are impaired can include default or delinquency by a debtor, restructuring of an amount due to the consolidated entity on terms that the consolidated entity would not consider otherwise, indications that a debtor or issuer will enter bankruptcy and the disappearance of an active market for a security. In addition, for an investment in an equity security, a significant or prolonged decline in fair value below its cost is objective evidence of impairment.
The consolidated entity considers evidence of impairment for receivables and held-to-maturity investment securities at both a specific asset and collective level. All individually significant receivables and held-to-maturity investment securities are assessed for specific impairment. All individually significant receivables and held-to-maturity investment securities found not to be specifically impaired are then collectively assessed for any impairment that has been incurred but not yet identified. Receivables and held-to-maturity investment securities that are not individually significant are collectively assessed for impairment by grouping together receivables and held-to-maturity investment securities with similar risk characteristics.
In assessing collective impairment, the consolidated entity uses historical trends of the probability of default, timing of recoveries and the amount of loss incurred, adjusted for management’s judgement as to whether current economic and credit conditions are such that the actual losses are likely to be greater or less than suggested by historical trends.
An impairment loss in respect of a financial asset measured at amortised cost is calculated as the difference between its carrying amount and the present value of the estimated future cash flows discounted at the asset’s original effective interest rate. Losses are recognised in profit or loss and reflected in an allowance account against receivables. Interest on the impaired asset continues to be recognised through the unwinding of the discount. When a subsequent event causes the amount of impairment loss to decrease, the decrease in impairment loss is reversed through profit or loss.
Impairment losses on available-for-sale investment securities are recognised by transferring the cumulative loss that has been recognised in other comprehensive income, and presented in the available-for-sale reserve in equity, to profit or loss. The cumulative loss that is removed from other comprehensive income and recognised in profit or loss is the difference between the acquisition cost, net of any principal repayment and amortisation, and the current fair value, less any impairment loss previously recognised in profit or loss.
If, in a subsequent period, the fair value of an impaired available-for-sale debt security increases and the increase can be related objectively to an event occurring after the impairment loss was recognised in profit or loss, then the impairment loss is reversed, with the amount of the reversal recognised in profit or loss. However, any subsequent recovery in the fair value of an impaired available-for-sale equity security is recognised in other comprehensive income.
PERPETUAL ANNUAL REPORT 2015 135
6-3 OTHER SIGNIFICANT ACCOUNTING POLICIES CONTINUEDiv. Impairment continued(B) NON-FINANCIAL ASSETS
The carrying amounts of the consolidated entity’s non-financial assets, other than deferred tax assets (see section 1-4), are reviewed at each reporting date to determine whether there is any indication of impairment. If any such indication exists, the asset’s recoverable amount is estimated. For goodwill and intangible assets that have indefinite lives or that are not yet available for use, recoverable amount is estimated at each balance sheet date.
The recoverable amount of an asset or cash-generating unit is the greater of its value in use and its fair value less costs to sell. In assessing value in use, the estimated future cash flows are discounted to their present value using a pre-tax discount rate that reflects current market assessments of the time value of money and the risks specific to the asset. For the purpose of impairment testing, assets that cannot be tested individually are grouped together into the smallest group of assets that generates cash inflows from continuing use that are largely independent of the cash inflows of other assets or groups of assets (the ‘cash-generating unit’ or CGU).
Subject to an operating segment ceiling test, for the purposes of goodwill impairment testing, CGUs to which goodwill has been allocated are aggregated so that the level at which impairment is tested reflects the lowest level at which goodwill is monitored for internal reporting purposes.
The consolidated entity’s corporate assets do not generate separate cash inflows. If there is an indication that a corporate asset may be impaired, then the recoverable amount is determined for the CGU to which the corporate asset belongs.
An impairment loss is recognised if the carrying amount of an asset or its cash-generating unit exceeds its recoverable amount. Impairment losses are recognised in the Statement of Comprehensive Income. Impairment losses recognised in respect of cash-generating units are allocated first to reduce the carrying amount of any goodwill allocated to the units and then, to reduce the carrying amount of the other assets in the unit on a pro rata basis.
An impairment loss in respect of goodwill is not reversed. In respect of other assets, impairment losses recognised in prior periods are assessed at each balance sheet date for any indications that the loss has decreased or no longer exists. An impairment loss is reversed if there has been a change in the estimates used to determine the recoverable amount. An impairment loss is reversed only to the extent that the asset’s carrying amount does not exceed the carrying amount that would have been determined, net of depreciation or amortisation, if no impairment loss had been recognised.
6-4 NEW STANDARDS AND INTERPRETATIONS NOT YET ADOPTEDA number of new accounting standards and amendments have been issued but are not yet effective. The consolidated entity has not elected to early adopt any of these new standards or amendments in this financial report.
(a) AASB 9 Financial InstrumentsAASB 9, published in July 2014, replaces the existing guidance in AASB 139 Financial Instruments: Recognition and Measurement. AASB 9 includes revised guidance on the classification and measurement of financial instruments, including a new expected credit loss model for calculation impairment on financial assets, and the new general hedge accounting requirements. It also carries forward the guidance on recognition and derecognition of financial instruments from AASB 39.
AASB 9 is effective for annual reporting periods beginning on or after 1 January 2018, with early adoption permitted.
(b) AASB 15 Revenue from Contracts with CustomersAASB 15 establishes a comprehensive framework for determining whether, how much and when revenue is recognised. It replaces existing revenue recognition guidance, including AASB 118 Revenue, AASB 111 Construction Contracts and IFRIC 13 Customer Loyalty Programmes.
AASB 15 is effective for annual reporting periods beginning on or after 1 January 2018, with early adoption permitted.
These new standards and amendments, when applied in future periods, are not expected to have a material impact on the financial position or performance of the consolidated entity.
6
136
1. In the opinion of the Directors of Perpetual Limited (the ‘Company’):
(a) the consolidated financial statements and notes set out on pages 87 to 135, and the Remuneration Report in the Directors’ Report, are in accordance with the Corporations Act 2001, including:
(i) giving a true and fair view of the consolidated entity’s financial position as at 30 June 2015 and of its performance for the financial year ended on that date; and
(ii) complying with Australian Accounting Standards and the Corporations Regulations 2001;
(b) the financial report also complies with International Financial Reporting Standards as disclosed in section 6-2(i);
(c) there are reasonable grounds to believe that the consolidated entity will be able to pay its debts as and when they become due and payable.
2. The Directors have been given the declarations required by Section 295A of the Corporations Act 2001 from the Chief Executive Officer and the Chief Financial Officer for the financial year ended 30 June 2015.
Signed in accordance with a resolution of the Directors:
Dated at Sydney this 27th day of August 2015.
PETER SCOTT GEOFF LLOYDDirector Director
DIRECTORS’ DECLARATION
DIRECTORS’ DECLARATION
PERPETUAL ANNUAL REPORT 2015 137
ABCD
KPMG, an Australian partnership and a member firm of the KPMG network of independent member firms affiliated with KPMG International Cooperative (“KPMG International”), a Swiss entity.
Liability limited by a scheme approved under Professional Standards Legislation.
Independent auditor’s report to the members of Perpetual Limited
Report on the financial reportWe have audited the accompanying financial report of Perpetual Limited (the Company), which comprises the consolidated statement of financial position as at 30 June 2015, and consolidated statement of profit or loss and other comprehensive income, consolidated statement of changes in equity and consolidated statement of cash flows for the year ended on that date, notes 1-1 to 6-4 comprising a summary of significant accounting policies and other explanatory information and the directors’ declaration of the Consolidated Entity comprising the Company and the entities it controlled at the year’s end or from time to time during the financial year.
Directors’ responsibility for the financial report
The directors of the Company are responsible for the preparation of the financial report that gives a true and fair view in accordance with Australian Accounting Standards and the Corporations Act 2001 and for such internal control as the directors determine is necessary to enable the preparation of the financial report that is free from material misstatement whether due to fraud or error. In note 6-2, the directors also state, in accordance with Australian Accounting Standard AASB 101 Presentation of Financial Statements, that the financial statements of the Consolidated Entity comply with International Financial Reporting Standards.
Auditor’s responsibility
Our responsibility is to express an opinion on the financial report based on our audit. We conducted our audit in accordance with Australian Auditing Standards. These Auditing Standards require that we comply with relevant ethical requirements relating to audit engagements and plan and perform the audit to obtain reasonable assurance whether the financial report is free from material misstatement.
An audit involves performing procedures to obtain audit evidence about the amounts and disclosures in the financial report. The procedures selected depend on the auditor’s judgement, including the assessment of the risks of material misstatement of the financial report, whether due to fraud or error. In making those risk assessments, the auditor considers internal control relevant to the entity’s preparation of the financial report that gives a true and fair view in order to design audit procedures that are appropriate in the circumstances, but not for the purpose of expressing an opinion on the effectiveness of the entity’s internal control. An audit also includes evaluating the appropriateness of accounting policies used and the reasonableness of accounting estimates made by the directors, as well as evaluating the overall presentation of the financial report.
We performed the procedures to assess whether in all material respects the financial report presents fairly, in accordance with the Corporations Act 2001 and Australian Accounting Standards, a true and fair view which is consistent with our understanding of the Consolidated Entity’s financial position and of its performance.
We believe that the audit evidence we have obtained is sufficient and appropriate to provide a basis for our audit opinion.
108
INDEPENDENT AUDITOR’S REPORT TO THE MEMBERS OF PERPETUAL LIMITED
138
ABCD
Independence
In conducting our audit, we have complied with the independence requirements of the Corporations Act 2001.
Auditor’s opinion
In our opinion:
(a) the financial report of the Consolidated Entity is in accordance with the Corporations Act2001, including:
(i) giving a true and fair view of the Consolidated Entity’s financial position as at 30 June2015 and of its performance for the year ended on that date; and
(ii) complying with Australian Accounting Standards and the Corporations Regulations2001.
(b) the financial report also complies with International Financial Reporting Standards asdisclosed in note 6-2.
Report on the remuneration reportWe have audited the Remuneration Report included in pages 28 to 54 of the directors’ report for the year ended 30 June 2015. The directors of the Company are responsible for the preparation and presentation of the remuneration report in accordance with Section 300A of the Corporations Act 2001. Our responsibility is to express an opinion on the remuneration report, based on our audit conducted in accordance with auditing standards.
Auditor’s opinion
In our opinion, the remuneration report of Perpetual Limited for the year ended 30 June 2015,complies with Section 300A of the Corporations Act 2001.
KPMG
Martin McGrathPartner
Sydney
27 August 2015
109
INDEPENDENT AUDITOR’S REPORT TO THE MEMBERS OF PERPETUAL LIMITED
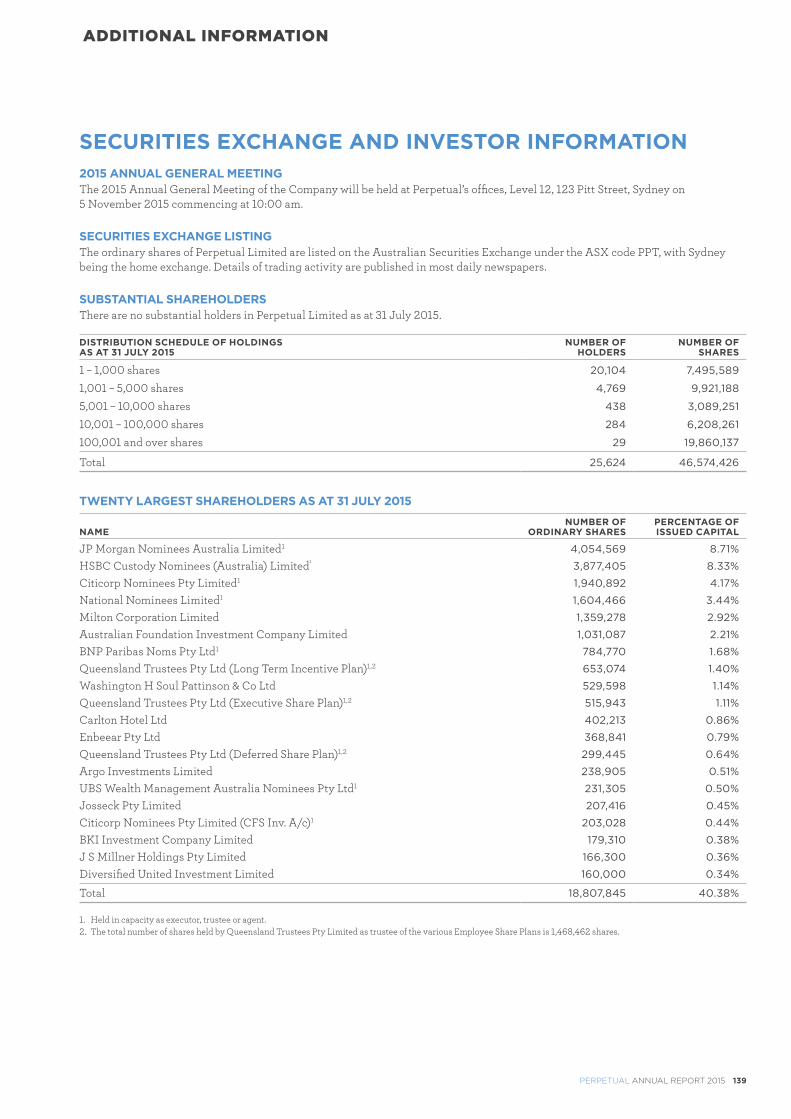
PERPETUAL ANNUAL REPORT 2015 139
SECURITIES EXCHANGE AND INVESTOR INFORMATION2015 ANNUAL GENERAL MEETINGThe 2015 Annual General Meeting of the Company will be held at Perpetual’s offices, Level 12, 123 Pitt Street, Sydney on 5 November 2015 commencing at 10:00 am.
SECURITIES EXCHANGE LISTINGThe ordinary shares of Perpetual Limited are listed on the Australian Securities Exchange under the ASX code PPT, with Sydney being the home exchange. Details of trading activity are published in most daily newspapers.
SUBSTANTIAL SHAREHOLDERSThere are no substantial holders in Perpetual Limited as at 31 July 2015.
DISTRIBUTION SCHEDULE OF HOLDINGSAS AT 31 JULY 2015
NUMBER OF HOLDERS
NUMBER OF SHARES
1 – 1,000 shares 20,104 7,495,589
1,001 – 5,000 shares 4,769 9,921,188
5,001 – 10,000 shares 438 3,089,251
10,001 – 100,000 shares 284 6,208,261
100,001 and over shares 29 19,860,137
Total 25,624 46,574,426
TWENTY LARGEST SHAREHOLDERS AS AT 31 JULY 2015
NAMENUMBER OF
ORDINARY SHARESPERCENTAGE OFISSUED CAPITAL
JP Morgan Nominees Australia Limited1 4,054,569 8.71%
HSBC Custody Nominees (Australia) Limited¹ 3,877,405 8.33%
Citicorp Nominees Pty Limited1 1,940,892 4.17%
National Nominees Limited1 1,604,466 3.44%
Milton Corporation Limited 1,359,278 2.92%
Australian Foundation Investment Company Limited 1,031,087 2.21%
BNP Paribas Noms Pty Ltd1 784,770 1.68%
Queensland Trustees Pty Ltd (Long Term Incentive Plan)1,2 653,074 1.40%
Washington H Soul Pattinson & Co Ltd 529,598 1.14%
Queensland Trustees Pty Ltd (Executive Share Plan)1,2 515,943 1.11%
Carlton Hotel Ltd 402,213 0.86%
Enbeear Pty Ltd 368,841 0.79%
Queensland Trustees Pty Ltd (Deferred Share Plan)1,2 299,445 0.64%
Argo Investments Limited 238,905 0.51%
UBS Wealth Management Australia Nominees Pty Ltd1 231,305 0.50%
Josseck Pty Limited 207,416 0.45%
Citicorp Nominees Pty Limited (CFS Inv. A/c)1 203,028 0.44%
BKI Investment Company Limited 179,310 0.38%
J S Millner Holdings Pty Limited 166,300 0.36%
Diversified United Investment Limited 160,000 0.34%
Total 18,807,845 40.38%
1. Held in capacity as executor, trustee or agent.2. The total number of shares held by Queensland Trustees Pty Limited as trustee of the various Employee Share Plans is 1,468,462 shares.
ADDITIONAL INFORMATION
140
OTHER INFORMATIONPerpetual Limited, incorporated and domiciled in Australia, is a publicly listed company limited by shares.
VOTING RIGHTSUnder the Company’s Constitution, each member present at a general meeting (whether in person, by proxy, attorney or corporate representative) is entitled:1. on a show of hands to one vote, and2. on a poll to one vote for each share held.
If a member is present in person, any proxy of that member is not entitled to vote.
VOTING BY PROXYVoting by proxy allows shareholders to express their views on the direction and management of the economic entity without attending a meeting in person.
Shareholders who are unable to attend the 2015 Annual General Meeting are encouraged to complete and return the proxy form that accompanies the notice of meeting enclosed with this report.
ON-MARKET BUYBACKThere is no current on-market buyback.
FINAL DIVIDENDThe final dividend of 125 cents per share will be paid on 25 September 2015 to shareholders entitled to receive dividends and registered on 3 September 2015, being the record date.
ENQUIRIESIf you have any questions about your shareholding or matters such as dividend payments, tax file numbers or change of address you are invited to contact the Company’s share registry office below, or visit its website at www.linkmarketservices.com.au or email [email protected]
Link Market Services Limited1A Homebush Bay DriveRhodes NSW 2138
Locked Bag A14Sydney South NSW 1235
Perpetual Shareholder Information Line:1300 732 806Fax: (02) 9287 0303
Any other enquiries which you may have about the Company can be directed to the Company’s registered office or visit the Company’s website.
PRINCIPAL REGISTERED OFFICELevel 12123 Pitt StreetSydney NSW 2000Tel: (02) 9229 9000Fax: (02) 8256 1461
COMPANY SECRETARYJoanne Hawkins
Website address: www.perpetual.com.au
ADDITIONAL INFORMATION

Perpetual’s 2015 Annual Report is printed on Pacesetter supplied by Spicers Paper. Pacesetter is made from elemental chlorine free bleached pulp which is sourced from “farmed trees” and other sustainably managed sources. It is manufactured by an ISO 14001 certified mill. 21
75_0
915

WWW.PERPETUAL.COM.AU
Recommended