Seismic Behavior of Steel Framed Structures with
Infill Walls - Analytical Study
Elif Nazlı Akbaş
Submitted to the
Institute of Graduate Studies and Research
in partial fulfillment of the requirements for the degree of
Master of Science
in
Civil Engineering
Eastern Mediterranean University
September 2017
Gazimağusa, North Cyprus

Approval of the Institute of Graduate Studies and Research
____________________________________
Assoc. Prof. Dr. Ali Hakan Ulusoy
Acting Director
I certify that this thesis satisfies the requirements as a thesis for the dgree of Master
of Science in Civil Engineering.
____________________________________
Assoc. Prof. Dr. Serhan Şensoy
Chair, Department of Civil Engineering
We certify that we have read this thesis and that in our opinion it is fully adequate in
scope and quality as a thesis for the degree of Master of Science in Civil
Engineering.
____________________________________
Assoc. Prof. Dr. Mürüde Çelikağ
Supervisor
Examining Committee
1. Assoc. Prof. Dr. Mürüde Çelikağ __________________________
2. Assoc. Prof. Dr. Mehmet Cemal Geneş __________________________
3. Asst. Prof. Dr. Abdullah Fettahoğlu __________________________

iii
ABSTRACT
The objective of this numerical study was the investigation of the seismic behavior of
steel framed structures with infill walls. The equivalent diagonal struts and shear
spring model based finite element software SeismoStruct was employed for this
purpose. The experimental test setup and the data obtained from the experiments
were used to verify the two basic analytical models by using SeismoStruct software.
Then, six new groups of frame models were formed by using the validated simple
frame structures. The number of bays and stories were increased, and infill walls
were introduced in alternative steel frames. The global structural performance
parameters of top displacement, base shear, fundamental time period, out-of-plane
displacement and local parameters of inter-story drift ratio and member deformation
capacities were obtained for all models. These parameters were compared in each
group of models to detect symmetry/asymmetry and vertical discontinuity based
effects due to presence or absence of infill walls. From this study, it is concluded that
infill walls can increase strength and stiffness of the systems depending on the
location of them. Also, the orientation of vertical frame members have significant
advantages such as decreased fundamental time period, zero-out-of-plane
displacement for minor axis frame models.
Keywords: steel frame, infill wall, infill panel, infilled steel frame, static-pushover
analysis, moment frame

iv
ÖZ
Bu nümerik çalışma ile dolgu duvarların çelik çerçeve yapı sistemlerinin sismik
davranışına etkileri araştırılmıştır. Bu amaç için çerçeve yapılardaki dolgu panellerin
doğrusal olmayan davranışlarını modellemede eşdeğer basınç ve kesme çubuğu
yaklaşımını esas alan sonlu elemanlar programı SeismoStruct kullanılmıştır.
SeismoStruct kullanılarak referans olarak alınan bir deneysel çalışmanın yarı ölçekli
örnekleri bilgisayar ortamında bire bir aynısı oluşturularak test edilmiştir. Daha sonra
deneysel çalışmada kullanılan örneklerin açıklık ve kat sayıları artırılmış ve dolgu
panellerin yerleri değiştirilerek altı adet yeni model grubu oluşturulmuştur. Bu
modeller genel performans parametreleri olan yatay yer değiştirme, taban kesmesi,
yapının serbest titreşim periyodu, düzlem dışı yer değiştirme ve lokal parametreler
olan katlar arası rölatif deplasman ile eleman kapasiteleri açısından incelenmiştir.
Dolgu duvarların varlığı ve simetrik/asimetrik yerleşimleri nedeniyle planda ve
düşey düzlemde oluşan düzensizliklerin bu parametrelere etkisi her grup kendi
içerisinde ve tüm gruplar karşılaştırılarak çıkarımlar yapılmıştır. Yapılan çalışma
neticesinde dolgu duvarların konumuna bağlı olarak rijitlik ve sağlamlığı artırdığı
sonucuna varılmıştır. Ayrıca, düşey taşıyıcı elemanların yerleşim yönlerinin yapının
serbest titreşim periyodunu düşürmek ve düzlem dışı yer değiştirmeyi azaltmak gibi
avantajları olduğu gözlemlenmiştir.
Anahtar Kelimeler: çelik çerçeve, dolgu duvar, statik itme (pushover) analizi

v
DEDICATION
To my dear family and especially to my one and only
NEPHEW…

vi
TABLE OF CONTENTS
ABSTRACT ...……………………………………………………………………....iii
ÖZ ...…………………………………………………...…………………...………..iv
DEDICATION ...…………………………………………………………….……….v
LIST OF TABLES .……………………………………………………………….....ix
LIST OF FIGURES ……………………………………………………….………...xi
LIST OF SYMBOLS AND ABBREVIATIONS ………………………………….xvi
1 INTRODUCTION ……………………………….……………………………..….1
1.1 Introduction ………………….………………………………………………...1
1.2 Significance and Objective of this Research .…….………………………..….4
1.3 Organization of the Thesis ………………………….………………………....5
2 LITERATURE REVIEW ...……………………………….……………………….6
2.1 Introduction ……………………………………….………………………..….6
2.2 Frame Types ……………………………………….……………………..……8
2.2.1 Moment-Resisting Frames ……………………….…………………….....8
2.2.2 Dual Systems …………………………………….……………………...10
2.3 Seismic Methods of Analysis ………………………….……………………..10
2.3.1 Elastic/Linear Analysis ……………………………….……………………12
2.3.1.1 Linear Static Analysis ……………………………….………………...12
2.3.1.2 Linear Dynamic Analysis …..………………………….……………...12
2.3.2 In-elastic/Non-linear Analysis ...……………………….………………..13
2.3.2.1 Non-linear Static Analysis ...…………………………………………..13
2.3.2.2 Non-linear Dynamic Analysis ...………….……………………………14
2.4 Failure Modes of Infill Walls and Frames ...………………………….……...14
vii
2.4.1 Infill Wall Failure ...………………………………………….……..…...15
2.4.1.1 In-plane Infill Wall Failure ...………………………………….……15
2.4.1.2 Out-of-plane Infill Wall Failure ...…………………………….…….16
2.4.2 Frame Failure …………………………………….…………...….…..….18
2.5 Vertical Discontinuities and Formation of Soft/Weak Storey ...…….……….21
2.6 Modelling of Infill Walls ……………………………………………….……23
2.6.1 Micro Models …………………………………………………….……...23
2.6.2 Macro Models (Equivalent Diagonal Strut(s) Model) ...………….……..24
2.6.3 Crisafulli & Carr Model …………………………………………….…...26
2.6.3.1 Introduction to Crisafulli Model ...…………………………….……26
2.6.3.2 Overview and Implementation of The Model ...……………….…..27
2.6.3.3 Parameters of Inelastic Infill Panel Element ...……………………...28
3 NUMERICAL MODELLING OF INFILL WALLS WITH SEISMOSTRUCT ...36
3.1 Introduction ...………………………………………………………….……..36
3.2 Past Experimental Study ……………...……………………………….……..36
3.3 Numerical Modelling of the Experimental Test ………………………....…..40
3.4 Verification of Experimental Test Results ………………………………...…44
3.4.1 Major Axis Frame Tests ………………………………………………....44
3.4.1.1 Moment Frame without Infill Wall, MAJ-1B-1S …………….…….44
3.4.1.2 Moment Frame with Infill Wall, MAJ-1B-1S-INF …………….…...48
3.4.2 Minor Axis Frame Tests …………………………………………….…..52
3.4.2.1 Moment Frame without Infill Wall MIN-1B-1S ……………….…..52
3.4.2.2 Moment Frame with Infill Wall, MIN-1B-1S-INF …………….…...56
4 INVESTIGATION OF THE ANALYTICAL MODELS FOR THE EFFECTS OF
INFILL WALL ……………………………………………………………………..60

viii
4.1 Introduction ……………………….………………………………………….60
4.2 Major Axis Frame Models …………….……………………………………..61
4.2.1 One Bay Two Story (1B-2S) Frame Models ……….…………………...61
4.2.2 Two Bay One Story (2B-1S) Frame Models ...…………….……..……..65
4.2.3 Two Bay Two Story (2B-2S) Frame Models ……………….…………...71
4.3 Minor Axis Frame Models ...………………………………….……………...78
4.3.1 One Bay Two Story (1B-2S) Frame Models ……………………………79
4.3.2 Two Bay One Story (2B-1S) Frame Models ……………….……..…….84
4.3.3 Two Bay Two Story (2B-2S) Frame Models ……………….………..….87
5 COMPARISON OF RESULTS, CONCLUSIONS AND RECOMMENDATIONS
FOR FUTURE WORK ...……………………………………………..…………….95
5.1 Introduction ……………………………………………………….……….....95
5.2 Comparison of the Results and Conclusions .………………….………..…...96
5.3 Recommendations …………………………………………….………….....100
REFERENCES ……………………………………………………………………102
APPENDICES ………………………………………………………………….....109
Appendix A: Structural Performance Parameters and Member Capacities of
validation Models ……………………………..……………………..………….110
Appendix B: Location of Plastic Hinges ……………………………...………..112

ix
LIST OF TABLES
Table 2.1: Empirical parameters and their suggested values for SeismoStruct
software programme [41]……………………….…………………………………...31
Table 2.2: Coefficient of friction for different materials [43]………………………33
Table 2.3: Suggested values of shear bond strength, τo, and reduction shear factor, αs
[41]………………………………………………………….……………………….33
Table 3.1: Mechanical properties of the steel sections [11]………………………....39
Table 3.2: Dimensions of the steel sections [11]…………………………………....40
Table 3.3: Infill wall suggested and programme default values [41]……………….43
Table 3.4: Load and corresponding displacement readings of the experimental and
analytical studies of MAJ-1B-1S……………………………………………………45
Table 3.5: Load and corresponding displacement values of the experimental and
analytical studies of MAJ-1B-1S-INF……………………………………………....49
Table 3.6: Load and corresponding displacement values of the experimental and
analytical studies of MIN-1B-1S……………………………………………………53
Table 3.7: Load and corresponding displacement values of the experimental and
analytical studies of MIN-1B-1S-INF………………………………………………57
Table 4.1: Member capacities of major axis 1 bay 2 story (1B-2S) models………...65
Table 4.2: Member capacities of MAJ-2B-1S, MAJ-2B-1S-INF, MAJ-2B-1S-LINF
and MAJ- 2B-1S-RINF……………………………………………………………...70
Table 4.3: Out-of-plane displacement values of major axis 2 bay 1 story (2B-1S)
models……………………………………………………………………………….71
Table 4.4: Member capacities of major axis 2 bay 2 story (2B-2S) models………...76

x
Table 4.5: Member capacities of major axis 2 bay 2 story (2B-2S) models
(continued)…………………………………………………………………………..77
Table 4.6: Out-of-plane displacement values of major axis 2 bay 2 story (2B-2S)
models……………………………………………………………………………….78
Table 4.7: Member capacities of minor axis 1 bay 2 story (1B-2S) models……..…83
Table 4.8: Member capacities of minor axis 2 bay 1 story (2B-1S) models……..…87
Table 4.9: Member capacities of minor axis 2 bay 2 story (2B-1S) models……..…93
Table 4.10: Member capacities of minor axis 2 bay 2 story (2B-2S) models
(continued)…………………………………………………………………..………94

xi
LIST OF FIGURES
Figure 1.1: (a) Failure of infill walls, (b) frame failure and, (c) formation of a soft
and weak story from L’Aqulia (2009), Bam-Kerman (2003) and Gölcük-Kocaeli
(1999) earthquakes respectively [1, 2, 3] ...………………………………………..…1
Figure 1.2: Change in the lateral-load transfer mechanism due to masonry infills [5]
…….……………………………………………………………………………..……2
Figure 1.3: Different arrangement of infill walls; (a) fully infilled, (b) only upper
stories infilled and, (c) asymmetrically placed infills in structures ...…………......…3
Figure 2.1: Moment resisting frame [20] …………………………………….....……9
Figure 2.2: Possible plastic hinge locations [20] ...………………………………..…9
Figure 2.3: Diagonally braced frame [21] ...………………………………….……..10
Figure 2.4: (a) Chevron braced frame system, (b) moment frame system and, (c) dual
multi-storey frame system ...………………………………………………….……..10
Figure 2.5: Seismic methods of analysis ...………………………………….………11
Figure 2.6: Failure modes of masonry infills: (a) corner crushing mode; (b) diagonal
compression mode; c. diagonal cracking mode; and d. sliding shear mode [22] .….15
Figure 2.7: Forces acting on structures during earthquakes ...…………………...…17
Figure 2.8: Out-of-plane infill wall failure after the Abruzzo, Italy earthquake [1, 23]
……..………………………………………………………………………………...18
Figure 2.9: Failure mechanisms of infilled frames [25] ...……………………….…19
Figure 2.10: Flexural collapse mechanism ...………………………………….……21
Figure 2.11: Axial load failure of the frame member .………………………….…..21
Figure 2.12: Discontinuation in vertical configuration of buildings [26] ...……...…22
Figure 2.13: Equivalent diagonal strut model for infilled frames ...…………..…….25

xii
Figure 2.14: Crisafulli double strut model (1997) ..…………………………...……26
Figure 2.15: Modified Crisafulli double strut model by Carr ..……………....……..26
Figure 2.16: Crisafulli and Carr (2007) model for masonry infill panel ..…….……28
Figure 2.17: Mechanical, geometrical and empirical parameters required in
SeismoStruct model ..……….…………………………………………………...….29
Figure 2.18: Effective width, bw, of the diagonal strut [46] ..……………....………34
Figure 3.1: Experimental Moment and braced frames with and without infill wall
[11] ..……………………………………………………………………….………..37
Figure 3.2: The experimental test set-up of (a) major and minor axis moment frame
without infill wall (MAJ-1B-1S, MIN-1B-1S) and (b) major and minor axis moment
frame with infill wall (MAJ-1B-1S-INF, MIN-1B-1S-INF) ..……………….……..38
Figure 3.3: Load directions for (a) major and (b) minor axis frames ………………38
Figure 3.4: Colum and beam section dimension details [11] ..…………….………..39
Figure 3.5: SeismoStruct models of major axis moment frame without infill, MAJ-
1B-1S and major axis moment frame with infill, MAJ-1B-1S-INF .……………….44
Figure 3.6: Comparison of the lateral load versus displacement curves for
experimental (EXP) and analytical (ANLY) studies of MAJ-1B-1S .……………...46
Figure 3.7: Lateral torsional buckling and out-of-plane displacements of the
experimental specimen (on the left) and the analytical model (on the right) [11] .…47
Figure 3.8: (a) Resulting two components of the applied force due to lateral torsional
and flexural buckling and out-of-plane displacement of the frame, (b) base plate
deformation of the experimental test [11] ...………………………………...………48
Figure 3.9: Comparison of the lateral load versus displacement curves for
experimental (EXP LVDT2 and EXP LVDT3) and analytical (ANLY) studies of
MAJ-1B-1S-INF .…………………………………………………………...………50

xiii
Figure 3.10: The experimental specimen MAJ-1B-INF in the structures laboratory (a)
before the test, (b) after the test with diagonal cracks and corner crush [11] ...…….51
Figure 3.11: SeismoStruct models of minor axis moment frame without infill, MIN-
1B-1S and minor axis moment frame with infill, MIN-1B-1S-INF .……………….52
Figure 3.12: Comparison of the lateral load versus displacement curves for
experimental (EXP) and analytical (ANLY) studies of MIN-1B-1S .………………54
Figure 3.13: Experimental specimen MIN-1B-1S before and after the test [11] ...…55
Figure 3.14: MIN-1B-1S at the end of the test; (a) column and column base, (b) beam
end near column connection ...………………………………………………….…..55
Figure 3.15: Comparison of the lateral load versus displacement curves for
experimental (EXP) and analytical (ANALY) studies of MAJ-1B-INF .…….…….58
Figure 3.16: The formation of diagonal and hairline cracks and its branches [11] ...59
Figure 4.1: Details of major axis 1 bay 2 story (1B-2S) models with SeismoStruct
illustrations ..………………………………………………………………….….….62
Figure 4.2: Load-displacement curves for major axis 1 bay 2 story (1B-2S) frame
models .……………………………………………………………………………...63
Figure 4.3: Global structural parameters of major axis 1 bay 2 story (1B-2S) models
(a) top displacement, (b) base shear, (c) time period and (d) drift ratio .………..….64
Figure 4.4: Plan view of major axis 1 bay 2 story (1B-2S) models illustrating zero
out-of-plane displacement at nodes 1 and 2 .………………………………………..64
Figure 4.5: Details of major axis 2 bay 1 story (2B-1S) models with SeismoStruct
illustrations ...……………………………………………………………………..…66
Figure 4.6: Load-displacement curves for major axis 2 bay 1 story (2B-1S) frame
models .…………………………………………………………………………..….67

xiv
Figure 4.7: Global structural parameters of major axis 2 bay 1 story (2B-1S) models,
(a) top displacement, (b) base shear, (c) time period and (d) drift ratio ….….……..68
Figure 4.8: Plan view of major axis 2 bay 1 story (2B-1S) models illustrating out-of-
plane displacements at node 1-3, without showing infills in frames ...……………..68
Figure 4.9: Details of major axis 2 bay 2 story (2B-2S) models with SeismoStruct
illustrations ...………………………………………………………………………..72
Figure 4.10: Load-displacement curves for all major axis 2 bay 2 story (2B-2S)
frame models ………………………………………………………………...……...73
Figure 4.11: Global structural parameters of major axis 2 bay 2 story (2B-2S)
models, (a) top displacement, (b) base shear, (c) time period and (d) drift ratio .…..74
Figure 4.12: Plan view of major axis 2 bay 2 story (2B-2S) models illustrating out-
of-plane displacements at nodes 1-3, without showing infills in frames ...…….…...75
Figure 4.13: Details of minor axis 1 bay 2 story (1B-2S) models with SeismoStruct
illustrations ...…………………………………………………………...…………...80
Figure 4.14: Load-displacement curves for minor axis 1 bay 2 story (1B-2S) frame
models ..…………………………………………………………………...….……..81
Figure 4.15: Global structural parameters of minor axis 1 bay 2 story (1B-2S)
models, (a) top displacement, (b) base shear, (c) time period and (d) drift ratio .......82
Figure 4.16: Plan view of minor axis 1 bay 2 story (1B-2S) models illustrating out-
of-plane displacements at nodes 1 and 2 ……….……………………………...…....82
Figure 4.17: Details of minor axis 2 bay 1 story (2B-1S) models with Seismostruct
illustrations ...…………………………………………………………………..……84
Figure 4.18: Load-displacement curves for minor axis 2 bay 1 story (2B-1S) frame
models ….…………………………………………………...………..……………..85

xv
Figure 4.19: Global structural parameters of minor axis 2 bay 1 story (2B-1S)
models, (a) top displacement, (b) base shear, (c) time period and (d) drift ratio .......86
Figure 4.20: Plan view of minor axis 2 bay 1 story (2B-1S) models illustrating out-
of-plane displacements at nodes 1-3, without showing infills in frames ………..….86
Figure 4.21: Details of minor axis 2 bay 2 story (2B-2S) models with SeismoStruct
illustrations ...………………………………………………………………….....….89
Figure 4.22: Load-displacement curves for all minor axis 2 bay 2 story (2B-2S)
frame models .……………………………………………………………….....……90
Figure 4.23: Global structural parameters of minor axis 2 bay 2 story (2B-2S)
models, (a) top displacement, (b) base shear, (c) time period and (d) drift ratio .......91
Figure 4.24: Plan view of minor axis 2 bay 2 story (2B-2S) models illustrating out-
of-plane displacements at node 1-3 ……………….….…………………………......92
Figure 5.1: Top displacement values for major and minor axis frame models …..…96
Figure 5.2: Fundamental time period for major and minor axis frame models …….98
Figure 5.3: Base shear values of major and minor axis frame models ...…….……..99

xvi
LIST OF SYMBOLS AND ABBREVIATIONS
em Stain at maximum stress
eult Ultimate stain
ecl Closing strain
e1 & e2 Strut area reduction strain
γpr or γplr Reloadin stiffness factor
γplu Starting unloading stiffness factor
αre Strain reloading factor
αch Strain inflection factor
βa Complete unloading strain factor
βch Stress inflection point
µ Coefficient of friction or mean value
τmax Maximum shear stress
τo Shear bond strength
αs Reduction shear factor
γs Proportion of Stiffness Assigned to Shear
s Standard deviation
A1 Strut Area 1
A2 Strut Area 2
bw Equivalent strut width
c.o.v. Coefficient of variation
disp. Displacement
dm Masonry panel diagonal length

xvii
Em Elastic Modulus
ex1 Plastic unloading stiffness factor
ex2 Repeated cycle strain factor
fmθ Compressive Strength
ft Tensile strength
hz Equivalent Contact Length
infmFB Inelastic force-based frame element
MAJ-1B-1S 1 bay 1 story bare major axis frame (validation model)
MAJ-1B-1S-INF 1 bay 1 story major axis frame with infill (validation model)
MAJ-1B-2S 1 bay 2 story bare major axis frame
MAJ-1B-2S-GRINF 1 bay 2 story major axis frame with infill in the ground story
only
MAJ-1B-2S-INF 1 bay 2 story major axis frame with infill
MAJ-1B-2S-UPINF 1 bay 2 story major axis frame with infill in the upper story
only
MAJ-2B-1S 2 bay 1 story bare major axis frame
MAJ-2B-1S-INF 2 bay 1 story major axis frame with infill
MAJ-2B-1S-LINF 2 bay 1 story major axis frame with infill in the left bay only
MAJ-2B-1S-RINF 2 bay 1 story major axis frame with infill in the right bay only
MAJ-2B-2S 2 bay 2 story bare major axis frame
MAJ-2B-2S-ASYM1 2 bay 2 story major axis frame with asymmetrically placed
infill
MAJ-2B-2S-ASYM2 2 bay 2 story major axis frame with asymmetrically placed
infill

xviii
MAJ-2B-2S-GRINF 2 bay 2 story major axis frame with infill in the ground story
only
MAJ-2B-2S-INF 2 bay 2 story major axis frame with infill
MAJ-2B-2S-LINF 2 bay 2 story major axis frame with infill in the left bay only
MAJ-2B-2S-RINF 2 bay 2 story major axis frame with infill in the right bay only
MAJ-2B-2S-UPINF 2 bay 2 story major axis frame with infill in the upper story
only
MIN-1B-1S 1 bay 1 story bare minor axis frame (validation model)
MIN-1B-1S-INF 1 bay 1 story minor axis frame with infill (validation model)
MIN-1B-2S 1 bay 2 story bare minor axis frame
MIN-1B-2S-GRINF 1 bay 2 story minor axis frame with infill in the ground story
only
MIN-1B-2S-INF 1 bay 2 story minor axis frame with infill
MIN-1B-2S-UPINF 1 bay 2 story minor axis frame with infill in the upper story
only
MIN-2B-1S 2 bay 1 story bare minor axis frame
MIN-2B-1S-INF 2 bay 1 story minor axis frame with infill
MIN-2B-1S-LINF 2 bay 1 story minor axis frame with infill in the left bay only
MIN-2B-1S-RINF 2 bay 1 story minor axis frame with infill in the right bay only
MIN-2B-2S 2 bay 2 story bare minor axis frame
MIN-2B-2S-ASYM1 2 bay 2 story minor axis frame with asymmetrically placed
infill
MIN-2B-2S-ASYM2 2 bay 2 story minor axis frame with asymmetrically placed
infill
xix
MIN-2B-2S-GRINF 2 bay 2 story minor axis frame with infill in the ground story
only
MIN-2B-2S-INF 2 bay 2 story minor axis frame with infill
MIN-2B-2S-LINF 2 bay 2 story minor axis frame with infill in the left bay only
MIN-2B-2S-RINF 2 bay 2 story minor axis frame with infill in the right bay only
MIN-2B-2S-UPINF 2 bay 2 story minor axis frame with infill in the upper story
only
RC Reinforced Concrete
sits Symmetric I or T section
stl_bl Bilinear steel model
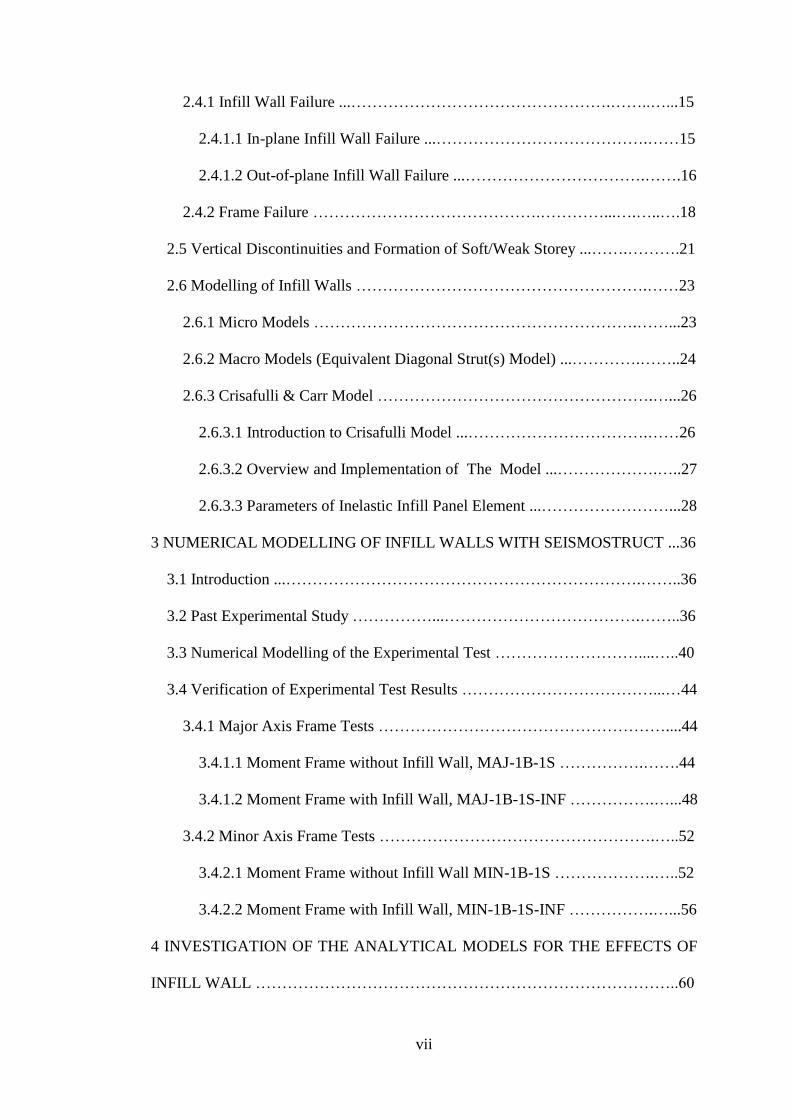
tw Infill panel thickness
Yoi and Xoi Horizontal offset
z Contact length

1
Chapter 1
INTRODUCTION
1.1 Introduction
The reaction of masonry infill walls during an earthquake is complex and
unpredictable due to variations in material properties and their brittle force-
displacement behaviour. This yields to infill walls being ignored during design and
analysis of new structures and capacity evaluation of the existing buildings.
However, field observations after recent earthquakes e.g. Adana-Ceyhan (1998),
Bam-Kerman (2003) and L’Aquila (2009), show that structures with infill walls
experience in-plane and out-of-plane wall failures, frame failures and formation of
soft and weak story (Fig.1.1) which affects strength, stiffness and ductility of the
system.
Figure 1.1: (a) Failure of infill walls, (b) frame failure and, (c) formation of a soft
and weak story from L’Aqulia (2009), Bam-Kerman (2003) and Gölcük-Kocaeli
(1999) earthquakes respectively [1, 2, 3]

2
The presence of infill walls alters the lateral-load transfer mechanism by developing
alternative load paths through infills. Studies on reinforced concrete (RC) frames
showed that introduction of masonry infill changes the behaviour of structure from
frame action to truss action that creates higher axial forces and lower bending
moments in the structural members [4] (Fig.1.2) This can be related to so called
equivalent compressive strut actions of infill walls.
Figure 1.2: Change in the lateral-load transfer mechanism due to masonry infills [5].
Uncertain positions of infill walls and openings in them can create irregularities in
plan and elevation. Also, regular structures can become irregular by rearrangement of
infills according to changing functional requirements of the occupants without
considering the structural effects of these changes. Thus, construction of a regular
building as well as sustaining its design during its service life is a difficult issue (Fig.
1.3).

3
Figure 1.3: Different arrangement of infill walls; (a) fully infilled, (b) only upper
stories infilled and, (c) asymmetrically placed infills in structures.
The significance of infill walls has been recognized after the results of broad
scientific research and in the light of these studies, two earthquake resistant design
approaches were suggested. [6]. The first one proposed to isolate infill walls from the
frame in which they are located to neglect their effects. In the second one, infill walls
are taken into account in the design, detailing and construction by proper
introduction of them inside the surrounding frames. Despite the former approach, the
second one allows to predict and determine global and local impacts of these stiff
and brittle components. These approaches have been adopted by a number of
available national codes and design guidelines such as FEMA 306 [7], FEMA 273
[8] and Eurocode 8 [9] which are intended for evaluation and rehabilitation of
earthquake prone and damaged buildings to enclose infill walls but they differ
greatly from a seismic performance viewpoint [4]. Thus, infill walls are treated as
non-structural elements such as partition, finishing and isolation, in practice.
However, they are required to receive more attention for a reliable design.

4
1.2 Significance and Objective of this Research
More study is necessary to understand how the presence and location of the infill
walls affect the behaviour of structural systems. Although, a broad study has been
done on infilled RC framed structures, there is considerably less study on infilled
steel framed structures. Also, in these studies, the effects of infill walls on strength,
stiffness and energy absorption capacity have been studied but symmetry/asymmetry
and plan/vertical discontinuity due to presence or absence of infill walls has not been
investigated comparatively yet.
In addition, it is believed that level of interaction between the infill and its
surrounding frame is affected by the type of material they are made (e.g. concrete
BIMs or clay bricks and RC or steel). Thus, it might not be convenient to assume that
the behaviour of steel frames will be in similar manner as the RC frames [10].
This thesis is aimed to provide more information about structural performance of
masonry infilled steel framed structures by introducing infill walls at different
locations of the frame to include plan and vertical irregularities and
symmetrical/asymmetrical placement of them. For this purpose the experimental test
setup and data of Milad [11] was used to verify the analytical models prepared by
using SeismoStruct programme. Upon completion of the validation of models then
new group of models were created by using SeismoStruct programme to investigate
effects of infill walls to steel frames.

5
1.3 Organization of the Thesis
This thesis is composed of five chapters, also, table of content, list of figures, tables,
symbols, abbreviations and references are provided to fulfil an easy access to
required information.
Chapter 1 presents general information about infill walls, significance and objective
of the study and content of the thesis.
Chapter 2 provides a broad literature review including frame types, seismic methods
of analysis, failure modes of infill walls and frames, soft/weak story formation and
modelling of infill walls.
In Chapter 3, reference experimental study of Milad [11] was mentioned briefly and
then the validation of this study was done by SeismoStruct created models.
In Chapter 4, new groups of models having different infill wall locations and column
orientations are analyzed and their results are given. Finally, the conclusions and
suggestions for future research are provided in Chapter 5.
Appendix A gives load-displacement curves, global and local performance
parameters of validation models.
Appendix B gives the location of plastic hinges for all model groups.
It should be noted that the terms infill wall, infill panel and infills will be used
interchangeably for masonry infill walls throughout this thesis according to
terminology.

6
Chapter 2
LITERATURE REVIEW
2.1 Introduction
Masonry walls with many other kinds of infill walls are commonly used as partition
walls to separate interior spaces or as finishes on the exterior surface of the buildings
for aesthetic purposes [12]. Despite their extensive use, infill walls in both RC and
steel frames are treated as non-structural elements, hence contribution of these
elements on the behaviour of structures are neglected at design phase. Furthermore,
their contribution to the system is ignored in the assessment of the existing buildings
[13]. These two approaches are due to lack of universally accepted scientific
information that provides sufficient specifications on design practices by describing
the extent of infill-frame interaction when loads are present. As a result, surrounding
frames are designed to bear both gravity and lateral loads [14] which yields the need
of decent isolation of infills from the surrounding frame to prevent their large in-
plane stiffness that is incorporated in the lateral load resisting system of the structure.
This approach may lead to uneconomical design practices since daily design
practices proportionate structural components of buildings with respect to
displacement and strength requirements [1]. On the other hand, when infill walls are
designed to participate in the load carrying capacity and tightly placed into
surrounding frame for this purpose without considering their contribution to the
strength and stiffness of the frame system, unsafe designs practices arise [14]. This is
because of the fact that, due to interaction between infill walls and load resisting
7
structural members (e.g. beams, columns) dynamic characteristics (e.g. strength,
stiffness, ductility) of the system changes, either positively or negatively [15].
Infill walls have both advantageous and disadvantageous effects but researchers have
failed to form a common ground on which side it outweighs. Increment in overall
strength and stiffness of the frames are considered as positive effects of infill walls.
On the other hand torsional motion and soft-story/weak-story formation are
considered as negative effects resulting from irregular placement of them in plans
and upright direction respectively.
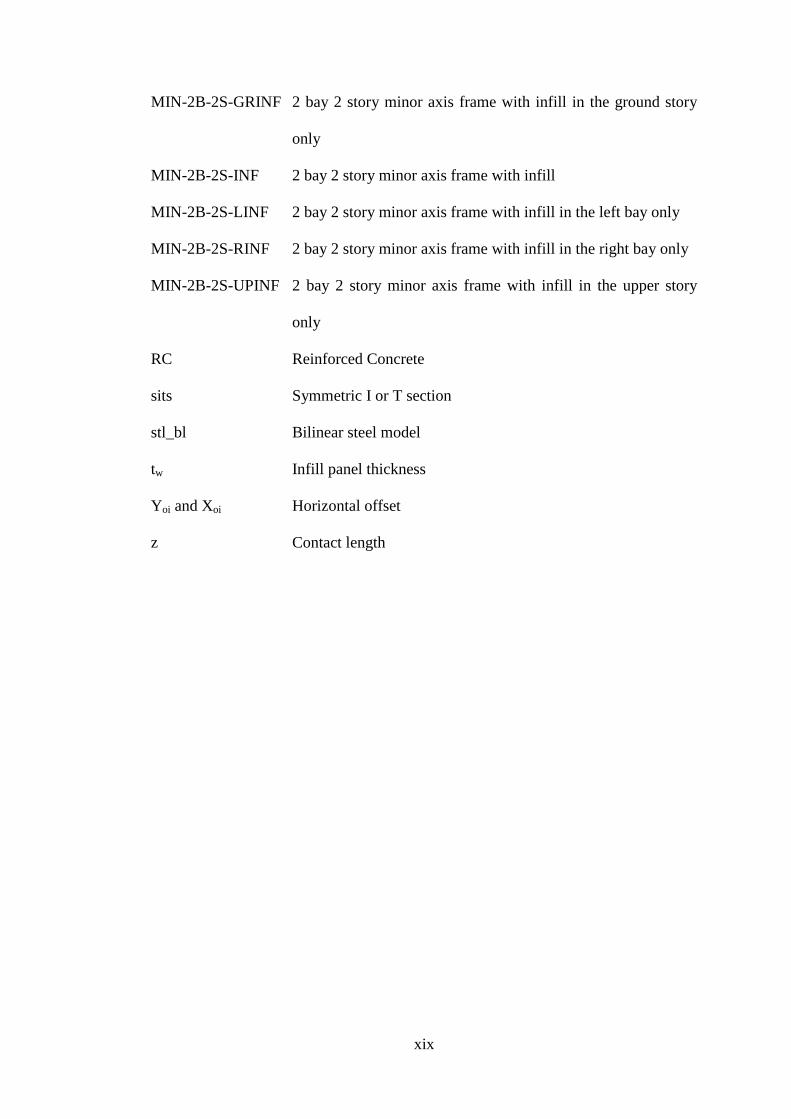
Other changes in the structural behaviour includes, increment of received seismic
forces in structural elements, i.e. columns, due to increased structural stiffness and
increased out-of-plane vulnerability of infill walls due to rising in-plane shear
demands [16]. In addition, interaction between the infill and its surrounding frame
causes formation of plastic hinges at the column ends due to crushed wall on the
corners. This undesirable phenomena is known as short column formation which
jeopardises the designs because strong column-weak beam configuration is aimed by
the codes [15].
Referring to the available analytical and experimental data from past research, failure
modes related with infill and surrounding frames can be categorized as infill failure
(in-plane, out-of-plane infill failure), frame failure (column and beam elements
failure), and soft/weak storey formation [17]. Thus, if infills are neglected during the
design, lateral stability of the frame can be affected at serious levels. Hence, for a
reliable design, it is essential to know the contribution of infills to the stiffness and
strength of the infill-frame system [14,18]. However, due to its composite nature
(composed of mortar, bricks etc.), many uncertainties of infill walls arise which

8
eventually causes them to be considered with their insulating, aesthetic and finishing
aspects rather than their structural contribution to the behaviour of the system.
Nevertheless, there have been a numerous researches investigating the effects of
infills on the structural behaviour of the systems. For this purpose two modelling
techniques are used for infills: micro models and macro models. The first one gives
more detailed information than the latter due to large number of elements considered
in the analysis. Also it provides a better understanding of the local effects despite
macro models. In the macro modelling case, often structural responses of infill walls
are examined by replacing them with equivalent diagonal strut(s) for simplicity [16].
2.2 Frame Types
Structural frames are chosen to resist the particular loads they are expected to be
exposed during their service lives. Two principal categories of lateral load resisting
systems of moment-resisting frames and dual systems are accommodated when
lateral and gravity loads are considered. The main aim of structural engineers is to
provide a system with regular mass and stiffness throughout the structure for
continuous flow of loads to the foundation. However, vertical discontinuities and
irregularities hinder this goal which can be solved by the continuity of stiff structural
elements down to the foundation [19].
2.2.1 Moment-Resisting Frames
The design of moment resisting frames (Fig. 2.1) is based on strong column weak
beam configuration that aims plastic hinges to develop at the beam ends prior to
column ends (Fig. 2.2). In addition, sufficient strength and stiffness should be
provided to resist seismic forces and inter-story drifts respectively while sustaining
beam-column joint rotation [19]. Thus, these frames resist lateral loads by the flexure

9
in beams, columns and joints. Ductility develops by flexural yielding of beams, shear
yielding of column panel zones and flexural and axial yielding of columns.
Figure 2.1: Moment resisting frame [20].
The columns are subjected to zero moment at their mid-heights as well as shear
distribution. Also, inter-storey drifts and shear forces develop proportional to the
moments of inertia of the columns under lateral forces. These frames are sometimes
referred to as shear systems due to latter two actions.
Figure 2.2: Possible plastic hinge locations [20].

10
2.2.2 Dual Systems
These systems consist of braced or infilled moment-resisting frames where the shear
and moment diagrams of the walls and frames are completely affected by the
coupling of the moment resisting frames with braces or shear/infill walls (Fig. 2.3
and 2.4). Hence, the difference in shear between the floors displays small variation
because large displacements are inhibited by the braces or infill walls. The total
design force can be resisted by the use of these two systems together in accordance
with their lateral stiffness values.
Figure 2.3: Diagonally braced frame [21].
Figure 2.4: (a) Chevron braced frame system, (b) moment frame system and, (c) dual
multi-storey frame system.
2.3 Seismic Methods of Analysis
After setting the structural model and performing the structural analysis then it is
possible to determine the seismic forces induced on the structure. The types of
structural model selected, external actions, the behaviour of structure and the

11
structural materials, indicate which analysis method can be used. According to the
nature of the considered variables, methods of analysis can be categorized as shown
in Figure 2.5.
Figure 2.5: Seismic methods of analysis.
The regular structures with limited height can be analyzed by using linear static (or
equivalent static) analysis. The response spectrum method and the elastic time
history method are the two ways in which linear dynamic analysis can be performed.
The level of forces and the distribution of them through the height of the structure
distinguish linear static analysis from linear dynamic analysis.
Non-linear static analysis involves inelastic structural behaviour and can be
considered as improved method over linear static and linear dynamic analysis.
However, the actual response of a structure to seismic forces can only be described
precisely by non-linear dynamic (or inelastic time history) analysis.

12
2.3.1 Elastic/Linear Analysis
This type of analysis is performed by the equivalent lateral force method (static) and
response spectrum or more refined time history method (dynamic) of static and
dynamic analysis respectively. Such analysis methods are used to determine forces
and resulting displacements due to each horizontal component of ground motion for
an idealized building that has one lateral degree of freedom per floor in the
considered direction of ground motion. The preliminary design of the building can be
held by equivalent lateral force procedure and then response spectrum and elastic
time history methods can be applied.
2.3.1.1 Linear Static Analysis
This method considers structure’s fundamental period of vibration and corresponding
modal shape. It is applied by calculating base shear on the structure according to its
mass which is then distributed over the height of the structure. This type of analysis
is appropriate for regular buildings of medium height.
2.3.1.2 Linear Dynamic Analysis
The linear dynamic analysis can be either performed by response spectrum or elastic
time history methods. The former is suitable to use with structures essentially
remaining in their linear range of behaviour when their response is substantially
affected by the modes other than the fundamental one. On the other hand, the latter
overcomes all the deficits in the response spectrum method by involving non-linear
behaviour. The response spectrum method is applied for the elastic analysis of
structures by considering the response of a single degree of freedom oscillator in
each vibration mode independently and later combining them to calculate the total
response. The elastic time history method is applied in a way that mathematical
model of the building is subjected to accelerations obtained from past earthquake

13
records to find expected earthquake at the structure’s base. This method requires
greater computational efforts because the response of a structure is calculated at
discrete times. It is advantageous over the probabilistic response spectrum method
because while combining different modal contributions, actual behaviour of the
structure may be represented incorrectly. Also, the most sophisticated dynamic
analysis methods are represented by the time history analysis techniques.
2.3.2 Inelastic/Non-linear Analysis
In general, linear analysis methods are feasible when the response of structure is
expected to remain almost elastic. However, uncertainties can arise by the
application of linear analysis for non-linearly responding structures because of the
fact that inelastic behaviour is implied when performance objective of structures is
considered. These uncertainties can be minimized by incorporating non-linear
analysis that is performed by non-linear static (pushover) and non-linear dynamic
analysis.
2.3.2.1 Non-linear Static Analysis
It is also known as pushover analysis and despite some deficiencies, reasonable
estimation on the global behaviour and capacity is provided for the structures
essentially responding in the first mode. In this method, gradually increased load
with a definitive pattern is imposed on the structure while yielding of various
components is allowed. Normally, a target displacement (in general the top of the
structure is chosen to be the indicator) is set before the application of the load and
then loading is continued until the target is reached. The method is capable of
providing information on the strength, ductility and deformation of the structure.
Thus, critical members which are prone to reach limit states under earthquake forces
can be identified during the design and detailing processes.

14
2.3.2.2 Non-linear Dynamic Analysis
In this method, integration of differential equations of motion is done by taking into
account elasto-plastic deformation of structure.
It is considered as the most rigorous approach because a detailed structural model is
combined with past earthquake records. However, response of the structural model
can be very sensitive to the characteristics of the individual earthquake under
consideration, thus a reliable estimation on the probabilistic distribution of the
structural response can be achieved by using different earthquake records.
2.4 Failure Modes of Infill Walls and Frames
Evaluation of the infilled structure is a difficult issue due to difficulties relating the
evaluation of the type of infill-frame interaction that significantly affects the load
resisting mechanism and the structural behaviour. An infilled frame behaves as a
monolithic system at low lateral load levels, with increase in load levels infill starts
separating from the surrounding frame forms diagonal compression mechanism.
Infill and infilled frame system failures have been studied to establish a universally
accepted general approach for their consideration through the design phase. For this
purpose, researchers have been investigated out-of-plane failure of infills in addition
to in-plane failure [25]. Also, classical diagonal strut models have been subjected to
modifications with further experimental data. In addition, more sophisticated finite
element models have been developed to obtain reliable results on non-linear
behaviour of infilled frames. Depending on the strength and stiffness of the infills
relative to those of the surrounding frames, a number of different possible failure
modes have been observed in previous studies. Failure modes associated with infill
and frame can be categorized as follows:

15
2.4.1 Infill Wall Failure
2.4.1.1 In-plane Infill Wall Failure
When infills are designed to contribute to the load carrying capacity they are tightly
placed into the surrounding frame. Hence, additional forces will be attracted to the
frame area due to their large in-plane stiffness, and this will eventually, partially or
as a whole influence the behaviour of the frame system [10]. Partial failure includes
in-plane and out-of-plane failure of the infill, failure of the beam and/or column
elements, and soft/weak storey formation, where system failure includes total
collapse of the building. Some of the very common types of in-plane infill failure can
be listed as corner crushing (CC), diagonal compression (DC), diagonal cracking
(DK) and sliding shear (SS) (Fig.2.6).
Figure 2.6: Failure modes of masonry infills: (a) corner crushing mode; (b) diagonal
compression mode; (c) diagonal cracking mode; and (d) sliding shear mode [22].
The following are the detailed information for each failure mode.

16
i. The Corner Crushing
This failure mode is observed with weak infill bounded by strong frame members
having weak infill-frame interface joints. Infill crush occurs at least at the loaded
corner zone.
ii. The Diagonal Compression
This failure mode is observed in the form of panel crushing within its central region.
This type of failure requires an infill subjected to in-plane loading with a high
slenderness ratio to undergo out-of-plane buckling which happens rarely.
iii. The Diagonal Cracking
This failure mode is observed, in the form of a crack passing through two loaded
diagonally opposite corners. It can also take a stepped diagonal shape along the
mortar head and bed joints (Fig. 2.7). Weak frames or frames having weak joints and
strong frame bounding strong infill are proned to this kind of failure mode. It can be
distinguished from other failure modes due to the fact that infill is still capable of
carrying loads after cracks occur.
iv. The Sliding Shear
This failure mode is observed in the form of a horizontally sliding crack through bed
joints of a masonry infill having weak mortar joints i.e. mortar joints having low
coefficient of friction and bond strength. Diagonal cracking and sliding shear failure
modes may take place as a combined mode of failure.
2.4.1.2 Out-of-plane Infill Wall Failure
During earthquakes, infill walls are subjected to combined effects of inertial forces
coming perpendicular to them and high in-plane drift demands along out-of-plane
and in-plane directions respectively (Fig.2.7).

17
Figure 2.7: Forces acting on structures during earthquakes.
In-plane damage of infill walls triggers out-of-plane failures. Similarly, inappropriate
support conditions within the frame create the same problem. High out-of-plane and
in-plane demands due to stiffer infill walls relative to the frames in structures lead to
sudden changes in the lateral stiffness which may form soft/weak storey mechanism
by sudden brittle infill failure. On the other hand, out-of-plane oscillation of infill
walls can positively affect the structure’s fundamental mode of vibration by reducing
the mass contributed within the system [15]. Although, it is expected that larger out-
of-plane loads act on infill walls located at upper stories as a result of higher level of
acceleration, field investigations in the places which were hit by earthquakes showed
that impacts of these loads were more destructive on the lower and middle stories.

18
Figure 2.8: Out-of-plane infill wall failure after the Abruzzo, Italy earthquake [1, 23].
2.4.2 Frame Failure
The reasons behind the frame failure are related to the mechanical, physical and
geometrical properties of infill panels, frame and other structural components. Strong
infills surrounded by strong frame and weak frame with weak joints cause plastic
hinges to form in the columns and the beams near the joints, the beam column
connections or, although occurs very few, at the mid-height of columns[24].

19
Figure 2.9: Failure mechanisms of infilled frames [25].
Failure of steel frame infilled with unreinforced hollow concrete masonry blocks is
rarely observed compared to the case of infilled RC frames [24]. The possible failure
modes of surrounding frame are related with shear failure of columns, beam-column
connections, flexural collapse mechanism and failure due to axial loads.
i. Column Shear Failure (Shear Yielding)
Design of structural systems is carried out in a way that frames undergo flexural
behaviour when seismic forces are present. Although, infill walls provide higher
strength, stiffness and better energy dissipation capacity than that of bare frames,
most of the lateral loads are compensated by shear action of the columns. However,
infills having relatively larger strength and stiffness than the surrounding frame may
cause shear failure of columns due to their local destructive effects.

20
The compression moving downward into the column due to corner crushing of strong
infill causes end-region of the columns to bear large shear. The frame members that
are no confined by masonry may exhibit localized shear deformations and web
buckling for thin webbed steel members. However, shear yielding in steel is ductile
and damage arising from this behaviour mode is not serious compared to RC
structures. In addition, the same problem takes place when contact is only on one
side of the outer columns or infill wall is cut short due to window openings that the
effective length of the column is decreased, thus, it cannot resist inter-story drift
completely, especially in the ground storey [7].
ii. Bolted or Riveted Connection Failure
The beam-to-column connection of infilled steel frame systems usually have bolted
or reverted semi-rigid connections encased in concrete. In the regions of loaded
corners, tangential and normal stresses develop highly which puts the connection
under considerable axial tension. The prying in the connection angles may occur but
ductility of these connections are capable of sustaining many cycles of loading
before a low cycle fatigue failure.
iii. Flexural Failure of Frames
Plastic hinges developing in columns are generally located at the ends of these
members; in the regions that are exposed to maximum bending moments. It is
possible to observe plastic hinges in both columns of a frame at the same time when
sliding shear type of infill failure takes place. In this case, one column member fails
at the end and the other one at mid height. In the region of plastic hinges, inelastic
deformation capacity should be ensured because deformation capacity of plastic
hinges determines the deformation capacity of frames [7].

21
Figure 2.10: Flexural collapse mechanism.
iv. Axial Load Failure
Column compressive failure might occur when frames are subjected to severe axial
loading resulting in buckling of the column. In addition to this, as the lateral forces
increase so do the tensile axial stresses due to buckling. The large flexural buckling
and hence bending of the columns leads to violation of the infill-frame integrity.
Figure 2.11: Axial load failure of the frame member.
2.5 Vertical Discontinuities and Formation of Soft/Weak Storey
The setbacks (e.g. pent houses), changes in storey height, changes over the height of
a structural system (e.g. discontinuous shear/infill walls), changes in materials, and
unforeseen participation of non-structural elements lead to sudden changes in
stiffness and strength between adjacent storeys [26]. Hence, distribution of lateral
forces and deformations under such vertical or horizontal discontinuities can differ

22
from those of regular structure, eventually resulting in inelastic structural
deformations concentrating at or near these discontinuities. As a result, radical
changes should be avoided in the vertical configuration for minimizing stiffness and
strength differences between the adjacent floors. Overall structural failure due to
vertical elements discontinuity of the lateral load-resisting system has been the most
common and notable. The buildings having vertical setbacks (Fig. 2.12(a)) [26], are
exposed to sudden jump of earthquake forces at the level of discontinuity when
forces are transmitted from top to bottom which causes a large vibrational motion to
develop. Hence, a large diaphragm action is demanded in these regions. A decrease
in the number of walls or columns in a particular storey, or remarkably tall storey
(Fig. 2.12(b)) [26] is more likely to cause collapse or damage. The most prevailing
mode of vertical elements discontinuity belongs to those buildings where shear/infill
walls are only present in the upper storeys and discontinued on the lower storeys
resulting in so-called soft storey formation (Fig. 2.12(c)). The reason behind the
collapse under this formation is simply reduced stiffness due to geometrical non-
linear effects of the soft storey.
Figure 2.12: Discontinuation in vertical configuration of buildings [19].

23
2.6 Modelling of Infill Walls
A highly non-linear inelastic behaviour of infilled frames arises from interaction
between the infill panel and the surrounding frame which makes their analytical
modelling a complicated issue in turn. Procedures that are used to analyse infilled
frames fall into two main groups of simplified or macro-models and local or micro-
models namely, according to number of elements considered. In the former group,
infill wall is represented with a few number of elements with the aim of
understanding global physical behaviour where in the second group, large number of
elements are considered to simulate local effects precisely by dividing structure into
numerous parts. Equivalent compression strut(s) and the plane finite element
modelling are the typical examples for abovementioned models respectively.
2.6.1 Micro Models
The first study included finite element method for modelling structures with infills
was conducted by Mallick and Severn in 1967 [26] and since then it has been used
extensively by other researchers. However, this model requires a number of different
elements to be included due to the composite characteristics of the infilled frames
such as: beam or surrounding frame continuum elements, interface and the infill
panel continuum elements for the enclosure of the frame-panel interaction. Local
effects of cracking, crushing and contact interaction as well as the behaviour of
infilled frame can be displayed in more detail by the advantage of the finite element
model. More time and greater computational effort is implied in the preparation of
the input data and the analysis than the simplified macro models. Non-linear
behaviour of infill must be considered by defining constitutive properties of different
elements (i.e. infill and frame-panel interface elements) for reliable results and to
avoid vain great computational effort.

24
2.6.2 Macro Models (Equivalent Diagonal Strut(s) Model)
Polyakov (1960) [27] was the first to conduct analytical studies to investigate effects
of infill panels. For this purpose he loaded masonry infilled frames laterally and
observed diagonal compression failure mode. Then, he suggested that infill elements
of frames could be replaced with single diagonal strut acting in compression
(Fig.2.13). Holmes’ (1961) [28] study followed that idea by proposing a width to the
equivalent diagonal strut as one third of the panel length. This was proceeded with a
more refined approach by Smith (1962) [29] by assigning a more definitive width to
the equivalent diagonal strut. Later on, Mainstone and Weeks (1970) [30] conducted
experimental tests to determine the effective diagonal width. Cyclic behaviour of the
infill panels with dimming stiffness was taken into account by Bertero and Klinger
(1978) [31] and similarly, Hobbs and Saneihejad (1995) [32] used a numerical model
to detect strength and stiffness degradation of the infills. Kwan and Liauw (1984)
[33] developed strut width in relation to other geometrical parameters of the infill
panel. Other studies included investigation of ultimate shear strength, corner
crushing strength and post capping strength respectively [34]. For the understanding
the effects of infill panels on the overall behaviour of the structures, diagonal strut
approach can be accepted as the simplest rational way. However, this approach
assumes that diagonal struts be activated in the presence of compressive forces in the
infill panel.

25
Figure 2.13: Equivalent diagonal strut model for infilled frames.
Also, one equivalent strut aimed for resisting tensile and compressive forces under
dynamic and cyclic loading is insufficient to represent internal forces developed in
the frame members, describe the infill-frame interaction and the resulting local
effects. Hence, shear forces and the bending moments arising in the surrounding
frame members as well as the location of plastic hinges cannot be sufficiently
estimated. As a result, many researchers modified the single diagonal strut method.
First modified approach was proposed to be in the form of two diagonal struts in
each direction having the half equivalent strut area by the Flanagan et al. [35] as a
primitive approach. Then, Schmidt (1989) [36] implemented a double strut model to
include strength and stiffness of the infill as well as the frame-infill interaction.
Syrmakesis and Vratsanou (1986) [37] and later San Bartolomé (1990) [38] used
increased number of parallel struts ranging between five and nine in number,
respectively for each direction. Chrysostomou (1991) [39] used three parallel struts
to understand behavior of the frame. Crisafully (1997) [40], first investigated double
strut model (Fig. 2.14) for its accuracy in dealing with complexity of the multi strut
approaches and later with Carr (2007) [41] adopted a new macro model by
modifying his first approach. In this new model, infill panel was represented with

26
two parallel struts and a shear spring in each direction that were connected to the
frame at the column-beam joints by means of four nodes (Fig.2.15). By doing so
shear forces of the infill panel was included with the compressive forces at the same
time.
Figure 2.14: Crisafulli double strut model (1997).
2.6.3 Crisafulli & Carr Model
Figure 2.15: Modified Crisafulli double strut model by Carr.

27
2.6.3.1 Introduction to Crisafulli Model
The model is first proposed by Crisafulli (1997) [40], and shed light upon the
following studies of the researchers to develop new macro models or improvement
on existing models. Multi-strut models have been proposed to include local effects,
such as, shear forces and the bending moments arising in the surrounding frame
members resulting from the frame panel interaction. Hence, this model has been
found capable of detecting such effects without going through complex analysis.
2.6.3.2 Overview and Implementation of the Model
This model can be accounted for an elaborated version of triple-strut model that
compromises with simplified diagonal strut approach while featuring double strut
model. The use of this model gives comparatively good insight into the effects of
panel-frame interaction at a fair modelling and computational effort [41].
In each direction, tension/compression forces and deformations across the two
opposite diagonal corners are accounted by employing two parallel axial struts.
Resistance of bed joint and sliding are accounted by one shear spring that, when both
directions are considered, makes up four axial struts and two shear springs in total.
The spring is active only in compression region i.e. across the diagonal, thus, panel
deformation type directly empowers its activation.
28
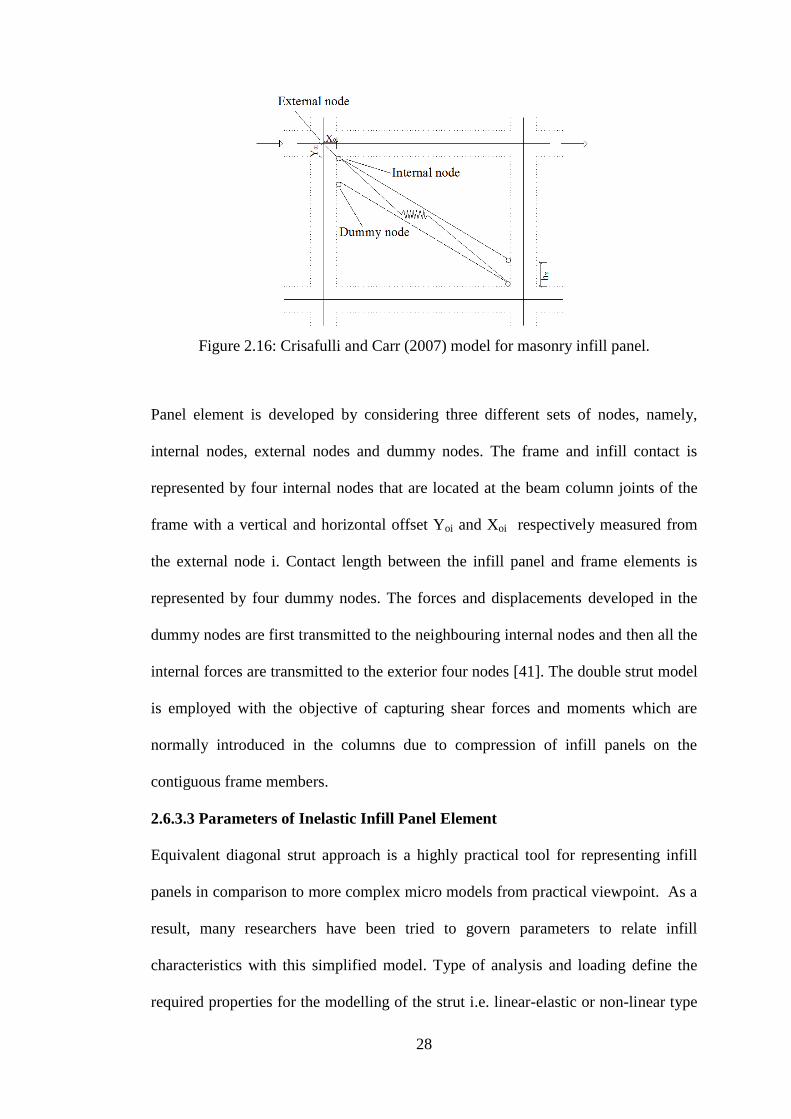
Figure 2.16: Crisafulli and Carr (2007) model for masonry infill panel.
Panel element is developed by considering three different sets of nodes, namely,
internal nodes, external nodes and dummy nodes. The frame and infill contact is
represented by four internal nodes that are located at the beam column joints of the
frame with a vertical and horizontal offset Yoi and Xoi respectively measured from
the external node i. Contact length between the infill panel and frame elements is
represented by four dummy nodes. The forces and displacements developed in the
dummy nodes are first transmitted to the neighbouring internal nodes and then all the
internal forces are transmitted to the exterior four nodes [41]. The double strut model
is employed with the objective of capturing shear forces and moments which are
normally introduced in the columns due to compression of infill panels on the
contiguous frame members.
2.6.3.3 Parameters of Inelastic Infill Panel Element
Equivalent diagonal strut approach is a highly practical tool for representing infill
panels in comparison to more complex micro models from practical viewpoint. As a
result, many researchers have been tried to govern parameters to relate infill
characteristics with this simplified model. Type of analysis and loading define the
required properties for the modelling of the strut i.e. linear-elastic or non-linear type

29
of analysis and cyclic/dynamic or monotonic type of loading. However, complete
material hysteretic behaviour must be defined for dynamic or cyclic loading which
yields complexity of the analysis to arise and increases the uncertainties. In order to
characterise an infill panel element, depending on the scope of the study, some or all
of the following mechanical, geometrical and empirical parameters in Figure 2.17
need to be defined.
A. Strut Curve Parameters B. Shear Cruve Parameters C. Other Parameters
Em µ
fmθ τmax
ft τo
em αs
eult
ecl
e1
e2
γpr
γplu
γun
αre
αch
βa
βch
ex1
ex2
Parameters of Inelastic Infill Panel Element
γs
tw
A1
A2
hz
Yoi & Xoi
Figure 2.17: Mechanical, geometrical and empirical parameters required in
SeismoStruct model.
For the scope of this thesis, parameters at utmost importance are explained in detail
below. In other words, majority of the parameters are explained to let reader
understand the model easily. However, not all the explained parameters were used to
define infill panel elements for this study. Majority of them were left as default
values and in the methodology chapter (section 3.2) default values of these

30
parameters are given in a table. For more detailed information readers can refer to
SeismoStruct user manual and studies of Crisafulli et al. [40, 41, 42].
A. Strut Curve Parameters
i. Elastic Modulus, Em
It is used to describe relationship between stress and strain of linear-elastic solid
materials. Thus, slope of the stress-strain curve in the linear region (i.e. initial slope)
is used to measure it. However, its value displays high variation and many
researchers had proposed a variety of approaches for its calculation. Majority of them
related modulus of elasticity with the material compressive strength [40] which has a
range between 400fmθ < Em < 1000fmθ.
ii. Compressive strength, fmθ
It is used to define infill panel (strut) compressive resistance capacity.
iii. Tensile strength, ft
It represents the masonry tensile strength or the frame infill panel interface bond-
strength. Although it provides generality in the model, due to the fact that it is much
smaller than the compressive strength, fmθ, can be accepted as equal to zero.
iii. Strain at maximum stress, em
It is used to represent the ultimate strain at the maximum strength and has a varying
value between 0.001-0.0005 [40].
iv. Ultimate strain, eult
It is used to represent descending part of the stress-strain curve and often accepted as
equal to 20em.
There are other parameters in addition to aforementioned material mechanics
parameters. Brief information is given about the meanings of these empirical

31
parameters in the following pages. Also, their suggested values are given in the Table
2.1.
Table 2.1: Empirical parameters and their suggested values for SeismoStruct
software programme [41].
γpr
Empirical parameters Suggested values
ecl
e1
e2
0.000 - 0.003
0.003 - 0.0008
0.006 - 0.016
1.100 - 1.500
1.500 - 2.500
0.200 - 0.400
0.100 - 0.700
γplu
γun
αre
αch
0.500 - 0.700
1.500 - 2.000
0.500 - 0.900
1.500 - 3.000
1.000 - 1.500
ex1
ex2
βa
βch
ecl: it defines strain after which cracks partially close allowing compression stresses
to develop.
e1 & e2: it is assumed that axial strain affects the strut area and these two strain
parameters are related to the reduction of the strut area.
γpr or γplr : it defines the modulus of the reloading curve after total unloading.
γplu: it defines the modulus of the hysteretic curve at zero stress after complete
unloading in proportion to Em.
γun: it defines the unloading modulus in proportion to Em
αre: it predicts the strain at which the loop reaches the envelope after unloading.
αch: it predicts the strain at which the reloading curve has an inflexion point,
controlling the loops’ “fatness”.
32
βa: it defines the auxiliary point used to determine the plastic deformation after
complete unloading.
βch: it defines the stress at which the reloading curve exhibits an inflection point.
ex1: it controls the influence of εun in the degradation stiffness.
ex2: it increases the strain at which the envelope curve is reached after unloading and
represents cumulative damage inside repeated cycles, important when there are
repeated consecutive cycles inside same inner loops.
All these empirical parameters are demanded by non-linear dynamic or cyclic
analysis to detect complex behaviour of infill panels for the generation of a sound
model for representing them.
B. Shear Curve Parameters
i. Coefficient of friction, µ
It is used to describe the degree of friction between rigid bodies of infill panel and
the surrounding frame.
King and Pandey [43] proposed values in Table 2.2 after an experimental study. But
these values are considered unreliable due to the fact that friction for brick on
concrete is apparently greater than that of concrete on concrete which is not the real
case.

33
Table 2.2. Coefficient of friction for different materials [43].
Materials
Brick on steel 0.50
Mortar on steel 0.44
Concrete on steel 0.41
Brick on concrete 0.62
Mortar on concrete 0.42
Concrete on concrete 0.44
Coefficient of friction, m
Instead, Atkinson et. Al. [44] proposed 0.7 to be the lower bound estimate of a bed
joint friction coefficient for a variety of mortar types and masonry units.
ii. Maximum shear stress, τmax
It represents the maximum mobilized shear stress in the infill panel and it is
dependent on the development of failure mechanism, such as, diagonal tension,
sliding shear and compression failure. Its value is assumed to be 0.6 MPa, that is, 0.3
MPa coming from friction-induced shear resistant and 0.3 MPa from shear bond
strength. The other two shear curve parameters include shear bond strength, τo, and
reduction shear factor, αs. Their suggested values are given in Table 2.3.
Table 2.3: Suggested values of shear bond strength, τo, and reduction shear factor, αs
[41].
Shear curve parameters Suggested values
Shear bond, to 0.10 - 1.50
Reduction shear factor, as 1.40 - 1.65
Other Parameters
i. Infill panel thickness, tw
Width of the infill panel elements (bricks) alone, can be considered to define this
parameter and preferentially thickness of the plaster can also be included.

34
ii. Strut Area 1, A1
It is found by the product of equivalent strut width, bw, and the infill panel thickness,
tw, where equivalent strut width, bw, is defined by:
bw = dm/3 Eq. (2.1)
and dm is the masonry panel diagonal length (Fig. 2.18).
However, based on the latest experimental results and analytical data, bw varies in the
range of 10-40% of the panel diagonal length, dm [45].
Figure 2.18: Effective width, bw, of the diagonal strut [45].
iii. Strut Area 2, A2
It is defined as percentage of strut area 1, and used to account decreasing contact
length through the interface of the infill and the frame due to lateral and axial
displacements of the infill which consequently affect the equivalent strut area [40].
iv. Equivalent Contact Length, hz
It is defined as percentage of the panel vertical height, which was first introduced by
Stafford Smith [46] as a fraction of the contact length between the infill panel and the

35
frame, z (Fig.2.18). Later this length is demonstrated using the distance between the
dummy and internal nodes by Crisafulli model.
v. Vertical and Horizontal Offsets, Yoi and Xoi
They are defined as percentage of the vertical and horizontal dimensions of the infill
panel and represented by the distance between the internal corner nodes and the
external ones. These parameters are introduced to account for the reduction in the
dimensions of the infill panel due to the depth of the surrounding frame members
because the ends of the diagonal members are normally assumed to coincide with the
intersection of the centre lines of the columns and beams (see Fig. 2.13-16). This
means that the length of the diagonal in the model is longer than that of the masonry
panel.
vi. Proportion of Stiffness Assigned to Shear, γs
It is used to indicate the proportion of stiffness of the infill panel (computed
automatically by the programme) that should be assigned to the shear spring. Its
value is defined between 0.2 and 0.6.

36
Chapter 3
NUMERICAL MODELLING OF INFILL WALLS WITH
SEISMOSTRUCT
3.1 Introductions
The analytical study presented in this thesis aimed to investigate structural behaviour
of steel moment frames with and without infill walls, when subjected to lateral loads
e.g. wind loads or earthquake loads. Once the results of the past experimental study
were validated with SeismoStruct analytical models, then modifications were made
to the steel frame, e.g. number of bays, stories and location of infill walls, to monitor
the possible changes to frame behaviour due to these modifications.
3.2 Past Experimental Study
Experimental test results of Milad [11] were used to validate the analytical models by
using the SeismoStruct software programme. Hence, the steel beam and column
sections used for experimental test were used to create the analytical models and the
same material and geometrical properties were used for the models with and without
infill walls.
The experimental study was conducted using 2D half scale models that were
extracted from a full scale one-story office building having plan dimensions of 4m x
3m. Then eight test frames including moment frames (major-MAJ and minor-MIN
axis) and braced frames (major and minor axis) with and without infill wall were
constructed.

37
Figure 3.1: Experimental Moment and braced frames with and without infill wall
[11].
The design was done according to Eurocode EN 3-1993 requirements. Then the
systems were analysed with software programme ETABS, version 13.2.0. The test
set-up of experimental models is shown in Figure.3.2. It must be noted that the
braced frames are not in the scope of this study, hence, they will not be mentioned in
the following sections. The experimental models considered in this study include
MAJ-1B-1S, MAJ-1B-1S-INF and MIN-1B-1S, MIN-1B-1S-INF (Fig. 3.2). All the
frames were constructed with HEB120 and IPE120 steel sections for column and
beam members respectively, and the frame did not have any restraint in out-of-plane
direction. The column-beam connections were provided with stiffened extended end
plates and via the base plates the columns were connected to stiff steel bearings that
are connected to 1.4 m thick strong floor. The infill walls were constructed with
BIMs block ( hollow concrete block) and cement mortar.

38
Figure 3.2: The experimental test set-up of (a) major and minor axis moment frame
without infill wall (MAJ-1B-1S, MIN-1B-1S) and (b) major and minor axis moment
frame with infill wall (MAJ-1B-1S-INF, MIN-1B-1S-INF) [11].
The section details, material properties and dimensions are shown in Fig. 3.4 and
Tables 3.1 and 3.2 respectively. The mechanical properties of the column and beam
sections were obtained from the coupon tensile tests. The lateral load was applied at
a rate of 5 kN per minute by a hydraulic jack having 1000 kN capacity (Fig. 3.2) on
the column flange or perpendicular to the column web depending on the orientation
(major axis or minor axis) of the column members (Fig. 3.3).
Figure 3.3: Load directions for (a) major and (b) minor axis frames.
The load application point was coinciding with the column web centreline and mid-
depth of the beam. The load and corresponding frame top drifts were measured by

39
linear variable displacement transducers (LVDT) having 50-100 mm capacity that
were placed at locations shown in Figure. 3.2. The load cell and LVDT readings
were recorded at 0.1 seconds interval by using an electronic data acquisition system.
It must be noted that, for this study readings of LVDT 2 (top right) and (for only one
graph) LVDT 3 were considered. The former was used to measure lateral top
displacement and the latter was used to measure beam displacement in the vertical
direction (Fig.3.2). The LVDT 2 readings were represented with Node 2 and Node 3
readings of 1 bay and 2 bay SeismoStruct models respectively (Chapter 4).
Figure 3.4: Colum and beam section dimension details [11].
Table 3.1: Mechanical properties of the steel sections [11].
Steel section Yield stress Ultimate stress
N/mm2 N/mm
2
HEB120 339.70 474.77
IPE120 318.93 480.37
Ultimate Stain
%
26.67
22.33

40
Table 3.2: Dimensions of the steel sections [11].
Width Height Width
tf tw h b tf tw h b
MAJ-1B 10 6.50 123 121 7.00 5.60 120 64
MAJ-1B-INF 10 6.50 122 121 7.00 5.50 120 64
MIN-1B 10 7.00 122 121 6.40 6.50 120 64
MIN-1B-INF 10 6.50 122 121 6.40 6.50 120 64
HEB 120 (mm) IPE120 (mm)
Model No Flange
thickness
Web
thickness
Height Flange
thickness
Web
thickness
3.3 Numerical Modelling of the Experimental Test
The infill panel model of Crisafulli & Carr (section 2.6) is employed in Finite
Elements software SeismoStruct, version 7.0.6., which considers material inelasticity
and geometrical nonlinearities to predict the large deformation behaviour of space
frames under static or dynamic loading. The accuracy of the model was evaluated by
comparison of numerically modelled frames with experimental test results (section
3.1) obtained from non-linear static (pushover) analysis of 2D half-scale frames in
which were all featuring the same material and geometrical properties, as well as
loading conditions. The verification of the test results was first done by the
investigation of the response of frames (in both major and minor axes) with no infill
to ensure that infill panel would be left as the only “verification variable” and
continued with infilled frames. The analytical models were formed in order of
defining analysis type, materials, sections, element classes, nodes, constraints,
restrains, applied load and performance criteria. First, the static pushover analysis
was selected to define incremental load, P, in the following steps, to simulate the
experimental test. Later, material type was selected as bilinear steel model (stl_bl) to
define mechanical properties (strength, modulus of elasticity, strain-hardening etc.)
of the steel sections according to Table 3.1. Then, symmetric I or T section (sits)

41
were selected to define steel sections by modifying programme defined HEB120 and
IPE120 steel profile dimensions with respect to experimental test model dimensions
(Table 3.2).
The material types are used to define sections, similarly, the element classes are
needed for element connectivity module to create the actual elements that form-up
the structural model being built. By using this module, the inelastic force-based
frame element type (infmFB) and inelastic infill panel element were chosen for
structural members (columns and beams) and non-structural components (infill
walls) respectively. This stage was followed by the creation of four structural nodes
(two for the base supports and two for the beam-column connections). These nodes
were used in the previously mentioned element connectivity and loading steps. Top
displacement readings for the validation procedure were obtained from Node 2. The
column members were oriented in the major and minor axis (for MAJ-1B-1S and
MIN-1B-1S respectively) and then beam and infill panel (for MAJ-1B-INF and
MIN-1B-INF) were connected to them by using predefined structural nodes. Frames
were fully restrained at the supports (fixed support) and they were not restrained in
the out-of-plane direction as it was the case with experimental test. The formation of
numerical models was finalized with defining laterally applied incremental load, P,
until performance criteria’s to frame members so that the yielding and failure loads
can be detected. Among all the steps mentioned above the most time demanding step
was the definition of the infill wall due to the fact that it requires a large number of
parameters to be defined. The infill wall parameters are explained in section 2.6.3.3.
However, for the scope of this study the default values were used for most of the
parameters including empirical parameters mainly and only panel thickness, tw, strut

42
area 1, A1, strut area 2, A2, compressive strength fmθ and elastic Modulus, Em were
changed with respect to experimental test values. The default values of unmodified
parameters are given in Table 3.3 with their available suggested values. Panel
thickness, tw, was measured 12 cm without plaster, A1 was calculated 28502.8 mm2
and A2 was 21 % of the A1. Referring to the experimental study of Ahmad et. al. [47]
on masonry walls made of BIMs, compressive strength fmθ was chosen 1.17 MPa
and Em was chosen 1170 MPa by staying in the range of 400fmθ <Em <1000fmθ. In
the same study, strain at maximum stress, em, and the ultimate stain, eult, were found
0.0012 and 0.024 respectively which were the same with programme default values.

43
Table 3.3. Infill wall suggested and programme default values [41].
Suggested
values
Default
values
Unit
ecl 0.000 - 0.003 0.004 -
e1 0.003 - 0.0008 0.001 -
e2 0.006 - 0.016 0.001 -
γpr 1.100 - 1.500 1.500 -
γplu 0.500 - 0.700 1.000 -
γun 1.500 - 2.500 1.500 -
αre 0.200 - 0.400 0.200 -
αch 0.100 - 0.700 0.700 -
βa 1.500 - 2.000 1.500 -
βch 0.500 - 0.900 0.900 -
ex1 1.500 - 3.000 3.000 -
ex2 1.000 - 1.500 1.400 -
ft 0.000 - 0.575 0.000 MPa
µ 0.100 – 1.200 0.700 -
τo 0.100 - 1.500 0.300 MPa
αs 1.400 - 1.650 1.500 -
τmax 0.300 - 0.600 0.600 MPa
hz - 23.000 -
Xoi - 2.400 -
Yoi - 10.000 -
γs - 20.000 -
γ 20.00 20.000 kN/m3
Parameter

44
3.4 Verification of the Experimental Test Results
3.4.1 Major Axis Frame Tests
These frames are formed by placing major axes of the vertical members in the
direction of applied load. The load is applied laterally on the column flange at a level
coinciding with the column web centreline and mid-depth of the beam (Fig. 3.5).
Thus, column members were subjected to bending around their major axes.
Figure 3.5: SeismoStruct models of major axis moment frame without infill, MAJ-
1B-1S and major axis moment frame with infill, MAJ-1B-1S-INF.
3.4.1.1 Moment Frame without Infill Wall, MAJ-1B-1S
During experimental study lateral load was monotonically applied to the moment
frame by using a hydraulic jack having 1000 kN capacity and the corresponding
displacement readings were recorded by LVDT 2. For verification of these
experiments, SeismoStruct software was used to apply similar load defined by the
user. Also the corresponding node displacement was recorded at different load levels
from LVDT 2 representative Node 2. The load and displacements are given in Table
3.4.

45
Table 3.4. Load and corresponding displacement readings of the experimental and
analytical studies of MAJ-1B-1S.
P D P
kN mm kN
0.00 0.00 0.00 0.00 0.000 0.000
1.33 0.45 1.32 0.39 0.992 0.867
5.00 1.32 5.06 1.52 1.012 1.152
10.17 2.64 10.12 3.04 0.995 1.152
16.17 3.70 16.17 4.87 1.000 1.316
20.00 4.75 20.02 6.03 1.001 1.269
26.01 6.48 26.07 7.85 1.002 1.211
30.84 8.06 30.80 9.27 0.999 1.150
35.67 9.47 35.64 10.73 0.999 1.133
40.01 10.97 40.04 12.06 1.001 1.099
45.01 12.60 45.10 13.57 1.002 1.077
50.01 14.18 50.05 15.06 1.001 1.062
55.18 15.88 55.11 16.59 0.999 1.045
60.18 17.32 60.17 18.11 1.000 1.046
65.01 19.07 65.01 19.57 1.000 1.026
70.18 21.12 70.18 21.12 1.000 1.000
75.01 23.28 75.02 22.60 1.000 0.971
80.18 26.11 80.19 24.25 1.000 0.929
85.01 29.07 85.03 26.08 1.000 0.897
90.35 33.13 90.31 28.41 1.000 0.857
95.02 37.08 95.04 31.00 1.000 0.836
100.19 42.81 100.10 40.45 0.999 0.945
105.69 69.30 102.30 58.68 0.968 0.847
104.19 69.61 102.52 66.96 0.984 0.962
102.85 69.65 102.63 67.59 0.998 0.970
µ = 0.958 0.993
s= 0.200 0.245
0.208 0.246
Lateral
Load
Displacement
Ratio of Anlytical/ExpExperimental Study Analytical Study
c.o.v.=
D
mm
Lateral
Load
Lateral
Load
Displacement Displacement
The experimental test specimen MAJ-1B-1S displayed an elastic behaviour up to the
lateral load of approximately 60.18 kN and the corresponding displacement of
LVDT2 was 17.32 mm (Fig. 3.6). On the other hand, analytical model behaviour was
elastic up to a higher lateral load of approximately 70.18 kN and the corresponding

46
lateral displacement was recorded as 21.12 mm at Node 2. Hence, the yielding load
of analytical model was higher than the experimental one and the maximum
displacement achieved at maximum lateral load was 67.59 to 69.65 mm for
experimental and analytical studies respectively. Analytical model behaved more
elastically than the experimental specimen and their behaviour was somewhat varied
in their plastic region.
Figure 3.6: Comparison of the lateral load versus displacement curves of
experimental (EXP) and analytical (ANLY) studies of MAJ-1B-1S.
Loading procedure was continued until failure of the experimental specimen and
analytical model. Experimental specimen reached slightly higher load level than the
analytical one at the failure. Frames of both studies were not restrained in out-of-
plane direction and the deficiencies in the results are attributed to the possible
behavioural differences caused by the lateral torsional buckling of columns and out-
of-plane movement of the beam (Fig. 3.7).
0
20
40
60
80
100
120
0 20 40 60 80
Lat
eral
lo
ad (
kN
)
Lateral displacement (mm)
EXP
ANALY

47
Figure 3.7: Lateral torsional and flexural buckling and out-of-plane displacements of
the experimental specimen (on the left) and the analytical model (on the right) [11].
In reality, when the top beam rotates then it cannot properly transmit the lateral force
in the initially applied direction. Hence this behaviour may cause the two
components of the force (Fig. 3.8 (a)) to be transferred to the column member on
which LVDT2 was placed Consequently, the column exposed to this kind of force
tends to rotate and this is highly likely to alter displacement readings that are
obtained from LVDT. However, the out-of-plane movement of the frame members
were not measured during experimental study. On the other hand, analytical model
experienced (in y-plane) positive 40.97 mm and negative 26.86 mm out-of-plane
movement at the load application (Node 1) and Node 2 locations respectively (Fig.
3.7). In addition, during the experiments the base plate experienced upward bending
due to developed high moments at that point which could not be accounted by the
computer model due to columns being considered totally restrained at the base
(Fig.3.8 (b)).

48
Figure 3.8: (a) Resulting two components of the applied force due to lateral torsional
and flexural of-plane displacement of the frame, (b) base plate deformation (prying
action) of the experimental test [11].
3.4.1.2 Moment Frame with Infill Wall, MAJ-1B-1S-INF
The experimental test specimen was subjected to lateral monotonic loading by using
a hydraulic jack of 1000kN capacity and the displacement readings were recorded by
LVDT 2 at different load levels. Then the same procedure was repeated for the
analytical model and results of both studies are represented in Table 3.5.

49
Table 3.5. Load and corresponding displacement values of the experimental and
analytical studies of MAJ-1B-1S-INF.
P D P
kN mm kN
0.00 0.00 0.00 0.00 0.000 0.000
2.33 0.00 2.31 0.16 0.991 0.000
9.17 0.00 9.24 0.80 1.008 0.000
11.84 0.16 11.76 0.99 0.993 6.188
14.67 1.13 14.71 1.10 1.003 0.973
20.34 1.97 20.37 1.39 1.001 0.706
25.51 2.64 25.41 1.96 0.996 0.742
30.51 3.52 30.45 2.58 0.998 0.733
35.17 4.02 35.07 3.18 0.997 0.791
40.17 4.58 40.11 3.88 0.999 0.847
43.17 4.78 43.05 4.37 0.997 0.914
46.17 5.56 46.20 4.86 1.001 0.874
48.51 6.11 48.51 5.29 1.000 0.866
51.84 6.64 51.87 5.84 1.001 0.880
54.84 7.49 54.81 6.34 0.999 0.846
58.85 8.10 58.80 7.22 0.999 0.891
60.51 13.48 60.55 14.20 1.001 1.053
62.34 13.89 62.39 14.75 1.001 1.062
64.01 14.41 64.01 15.12 1.000 1.049
66.18 14.79 66.18 15.69 1.000 1.061
68.35 15.49 68.35 16.21 1.000 1.046
70.01 16.09 70.01 16.76 1.000 1.042
69.85 16.26 74.29 17.83 1.064 1.097
75.01 17.48 77.52 18.60 1.033 1.064
77.52 18.82 78.84 19.07 1.017 1.013
78.84 19.38 79.80 19.32 1.012 0.997
80.84 19.89 80.84 19.55 1.000 0.983
82.84 20.39 82.86 20.14 1.000 0.988
85.18 20.96 85.14 20.86 1.000 0.995
93.52 28.02 93.54 23.81 1.000 0.850
92.52 28.00 94.78 24.35 1.024 0.870
95.85 28.31 95.81 24.82 1.000 0.877
100.02 29.39 100.27 27.65 1.002 0.941
103.69 31.83 103.68 33.35 1.000 1.048
99.19 32.17 108.02 41.10 1.089 1.278
µ = 0.978 1.016
s= 0.171 0.946
0.175 0.931c.o.v.=
mm
Lateral
Load
Displacement
Ratio of Anlytical/Exp
D
Experimental Study Analytical Study
Lateral
Load
Displacement Lateral
Load
Displacement

50
The experimental test specimen did not show a considerable lateral movement up to
9.86 kN and then behaved elastically up to approximately 57.18 kN with 7.84 mm
displacement (Fig. 3.9).
Figure 3.9: Comparison of the lateral load versus displacement curves of
experimental (EXP LVDT2 and EXP LVDT3) and analytical studies of MAJ-1B-1S-
INF.
The infill failure was initially started with the formation of diagonal cracks and then
at higher loads corner crushing was developed (Fig.3.10 (b)). [11]. The frame was
loaded until it was not capable of resisting higher loads (reaching plastic stage) and
the final load recorded was 103.69 kN at 31.83 mm displacement. The analytical
model exhibited elastic behaviour up to 58.17 kN and the corresponding
displacement was 6.91 mm. The load was applied until the frame failed at 108.02 kN
with 41.10 mm displacement. Despite the experimental study, the type of infill
failure was not possible to be identified for analytical model since SeismoStruct
software models infill walls as equivalent diagonal and shear struts as mentioned in
section 2.6.3. However, yielding loads of column and beam were obtained as 86.23
kN and 94.78 kN respectively. The load-displacement curves of both study displayed
similar pattern with slight differences. In addition to the load displacement curve by
using LVDT2, the displacement curve obtained by using LVDT3 of the experimental
0
20
40
60
80
100
120
0 10 20 30 40 50
Lat
eral
lo
ad (
kN
)
Lateral displacement (mm)
EXP LVDT2EXP LVDT3ANALY

51
study is also included in the graph (Fig. 3.9). Unfortunately it was not possible to
include the same curve from the analytical study since displacement readings at
nodes can only be obtained from analytical models. The curve obtained from LVDT3
was included to show the effect of the upward movement of the beam member on the
load-displacement curve. It is obvious that the load-displacement curve became
parallel to x-axis when LVDT3 readings started increasing at a considerable rate.
Although, it was not possible to obtain upward movement readings from the
analytical study, its load-displacement curve displayed similar behaviour. This
behavioural similarity together with the diagonal failure of the experimental
specimen’s infill wall can be attributed to effectiveness of the equivalent diagonal
strut approach.
Figure 3.10: The experimental specimen MAJ-1B-INF in the structures laboratory (a)
before the test, (b) after the test with diagonal cracks and corner crush [11].

52
3.4.2 Minor Axis Frame Tests
These frames are formed by placing minor axes of the vertical members in the
direction of applied load. The load is applied perpendicular to the column web, at a
level coinciding with the column web centreline and mid-depth of the beam (Fig.
3.11). Thus, column members were subjected to bending around their minor axes.
Figure 3.11: SeismoStruct models of minor axis moment frame without infill, MIN-
1B-1S and minor axis moment frame with infill, MIN-1B-1S-INF.
3.4.2.1 Moment Frame without Infill Wall MIN-1B-1S
During experimental study monotonic lateral load was applied to the moment frame
by using a hydraulic jack having 1000 kN capacity and the corresponding
displacement readings were recorded by LVDT2. In a similar manner, user defined
same load is applied by the SeismoStruct software and corresponding displacement
at Node 2 was recorded at different load levels. The displacement readings for both
studies are shown in Table 3.6.

53
Table 3.6: Load and corresponding displacement values of the experimental and
analytical studies of MIN-1B-1S.
P D P
kN mm kN
0.00 0.00 0.00 0.00 0.000 0.000
1.33 0.94 1.41 0.65 1.060 0.691
4.83 2.17 4.78 2.21 0.990 1.018
6.00 2.91 5.91 2.73 0.985 0.938
9.66 4.43 9.57 4.42 0.991 0.998
12.83 6.10 12.72 5.85 0.991 0.959
15.00 6.87 14.91 6.89 0.994 1.003
18.00 8.31 18.00 8.32 1.000 1.001
20.83 9.74 20.82 9.62 1.000 0.988
22.00 10.15 22.00 10.12 1.000 0.997
25.00 11.48 25.00 11.63 1.000 1.013
27.84 12.87 27.86 12.95 1.001 1.006
30.84 14.21 30.68 14.27 0.995 1.004
32.34 15.25 32.37 15.01 1.001 0.984
34.67 16.56 34.62 16.07 0.999 0.970
38.67 18.39 38.54 17.82 0.997 0.969
40.01 19.21 40.18 18.68 1.004 0.972
42.51 20.85 42.60 19.84 1.002 0.952
45.01 22.04 45.10 21.15 1.002 0.960
47.17 23.73 47.15 22.24 1.000 0.937
50.01 26.52 49.96 24.14 0.999 0.910
52.51 29.49 55.52 28.71 1.057 0.974
55.01 33.25 56.01 30.00 1.018 0.902
57.51 37.83 57.51 32.62 1.000 0.862
60.01 43.90 60.01 41.20 1.000 0.938
62.51 53.23 62.51 57.34 1.000 1.077
65.01 67.77 65.01 82.27 1.000 1.214
66.01 72.29 65.42 86.83 0.991 1.201
67.01 86.83 65.57 88.35 0.979 1.018
67.51 90.09 65.76 90.09 0.974 1.000
66.68 90.39 65.79 90.39 0.987 1.000
µ = 0.968 0.950
s= 0.181 0.197
c.o.v.= 0.186 0.208
D
mm
Experimental Study Analytical Study Ratio of Anlytical/Exp
Lateral
Load
Displacement Lateral
Load
Displacement Lateral
Load
Displacement
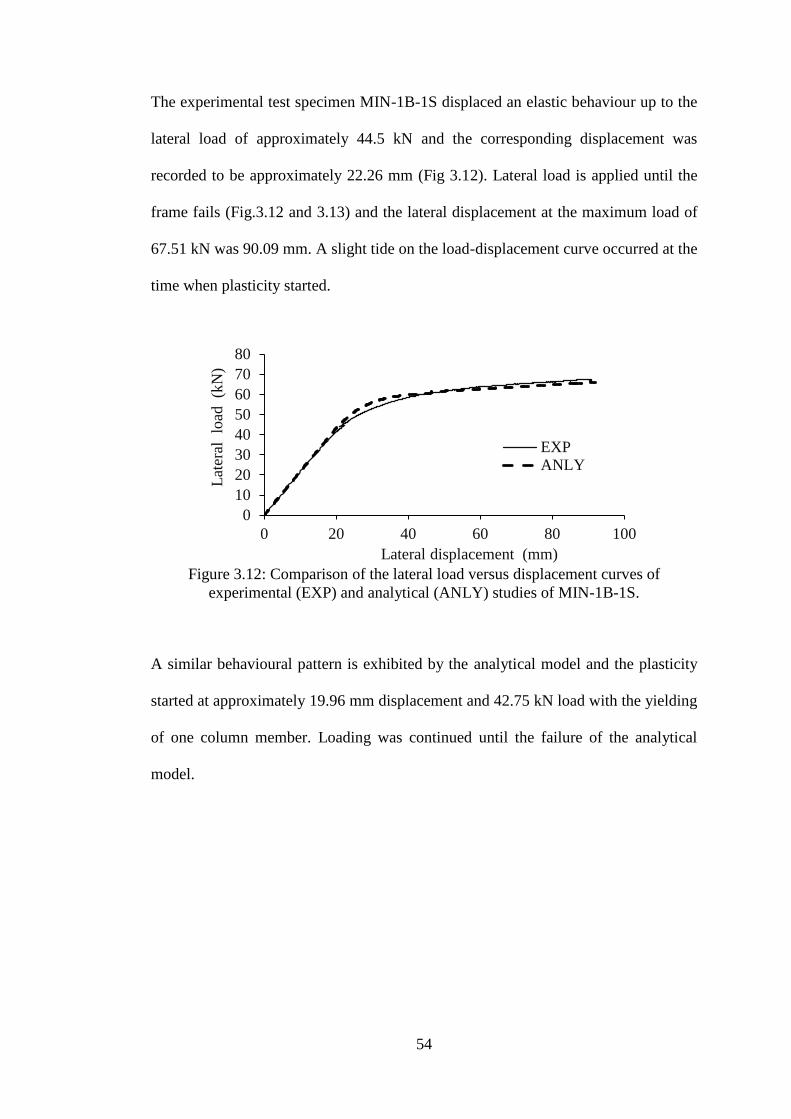
54
The experimental test specimen MIN-1B-1S displaced an elastic behaviour up to the
lateral load of approximately 44.5 kN and the corresponding displacement was
recorded to be approximately 22.26 mm (Fig 3.12). Lateral load is applied until the
frame fails (Fig.3.12 and 3.13) and the lateral displacement at the maximum load of
67.51 kN was 90.09 mm. A slight tide on the load-displacement curve occurred at the
time when plasticity started.
Figure 3.12: Comparison of the lateral load versus displacement curves of
experimental (EXP) and analytical (ANLY) studies of MIN-1B-1S.
A similar behavioural pattern is exhibited by the analytical model and the plasticity
started at approximately 19.96 mm displacement and 42.75 kN load with the yielding
of one column member. Loading was continued until the failure of the analytical
model.
0
10
20
30
40
50
60
70
80
0 20 40 60 80 100
Lat
eral
lo
ad
(kN
)
Lateral displacement (mm)
EXPANLY

55
Figure 3.13: Experimental specimen MIN-1B-1S before and after the test [11].
In general, pattern of the curves are similar to each other and they coincide at low
load levels, i.e. in the elastic region. Also, the plasticity starting load and the
displacement readings were very close to each other. It must be noted that, neither
the experimental specimen nor the analytical model was restrained against out-of-
plane movement and at the end of the experimental test where analytical model
experienced zero out-of-plane displacement even at high load levels. This
behavioural difference might have altered the results of the two studies.
Figure 3.14: MIN-1B-1S at the end of the test; (a) column and column base, (b) beam
end near column connection.

56
3.4.2.2 Moment Frame with Infill Wall, MIN-1B-1S-INF
The experimental test specimen was subjected to lateral monotonic load by using a
hydraulic jack of 1000 kN capacity and the displacement readings were recorded by
LVDT 2 at different load levels. Then the same procedure was repeated for the
analytical model and results of both studies are given in Table 3.7.

57
Table 3.7: Load and corresponding displacement values of the experimental and
analytical studies of MIN-1B-1S-INF.
P D P
kN mm kN
0.00 0.00 0.00 0.00 0.000 0.000
1.60 0.00 1.77 0.14 1.106 0.000
4.93 0.36 4.78 0.41 0.970 1.139
6.23 0.36 6.59 0.57 1.058 1.583
9.81 0.67 9.60 0.86 0.979 1.284
16.43 1.62 15.57 1.44 0.948 0.889
15.00 1.62 16.17 1.50 1.078 0.926
21.00 2.02 21.58 2.04 1.028 1.010
26.67 2.44 26.38 2.54 0.989 1.041
30.34 3.05 30.58 2.99 1.008 0.980
32.67 3.46 32.48 3.19 0.994 0.922
35.51 3.95 34.50 3.45 0.972 0.873
34.84 3.99 35.38 3.90 1.015 0.977
39.34 4.47 38.38 5.15 0.976 1.152
38.34 4.50 39.58 5.42 1.032 1.204
42.51 5.33 42.60 6.41 1.002 1.203
44.51 6.07 44.40 7.12 0.998 1.173
46.34 7.05 46.20 7.88 0.997 1.118
47.01 7.16 46.80 8.14 0.996 1.137
46.51 7.31 47.40 8.41 1.019 1.150
47.34 7.61 47.99 8.68 1.014 1.141
48.68 10.78 48.60 8.96 0.998 0.831
52.34 12.99 52.20 10.72 0.997 0.825
54.01 15.97 54.00 11.70 1.000 0.733
52.01 16.08 59.99 13.86 1.153 0.862
51.01 16.11 67.98 17.25 1.333 1.071
µ = 0.987 0.970
s= 0.215 0.336
0.218 0.346
Ratio of Anlytical/Exp
Lateral
Load
Displacement Lateral
Load
Displacement Lateral
Load
Displacement
c.o.v.=
D
mm
Experimental Study Analytical Study
The experimental test specimen behaved elastically up to approximately 38.34 kN
with 4.5 mm displacement reading on LVDT 2. The first visible crack on infill wall
was noticed at approximately 47.0 kN that was corresponded to lateral 7.16 mm
displacement (Fig 3.15). Later, this crack was grown into a longer diagonal crack

58
with a few short branches throughout its length and another diagonal crack
developed into this initial crack (Fig 3.16). In addition to these two diagonal cracks
corner hairline cracks in the top compression zone started to form with
approximately 45o inclination. The lateral displacement was recorded 15.97 mm at
the maximum lateral load of 54.01 kN and only diagonal cracks were observed on
the infill wall despite the expectation of corner crushing due to preformed corner
hairline cracks. Although, load-displacement curve is inconsistent, there was no
visible frame out of straightness during testing.
Figure 3.15: Comparison of the lateral load versus displacement curves of
experimental (EXP) and analytical (ANALY) studies of MIN-1B-INF.
The analytical model exhibited elastic behaviour up to 34.50 kN and the
corresponding displacement was 3.45 mm. The load continued to be applied until the
frame failed at 67.98 kN with 17.25 mm displacement. Despite the experimental
study, it was not possible to identify type of infill failure because SeismoStruct
software models infill as equivalent diagonal and shear struts similar to the case of
MAJ-1B-INF as explained previously.
0
10
20
30
40
50
60
70
0 5 10 15 20
Lat
eral
lo
ad (
kN
)
Lateral displacement (mm)
LVDT2 EXP
LVDT2 ANLY

59
Figure 3.16: The formation of diagonal and hairline cracks [11].
The load-displacement curves for both studies displayed a similar pattern in general,
despite inconsistency of the experimental curve. However, it was clearer to see linear
elastic and then plastic deformation of the system with the analytical model.
Inconsistency in the experimental test readings might have contributed to the
imperfections of the used material, workmanship and, most importantly, composite
action of the frame-infill wall which could not be considered in the analytical model.
As a result, analytical model failed at a higher lateral load level than that of the
experimental specimen but their corresponding displacements were approximately
equal at these maximum load levels.

60
Chapter 4
INVESTIGATION OF THE ANALYTICAL MODELS
FOR THE EFFECTS OF INFILL WALL
4.1 Introduction
The results of the validation procedure had shown that SeismoStruct software is
highly capable of modelling infilled frames. Hence, new models for the investigation
of the effects of infill wall(s) on the structural behaviour could be formed. For this
purpose six new groups of structural frames were modelled by using the same steel
beam and column sections and mechanical properties of the experimental test frames.
Simply the model frames of experimental program were used by adding more 2D
frames. New models were formed by first, increasing the number of stories to 2 and
the frames of this group are labelled with the notation of 2S. Later the number of
bays was increased to 2 and these models were labelled with 2B.
The new models were formed by following the same approach as in experimental
program. A reference model was formed without infill wall, then it was fully infilled
and later it was symmetrically and regularly/irregularly infilled.
After the modelling had finished all model groups were studied on the bases of
global structural performance parameters of top displacement, base shear,
fundamental time period and out-of-plane displacement and local parameters of
61
inter-story drift ratio and member deformation capacities with applying linear
pushover analysis.
The results of six new model groups are presented in the following sections. The
validation models were also considered as two groups in the conclusion chapter for
the comparison of all analytical models. However, in the previous chapter,
parameters included in the validation models covered only top displacement,
maximum lateral load and out-of-plane displacements. Hence, the load-displacement
curves, base shear, fundamental time period, inter-story drift ratio and member
deformation capacities for these models are given in Appendix A.
4.2 Major Axis Frame Models
The major axes of vertical members (column flanges) placed 90 degrees to the
direction of applied load were modelled to investigate effects of infill wall(s) on the
structural performance. For this purpose three different groups of models were
created and infill wall was placed into the frames at different locations. These new
models were grouped according to their number of bays and stories. Addition to 1
bay 1 story (1B-1S) (Fig. 3.4.) validation models, 1 bay 2 story (1B-2S) (Fig.4.1), 2
bay 1 story (2B-1S) (Fig.4.5.) and 2 bay 2 story (2B-2S) (Fig.4.9.) models were
formed. After the modelling had finished all the members were studied on the bases
of global structural performance parameters and local parameters.
4.2.1 One Bay Two Story (1B-2S) Frame Models
These models were created by using the validation model MAJ-1B-1S and increasing
the number of story from one to two. After the modelling had finished all the
members were studied on the bases of global structural performance parameters and
local parameters. Node 1 and 2 represent locations of the top column to beam

62
connections, column 1, C1, column 2, C2, column 3, C3 and column 4, C4 are the
column members and beam 1, B1 and beam 2, B2 are the two beams of the system
(Fig. 4.1).
Figure 4.1: Details of major axis 1 bay 2 story (1B-2S) models with SeismoStruct
illustrations.

63
Figure 4.2 shows the lateral load-displacement curves for all the major axis 1B-2S
models. The curve for the MAJ 1B-2S model exhibited a non-linear behaviour. On
the other hand all the other models followed similar behavioural pattern where the
curve has a linear portion up to a certain load level then, there is a sudden increase in
displacement while the load is constant. Then gradually the curve becomes non-
linear with increase in both load and displacement. Finally, for some of the curves
the rate of increase of load is considerably less than displacement and hence a fairly
flat plateau is formed until failure.
Figure 4.2: Load-displacement curves for major axis 1 bay 2 story (1B-2S) frame
models.
The maximum top displacement hence drift ratio, was observed with MAJ-1B-2S but
the variation of displacement values among all models were not so high. The
maximum base shear and time period was exhibited by the heaviest model in weight,
MAJ-1B-2S-INF (Fig.4.3). All the models had zero out-of-plane displacements at
nodes 1 and 2 (Fig. 4.4).
0
10
20
30
40
50
60
70
0 20 40 60 80 100
Lat
eral
lo
ad (k
N)
Lateral displacement (mm)
MAJ-1B-2S
MAJ-1B-2S-INF
MAJ-1B-2S-UPINF
MAJ-1B-2S-GRINF

64
Figure 4.3: Global structural parameters of major axis 1 bay 2 story (1B-2S) models,
(a) top displacement, (b) base shear, (c) time period and (d) drift ratio.
Locations of plastic hinges were the same in all models (see appendix, Fig. B.2) but
demands on frame members were depended on the location of infill wall in general.
However, both of the ground story columns were failed only in one model, MAJ-2B-
2S-UPINF, which was indicating the formation of soft story resulting from vertical
irregularities. Failure and yield loads of frame members are given in Table 4.1. Note
that members which did not yield or failed leaved empty in Table. 4.1. and in
member capacity tables of all other model groups in the following sections.
Figure 4.4: Plan view of major axis 1 bay 2 story (1B-2S) models illustrating zero
out-of-plane displacement at nodes 1 and 2.
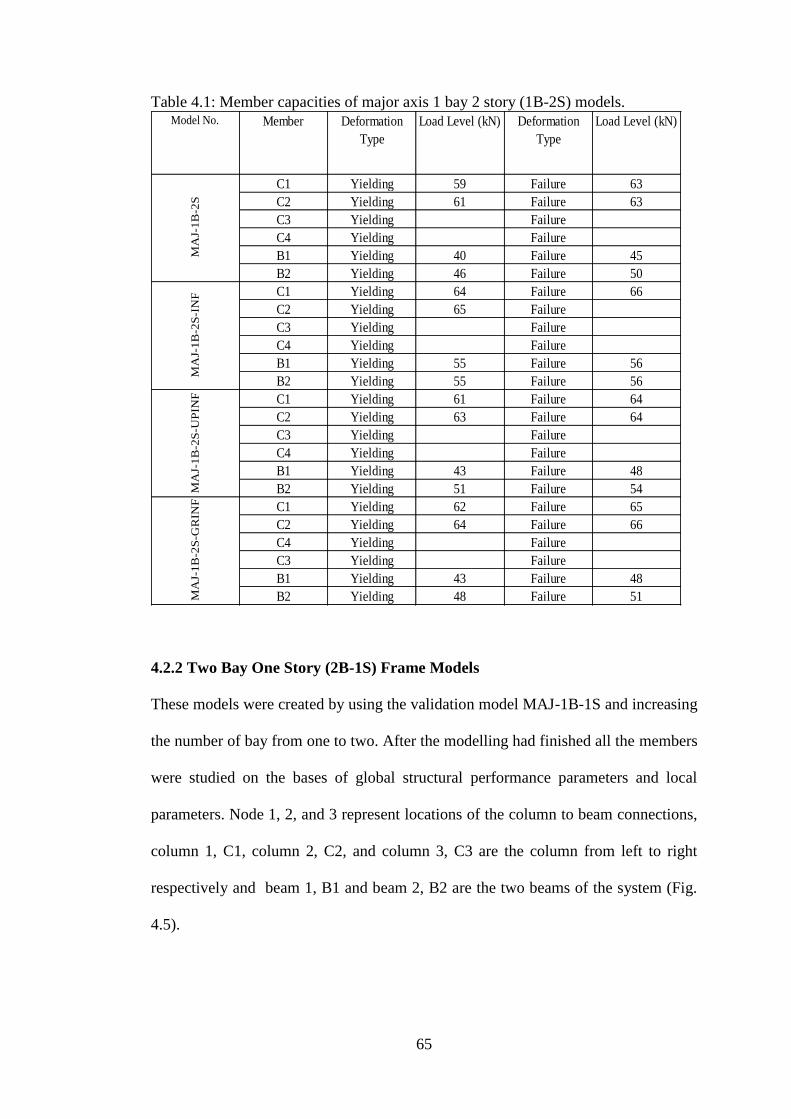
65
Table 4.1: Member capacities of major axis 1 bay 2 story (1B-2S) models.Model No. Member Deformation
Type
Load Level (kN) Deformation
Type
Load Level (kN)
C1 Yielding 59 Failure 63
C2 Yielding 61 Failure 63
C3 Yielding Failure
C4 Yielding Failure
B1 Yielding 40 Failure 45
B2 Yielding 46 Failure 50
C1 Yielding 64 Failure 66
C2 Yielding 65 Failure
C3 Yielding Failure
C4 Yielding Failure
B1 Yielding 55 Failure 56
B2 Yielding 55 Failure 56
C1 Yielding 61 Failure 64
C2 Yielding 63 Failure 64
C3 Yielding Failure
C4 Yielding Failure
B1 Yielding 43 Failure 48
B2 Yielding 51 Failure 54
C1 Yielding 62 Failure 65
C2 Yielding 64 Failure 66
C4 Yielding Failure
C3 Yielding Failure
B1 Yielding 43 Failure 48
B2 Yielding 48 Failure 51
MA
J-1B
-2S
MA
J-1B
-2S
-GR
INF
MA
J-1B
-2S
-IN
FM
AJ-
1B
-2S
-UP
INF
4.2.2 Two Bay One Story (2B-1S) Frame Models
These models were created by using the validation model MAJ-1B-1S and increasing
the number of bay from one to two. After the modelling had finished all the members
were studied on the bases of global structural performance parameters and local
parameters. Node 1, 2, and 3 represent locations of the column to beam connections,
column 1, C1, column 2, C2, and column 3, C3 are the column from left to right
respectively and beam 1, B1 and beam 2, B2 are the two beams of the system (Fig.
4.5).

66
Figure 4.5: Details of major axis 2 bay 1 story (2B-1S) models with SeismoStruct
illustrations.
Figure 4.6 shows the lateral load-displacement curves for all the major axis 2B-1S
models. The curve for the MAJ-2B-1S model exhibited a non-linear behaviour. On
the other hand all the other models followed similar behavioural pattern where the
curve has a linear portion up to a certain load level, then there is a sudden increase in
displacement while the load is constant. Then gradually the curve becomes non-
linear with increase in both load and displacement. Finally, for all the curves the rate
of increase of load is considerably less than displacement and hence a fairly flat
plateau is formed until failure.

67
Figure 4.6: Load-displacement curves for major axis 2 bay 1 story (2B-1S) frame
models.
The maximum top displacement was observed with MAJ-2B-1S-LINF with 72.83
mm and MAJ-2B-1S, MAJ-2B-1S-INF and MAJ-2B-1S-RINF had 26.26 mm, 25.25
mm and 22.15 mm respectively (Fig. 4.6 and 4.7 (a)). Also the maximum load and
the maximum out-of-plane displacements at nodes 1, 2 and 3 were achieved by MAJ-
2B-1S-LINF. This can be the reason behind extensive lateral displacement of MAJ-
2B-1S-LINF when compared to the other three models. Out-of-plane displacement
values of other models are shown in Figure 4.8 and given in Table 4.3.
020406080
100120140160180200
0 20 40 60 80
Lat
eral
lo
ad (
kN
)
Lateral displacement (mm)
MAJ-2B-1SMAJ-2B-1S-INFMAJ-2B-1S-LINFMAJ-2B-1S-RINF

68
Figure 4.7: Global structural parameters of major axis 2 bay 1 story (2B-1S) models,
(a) top displacement, (b) base shear, (c) time period and (d) drift ratio.
The heaviest model in weight, MAJ-2B-1S-INF, had the highest fundamental time
period that was followed by MAJ-2B-1S-LINF, MAJ-2B-1S-RINF and MAJ-2B-1S.
The time period was the same for MAJ-2B-1S-LINF and MAJ-2B-1S-RINF.
Figure 4.8: Plan view of major axis 2 bay 1 story (2B-1S) models illustrating out-of-
plane displacements at node 1-3, without showing infills in frames.

69
When drift ratios are considered MAJ-2B-1S-RINF is observed to be the stiffest
model and MAJ-2B-1S-LINF is observed to be the most flexible model among the
other three models. Although, these two models were generated by changing the
position of the infill wall only, it clearly shows how the presence of infill wall and its
location in this system affects the flexural and lateral torsional buckling behaviour.of
beams and hence non-uniform torsion of columns. All models experienced column
failure at the base near supports and beam failures near the connections (see
appendix B, Fig. B.4). Failure and yield loads of frame members are given in Table
4.2.
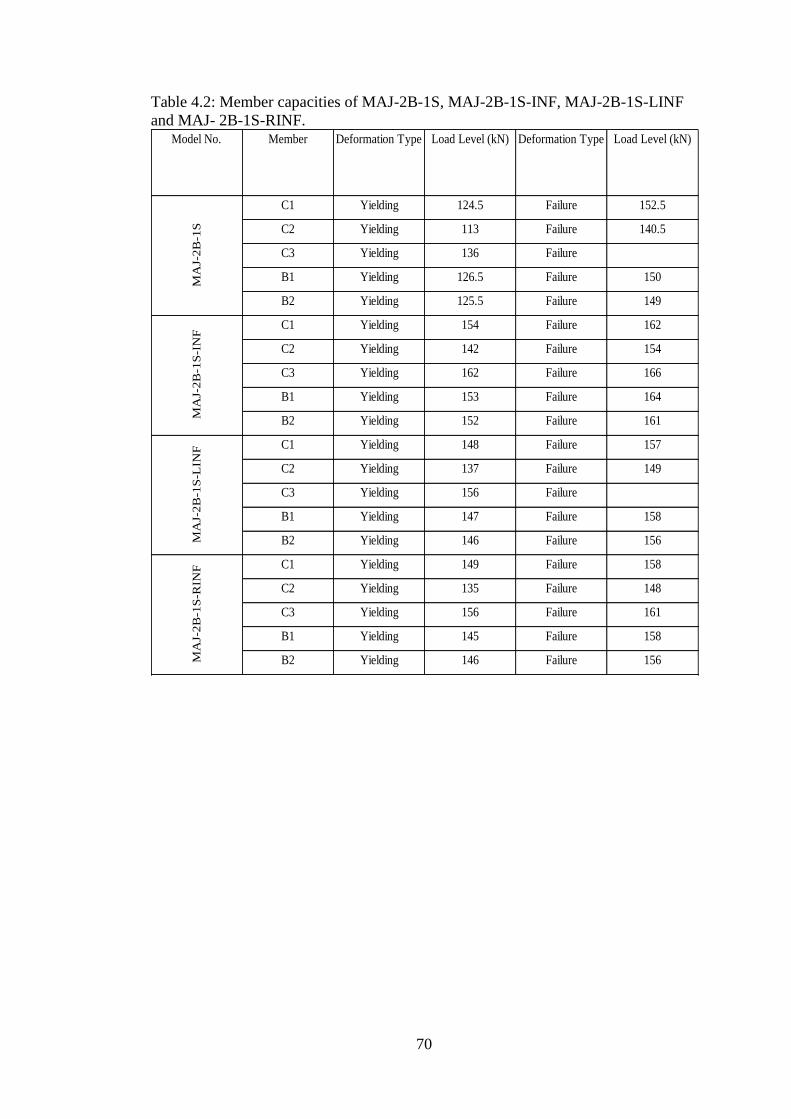
70
Table 4.2: Member capacities of MAJ-2B-1S, MAJ-2B-1S-INF, MAJ-2B-1S-LINF
and MAJ- 2B-1S-RINF. Model No. Member Deformation Type Load Level (kN) Deformation Type Load Level (kN)
C1 Yielding 124.5 Failure 152.5
C2 Yielding 113 Failure 140.5
C3 Yielding 136 Failure
B1 Yielding 126.5 Failure 150
B2 Yielding 125.5 Failure 149
C1 Yielding 154 Failure 162
C2 Yielding 142 Failure 154
C3 Yielding 162 Failure 166
B1 Yielding 153 Failure 164
B2 Yielding 152 Failure 161
C1 Yielding 148 Failure 157
C2 Yielding 137 Failure 149
C3 Yielding 156 Failure
B1 Yielding 147 Failure 158
B2 Yielding 146 Failure 156
C1 Yielding 149 Failure 158
C2 Yielding 135 Failure 148
C3 Yielding 156 Failure 161
B1 Yielding 145 Failure 158
B2 Yielding 146 Failure 156
MA
J-2B
-1S
MA
J-2B
-1S
-IN
FM
AJ-
2B
-1S
-LIN
FM
AJ-
2B
-1S
-RIN
F

71
Table 4.3: Out-of-plane displacement values of major axis 2 bay 1 story (2B-1S)
models.
Model No. Node No. Out of plane disp. at failure
(mm)
1 0.89
2 0.49
3 -1.14
1 -9.39
2 10.58
3 -2.77
1 51.26
2 29.44
3 -54.9
1 -3.71
2 4.26
3 -1.42
MAJ-2B-1S
MAJ-2B-1S-RINF
MAJ-2B-1S-LINF
MAJ-2B-1S-INF
4.2.3 Two Bay Two Story (2B-2S) Frame Models
These models were created in order of a 2 bay 2 story moment frames without infill
wall, MAJ-2B-2S as a reference model and then followed by MAJ-2B-2S-INF, MAJ-
2B-2S-LINF, MAJ-2B-2S-RINF, MAJ-2B-2S-UPINF, MAJ-2B-2S-GRINF, MAJ-
2B-2S-ASYM1 and MAJ-2B-2S-ASYM2. After the modelling had finished, all the
members were studied on the bases of global structural performance parameters and
local parameters. Node 1, 2, and 3 represent locations of the top column to top beam
connections, column 1, C1, column 2, C2, column 3, C3, column 4, C4, column 5,
C5 and column 6, C6 are the column members and beam 1, B1, beam 2, B2, beam
3, B3 and beam 4, B4 are the beams of the system (Fig. 4.9).

72
Figure 4.9: Details of major axis 2 bay 2 story (2B-2S) models with SeismoStruct
illustrations.

73
Figure 4.10 shows the lateral load-displacement curves for all the major axis 2B-2S
models. The curve for the MAJ-2B-2S model exhibited a non-linear behaviour. On
the other hand all the other models followed similar behavioural pattern where the
curve has a linear portion up to a certain load level then, there is a sudden increase in
displacement while the load is constant. Then gradually the curve becomes non-
linear with increase in both load and displacement. Finally, for some of the curves
the rate of increase for load is considerably less than displacement and hence a fairly
flat plateau is formed.
Figure 4.10: Load-displacement curves for all major axis 2 bay 2 story (2B-2S)
frame models.
The maximum base shear and top displacement (drift ratio) was observed with MAJ-
2B-2S-UPINF and this model exhibited higher value of out-of-plane displacements
at nodes 1, 2 and 3 than all other major two bay two story models (Fig.4.11 and
Table 4.6). Out-of-plane displacement values of all other models are shown in Figure
4.12 and given in Table 4.6.
0
20
40
60
80
100
120
0 20 40 60 80 100 120 140
Lat
eral
lo
ad
(kN
)
Lateral displacement (mm)
MAJ-2B-2SMAJ-2B-2S-INFMAJ-2B-2S-LINFMAJ-2B-2S-RINFMAJ-2B-2S-UPINFMAJ-2B-2S-GRINFMAJ-2B-2S-ASYM1MAJ-2B-2S-ASYM2
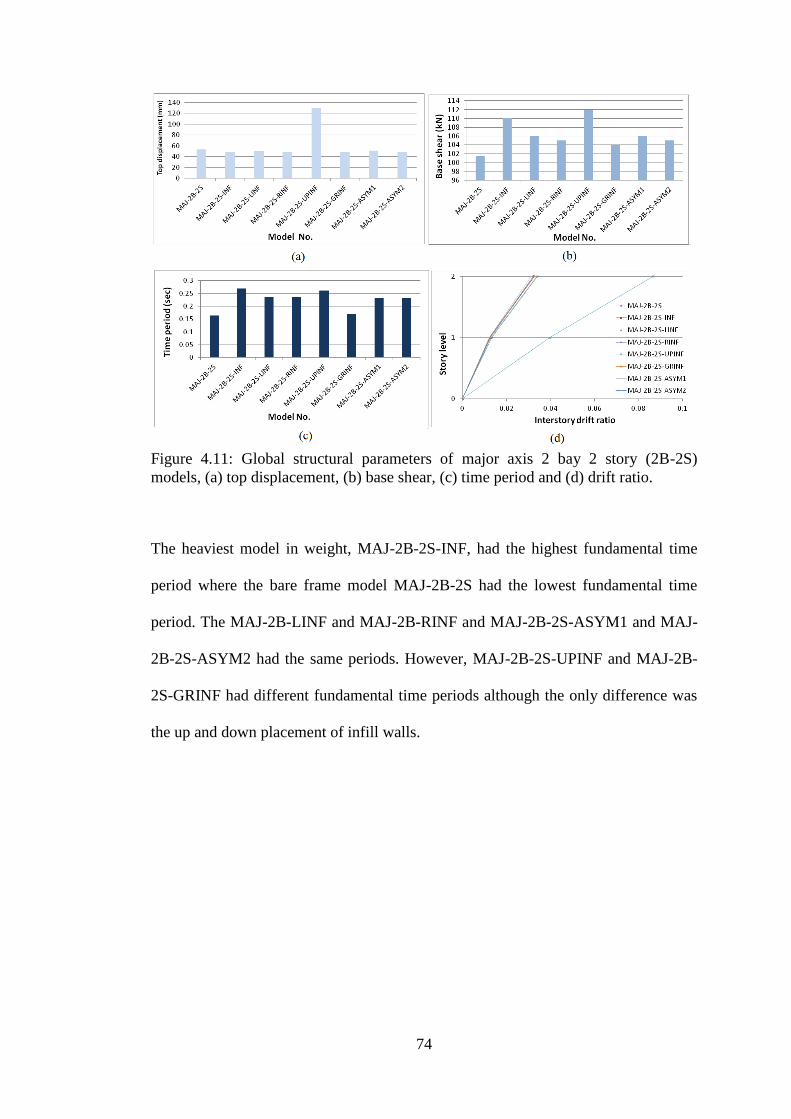
74
Figure 4.11: Global structural parameters of major axis 2 bay 2 story (2B-2S)
models, (a) top displacement, (b) base shear, (c) time period and (d) drift ratio.
The heaviest model in weight, MAJ-2B-2S-INF, had the highest fundamental time
period where the bare frame model MAJ-2B-2S had the lowest fundamental time
period. The MAJ-2B-LINF and MAJ-2B-RINF and MAJ-2B-2S-ASYM1 and MAJ-
2B-2S-ASYM2 had the same periods. However, MAJ-2B-2S-UPINF and MAJ-2B-
2S-GRINF had different fundamental time periods although the only difference was
the up and down placement of infill walls.

75
Figure 4.12: Plan view of major axis 2 bay 2 story (2B-2S) models illustrating out-
of-plane displacements at nodes 1-3, without showing infills in frames.
Location of plastic hinges (see appendix B, Fig. B.5) and demands on frame
members were depended on the location of infill wall in general. However, it was
clearly observed that the ground story columns were all failed in only one model
(MAJ-2B-2S-UPINF) which was indicating the formation of soft story caused by
vertical irregularities. Failure and yield loads of frame members are given in Table
4.4. and Table 4.5.

76
Table 4.4: Member capacities of major axis 2 bay 2 story (2B-2S) models.
Model No. Member Deformation
Type
Load Level (kN) Deformation
Type
Load Level (kN)
C1 Yielding 96 Failure
C2 Yielding 94 Failure
C3 Yielding Failure
C4 Yielding Failure
C5 Yielding 100 Failure
C6 Yielding Failure
B1 Yielding 60 Failure 78
B2 Yielding 62 Failure 80
B3 Yielding 82 Failure 94
B4 Yielding 78 Failure 92
C1 Yielding 110 Failure
C2 Yielding 110 Failure
C3 Yielding Failure
C4 Yielding Failure
C5 Yielding Failure
C6 Yielding Failure
B1 Yielding 96 Failure
B2 Yielding 96 Failure
B3 Yielding 100 Failure 105
B4 Yielding 104 Failure
C1 Yielding 105 Failure
C2 Yielding 105 Failure 106
C3 Yielding Failure
C4 Yielding Failure
C5 Yielding Failure
C6 Yielding Failure
B1 Yielding 77 Failure 86
B2 Yielding 78 Failure 87
B3 Yielding 94 Failure 99
B4 Yielding 93 Failure 98
C1 Yielding 105 Failure
C2 Yielding 104 Failure
C3 Yielding Failure
C4 Yielding Failure
C5 Yielding Failure
C6 Yielding Failure
B1 Yielding 77 Failure 86
B2 Yielding 78 Failure 87
B3 Yielding 93 Failure 99
B4 Yielding 93 Failure 98
MA
J-2
B-2
SM
AJ-2
B-2
S-I
NF
MA
J-2
B-2
S-L
INF
MA
J-2
B-2
S-R
INF

77
Table 4.5: Member capacities of major axis 2 bay 2 story (2B-2S) models
(continued).
Model No. Member Deformation
Type
Load Level (kN) Deformation
Type
Load Level (kN)
C1 Yielding 107 Failure 111
C2 Yielding 105 Failure 110
C3 Yielding 110 Failure 112
C4 Yielding Failure
C5 Yielding Failure
C6 Yielding Failure
B1 Yielding 76 Failure 86
B2 Yielding 78 Failure 87
B3 Yielding 97 Failure 102
B4 Yielding 95 Failure 101
C1 Yielding 104 Failure
C2 Yielding 103 Failure
C3 Yielding Failure
C4 Yielding Failure
C5 Yielding Failure
C6 Yielding Failure
B1 Yielding 77 Failure 86
B2 Yielding 78 Failure 87
B3 Yielding 90 Failure 96
B4 Yielding 90 Failure 96
C1 Yielding Failure
C2 Yielding 102.9 Failure 105
C3 Yielding Failure
C4 Yielding Failure
C5 Yielding Failure
C6 Yielding Failure
B1 Yielding 90.1 Failure
B2 Yielding 90.1 Failure 92.24
B3 Yielding 101.6 Failure
B4 Yielding 97 Failure 101
C1 Yielding 105 Failure
C2 Yielding 104 Failure
C3 Yielding Failure
C4 Yielding Failure
C5 Yielding Failure
C6 Yielding Failure
B1 Yielding 77 Failure 86
B2 Yielding 78 Failure 86
B3 Yielding 93 Failure 100
B4 Yielding 93 Failure 98
MA
J-2B
-AS
YM
1M
AJ-
2B
-2S
-AS
YM
2M
AJ-
2B
-2S
-UP
INF
MA
J-2B
-2S
-GR
INF

78
Table 4.6: Out-of-plane displacement values of major axis 2 bay 2 story (2B-2S)
models.
Model No. Node Out-of-plane disp. (mm)
1 -4.80
2 4.39
3 0.20
1 6.30
2 -6.03
3 -0.10
1 -10.26
2 10.89
3 -0.10
1 12.19
2 -11.66
3 -0.45
1 -126.58
2 -80.45
3 123.71
1 -12.54
2 12.33
3 -0.12
1 -13.13
2 14.04
3 1.05
1 8.63
2 -4.24
3 -0.024
MAJ-2B-2S-ASYM2
MAJ-2B-2S-ASYM1
MAJ-2B-2S-GRINF
MAJ-2B-2S-UPINF
MAJ-2B-2S-RINF
MAJ-2B-2S-LINF
MAJ-2B-2S-INF
MAJ-2B-2S
4.3 Minor Axis Frame Models
The minor axes of vertical members (column webs) are placed 90 degrees to the
direction of applied load were modelled to investigate effects of infill wall(s) on the
structural performance. For this purpose three different groups of models were
created and infill wall was placed into the frames at different orientations. These new
models were grouped with respect to their number of bays and stories. Addition to 1
bay 1 story (1B-1S) (Fig.3.10) validation models, 1 bay 2 story (1B-2S) (Fig.4.13), 2
bay 1 story (2B-1S) (Fig.4.17) and 2 bay 2 story (2B-2S) (Fig.4.21) models were

79
formed. After the modelling had finished all the members were studied on the bases
of global structural performance parameters and local parameters.
4.3.1 One Bay Two Story (1B-2S) Frame Models
These models were created by using the validation model MIN-1B-1S and increasing
the number story from one to two. After the modelling had finished all the members
were studied on the bases of global structural performance parameters and local
parameters. Node 1 and 2 represent locations of the top column to beam connections,
column 1, C1, column 2, C2, column 3, C3 and column 4, C4 are the column
members and beam 1, B1 and beam 2, B2 are the two beams of the systems (Fig.
4.13)
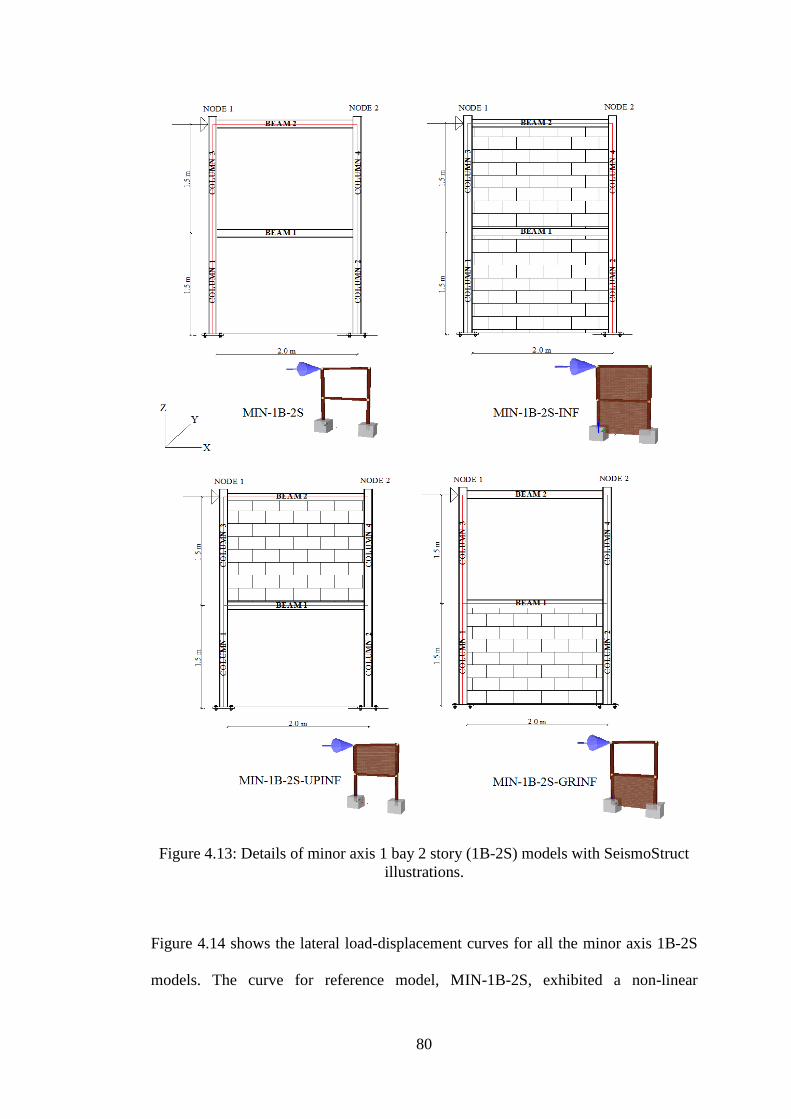
80
Figure 4.13: Details of minor axis 1 bay 2 story (1B-2S) models with SeismoStruct
illustrations.
Figure 4.14 shows the lateral load-displacement curves for all the minor axis 1B-2S
models. The curve for reference model, MIN-1B-2S, exhibited a non-linear

81
behaviour. On the other hand all the other models followed similar behavioural
pattern where the curve has a linear portion up to a certain load level then there is a
sudden increase in displacement while the load is constant. Then gradually the curve
becomes non-linear with increase in both load and displacement until the failure
load.
Figure 4.14: Load-displacement curves for minor axis 1 bay 2 story (1B-2S) frame
models.
The maximum top displacement and drift ratio were observed with MIN-1B-2S but
the variation of displacement values among all models was not so high. The
maximum base shear and time period was exhibited by the heaviest model in weight,
MAJ-1B-2S-INF (Fig.4.15). All the models exhibited zero out-of-plane
displacements at nodes 1 and 2 (Fig. 4.16).
0
10
20
30
40
50
60
0 20 40 60 80
Lat
eral
lo
ad (k
N)
Lateral displacement (mm)
MIN-1B-2S
MIN-1B-2S-INF
MIN-1B-2S-UPINF
MIN-1B-2S-GRINF
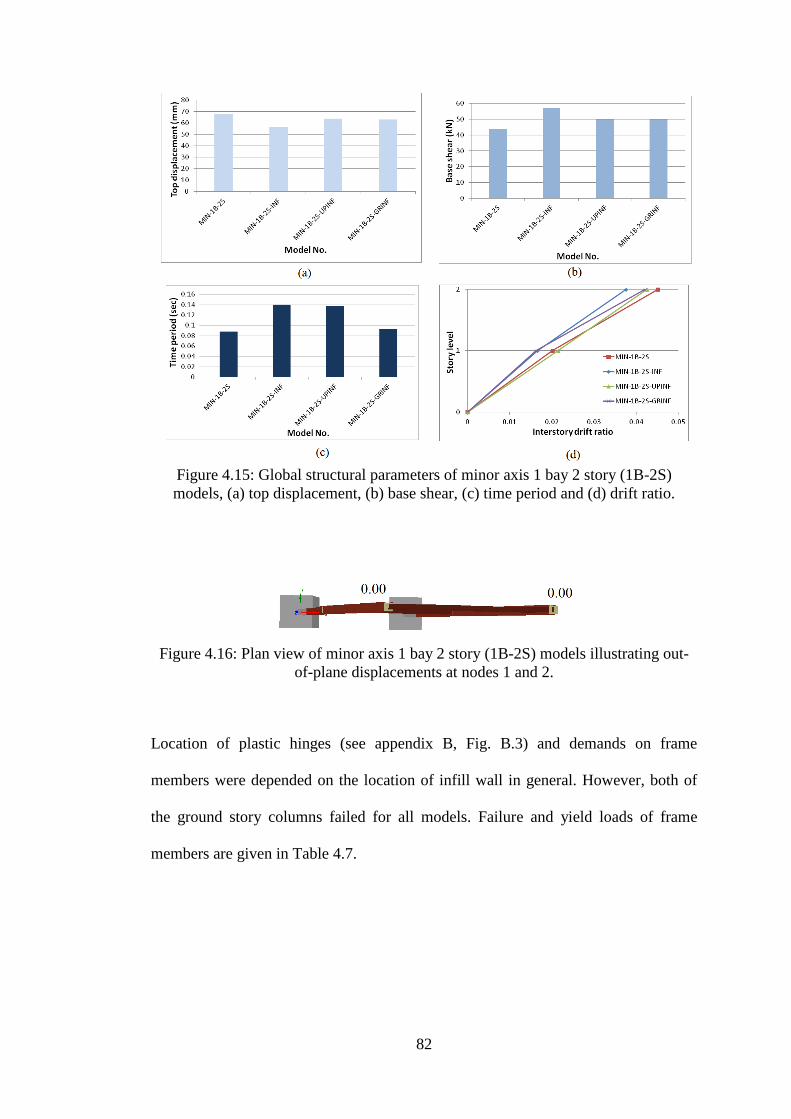
82
Figure 4.15: Global structural parameters of minor axis 1 bay 2 story (1B-2S)
models, (a) top displacement, (b) base shear, (c) time period and (d) drift ratio.
Figure 4.16: Plan view of minor axis 1 bay 2 story (1B-2S) models illustrating out-
of-plane displacements at nodes 1 and 2.
Location of plastic hinges (see appendix B, Fig. B.3) and demands on frame
members were depended on the location of infill wall in general. However, both of
the ground story columns failed for all models. Failure and yield loads of frame
members are given in Table 4.7.

83
Table 4.7: Member capacities of minor axis 1 bay 2 story (1B-2S) models.Model No. Member Deformation
Type
Load Level (kN) Deformation
Type
Load Level (kN)
C1 Yielding 34 Failure 40
C2 Yielding 36 Failure 40
C3 Yielding Failure
C4 Yielding Failure
B1 Yielding 31 Failure 34
B2 Yielding Failure
C1 Yielding 50 Failure 55
C2 Yielding 52 Failure 56
C3 Yielding Failure
C4 Yielding Failure
B1 Yielding 48 Failure 52
B2 Yielding Failure
C1 Yielding 37 Failure 44
C2 Yielding 38 Failure 45
C3 Yielding Failure
C4 Yielding Failure
B1 Yielding 40 Failure 43
B2 Yielding Failure
C1 Yielding 46 Failure 50
C2 Yielding 48 Failure 50
C4 Yielding Failure
C3 Yielding Failure
B1 Yielding 39 Failure 43
B2 Yielding 48 Failure
MIN
-1B
-2S
-UP
INF
MIN
-1B
-2S
-GR
INF
MIN
-1B
-2S
MIN
-1B
-2S
-IN
F

84
4.3.2 Two Bay One Story Frame Models
Figure 4.17: Details of minor axis 2 bay 1 story (2B-1S) models with SeismoStruct
illustrations.
These models were created by using validation model MIN-1B-1S and increasing the
number of bay from one to two. After the modelling had finished, all the members
were studied on the bases of global structural performance parameters and local
parameters. Node 1, 2, and 3 represent locations of the column to beam connections,
column 1, C1, column 2, C2, and column 3, C3 are the column from left to right
respectively and beam 1, B1 and beam 2, B2 are the two beams of the system (Fig.
4.17). Figure 4.18 shows the lateral load-displacement curves for all the minor axis
2B-1S models. The curve for the MIN-2B-1S model exhibited a non-linear
behaviour. On the other hand all the other models followed similar behavioural
pattern where the curve has a linear portion up to a certain load level then there is a
sudden increase in displacement while the load is constant. Then gradually the curve

85
becomes non-linear with increase in both load and displacement. Finally for some of
the curves the rate of increase for load is considerably less then displacement and
hence a fairly flat plateau is formed
Figure 4.18: Load-displacement curves for minor axis 2 bay 1 story (2B-1S) frame
models.
The maximum top displacement was observed with MIN-2B-1S-RLINF but the
difference with other models was not so high (Fig. 4.18 and 4.19.(a)). The maximum
load and the minimum top displacement, hence the maximum stiffness was exhibited
by MIN-2B-1S-INF. Zero out-of-plane displacement at nodes 1, 2 and 3 were
observed for all models as shown in Figure 4.20.
0
20
40
60
80
100
120
140
0 10 20 30 40
Lat
eral
lo
ad (k
N)
Lateral displacement (mm)
MIN-2B-1SMIN-2B-1S-INFMIN-2B-1S-LINFMIN-2B-1S-RINF

86
Figure 4.19: Global structural parameters of minor axis 2 bay 1 story (2B-1S)
models, (a) top displacement, (b) base shear, (c) time period and (d) drift ratio.
The heaviest model in weight, MIN-2B-1S-INF, had the highest fundamental time
period that was followed by MIN-2B-1S-LINF, MIN-2B-1S-RINF and MIN-2B-1S.
The fundamental time periods were the same for MIN-2B-1S-LINF and MIN-2B-1S-
RINF of the same weight.
Figure 4.20: Plan view of minor axis 2 bay 1 story (2B-1S) models illustrating out-
of-plane displacements at nodes 1-3, without showing infills in frames.
Locations of plastic hinges were the same for all models which occurred at the base
of column members near supports and beam ends near the connections (see appendix

87
B, Fig. B.4). Failure and yield loads of all members are given in Table 4.8. that
shows how demand on individual members changes with the presence and location
of the infills.
Table 4.8. Member capacities of minor axis 2 bay 1 story (2B-1S) models.
Model No. Member Deformation
Type
Load Level (kN) Deformation
Type
Load Level (kN)
C1 Yielding 63 Failure 76
C2 Yielding 55 Failure 71
C3 Yielding 66 Failure 78
B1 Yielding 92 Failure
B2 Yielding 92 Failure
C1 Yielding 93 Failure 106
C2 Yielding 86 Failure 99
C3 Yielding 98 Failure 109
B1 Yielding Failure
B2 Yielding Failure
C1 Yielding 77 Failure 91
C2 Yielding 71 Failure 84
C3 Yielding 82 Failure 94
B1 Yielding 107 Failure
B2 Yielding 106 Failure 107
C1 Yielding 79 Failure 92
C2 Yielding 70 Failure 82
C3 Yielding 81 Failure 93
B1 Yielding 106 Failure
B2 Yielding 107 FailureMIN
-2B
-1S
-RIN
FM
IN-2
B-1
SM
IN-2
B-1
S-I
NF
MIN
-2B
-1S
-LIN
F
4.3.3 Two Bay Two Story Frame Models
These models were created by using validation model MIN-1B-1S and increasing the
number of bay and story from one to two. Node 1, 2, and 3 represent locations of the
top column to beam connections, column 1, C1, column 2, C2, column 3, C3, column

88
4, C4, column 5, C5 and column 6, C6 are the vertical members and beam 1, B1,
beam 2, B2, beam 3, B3 and beam 4, B4 are the beams of the systems (Fig. 4.21).
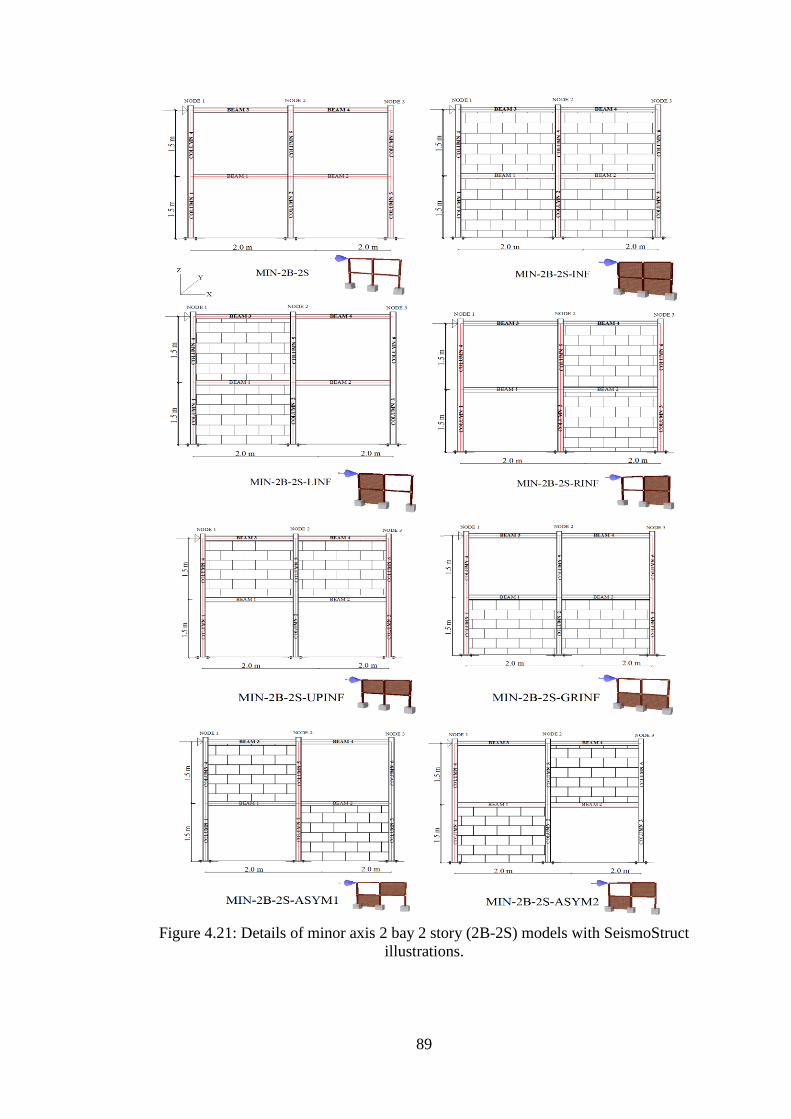
89
Figure 4.21: Details of minor axis 2 bay 2 story (2B-2S) models with SeismoStruct
illustrations.
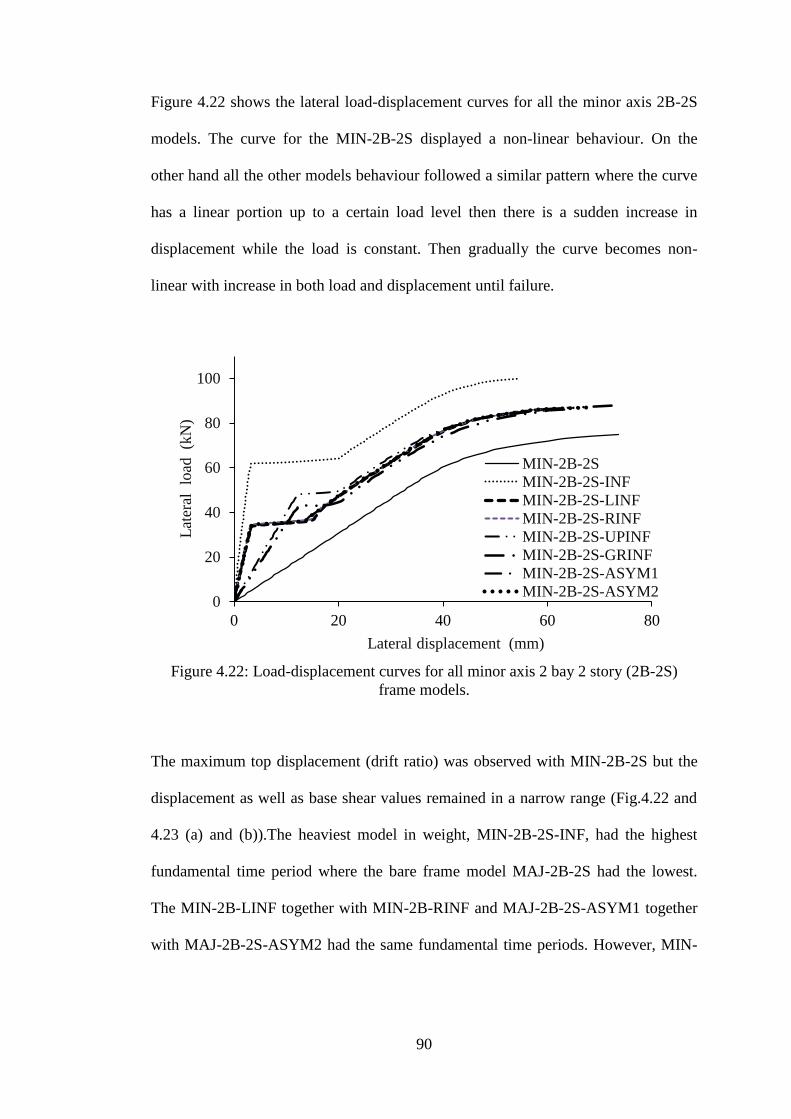
90
Figure 4.22 shows the lateral load-displacement curves for all the minor axis 2B-2S
models. The curve for the MIN-2B-2S displayed a non-linear behaviour. On the
other hand all the other models behaviour followed a similar pattern where the curve
has a linear portion up to a certain load level then there is a sudden increase in
displacement while the load is constant. Then gradually the curve becomes non-
linear with increase in both load and displacement until failure.
Figure 4.22: Load-displacement curves for all minor axis 2 bay 2 story (2B-2S)
frame models.
The maximum top displacement (drift ratio) was observed with MIN-2B-2S but the
displacement as well as base shear values remained in a narrow range (Fig.4.22 and
4.23 (a) and (b)).The heaviest model in weight, MIN-2B-2S-INF, had the highest
fundamental time period where the bare frame model MAJ-2B-2S had the lowest.
The MIN-2B-LINF together with MIN-2B-RINF and MAJ-2B-2S-ASYM1 together
with MAJ-2B-2S-ASYM2 had the same fundamental time periods. However, MIN-
0
20
40
60
80
100
0 20 40 60 80
Lat
eral
lo
ad
(kN
)
Lateral displacement (mm)
MIN-2B-2S
MIN-2B-2S-INF
MIN-2B-2S-LINF
MIN-2B-2S-RINF
MIN-2B-2S-UPINF
MIN-2B-2S-GRINF
MIN-2B-2S-ASYM1
MIN-2B-2S-ASYM2
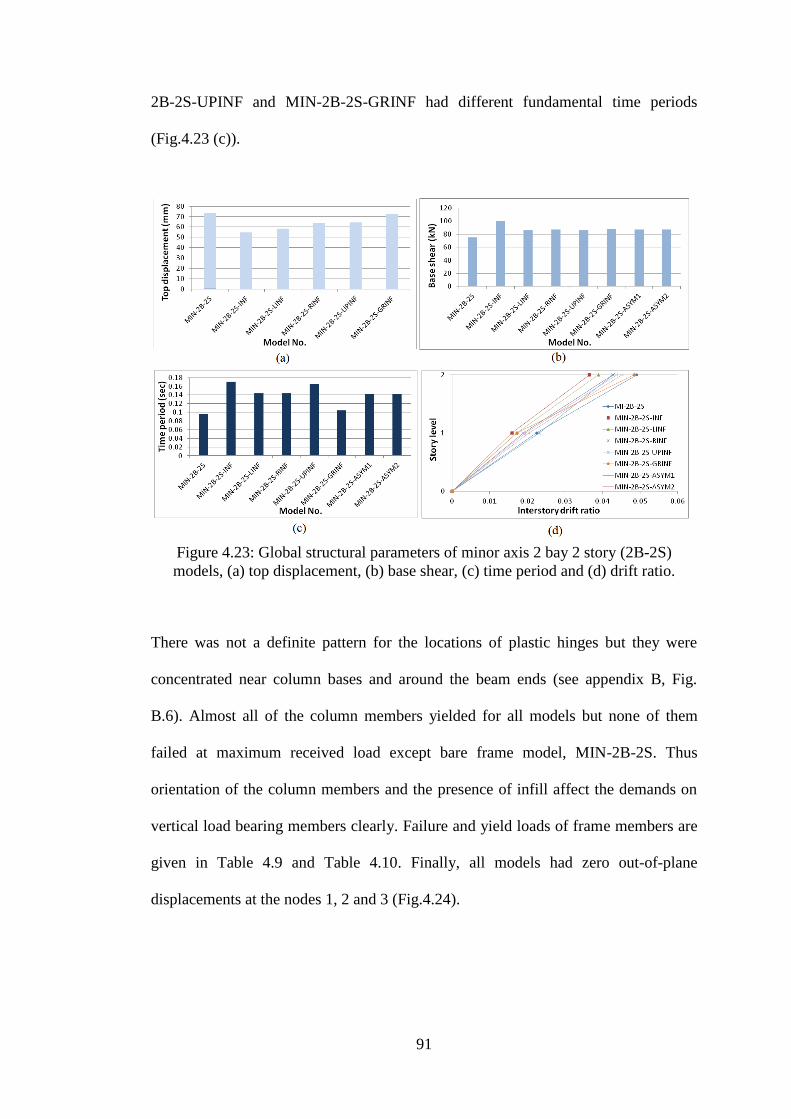
91
2B-2S-UPINF and MIN-2B-2S-GRINF had different fundamental time periods
(Fig.4.23 (c)).
Figure 4.23: Global structural parameters of minor axis 2 bay 2 story (2B-2S)
models, (a) top displacement, (b) base shear, (c) time period and (d) drift ratio.
There was not a definite pattern for the locations of plastic hinges but they were
concentrated near column bases and around the beam ends (see appendix B, Fig.
B.6). Almost all of the column members yielded for all models but none of them
failed at maximum received load except bare frame model, MIN-2B-2S. Thus
orientation of the column members and the presence of infill affect the demands on
vertical load bearing members clearly. Failure and yield loads of frame members are
given in Table 4.9 and Table 4.10. Finally, all models had zero out-of-plane
displacements at the nodes 1, 2 and 3 (Fig.4.24).
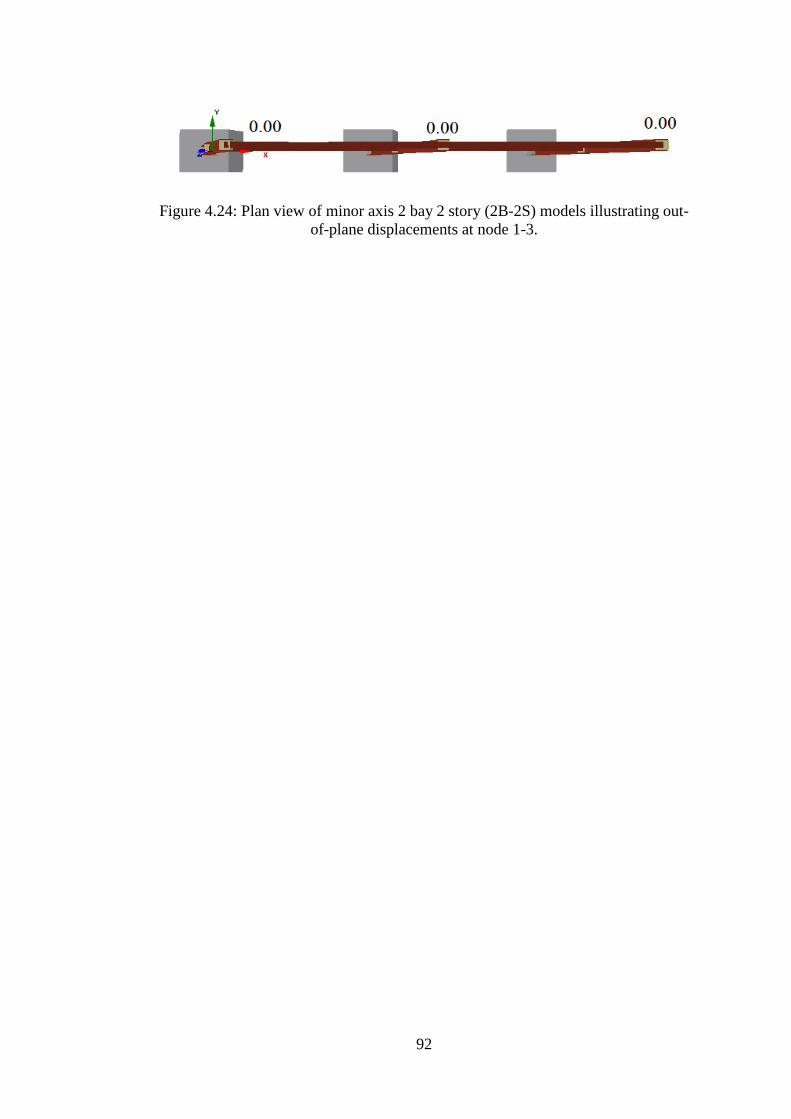
92
Figure 4.24: Plan view of minor axis 2 bay 2 story (2B-2S) models illustrating out-
of-plane displacements at node 1-3.

93
Table 4.9: Member capacities of minor axis 2 bay 2 story (2B-2S) models.
Model No. Member Deformation
Type
Load Level (kN) Deformation
Type
C1 Yielding 57 Failure
C2 Yielding 50 Failure
C3 Yielding 59 Failure
C4 Yielding 70 Failure
C5 Yielding 48 Failure
C6 Yielding 72 Failure
B1 Yielding 54 Failure
B2 Yielding 55 Failure
B3 Yielding 73 Failure
B4 Yielding 73 Failure
C1 Yielding 88 Failure
C2 Yielding 81 Failure
C3 Yielding 91 Failure
C4 Yielding 99 Failure
C5 Yielding 78 Failure
C6 Yielding 100 Failure
B1 Yielding 89 Failure
B2 Yielding 89 Failure
B3 Yielding Failure
B4 Yielding Failure
C1 Yielding Failure
C2 Yielding 66 Failure
C3 Yielding 75 Failure
C4 Yielding 83 Failure
C5 Yielding 64 Failure
C6 Yielding 86 Failure
B1 Yielding 72 Failure
B2 Yielding 72 Failure
B3 Yielding Failure
B4 Yielding Failure
C1 Yielding Failure
C2 Yielding 65 Failure
C3 Yielding 75 Failure
C4 Yielding 85 Failure
C5 Yielding 62 Failure
C6 Yielding 86 Failure
B1 Yielding 71 Failure
B2 Yielding 73 Failure
B3 Yielding 87 Failure
B4 Yielding 87 Failure
MIN
-2B
-2S
MIN
-2B
-2S
-RIN
FM
IN-2
B-2
S-I
NF
MIN
-2B
-2S
-LIN
F

94
Table 4.10: Member capacities of minor axis 2 bay 2 story (2B-2S) models
(continued).
Model No. Member Deformation
Type
Load Level (kN) Deformation
Type
C1 Yielding 61 Failure
C2 Yielding 55 Failure
C3 Yielding 62 Failure
C4 Yielding Failure
C5 Yielding 74 Failure
C6 Yielding Failure
B1 Yielding 71 Failure
B2 Yielding 73 Failure
B3 Yielding Failure
B4 Yielding Failure
C1 Yielding 84 Failure
C2 Yielding 75 Failure
C3 Yielding 85 Failure
C4 Yielding 77 Failure
C5 Yielding 52 Failure
C6 Yielding 79 Failure
B1 Yielding 72 Failure
B2 Yielding 71 Failure
B3 Yielding 81 Failure
B4 Yielding 81 Failure
C1 Yielding Failure
C2 Yielding 65 Failure
C3 Yielding 75 Failure
C4 Yielding 84 Failure
C5 Yielding 64 Failure
C6 Yielding 86 Failure
B1 Yielding 72 Failure
B2 Yielding 73 Failure
B3 Yielding Failure
B4 Yielding 87 Failure
C1 Yielding 72 Failure
C2 Yielding 66 Failure
C3 Yielding 75 Failure
C4 Yielding 85 Failure
C5 Yielding 62 Failure
C6 Yielding 86 Failure
B1 Yielding 72 Failure
B2 Yielding 71 Failure
B3 Yielding 87 Failure
B4 Yielding 87 Failure
MIN
-2B
-2S
-AS
YM
2M
IN-2
B-2
S-U
PIN
FM
IN-2
B-2
S-G
RIN
FM
IN-2
B-2
S-A
SY
M1

95
Chapter 5
COMPARISON OF RESULTS, CONCLUSIONS AND
RECOMMENDATIONS FOR FUTURE WORK
5.1 Introduction
This analytical study has been concentrated on the investigation of the effects of
infill walls on steel framed structures using BIMs block as infill under non-linear
static (pushover) analysis. For this purpose, finite element software SeismoStruct
was used. First, analytically formed four half-scale moment frames with and without
infill by using the data of a previous experimental study of Milad [11] were
validated. Later the results of experimental and analytical studies were compared.
Then, six new groups of models were constructed by modifying the validation
models e.g. increasing number of bays and stories and changing location of the infill
walls. The models having the same number of bay and story are considered in the
same group and models of the same group differ by means of the existence and the
location of the infill walls only.
In total, thirty-six analytical models were studied on the bases of global structural
performance parameters of top displacement, base shear, fundamental time period
and out-of-plane displacement and local parameters of inter-story drift ratio and
member deformation capacities to monitor the effect of plan and vertical
irregularities and symmetrical/asymmetrical placement of infill walls. The following
results have been derived from this study.

96
5.2 Comparison of the Results and Conclusions
All bare frame models experienced higher top displacements when compared
to fully infilled frames of the same group. On the other hand, when frames
did not all have infill walls then the location of infill wall affects the top
displacements (Fig.5.1).
Figure 5.1: Top displacement values for major and minor axis frame models.
In general, presence of out-of-plane displacement causes dramatic differences
in the top displacement values of frames especially for major axis frames.
Frames having the highest out-of-plane displacements in a group exhibited
the highest top displacements (Fig. 5.1)
0
20
40
60
80
100
120
140
Top
dis
pla
cem
ent
(mm
)
Model No.
MAJOR AXIS FRAMES MINOR AXIS FRAMES

97
All minor axis models experienced zero out-of-plane displacement. Hence, it
was concluded that the orientation of the column members directly influences
out-of-plane displacement.
When out-of-plane displacement is zero or relatively low, top displacements
of the same group models do not differ too much from each other except 1
bay 1 story model group which can be attributed to the effect of bay and story
increase on these parameters. Minor axis frames have low variance in top
displacements, hence, this can be related to zero out-of-plane displacement.
For minor axis frames, the effect of plan irregularity and symmetrical
placement of infills on top displacements and the resisted lateral loads are not
as great as vertical irregularity.
Fully infilled frames displayed the highest stiffness by receiving more loads
for the same displacement values compared to other models in the same
group.
The highest time period belongs to fully infilled models where the lowest
fundamental time period belongs to bare frame models (Fig.5.2). This
conforms to the references [15, 16] that the presence of infill walls increases
stiffness of the structure and consequently the natural period due to increased
weight.
The orientation of column members directly affect the fundamental time
period of the models, all minor axis models have lower fundamental time

98
periods (approximately half) compared to their major axis group members
(Fig. 5.2)
Although, plan irregularity and asymmetrical placement of infills do not
affect the fundamental time period of models having the same weight, the
vertical irregularity causes increase or decrease of the fundamental time
period depending on the location of infill.
Figure 5.2: Fundamental time period for major and minor axis frame models.
Load-displacement curves for all bare frame models exhibited a non-linear
behavioural pattern where infilled frames showed a sudden loss in stiffness
and then started receiving higher loads. This result reminds the phenomena
that “infilled frame behaves as a monolithic system at low lateral load levels,
with increase in load levels infill starts separating from the surrounding frame
and forms diagonal compression mechanism” (section 2.4).
0
0,05
0,1
0,15
0,2
0,25
0,3
Tim
e p
erio
d (
sec)
Model No.
Major Axis Frames Minor Axis Frames

99
The presence of infill wall on the second story only, caused failure of all
ground story columns, hence, this was due to the formation of soft story in
major axis 2 story frame models.
Location of plastic hinges remain same for all models of 1B-1S and major
axis 1B-2S frame models but for all other models, locations were altered due
to the presence of infill (see Appendix B).
As the number of bays increase the base shear increases for both major and
minor axis frame models and all major axis frame models received higher
loads compared to minor axis models (Fig. 5.3).
Figure 5.3: Base shear values for major and minor axis frame models.
The existence of infill walls increase the received load since the bare models
received the lowest. However, this phenomenon is mainly dependent on the
location of infill walls.
020406080
100120140160180
Bas
e s
he
ar (
kN)
Model No.
Major Axis Frames Minor Axis Frames

100
Out-of-plane displacement and fully infilled frames have greater effects on
stiffness compared to vertical irregularity and asymmetrical placement of
infills.
In the light of aforementioned results, it can be concluded that the presence and
location of infill walls and orientation of the vertical frame members have both
advantageous and disadvantageous effects on the behaviour of steel structures.
Increased stiffness of fully infilled frames compared to bare and partially infilled
frames can be accounted as positive effect of infills. However, higher fundamental
time periods due to increased weight, alterations in top displacement, and base shear
are accounted as their negative effects.
Similarly, effects of the orientation of the vertical members are significant. Major
axis frames are more advantageous than minor axis frames by means of increased
strength but they have higher fundamental time periods. Also, major axis models
having infills on the upper story only, experience soft story formation. Minor axis
frames decrease fundamental time period, has zero out-of-plane displacement and
variation among top displacements due to vertical irregularities is not as high as that
of major axis frames.
5.3 Recommendations
The following are the recommendations for future research work.
Infill walls made of different materials can be used to evaluate effect of infill
material on the behaviour of steel frames and then the results can be
compared to find out which infill material is the most effective one to totally
ignore or include infill walls during design.

101
The non-linear dynamic analysis can be employed to monitor the most
realistic response of structures to seismic forces by defining complete
hysteretic behaviour of infill wall.
The effect of out-of-plane displacement of frames can be tested with
restrained and unrestrained frames. Similarly, effect of upward movement of
top beams can also be studied.
The effect of bay and story increase as well as plan and vertical irregularities
on performance parameters can be studied with 3D, full-scale multi-storey
buildings.
102
REFERENCES
[1] Arêde, A., Furtado, A., Rodrigues, H., & Varum, H. (2016). Experimental
evaluation of out-of-plane capacity of masonry infill walls, Journal of
Engineering Structures, 111, 48-63.
[2] Farshchi, H., Hajirasouliha, I., & Jazany, R. A. (2013). Influence of masonry
infill on the seismic performance of concentrically braced frames. Journal of
Constructional Steel Research, 88, 150-163.
[3] Sezen, H., Whittaker, A. S., Elwood, K. J., and Mosalam, K. M. (2003).
Performance of reinforced concrete buildings during the August 17, 1999
Kocaeli, Turkey earthquake, and seismic design and construction practise in
Turkey, Engineering Structures 25, 103–114.
[4] Jain, S. K., Kaushik, H. B. and Rai, D. C. (2006). Code approaches to seismic
design of masonry-infilled reinforced concrete frames: A state-of-the-art
review. Earthquake Engineering Research Institute, Earthquake Spectra,
22(4), 961-83.
[5] Jain, S. K., and Murty, C. V. R. (2000). Beneficial influence of masonry
infills on seismic performance of RC frame buildings, Proceedings, 12th
World Conference on Earthquake Engineering, New Zealand, Paper No.
1790.

103
[6] Bertero, V. and Brokken, S. (1983). Infills in seismic resistant building,
Journal of Structural Engineering, ASCE, 109(6), 1337–1361.
[7] FEMA-306 (1999). Evaluation of earthquake damaged concrete and masonry
wall buildings—Basic Procedures Manual, Federal Emergency Management
Agency, Washington D.C.
[8] FEMA-273 (1997). Guidelines for the Seismic Rehabilitation of Buildings,
Federal Emergency Management Agency, Washington, D.C.
[9] EUROCODE-8 (1998). Design Provisions for Earthquake Resistance of
Structures. European Committee of Standardization, Brussels, Belgium.
[10] Chen, X., & Liu, Y. (2016). A finite element study of the effect of vertical
loading on the in-plane behaviour of concrete masonry infills bounded by
steel frames. Journal of Engineering Structures, 117, 118-129.
[11] Milad, A. M. L. (2015). Effect of infill wall on the seismic behaviour of steel
framed structures. Master Thesis, Department of Civil Engineering, Eastern
Mediterranean University, 116 p.
[12] Arêde, A., Furtado, A., Ramos, T., Rodrigues, H., Tavares, P., & Varum, H.
(2015). In-plane response of masonry infill walls: experimental study using
digital image correlation. Procedia Engineering, 114,870-6.
104
[13] Misir, I. S. (2015). Potential use of locked brick infill walls to decrease soft-
story formation in frame buildings. Journal of Performance of Constructed
Facilities, 29(5), 04014133.
[14] Liu, Y., & Soon, S. (2012). Experimental study of concrete masonry infills
bounded by steel frames. Canadian Journal of Civil Engineering, 39(2), 180-
90.
[15] Girgin, S. C., Misir, I. S., Ozcelik, O., & Yucel, U. (2015). The behaviour of
infill walls in RC frames under combined bidirectional loading, Journal of
Earthquake Engineering, 00,1-28.
[16] Arêde, A., Furtado, A., & Rodrigues, H.(2015). Modelling of masonry infill
walls participation in the seismic behaviour of RC buildings using OpenSees.
International Journal of Advanced Structural Engineering, 7, 117-27.
[17] Basha, S. H., & Kaushik, H. B. (2016). Behaviour and failure mechanisms of
masonry-infilled RC frames (in low-rise buildings) subject to lateral loading.
Journal of Engineering Structures, 111, 233-45.
[18] Liu, Y., & Manesh, P. (2013). Concrete masonry infilled steel frames
subjected to combined in-plane lateral and axial loading- An experimental
study. Engineering Structures, 52, 331-9.
[19] Duggal, S. K. (2007). Earthquake resistant design of structures, Oxford
University Press, New Delhi.

105
[20] Steel lateral load resisting systems. (2017, January 20). Retrieved from
http://users.encs.concordia.ca/home/x/xiaom_h/Study/New%20folder/Steel%20Later
al%20Load%20Resisting%20Systems.pdf
[21] Cross braced frame with pinned bases. (2017, January 20). Retrieved from:
http://expeditionworkshed.org/applets/2D_frames/sketch_19/sketch_19.html
[22] Zhang, B. (2006). Parametric study on the influence of infills on the
displacement capacity of RC frames for earthquake loss estimation. Master
Thesis, Department of Earthquake Engineering, Rose School, 86p.
[23] Bilgin, H., Binici, H., Kaplan, H., Öztas, A., Yılmaz, S. (2010). Structural
damages of L’Aquila (Italy) earth-quake, Natural Hazards and Earth System
Sciences, 10, 499–507.
[24] El-Dakhakhni, W. W. Elgaaly, M., & Hamid A. A. (2003). Three-strut model
for concrete masonry-infilled steel frames. J. Struct. Eng. 129(2), 177-185.
[25] Mehrabi, A. B. & Shing, P. B. (2002). Behaviour and analysis of masonry-
infilled frames. Prog. Struct. Eng. Mater, 4, 320-31.
[26] Mallick, D. V. & Severn, R. T. (1967). The behaviour of infilled frames
under static loading. Proceedings of the Institution of Civil Engineering, 38,
639-56.

106
[27] Polyakov, S. V. (1966). Some investigations of the problem the strength of
elements of buildings subjected to horizontal loads. Symposium on Tall
Buildings, University of Sourthampton, 465-86.
[28] Holmes, M. (1961). Steel frames with brickwork and concrete filling. Proc
Inst Civ Eng Res Theory, 19, 473–78.
[29] Smith, S. (1962). Lateral stiffness of infilled frames. J. Struct. Div., 88, 183–
199.
[30] Mainstone J., Weeks, G. (1970). The influence of bounding frame on the
racking stiffness and strength of brick walls. 2nd International Brick Masonry
Conference, Watford.
[31] Bertero, V. V, & Klinger, R. E. (1978). Earthquake resistance of infilled
frames. J Struct Div., 104, 973–89.
[32] Hobbs, B. & Saneinejad, A. (1995). Inelastic design of infilled frames. J.
Struct. Eng. 121, 634–50.
[33] Liauw, T., Kwan, K. (1984). Nonlinear behavior of non-integral infilled
frames. Comput. Struct., 18, 551–60.
[34] Dolsek, M., Fajfar, P. (2002). Mathematical modelling of an infilled RC
frame structure based on the results of pseudo-dynamic tests. Earthq. Eng.
Struct. Dyn., 31,1215–30.
107
[35] Bennett., R. M., Flanagan, R. D. & Tenbus, M. A. (1994). Numerical
modelling of clay tile infills. Proceedings from the NCEER Workshop on
Seismic Response of Masonry, San Francisco, California, 1, 63-8.
[36] Schmidt, T. (1989). An approach of modelling masonry infilled frames by the
f.e. method and a modified equivalent strut model. Annu. J. Concr. Struct., 4,
171–180.
[37] Syrmakesis, C., Vratsanou, V. (1986). Influence of infill walls to RC frames
response. 8th European Conference on Earthquake Engineering, Istanbul,
Turkey, 47–53.
[38] San Bartolomé, A. (1990). Colleción del Ingeniero Civi l, (in Spanish), Libro
No. 4. Colegio de Ingenierios del Peru.
[39] Chrystomou, C. Z. (1991). Effects of degrading infill walls on the nonlinear
seismic response two-dimensional steel frames. Ph.D. Thesis, Cornel
University, Ithaca, New York.
[40] Crisafulli F. J. (1997). Seismic behaviour of reinforced concrete structures
with masonry infills. Ph.D. Thesis, University of Canterbury, New Zealand.
[41] Crisafulli, F. J., & Carr, A. J. (2007). Proposed macro-model for the analysis
of infilled frame structures. Bull. NZ Soc. Earthq. Eng., 40(2), 69–77.

108
[42] Antoniou, A., Blandon, C., Crisafulli, F. J., Pinho, R., & Smyrou, E. (2011).
Implementation and verification of a masonry panel model for nonlinear
dynamic analysis of infilled RC frames. Bull. Earthquake Eng., 9, 1519-34.
[43] King, G. J., W. & Pandey, P. C. (1978). The analysis of infilled frames using
finite elements. Proceedings of the Institution of Civil Engineers, 2(65), 749-
60.
[44] Atkinson, R. H., Amadei, B. P., Saeb, S. & Sture, S. (1989). Response of
masonry bed joints in direct shear. J. Struct. Eng., 115(9), 2276-96.
[45] Crisafulli, F. J., Carr, A. J. & Park, R. (2000). Analytical modelling of infilled
frame structures - A general review. Bull. NZ Soc. Earth. Eng., 33(1), 30-47.
[46] Smith, S. (1966). Behaviour of square infilled frames. Proceedings of the
American Society of Civil Engineering, Journal of Structural Division, 92,
381-403.
[47] Ahmad, J., Ahmad, P., Ahmad, R., Jan, M. U., Malik, M. I. & Seth, H.
(2014). Brick masonry and hollow concrete block masonry – A comparative
study. International Journal of Civil and Structural Engineering Research,
1(1), 14-21.

109
APPENDICES
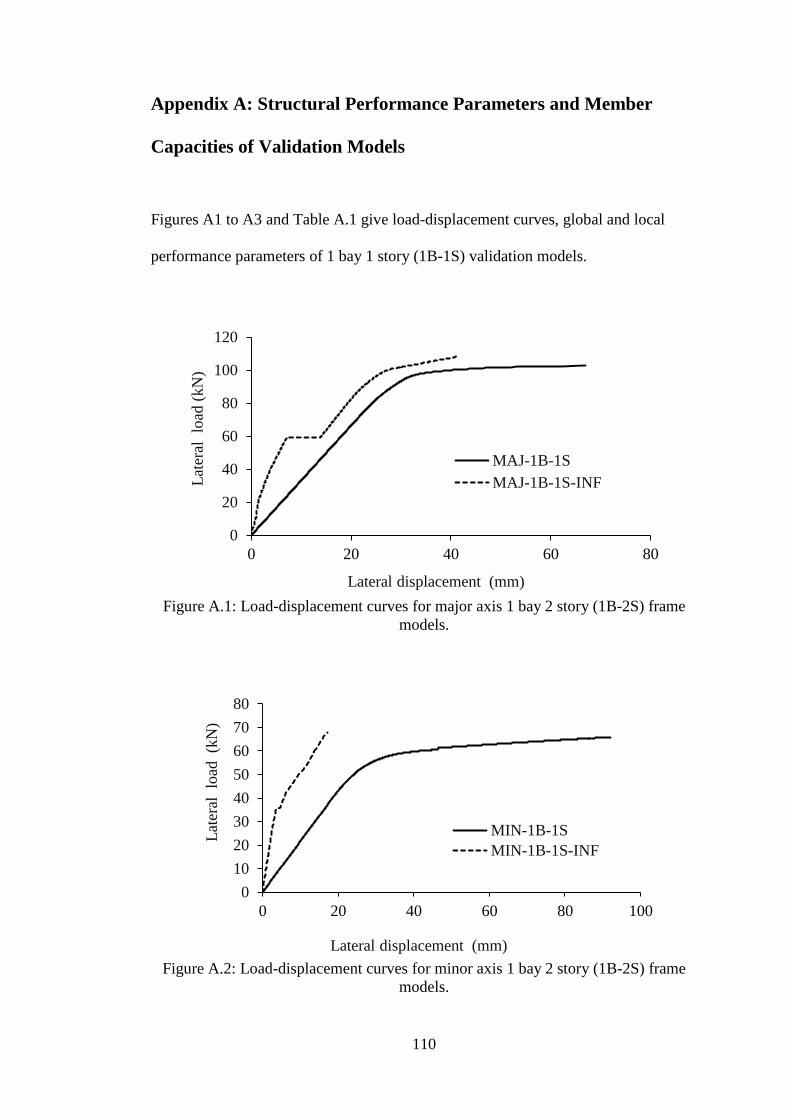
110
Appendix A: Structural Performance Parameters and Member
Capacities of Validation Models
Figures A1 to A3 and Table A.1 give load-displacement curves, global and local
performance parameters of 1 bay 1 story (1B-1S) validation models.
Figure A.1: Load-displacement curves for major axis 1 bay 2 story (1B-2S) frame
models.
Figure A.2: Load-displacement curves for minor axis 1 bay 2 story (1B-2S) frame
models.
0
20
40
60
80
100
120
0 20 40 60 80
Lat
eral
lo
ad (
kN
)
Lateral displacement (mm)
MAJ-1B-1S
MAJ-1B-1S-INF
0
10
20
30
40
50
60
70
80
0 20 40 60 80 100
Lat
eral
lo
ad
(kN
)
Lateral displacement (mm)
MIN-1B-1S
MIN-1B-1S-INF

111
Figure A.3: Global structural parameters of 1 bay 1 story (1B-1S) validation models,
(a) top displacement, (b) base shear, (c) time period and (d) drift ratio.
Table A.1: Member capacities of 1 bay 1 story (1B-1S) models. Member Deformation
Type
Load
Level
(kN)
Deformation
Type
Load
Level
(kN)
Node Load
Level
(kN)
Out
of
plane
disp.
(mm)
C1 Yielding 82 Failure 99 140.97
C2 Yielding 84 Failure 101 2-26.86
Beam Yielding 98 Failure 100
C1 Yielding 86 Failure 105 11.94
C2 Yielding 95 Failure 108 2-1.93
Beam Yielding 97 Failure 100
C1 Yielding 50 Failure 64 10.00
C2 Yielding 57 Failure 64 20.00
Beam Yielding 60 Failure 62
C1 Yielding 55 Failure 65 10.00
C2 Yielding 58 Failure 65 20.00
Beam Yielding 62 Failure 60
MA
J-1
B-1
S
102.63
108.02
65.79
MA
J-1
B-1
S-I
NF
MIN
-1B
-1S
MIN
-1B
-1S
-IN
F
67.98

112
Appendix B: Location of Plastic Hinges
Figures B1 to B6 show the location of plastic hinges for all analytical models.
Figure B.1: Location of plastic hinges of 1 bay 1 story (1B-1S) frame models
(validation models).

113
Figure B.2: Location of plastic hinges of major axis 1 bay 2 story (1B-2S) frame
models.

114
Figure B.3: Location of plastic hinges of minor axis 1 bay 2 story (1B-2S) frame
models.

115
Figure B.4: Location of plastic hinges of 2 bay 1 story (2B-1S) frame models.

116
Figure B.5: Location of plastic hinges of major axis 2 bay 2 story (2B-2S) frame
models.

117
Figure B.6: Location of plastic hinges of minor axis 2 bay 2 story (2B-2S) frame
models.
Recommended


![Gioncu [Framed Structures. Ductility and Seismic Response - 2000]](https://img.pdfslide.us/doc/110x75/5532c8424a79599f5e8b4753/gioncu-framed-structures-ductility-and-seismic-response-2000.jpg)