Embed Size (px)
Citation preview

1
SEISMIC ANALYSIS OF OPEN GROUND STOREY FRAMED BUILDING
A thesis Submitted by
SHAMBHU NATH MANDAL
(Roll: 109CE0526)
In partial fulfilment of the requirement
for the award of the degree
of
BACHELOR OF TECHNOLOGY
in
CIVIL ENGINEERING
Under the guidance of
PROF. ROBIN DAVIS P
DEPARTMENT OF CIVIL ENGINEERING
NATIONAL INSTITUTE OF TECHNOLOGY ROURKELA
ROURKELA 769008 ODISHA, INDIA
May 2013

2
DEPARTMENT OF CIVIL ENGINEERING
NATIONAL INSTITUTE OD TECHNOLOGY ROURKELA
ODISHA, INDIA 769008
CERTIFICATE
This is to certify that the thesis entitled “SEISMIC ANALYSIS OF OPEN GROUND
STOREY FRAMED BUILDING” submitted by Mr. Shambhu Nath Mandal
(109CE0526) in partial fulfilment of requirements for the award of Bachelor of Technology
in Civil Engineering during the session 2009-2013 at the National Institute of Technology
Rourkela.
A bonafide record of research work carried by him under my supervision and guidance and
has fulfilled all the prescribed requirements.
Department of civil engineering Robin Davis P
National Institute of Technology Rourkela Associate professor

3
ACKNOWLEDGEMENTS
First of all I would like to thank God for his blessings due to which I have achieved all the successes and
achievements in my life.
Then after I am very grateful to my respectable and honourable guide Dr. Robin Davis P, an associate
professor for his support, guidance, care, tutelage, motivation and patience throughout the research period. I
just appreciate his talent and the encouragement which he provided me throughout this academic year. All
credit goes to him who made my project successful. Without his help and contribution my work has not been
able to come to this stage of completeness and fulfilment of my bachelor degree.
Also I sincerely offer my gratitude towards my faculty advisor Dr. Ramakar Jha for his valuable support
throughout these 4 years.
Apart from this I would like to thank each and every faculties of my civil engineering department for their
knowledge, assistance, motivation and care throughout the study period.
I just can’t leave my friends, their help, togetherness and support which changed a simple man into a
respectable and responsible citizen of a society. So I would like to thank them too for their indebted love and
care towards me.
Last but not the least I hereby want to mention the role of my family members, especially my dad for his
unconditional love, moral support and the encouragement for the successful completion of my bachelor
degree.

4
Lots of people have contributed their ideas and help in completion of my project and the thesis I hereby once
more would like to thank them all.
I apologise if left anyone.
Thank You Shambhu Nath Mandal
Roll No: 109CE0526
B.Tech Civil Engineering

5
ABSTRACT
The concept of open ground building (OGS) has taken its place in the Indian urban environment due to the
fact that it provides the parking facility in the ground storey of the building. The cost of construction of this
type of building is much less than that of a building with basement parking. Surveys of buildings failed in
the past earthquakes show that this types of buildings are found to be one of the most vulnerable. The
majority of buildings that failed during the Bhuj earthquake (2001) and Gujraat earthquake were of the open
ground storey type.
The collapse mechanism of such type of building is predominantly due to the formation of soft-storey
behavior in the ground storey of this type of building. The sudden reduction in lateral stiffness and mass in
the ground storey results in higher stresses in the columns of ground storey under seismic loading. In
conventional design practice, the contribution of stiffness of infill walls present in upper storeys of OGS
framed buildings are ignored in the structural modelling (commonly called bare frame analysis). Design
based on such analysis, results in under-estimation of the bending moments and shear forces in the columns
of ground storey, and hence it may be one of the reasons responsible for the failures observed.
After the Bhuj earthquake took place, the IS 1893 code was revised in 2002, incorporating new design
recommendations to address OGS framed buildings. According to this clause 7.10.3(a) of the same code
states: “The columns and beams of the soft-storey are to be designed for the multiplication factor of 2.5
times the storey shears and moments calculated under seismic loads of bare frame”. The prescribed
multiplication factor (MF) of 2.5, applicable for all OGS framed buildings, is proved to be fairly higher and
suggests that all existing OGS framed buildings (those designed to earlier codes) are highly vulnerable under
seismic loading. This MF value however does not account for number of storeys, number of bays, type and
number of infill walls present, etc and hence it is independent of all of the above factors.

6
Present study deals with various aspects related to the performance of OGS
buildings. The values of magnification factor recommended in literatures vary from 1.0 to 4.8 (Kaushik,
2009). The main objective of present study is the study of comparative performance of OGS buildings
designed according to various MFs using nonlinear analysis. As the more realistic performance of the OGS
building requires the modelling the stiffness and strength of the infill walls, the stiffness and strength of the
infill walls also considered. The variations in the type of the infill walls using in Indian constructions are
significant. Depending on the modulus of elasticity and the strength, it can be classified as strong or weak.
The two extreme cases of infill walls, strong and weak are considered in the study. The behavior of
buildings depends on the type of foundations and soils also. Depending on the foundations resting on soft or
hard soils, the displacement boundary conditions at the bottom of foundations can be considered as hinged
or fixed. As the modeling of soils is not in the scope of the study, two boundary conditions, fixed and
hinged, that represent two extreme conditions are considered.
7
TABLE OF CONTENTS
Title Page No.
Acknowledgements…………………………………………………………….….3
Abstract………………………………………………............................................5
Table of contents…………………………...……………………………….……..7
Lists of tables …………………………………..…………………………..……..11
Lists of figures…………………………..………………………………..…….….11
Notations…………………...……………………………………………..………..13
CHAPTER 1 INTRODUCTION
1.1 Introduction……………………………………………………….……...........14
1.2 Typical Masonry Infilled Building………………………………………..…...17
1.3 Open Ground Storey (OGS) Building………………………………..………..18
1.4 Study area……………………..…………………………………………….…19
1.5 Objective of the thesis………………………………...………………………..20
1.6 Scope of the study ……………………………………………………….….....20
1.7 Methodology……………………………………………………………………21
1.8 Organisation of the thesis……………………………………………….……….22
8
CHAPTER 2 LITERATURE REVIEW
2.1 Introduction…………………………………………………..…………….…….23
2.2 Provisions in various codes…………………………………………..…………...23
2.2.1. IS 1893-2002 recommendation..........................................................................23
2.2.2 Conventional design practice…………………………………………….…......24
2.2.3 Provisions in other codes…………………………………………….….………24
2.3 Other concepts…………………………………………………………..…………25
2.4 Behavior in the presence of infill wall………………………………….………...27
2.5 Summary…………......................................................................................30
CHAPTER 3 THE PROJECT WORK
3.1 General…………………………………………………………………..….…….31
3.2 Example Frames…………………………………………………………………..31
3.3 Magnification Factor………………………………………………………………34
3.4 Types of building frames considered………………………………………………35
3.5 Seismic data………………………………………………………………………..35
3.6 Material properties …………………………………………………………….......36
3.7 Structural elements…………………………………………………………………36
3.8 Loads considered……………………………………………………………………37

9
3.9 Design of building frames…………………………………………………………..37
3.10 Structural modelling……………………………………………………………….37
3.10.1 Pushover analysis…………………………………………………………………37
3.10.2 Structural modelling elements……………………………………………………38
3.10.2.1 Modelling of beams and columns………………………………………………39
3.10.2.2 Performance level of beams and columns………………………………………39
3.10.2.3 Non-linear hinge properties of beams and columns…………………………....41
3.10.3 Pushover analysis…………………………………………………………………42
3.10.4 Modelling of infill wall…………………………………………………………..43
3.10.4.1 Elastic Modulus of Equivalent Strut……………………………………………44
3.10.4.2 Non-linear hinge property for equivalent strut…………………………………44
3.10.5 Comparison of behavior of bare frames designed with various MF……………..45
3.10.6 Comparison of pushover curves of infill wall condition…………………………49
3.10.7 Comparison between fixed and hinged type of support………………………….50
3.10.8.1 Comparison of pushover curves of 4S and 4S building frame………………...54
3.10.8.2 Comparison of pushover curves of 4S and 10S building frame……………….56
3.11 Summary…………………………………………………………………………….57

10
CHAPTER 4 RESULTS AND CONCLUSIONS
RESULTS AND CONCLUSIONS………………………………………………………59
REFERENCES…………………………………………………………………………...62

11
LIST OF TABLES
Title Page no. Table 3.1 4S6B building frames taken for the case study………………………..31
Table 3.2 10S6B building frames taken for the case study……………………....33
Table 3.3 Different codes with their magnification factor value…………………35
Table 3.4 Seismic data assumed for the analysis………………………………....35
Table 3.5 Material Properties and geometric parameters Assumed………………36
LIST OF FIGURES
Title Page no.
Fig 1.1 Some typical examples of open ground storey building……………….14
Fig.1.2 Some common examples of failure of OGS building during
earthquake in the past………………………………………………....15
Fig.1.3 Behavior of infilled frame building…………………………………..18
Fig 1.4 Difference in behavior between bare, infill and
OGS building frame………………………………………………….19
Fig 2.1 Behavior of infill frame……………………………………………….28
Fig.3.1 Pushover curve………………………………………………………...38
Fig.3.2 Performance level of beam and column………………………………..40
Fig 3.3 Formation of hinge in the building frame………………………………42
12
Fig 3.4 An example of pushover curve of 4S bare frame………………………43
Fig. 3.5 Nonlinear hinged property of strut………………………………………45
Fig 3.6 Pushover curves of 4s6b-B-MF1.0-F, 4s6b-B-MF2.5-F,
4s6b-B-MF3.0-F…………………………………………………………46
Fig 3.7 Comparison of pushover curves of bare frames 4s6b-B-MF1.0-H,
4s6b-B-MF2.5-H, 4s6b-B-MF3.0-H …………………………………...46
Fig 3.8 Comparison of pushover curves of bare frames 10s6b-B-MF1.0-F,
10s6b-B-MF2.5-F, 10s6b-B-MF3.0-F…………………………………..47
Fig 3.9 Comparison of pushover curves of bare frames for 10s6b-B-MF1.0-F,
10s6b-B-MF2.5-F, 10s6b-B-MF3.0-F ………………………………….48
Fig.3.10 Pushover curves of 4s6b-G-MF2.5-W-H, 4s6b-G-MF2.5-S-H…………49
Fig 3.11 Pushover curves of 10s6b-G-MF2.5-W-F, 10s6b-G-MF2.5-S-F……….50
Fig.3.12 Pushover curves of 4s6b-F-MF1.0-S-H, 4s6b-F-MF1.0-S-F……………51
Fig.3.13 Pushover curves of 10s6b-F-MF1.0-S-H, 10s6b-F-MF1.0-S-F…………52
Fig.3.14 Pushover curves of OGS 4s6b-G-MF2.5-S-H, 4s6b-G-MF2.5-S-F……..52
Fig.3.15 Pushover curves of OGS 10s6b-G-MF2.5-S-H, 10s6b-G-MF2.5-S-F…..53
Fig 3.16 Pushover curves of 4S building frame……………………………………54
Fig 3.17 Pushover curves of 10S building frame…………………………………..56

13
NOTATIONS
B Bare
W Weak
S Strong
F Fixed
H Hinged
CP Collapse Prevention
IO Immediate Occupancy
IS Indian Standards
LS Life Safety
MDOF Multi Degree Of Freedom
MF Multiplication Factor
OGS Open Ground Storey
PA Pushover Analysis
RC Reinforced Concrete
RSA Response Spectrum Analysis
SDOF Single Degree Of Freedom
WI With Infill
WOI Without Infill

14
CHAPTER 1
INTRODUCTION
1.1 Introduction
Open ground storey (also known as soft storey) buildings are commonly used in the urban environment
nowadays since they provide parking area which is most required. This type of building shows
comparatively a higher tendency to collapse during earthquake because of the soft storey effect. Large
lateral displacements get induced at the first floor level of such buildings yielding large curvatures in the
ground storey columns. The bending moments and shear forces in these columns are also magnified
accordingly as compared to a bare frame building (without a soft storey). The energy developed during
earthquake loading is dissipated by the vertical resisting elements of the ground storey resulting the
occurrence of plastic deformations which transforms the ground storey into a mechanism, in which the
collapse is unavoidable. The construction of open ground storey is very dangerous if not designed suitably
and with proper care. This paper is an attempt towards the study of the comparative performance evaluation
of
three OGS buildings case studies.
Fig 1.1 showing some typical examples of open ground storey building.

15
Marina earthquake 1989 Taiwaan earthquake Dali City 1999
Fig.1.2 showing some common examples of failure of OGS building during earthquake in the past.
Modern seismic codes just neglect the effects of non-structural infill walls during analysis. Conventional
practice neglects the effect of infill stiffness by assuming that this would give some conservative results,
Fardis and Panagiotakos (1997). However this is not true in the case of columns present in the open ground
storey. Many codes (e.g., IS 1893- 2002, EC -8, IBC ) recommended a factor to take care for the
magnification of bending moments and shear forces.
Scarlet (1997) studied the quantification of seismic forces in OGS buildings proposing a multiplication
factor for base shear for soft-storey type of building. This procedure requires the analysis of OGS framed
building by modelling the infill walls considering their stiffness. The proposed multiplication factor ranges
from 1.86 to 3.28 as the number of storeys increases from six to twenty. Fardis et. al. (1999) observed that
the bending of the columns in the more infilled storey (first storey of OGS building) under the lateral load is
in an opposing direction to that of the less infilled storey (ground storey). Based on this observation, an
alternate capacity design rule was proposed for the beams present at the top (first floor level) of the less
infilled storey i.e. ground storey. According to this rule, the demand on the beams in the first floor should
also be increased, depending on the capacity of the columns in the first storey.
16
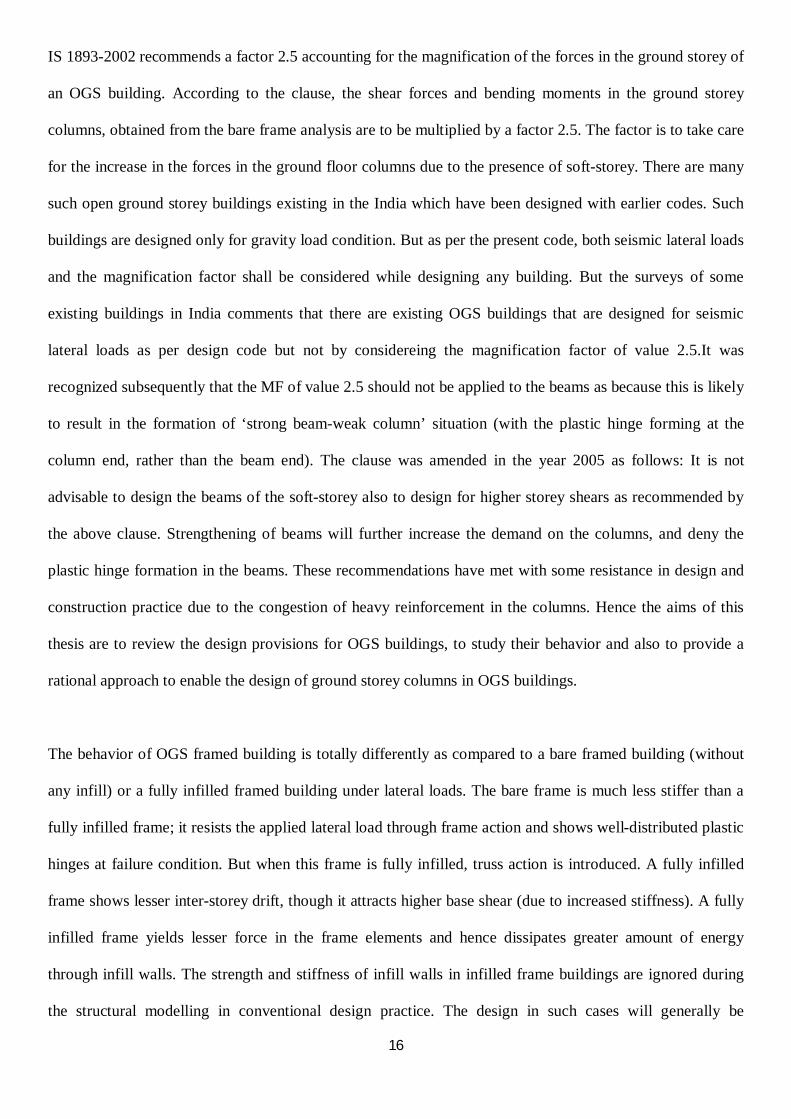
IS 1893-2002 recommends a factor 2.5 accounting for the magnification of the forces in the ground storey of
an OGS building. According to the clause, the shear forces and bending moments in the ground storey
columns, obtained from the bare frame analysis are to be multiplied by a factor 2.5. The factor is to take care
for the increase in the forces in the ground floor columns due to the presence of soft-storey. There are many
such open ground storey buildings existing in the India which have been designed with earlier codes. Such
buildings are designed only for gravity load condition. But as per the present code, both seismic lateral loads
and the magnification factor shall be considered while designing any building. But the surveys of some
existing buildings in India comments that there are existing OGS buildings that are designed for seismic
lateral loads as per design code but not by considereing the magnification factor of value 2.5.It was
recognized subsequently that the MF of value 2.5 should not be applied to the beams as because this is likely
to result in the formation of ‘strong beam-weak column’ situation (with the plastic hinge forming at the
column end, rather than the beam end). The clause was amended in the year 2005 as follows: It is not
advisable to design the beams of the soft-storey also to design for higher storey shears as recommended by
the above clause. Strengthening of beams will further increase the demand on the columns, and deny the
plastic hinge formation in the beams. These recommendations have met with some resistance in design and
construction practice due to the congestion of heavy reinforcement in the columns. Hence the aims of this
thesis are to review the design provisions for OGS buildings, to study their behavior and also to provide a
rational approach to enable the design of ground storey columns in OGS buildings.
The behavior of OGS framed building is totally differently as compared to a bare framed building (without
any infill) or a fully infilled framed building under lateral loads. The bare frame is much less stiffer than a
fully infilled frame; it resists the applied lateral load through frame action and shows well-distributed plastic
hinges at failure condition. But when this frame is fully infilled, truss action is introduced. A fully infilled
frame shows lesser inter-storey drift, though it attracts higher base shear (due to increased stiffness). A fully
infilled frame yields lesser force in the frame elements and hence dissipates greater amount of energy
through infill walls. The strength and stiffness of infill walls in infilled frame buildings are ignored during
the structural modelling in conventional design practice. The design in such cases will generally be

17
conservative in the case of fully infilled framed building than others. But things will be somewhat different
for an OGS framed building. OGS building being slightly stiffer than the bare frame, has larger storey drift
(especially in the ground storey), and fails due to soft storey-mechanism at the ground floor. Therefore, it
may not be conservative to ignore strength and stiffness of infill wall while designing OGS buildings.
The failure pattern observed in the buildings during the Jabalpur earthquake in 1997 showed higher
vulnerability of OGS buildings. Some reinforced concrete framed building which collapsed partially, had
open ground storey on one side, and brick infill walls on the other side.
1.2 TYPICAL MASONRY INFILLED BUILDINGS
Typical masonry infilled frames contain infill walls throughout the building in all storeys uniformly.
Although infill walls are known to provide the stiffness and strength to the building globally, these are
considered as ‘non-structural’ by design codes and are commonly ignored in the design practice for more
convenience. The presence of infill walls in a framed building not only enhance the lateral stiffness in the
building, but also alters the transmission of forces in beams and columns, as compared to the bare frame. In
a bare frame, the resistance to lateral force occurs by the development of bending moments and shear forces
in the beams and columns through the rigid jointed action of the beam-column joints. In the case of infilled
frame, a substantial truss action can be observed, contributing to reduced bending moments but increased
axial forces in beams and columns, (Riddington and Smith, 1977; Holmes, 1961).The infill in each panel
behaves somewhat like a diagonal strut as shown in Fig. below.

18
a) Infilled frame b) deformed frame c) equivalent strut model
Fig.1.3 showing behavior of infilled frame building
Hence these infill walls are beneficial to the building, only when they are evenly placed in plan and
elevation. These infill walls come to rescue the structure at worst lateral loads such as seismic loading
and wind loading owing to its high stiffness and strength.
1.3 OPEN GROUND STOREY (OGS) BUILDINGS
The presence of infill walls in the upper storeys of the OGS building increases the stiffness of the
building, as seen in a typical infilled framed building. Due to increase in the stiffness, the base shear
demand on the building increases while in the case of typical infilled frame building, the increased
base shear is shared by both the frames and infill walls in all the storeys. In OGS buildings, where the
infill walls are not present in the ground storey, the increased base shear is resisted entirely by the
columns of the ground storey, without the possibility of any load sharing by the adjoining infill walls.
The increased shear forces in the ground storey columns will induce increase in the bending moments
and curvatures, causing relatively larger drifts at the first floor level. The large lateral deflections
further results in the bending moments due to the P-Δ effect. Plastic hinges gets developed at the top
and bottom ends of the ground storey columns. The upper storeys remain undamaged and move
almost like a rigid body. The damage mostly occurs in the ground storey columns which is termed as

19
typical ‘soft-storey collapse’. This is also called a ‘storey-mechanism’ or ‘column mechanism’ in the
ground storey as shown in the figures below. These buildings are vulnerable due to the sudden
lowering of stiffness or strength (vertical irregularity) in the ground storey as compared to a typical
infilled frame building.
Fig 1.4 showing difference in behavior between bare, infill and OGS building frame
1.4 STUDY AREA
The accurate analysis of the OGS buildings requires the modeling of such building frames with infill walls
for its stiffness and strength. There are many implications of considering infill walls in the OGS buildings
but our aims for the case study or the area of our concern are stated below:
a) The project illustrates a simple computer-based analysis technique called pushover analysis for
performance-based design of building frameworks subjected to earthquake loading.
b) The technique is commonly based on the conventional displacement method of elastic analysis under
constant gravity loads and incrementally increasing lateral loads.
20
c) Such inelastic analysis procedures help to demonstrate how building really performs by identifying
the failure modes and the potential for progressive collapse.
For this there should be a clear need to assess the design guidelines recommended by
various codes. Existing recommendations for the design of OGS buildings do not depend on the factors such
as number of storeys, number of bays, type and the number of infill walls present, etc.
1.5 OBJECTIVES OF THE THESIS
From the above discussion the objectives of the present study can be figure out as follows:
To study the behavior of Open Ground Storey buildings designed considering the magnification
factor (M.F.) suggested by various codes (Indian & UBC Code).
To study the performance and behavior of the typical OGS buildings using pushover analysis and
capacity spectrum method.
1.6 SCOPE OF THE STUDY
Open ground storey (OGS) buildings have been most common nowadays and are constructed heavily in high
populated countries like India since they provide much needed parking space in an urban environment.
Failures observed in past earthquakes proved that the collapse in such buildings is predominantly due to the
formation of soft-storey mechanism in the columns of the ground storey building.
The scope of this project are summarized as:
RC framed Buildings, which is regular in plan
4-10 storey buildings without basement and shear wall.
Infill walls non-integrated with RC frames.
Concept of out of plane action of masonry not taken into account

21
Asymmetric arrangement of the infill walls neglected
The effect of soil structure interaction is ignored
Flexibility of floor diaphragms rejected
The base of the column is assumed to be fixed and hinged.
a) The study of this project deals with two different types of support conditions commonly used in
analysis and design i.e. fixed and hinged suppots. All other types of support conditions are ignored.
Soil-structure interaction is also ignored for the present study.
b) Number of storeys and number of bays in two orthogonal horizontal directions have a great effect on
the lateral load resisting behavior of the OGS buildings. However, the conclusions drawn in the
present study are based on the case study 4 storeyed and 10 storeyed buildings.
c) It is assumed that the infill panels don’t have any window and door openings while modelling the
infill walls.
d) Only the plastic flexural hinge is considered for modelling the frame elements as the building is
designed as per current design codes of practices which assumes no shear failure will precede the
flexural failure.
e) In the present study building models are analyzed using linear static analysis, dynamic analysis and
nonlinear static (pushover) analysis. Although nonlinear dynamic analysis being superior to other
analysis procedures, and is kept outside the scope of the present study due to time limitation.
1.7 METHODOLOGY
The methodology followed out to achieve the above-mentioned objectives is as follows:
(i) Review of the existing literatures by different researchers and also by the Indian design code
provision for designing the OGS building
(ii) Selecting the building models for the case study.

22
(iii) Modelling of the selected buildings with and without considering their infill strength and
stiffness. Models need to consider the above mentioned two types of end support conditions.
(iv) Performing nonlinear analysis of the selected building models and a comparative study on the
results obtained from the analyses.
(v) Finally the observations of results and discussions
1.9 ORGANIZATION OF THE THESIS
This introductory chapter (Chapter 1) gives a brief introduction towards the importance of the seismic
evaluation of OGS buildings by considering the MF and the reason why they are adopted by the designers
despite of the fact that they are more vulnerable during earthquake. The need, objectives and scope of the
proposed project work are identified along with the methodology that will be followed to carry out the work.
Chapter 2 presents the literature survey on the behavior of OGS buildings with and without infill walls
during earthquake, along with the description of the selected building and the structural modelling
parameters and modelling of infill walls. This chapter also comments on the procedures and important
parameters to model the nonlinear plastic hinges point.
Results obtained from the linear analysis of the building modelled considering the various cases are
presented in the third chapter. This chapter critically evaluate the linear analysis results to compare the
building responses and behavior with and without considering infill strength and stiffness of the building.
Nonlinear analysis is an important tool to evaluate the seismic performance of a building correctly and
effectively. Nonlinear static (pushover) analysis of the considered building models are carried out as part of
this project and the corresponding results and observations are presented in the same chapter.
Finally in Chapter 4, the summary and the conclusions of the entire project are illustrated.

23
CHAPTER 2
LITERATURE REVIEW
2.1 Introduction
Here in this chapter we will be discussing about three different sub topics. In the very first unit we will
discuss an overview of existing design provisions for OGS buildings as per various design codes. In the next
one we will discuss about different concepts and literatures given by the researchers some of them are:
(Scarlet, 1997; Kaushik, 2006; Fardis et. al.,1999; Arlekar et. al., 1997; Hashmi and Madan, 2008) based on
the open ground storey building frame and finally in the last unit we will discuss about the behavior of OGS
in the presence and absence of the infill wall.
2.2 Provisions in various codes
2.2.1 IS code 1893-2002 recommendations
The OGS buildings is considered to be as extreme soft-storey type of buildings in most of the practical
situations, and shall be designed considering special provisions so as to increase the stiffness in lateral
direction or strength of the soft/open ground storey. A dynamic analysis is suggested which includes the
strength and stiffness effects of infill walls and also the inelastic deformations of members, particularly
suggested in those soft-storey of such buildings. The members in the soft/open storey shall be designed as
per suggested by the codes considered in this project. However, IS 1893-2002, does not give any explicit
recommendations on the modelling of the infills for the open ground stroey building frame.
In the absence of infill wall, more accurate analysis such as dynamic analysis, an equivalent static lateral
load analysis neglecting the infill walls, that is, a bare frame analysis, can be employed provided the bending

24
moments and the shear forces in the critical members (columns in the ground storey) shall be enhanced by
the factor as recommended by the code. The code recommendation to magnify the above forces for the
equivalent static analysis (bare frame) for the columns in the soft/open storey is by a factor of 2.5. This
multiplication factor will be responsible for compensating the vertical irregularity of the building frame.
2.2.2 Conventional design practice
Conventional design practice follows the equivalent static analysis i.e. linear static analysis, ignoring the
stiffness of the infill walls. This bare frame analysis as suggested by the design code, is preferable because
the modeling of infill walls is much required for the design office environment. Moreover, inelastic dynamic
analysis, which includes the degradation of stiffness and strength of infill walls can be quite complicated.
A check on the stiffness ratio (k0/k1, where k0 and k1 are the stiffness in the lateral direction of ground
storey and first storey respectively), will almost invariably, yield at a value less than 0.7 in OGS buildings.
Hence the shear forces and bending moments of the ground storey columns, calculated from an equivalent
static analysis of the bare frame ignoring the stiffness of infill walls, should be multiplied by a factor of 2.5
for design purposes as suggested by the code. In some of the cases, especially in the presence of infill walls
with large openings, the OGS frame may resemble to be vertically regular as per the code, and strictly, as
per the code, no multiplication of column forces in the ground storey is required.
An approach similar to IS 1893 -2002 is followed by the European codes, except that the expression used for
the multiplication factor being different.
2.2.3 Provisions in other codes
The provisions given in other design codes are discussed here in this unit. EC 8 (2004) recommends some
additional design guidelines for building with vertical irregularity which arises due to the presence of infill
walls. Although quantitative limit criteria has not been suggested by EC 8 (2004) to check the vertical
irregularity, as in other codes. If in case there is a drastic reduction of infill walls in any storey compared to
the adjoining storeys, seismic forces in the less infilled storey i.e. ground storey of OGS building shall be
increased by a multiplication factor (MF) as given by the following expression,

25
( 1+ ΔVRw/VB )
Where ΔVRw being the total reduction in the lateral resistance of masonry infill wall in the ground storey as
compared to that in the upper storey. As there is no infill wall present in the ground storey of an OGS
building, ΔVrw is equal to the resistance of masonry in the first storey itself. VB being the design base shear
of the building. The ratio of strength of the masonry infill in the first storey to the design base shear of the
same building governs the multiplication factor, MF. The term q is known as the behavior factor and is
expected to fall in between 1.5 to 4.7, Kaushik (2006). Hence the MF will be as high as 4.7 in certain cases.
According to Fardis and Panagiotakos (1997), the MF factor value suggested by EC 8 (2004) is such a high
that it may lead to over-reinforcement in the columns of the ground storey.
2.3 Concepts given by (Scarlet, 1997; Kaushik, 2006; Fardis et. al.,1999; Arlekar et. al.,
1997; Hashmi and Madan, 2008) and others
Fardis et. al. (1999) noted out that the MF proposed by the EC 8 (2004) expression not only results to
higher seismic forces and reinforcements to the building frame but also lacks a rational basis. Due to these
reasons, despite of its general effectiveness in protecting the columns of the soft ground storey buildings,
MF proposed by Euro code needs to be revised. A revision was also proposed in this study at the end based
on capacity based design for the beams of the open ground storey.
Kaushik (2006) commented that the ambiguity in the use of expression given by EC 8 (2004) for infilled
building frames. It is seen that the natural time period of vibration of the infilled building frames suggested
by EC 8 (2004) for the estimation of base shear is an inverse function of the total area of the infill walls in
the ground storey frame. For OGS type of buildings, the natural time period of vibration becomes
unrealistically much higher due to zero value of area of infill wall in the ground storey. However, he is
26
unable to mention it clearly whether this expression for natural time period of vibration can be used for OGS
buildings or not.
ASCE 7 (2005) and IS 1893 (2002) provides the similar kind of definitions and assumptions for the
classification of vertical irregularity. ASCE 7 (2005) does not permit the buildings with extreme irregularity
such as OGS buildings with more than two storeys or building height being more than 9 m.
SEAOC (1994) recommends a multiplication factor of 3R/8 (average value of response reduction factor, R =
8) for OGS buildings, Scarlet (1997). This will result a value of MF of around three. It is also clear from the
above expression that the MF is completely independent and is no related with that of the amount of
irregularity present in the building.
Kaushik (2006) performed a comprehensive survey of the approaches of various codes in dealing with the
vertical irregularity, and hence showed that BCDBSS (1987), SII (1995), FCEACR (1986) and NBC
(1995b) are not consistent and applicable with regard to the design of OGS buildings.
BCDBSS (1987) suggests that any storey is a soft-storey if the lateral stiffness is less than 50% of that of
adjacent storey. The beams and columns of the ground storey building frame shall be designed for three
times the design seismic force corresponding to regular bare frame with an addition of 50% increment in the
base shear.
According to the SII (1995), a storey is considered to be as a soft storey, if the lateral stiffness is less than
70% of that of the storey above, or less than 80% of average stiffness of three storeys above, also which
contains less than half of the length of the infill walls, as compared to the storey above it, at least in one of
its principal directions. A storey is differentiated as a weak storey if the lateral shear capacity in any
direction is less than 80% of that of the storey above in the same direction. This code allows soft or weak
storey, including the open ground storey, only in buildings with lower or medium ductility levels. The
design forces for weak or flexible storey members, and for the members in the storey just above and below,

27
are required to be increased by a factor 0.6R, where R being the response reduction factor. For masonry
infilled RC frame buildings, R is taken as 3.5 for low ductility level, and 5.0 for medium ductility level.
Therefore, the beams and columns of the soft/weak storey building frame along with that of the adjacent
storeys are required to be designed for the value of at least 2.1-3.0 times the design forces for regular storey,
depending upon the level of ductility. SII (1995) grants the design of extremely weak storeys whose shear
resistance being less than 65% of that of the adjacent storey, in buildings having height up to 2 storeys or
9m, whichever is less. The height restriction is compensated if the total strength of weak storey in the lateral
direction and adjacent storeys above and below is more than 0.75R times the seismic design base shear of
that building.
NBC (1995b) limits the vertical irregularity of a building frame using some rules. And according to him
there should be at least two lateral load resisting walls present along the two principal directions at any level
of the building. He provided a clear idea from the observation of various code provisions that there is no
consensus among different codes to address the vertical irregularity arising due to open storeys, although
some provisions being similar.
2.4 BEHAVIOR IN THE PRESENCE OF INFILL WALL
Under lateral load condition the frame and the infill wall tends to stay intact initially. As the lateral load is
increased the infill wall gets separated from the surrounding frame at the unloaded (tension) corner, but at
the compression corners the infill walls remaining still intact in position as previously. The length over
which the infill wall and the frame are intact in position is called the length of contact. Load transfer in the
wall occurs through an imaginary diagonal which acts like a compression strut member. Due to this behavior
of the infill wall, they can be modelled as an equivalent diagonal strut by connecting the two compressive
corners diagonally. The property of the stiffness should be such that the strut is active only when subjected
to compression. Thus, only under lateral loading one diagonal will be operating at a time. This new and
unique concept was first put forward by Holmes (1961).

28
Fig 2.1 showing the behavior of infill frame
The effect of slip and interface friction between the frame and the infill wall was first investigated by
Mallick and Severn (1967) using finite element analysis method. The infill panels were simulated by means
of linear elastic rectangular finite elements, with dual degrees of freedom present at each of the four corner
nodes. Interface between frame and infill was modelled accordingly and contact length was calculated. The
slip between the frame and the infill was taken into account by considering frictional shear forces in the
contact region using link element. Each node of this element has altogether two degrees of freedom in the
translational direction. The element was now able to transfer compressive and bond forces, but was
incapable of resisting tensile forces. Rao et. al. (1982) performed theoretical and experimental studies on
infilled frames with opening strengthened by lintel beams. He concluded that the lintel over the opening
does not provide any influence on the lateral stiffness of an infilled frame. Karisiddappa (1986) and
Rahman (1988) verified the effect of openings and their location on the behavior of single storey RC frames
with brick infill walls.
There are many such studies on infilled frames under cyclic and dynamic loading condition. Choubey and
Sinha (1994) examined the effect of various parameters such as separation of infill wall from frame, plastic
deformation, stiffness and energy dissipation of infilled frames under cyclic loading condition. Arlekar et.al
(1997) reported the behavior of RC framed OGS building when subjected to seismic loads. A four storeyed
29
OGS building was analyzed using Equivalent Static Analysis and Response Spectrum Analysis method to
figure out the resultant forces and displacements. This thesis verifies that the behavior of OGS frame is quite
different from that of the bare frame.
The effect of the parameters such as plan aspect ratio, relative stiffness, and number of bays on the behavior
of infilled frame was examined by Riddington and Smith (1997). Scarlet (1997) provided the qualification
of seismic forces in OGS buildings. A multiplication factor only applicable for OGS building was proposed
for the base shear of the building. This procedure requires the modelling of the stiffness of the infill walls in
the analysis. The study proposed that as the multiplication factor ranges from 1.86 to 3.28 as the number of
storey increases from six to twenty. Deodhar and Patel (1998) noted that even though the brick masonry in
infilled frame are non-structural element, they can have considerable influence on the lateral response on the
designed building.
Davis and Menon (2004) concluded that the presence of masonry infill panels in a building frame modifies
the structural force distribution significantly in an OGS building frame. The total shear force of the building
increases as the stiffness of the building increases in the presence of masonry infill at the upper floor of the
building. Apart from this they also concluded that the bending moments in the ground floor columns
increase approximately by more than two folds, and the mode of failure is basically by the soft storey
mechanism i.e. by the formation of hinges in ground floor columns of the building frames. Das and Murthy
(2004) commented that the presence of infill walls in a structure, generally bring down the damage resulted
by the RC framed members of a fully infilled frame during earthquake shaking. The columns, beams and
infill walls of lower stories are comparatively more vulnerable to damage than those in upper stories.
Asokan (2006) examined how the presence of masonry infill walls in the frames of a building behaves due
to the lateral stiffness and strength of the structure. This research put forwarded a plastic hinge model for
infill wall to be used during nonlinear performance based analysis of a building which concludes that the
ultimate load (UL) approach along with the proposed hinge property providing a better estimate of the
inelastic drift of the building.

30
Hashmi and Madan (2008) performed a non-linear time history analysis along with pushover analysis of
OGS buildings. The study comments that the MF as suggested by IS 1893(2002) for such buildings is
adequate for preventing collapse.
Sattar and Abbie (2010) in their study pointed out that the pushover analysis showed an increase in initial
stiffness, strength, and energy dissipation of the infilled frame as compared to the bare frame analysis,
despite of the wall’s brittle failure modes. Likewise, dynamic analysis results concluded that the fully-
infilled frame has the lowest collapse risk and the bare frames were found to be the most vulnerable to
earthquake-induced collapse comparativey. The better collapse performance of the fully-infilled frames is
limited with the larger strength and energy dissipation of the system which is resulted due to the added
walls.
There are numerous such research efforts available on this topic seismic behavior of OGS buildings and also
on the modelling of the infill walls for linear and nonlinear analysis.
2.5 SUMMARY
This chapter briefly discusses the previous work performed on the area of seismic behavior of the open
ground storey RC buildings and modelling of the infill walls as equivalent diagonal strut. From these
published work it has to be concluded that that even though the brick masonry in infilled frame are intended
to be non-structural in behavior, they have a considerable influence on the lateral response of the building.
The concept of having multiplication factor is to increase the design forces of ground storey columns and
beams of OGS buildings which is a function of storey numbers. IS 1893:2002 (Part-1) proposal for
multiplication factor of 2.5 may not be appropriate for the building in Indian condition.

31
CHAPTER 3
PROJECT WORK
3.1 GENERAL
To perform any sort of analysis i.e. linear/non-linear, static/dynamic it’s necessary to develop a
computational model. Hence in this chapter we will discuss the parameters defining the computational
models, the basic assumptions and the geometry of the selected building considered for this study. A
detailed description on the nonlinear modelling of RC building frames is discussed in this chapter.
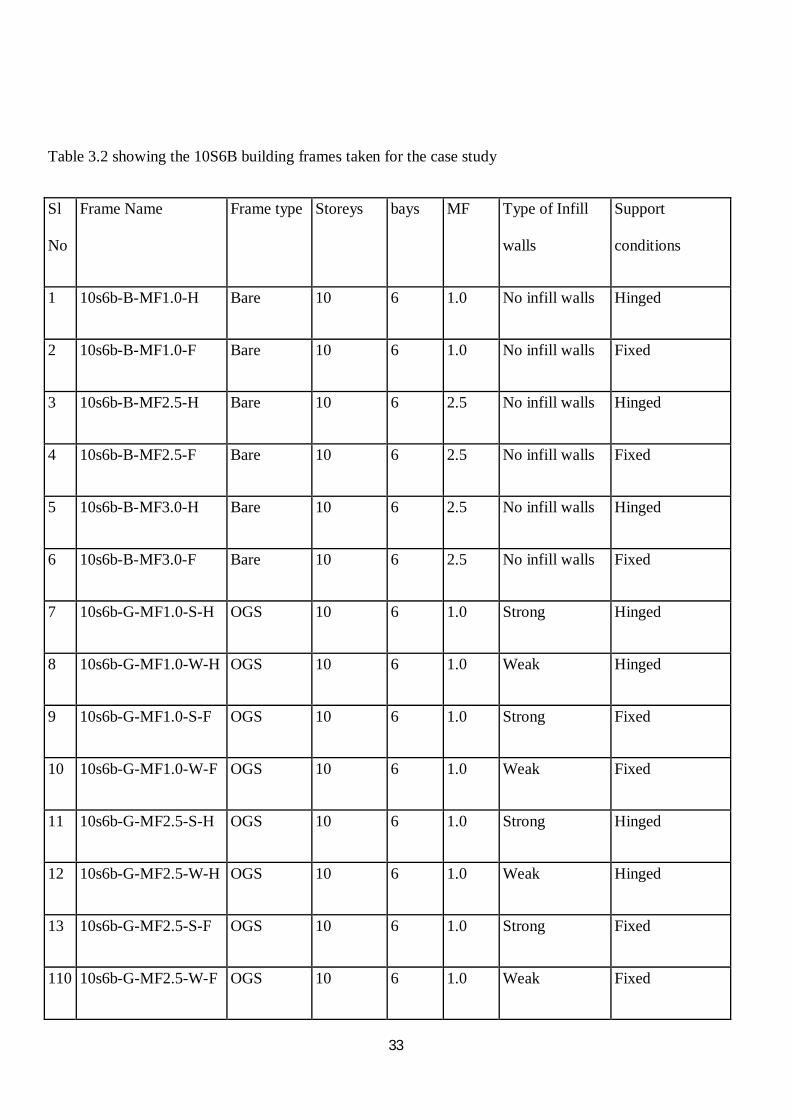
3.2 EXAMPLE FRAMES
The type of building frames considered for the case study is vertically irregular. The buildings were of 4 &
10 storeyed with the number of bays remaining constant i.e. 6. Types of building frames considered are
shown in the table below:
Table 3.1 showing the 4S6B building frames taken for the case study
Sl
No
Frame Name Frame type Storeys bays MF Type of Infill
walls
Support
conditions
1 4s6b-B-MF1.0-H Bare 4 6 1.0 No infill walls Hinged
2 4s6b-B-MF1.0-F Bare 4 6 1.0 No infill walls Fixed
3 4s6b-B-MF2.5-H Bare 4 6 2.5 No infill walls Hinged
4 4s6b-B-MF2.5-F Bare 4 6 2.5 No infill walls Fixed

32
5 4s6b-B-MF3.0-H Bare 4 6 2.5 No infill walls Hinged
6 4s6b-B-MF3.0-F Bare 4 6 2.5 No infill walls Fixed
7 4s6b-G-MF1.0-S-H OGS 4 6 1.0 Strong Hinged
8 4s6b-G-MF1.0-W-H OGS 4 6 1.0 Weak Hinged
9 4s6b-G-MF1.0-S-F OGS 4 6 1.0 Strong Fixed
10 4s6b-G-MF1.0-W-F OGS 4 6 1.0 Weak Fixed
11 4s6b-G-MF2.5-S-H OGS 4 6 1.0 Strong Hinged
12 4s6b-G-MF2.5-W-H OGS 4 6 1.0 Weak Hinged
13 4s6b-G-MF2.5-S-F OGS 4 6 1.0 Strong Fixed
14 4s6b-G-MF2.5-W-F OGS 4 6 1.0 Weak Fixed
15 4s6b-G-MF3.0-S-H OGS 4 6 1.0 Strong Hinged
16 4s6b-G-MF3.0-W-H OGS 4 6 1.0 Weak Hinged
17 4s6b-G-MF3.0-S-F OGS 4 6 1.0 Strong Fixed
18 4s6b-G-MF3.0-W-F OGS 4 6 1.0 Weak Fixed
19 4s6b-F-MF1.0-S-H Full Infilled 4 6 1.0 Strong Hinged
20 4s6b-F-MF1.0-W-H Full Infilled 4 6 1.0 Weak Hinged
21 4s6b-F-MF1.0-S-F Full Infilled 4 6 1.0 Strong Fixed
22 4s6b-F-MF1.0-W-F Full Infilled 4 6 1.0 Weak Fixed
33
Table 3.2 showing the 10S6B building frames taken for the case study
Sl
No
Frame Name Frame type Storeys bays MF Type of Infill
walls
Support
conditions
1 10s6b-B-MF1.0-H Bare 10 6 1.0 No infill walls Hinged
2 10s6b-B-MF1.0-F Bare 10 6 1.0 No infill walls Fixed
3 10s6b-B-MF2.5-H Bare 10 6 2.5 No infill walls Hinged
4 10s6b-B-MF2.5-F Bare 10 6 2.5 No infill walls Fixed
5 10s6b-B-MF3.0-H Bare 10 6 2.5 No infill walls Hinged
6 10s6b-B-MF3.0-F Bare 10 6 2.5 No infill walls Fixed
7 10s6b-G-MF1.0-S-H OGS 10 6 1.0 Strong Hinged
8 10s6b-G-MF1.0-W-H OGS 10 6 1.0 Weak Hinged
9 10s6b-G-MF1.0-S-F OGS 10 6 1.0 Strong Fixed
10 10s6b-G-MF1.0-W-F OGS 10 6 1.0 Weak Fixed
11 10s6b-G-MF2.5-S-H OGS 10 6 1.0 Strong Hinged
12 10s6b-G-MF2.5-W-H OGS 10 6 1.0 Weak Hinged
13 10s6b-G-MF2.5-S-F OGS 10 6 1.0 Strong Fixed
110 10s6b-G-MF2.5-W-F OGS 10 6 1.0 Weak Fixed

34
15 10s6b-G-MF3.0-S-H OGS 10 6 1.0 Strong Hinged
16 10s6b-G-MF3.0-W-H OGS 10 6 1.0 Weak Hinged
17 10s6b-G-MF3.0-S-F OGS 10 6 1.0 Strong Fixed
18 10s6b-G-MF3.0-W-F OGS 10 6 1.0 Weak Fixed
19 10s6b-F-MF1.0-S-H Full Infilled 10 6 1.0 Strong Hinged
20 10s6b-F-MF1.0-W-H Full Infilled 10 6 1.0 Weak Hinged
21 10s6b-F-MF1.0-S-F Full Infilled 10 6 1.0 Strong Fixed
22 10s6b-F-MF1.0-W-F Full Infilled 10 6 1.0 Weak Fixed
Apart from variations in height we have considered other variations in the type of building frames for this
project. The same frames were redesigned for other different cases like variation in their base support (fixed
and hinged), types of infill wall provided (strong and weak)and also in terms of Open Ground Storey (OGS)
introducing a term called Magnification factor (MF).
3.3 MAGNIFICATION FACTOR (MF)
It is a factor which is considered when any building frame is designed ignoring its infill wall but considering
its weight i.e. for OGS type of building. Since we know that the function of infill wall in a building is to
provide stiffness to the building so that it can stand on the surface but since we neglect infill wall in such
building, the purpose of providing that stiffness and help any building to stand is provided by other element
which is column. Whatever load the building was withstanding is now multiplied by this MF value so that it
can stand still by providing sufficient stiffness. Talking about MF value there are several codes which
suggests different values of MF. But in our case we have considered the Indian Code which suggests the MF

35
value to be 2.5 and the other one we have accounted is UBC code or Bulgarian Code which suggests the
value of 3.0.
Table 3.3: Different codes with their suggested magnification factor value
Code Name Magnification Factor (MF)
Indian Standard Code 2.5
Kaushi (2006) <2.5
Euro Code 1.6-4.7
Israeli Code 2.1-3
UBC/Bulgarian Code 3.0
Note: Initially all buildings were designed by MF value 1.0 as reference.
3.4 TYPES OF BUILDING FRAMES CONSIDERED
Overall the different types of building frames are modelled given below:
1. Bare frame
2. OGS building considering different MF as suggested by various codes.
3. Fixed support
4. Hinged support
5. Weak infill
6. Strong infill
3.5 SEISMIC DESIGN DATA
Table 3.4 showing seismic data assumed for the analysis
Sl No.
Design Parameter Value
1 Seismic Zone V 2 Zone factor (Z) 0.36

36
3 Response reduction factor (R) 5 4 Importance factor (I) 1 5 Soil type Medium soil 6 Damping ratio 5% 7 Frame Type Special Moment Resisting Frame
3.6 MATERIAL PROPERTIES
Table 3.5 Material Properties and geometric parameters Assumed
Sl No.
Design Parameter Value
1 Unit weight of concrete 25 kN/m3 2 Unit weight of Infill walls 18kN/m3 3 Characteristic Strength of concrete 25 MPa 4 Characteristic Strength of concrete 415 MPa 5 Compressive strength of strong masonry (Em) 5000MPa 6 Compressive strength of weak masonry (Em) 350MPa 7 Modulus of elasticity of Masonry Infill walls (Em) 750f’m 8 Damping ratio 5% 9 Modulus of elasticity of steel 2E5 MPa 9 Frame Type Special Moment Resisting
Frame 10 Slab thickness 150 mm 11 Wall thickness 230 mm
3.7 STRUCTURAL ELEMENTS
The dimensions of the elements of the structure were:
1. Beam : 230 mm x 350 mm
2. Column : 300 mm x 300 mm
3. Slab thickness : 150 mm
4. Wall thickness : 230 mm
5. Parapet height : 230 mm

37
3.8 LOADS CONSIDERED
The types of load considered during the design were:
1. Self-weight of beams and columns
2. Weight of slab
3. Infill weight
4. Parapet weight
5. Floor finish of 1.5 KN/m2
6. Live load of 3 KN/m2(as per IS 1893-2002)
3.9 DESIGN OF BUILDING FRAMES
All the above building frames were first designed in the software called Staad Pro. After designing in the
software, necessary data such as shear forces, bending moment, axial load, reinforcement detailing of each
beam and column were imported to another software called SAP for modelling purpose.
3.10 STRUCTURAL MODELLING
All the above structures were now ready for modelling and were about to be modelled in the software SAP.
As per our objective we were focused on the behavior analysis of the building frame here in this step we
introduced the type of non-linear analysis to study the behavior said to be as pushover analysis.
3.10.1 PUSHOVER ANALYSIS
Pushover analysis is a static, nonlinear procedure to analysis any building where the building is loaded
incrementally with a certain definite predefined pattern (i.e., inverted triangular or uniform). Local non-
linear effects are modelled and the structure is pushed until a collapse mechanism is developed in the same
building. With increase in the magnitude of loads, weak links and failure modes of the building are

38
observed. At each step, the structure is pushed until enough hinges form to develop a curve between base
shear and the corresponding roof displacement of the building and this curve commonly known as pushover
curve.At each step, the total base shear and the top displacement are plotted to get this pushover curve at
various phases.this gives an idea of the maximum base shear that the structure is capable of resisting and the
corresponding inelastic drift that it can overcome. For regular buildings, it also gives the estimate of global
stiffness of the building. The pushover curve diagram is shown below:
Fig.3.1 showing pushover curve
The popularity of pushover analysis is based on the fact that it can predict the sequence offailure of the
different members in a building.
3.10.2 STRUCTURAL ELEMENTS MODELLING
Beams and columns
They are modelled as frame elements with central lines joining at nodes.
Beam-column joints
The rigid beam-column joints are modelled by giving end offsets at the joints. A rigid zone factor of 1.0 was
taken.
Bas
e She
ar(V
)
Roof Displacement ()
Base Shear (V)

39
Slabs
The floor slabs are assumed to act as diaphragms, ensuring the integral action of all the vertical lateral load-
resisting elements. The weight of the slab was distributed in triangular and trapezoidal form to the
surrounding beams as per IS 456:2000.
3.10.2.1 MODELLING OF BEAMS AND COLUMNS
In pushover analysis, it is required to model the non-linear incremental load versus deformation behavior of
each element. The beams and columns are modelled as frame elements and the infill walls as equivalent
struts by truss elements. Since the deformations are expected to go beyond the elastic range in the analysis, it
is necessary to model the non-linear incremental load versus deformation behavior of the members. The
non-linear behavior of the building is incorporated in the load versus deformation property of a concentrated
hinge attached to the member. A beam of any section is assigned with a moment versus rotation curve where
a hinge is expected to develop. In addition to that a shear force versus shear deformation curve is defined to
model for the possible shear failure at any section. Similarly, a column is also assigned with flexural and
shear hinges with moment versus rotation diagram. For equivalent strut, the hinge is placed at the middle of
the strut with an assigned axial load versus deformation curve.
3.10.2.2 PERFORMANCE LEVELS OF BEAMS AND COLUMNS
The performance of any building frame is a combination of the performance of all its structural and non-
structural components as a whole. The performance levels are nothing but the discrete damage states
identified from a continuous spectrum of possible damage states. The structural performance levels based on
the roof drifts are as follows (FEMA 356, 2000).
i) Immediate occupancy (IO)
ii) Life safety (LS)
iii) Collapse prevention (CP)

40
Fig.3.2 showing Performance level of beam and column
The three levels are arranged according to decreasing order of performance for the lateral load resisting
systems. The element performance levels are defined by values of the deformation of the particular
structural element. There are three performance levels as defined in the load versus deformation curve for
the hinges of the element. An idealized load versus deformation curve is shown in fig. above. It is a piece-
wise linear curve defined by five points as explained below.
(i) Point ‘A’ corresponds to no load condition point.
(ii) Point ‘B’ corresponds to the initiation of yielding.
(iii) Point ‘C’ corresponds to the ultimate strength point.
(iv) Point ‘D’ corresponds to the residual strength point. For computational stability, it is
recommended to specify non-zero residual strength point beyond C. In the absence of the
modelling of the descending branch of a load versus deformation curve, the residual
strength is assumed to be 20% of the yield strength.
X
IO
LS
CP
41
(v) Point ‘E’ corresponds to the maximum deformation capacity with the residual strength.
To maintain computational stability, a high value of deformation capacity is assumed
normally.
The performance levels (IO, LS, and CP) of a structural element are represented in the load versus
deformation curve as shown in the above diagram. Usually all the performance levels are represented in the
BC region (ATC 40, 1996).
3.10.2.3 NON-LINEAR HINGE PROPERTIES OF BEAMS AND COLUMNS
The force versus deformation curves in flexure and shear were obtained from the reinforcement details from
the staad pro design and were assigned in all the columns and primary beams for the analysis. The flexural
hinges (M3) and shear hinges (V2) were assigned for the beams at two ends. Flexural hinges (PMM) and
shear hinges (V2 and V3) were also given for all the columns both at upper and lower ends.
Formation of hinges in beams and columns during bare frame analysis is shown below.
The diagram below clearly shows the hinge formed in the bare frame of 4 storey with MF value 2.5.

42
Fig 3.3 showing the hinged formed in the building frame
This diagram suggests the points and locations where the frame will undergo failure during earthquake. The
points with different colors indicate the types of vulnerability of hinges formed in the given building
frame.
3.10.3 PUSHOVER ANALYSIS
The gravity loads were assigned in all the beams and pushover analysis is done for the gravity loads
(DL+0.25LL) incrementally under load control. The lateral pushover analysis PUSH was followed after the
gravity pushover, under displacement control. The building is pushed in lateral direction until the formation
of collapse mechanism. One of the example of pushover curve of the corresponding building frame is shown
below.

43
Fig 3.4 showing an example of pushover curve of 4S bare frame
3.10.4 MODELLING OF INFILL WALL
Infill walls are two dimensional elements that can be modelled with orthotropic plate element for linear
analysis of buildings with infill wall. But the nonlinear modelling of a two dimensional plate element is
not understood well. Therefore infill wall has to be modelled with a one-dimensional line element for
nonlinear analysis of the buildings. All of these buildings model with infill walls modelled as one-
dimensional line element is used in the present study for nonlinear analysis. Infill walls are modelled here
as equivalent diagonal strut elements.
In a linear structural analysis, the required properties of an equivalent strut are the effective width, thickness,
length and elastic modulus. The thickness (t) is assumed to be same as that of the infill wall. The length (d)
is the diagonal length of the frame. The remaining properties to be determined are the effective width (w)
and elastic modulus (Es) of the equivalent strut. The strength of the equivalent strut is required to check its
capacity with the axial load demand in the strut. The simplest form w and Es are taken equal to d/4 and Em
(modulus of masonry), respectively.
0
50
100
150
200
250
0 20 40 60 80 100
base
shea
r (KN
)
displacement (mm)

44
3.10.4.1 ELASTIC MODULUS OF EQUIVALENT STRUT
The elastic modulus of the equivalent strut Es can be equated to Em, the elastic modulus of the masonry.
Krishnakedar (2004) conducted a series of experiments on masonry prisms on various types of bricks in
India. Following range of values for Em were obtained.
Em= 350 to 800 MPa for table moulded bricks
Em= 2500 to 5000 MPa for wire cut bricks
3.10.4.2 NON-LINEAR HINGE PROPERTY FOR EQUIVALENT STRUT
The nonlinear hinge property for the infill walls is studied by various researchers for many years and a
recent study by Asokan (2006) reviewed the state of the art, combined all the previous experimental data and
recommended the following simplified piece-wise linear plastic hinge property, including many parameters.
The parameters considered are wall panel dimensions, grade of concrete, yield moments of the adjacent
beam and column, size of the adjoining columns, wall thickness, compressive strength, shear strength,
coefficient of friction between brick and mortar, interface coefficient of friction between frame and infill
wall etc. A typical hinge property for the equivalent strut suggested by Asokan (2006) is as shown in fig
below

45
Fig. 3.5 showing nonlinear hinged property of strut
3.10.5 COMPARISON OF BEHAVIOR OF BARE FRAMES DESIGNED WITH VARIOUS MF
The pushover analysis of all the frames discussed in the previous sections are conducted. The base shear
versus roof displacement at each analysis step are obtained. The pushover curves are presented in each
case.
Figure 3.6 shows pushover curves of bare frames designed for various MFs such as 1.0, 2.5 and 3.0. Initially
the base shear increases linearly with the roof displacement. After reaching a certain base shear the
building yields. The bare frame designed with MF =1 fail at a base shear of 180kN while other buildings
designed with MF =2.5 and 3.0 exhibit a higher capacity of 230kN. The increase in strength being 1.3
times more than that with MF 2.5. The buildings designed with MFs = 2.5 and 3.0 undergoes a higher
values of displacements as compared to that of MF =1.0. The ductility of buildings designed with MF =2.5
and 3.0 are marginally same and the value is about 3.2. While for the building designed with MF = 1.0, the
ductility factor is about 1.2.
C B IO LS CP Moment 0.2 δ 0.5 δ 0.9 δ D E δ A Rotation

46
Fig 3.6 showing pushover curves of 4s6b-B-MF1.0-F, 4s6b-B-MF2.5-F, 4s6b-B-MF3.0-F
Note:
1 denotes the building frame with MF value 1.0
2 denotes the building frame with MF value 2.5
3 denotes the building frame with MF value 3.0
Fig 3.7 shows the comparison of pushover curves of bare frames 4s6b-B-MF1.0-H, 4s6b-B-MF2.5-H, 4s6b-
B-MF3.0-H
0
50
100
150
200
250
0 10 20 30 40 50 60 70 80 90
BASE
SH
EAR
(KN
)
DISPLACEMENT (mm)
3 2.5 1
0
50
100
150
200
250
0 10 20 30 40 50 60 70 80 90
BASE
SH
EAR
(KN
)
DISPLACEMENT (mm)
1 2.5 3

47
From the above pushover curve we can say Base shear Capacity of a building
designed with MF of 3.0 & 2.5 is about 28% more than that designed with MF 1.0 also they can undergo deflection
twice than that with MF 1.0
From the above two pushover curves fig. 3.8 and 3.9 we can say that the nature
or the behavior of the building remains almost same for both fixed and hinged support condition. All their
parameters like magnitude of base shear, roof displacement and the ductility ratio is almost same for the
support condition and hence performs in the same manner. From this we can conclude that for frame
condition the performance of the building is independent of the type of support. Their performance remains
almost same throughout the loading period.
Fig 3.8 shows the comparison of pushover curves of bare frames 10s6b-B-MF1.0-F, 10s6b-B-MF2.5-F,
10s6b-B-MF3.0-F
From the graph above base shear capacity of a 10 storeyed building designed with MF of 3.0 & 2.5 is about
28 % more than that designed with MF 1.0 whereas the deflection vary by note more than 15 mm between
them.
0
500
1000
1500
2000
2500
3000
3500
0 10 20 30 40 50 60 70 80
BASE
SH
EAR
(KN
)
DISPLACEMENT (mm)
1 2.5 3

48
The graph below shows the pushover curves of bare frames for 10s6b-B-MF1.0-F, 10s6b-B-MF2.5-F,
10s6b-B-MF3.0-F. Base shear Capacity of a 10 storeyed building designed with MF of 3.0 & 2.5 is about
28% more than that of a building designed with MF equal to 1.0 whereas the deflection vary by note more
than 10 mm between them.
Fig 3.9 shows the comparison of pushover curves of bare frames for 10s6b-B-MF1.0-F, 10s6b-B-MF2.5-F,
10s6b-B-MF3.0-F
For 10 storeyed bare frame building it can be concluded from the above graph that the pushover curves for
fixed and hinged support condition are same. They exibit the same performance in the same loading
condition. The amount of displacement and the ductility ratio of the building is predicted to be same.
Hence as like in the case of 4S the same thing can be concluded that the performance of the building frame
is independent of the support condition.
3.10.6 COMPARISON OF PUSHOVER CURVES OF INFILL WALL CONDITION
In this topic we will be comparing the pushover curves obtained between strong infill versus weak infill for
both fixed and hinged support as shown in graph below. For strong infill condition the value of modulus of
elasticity of brick is taken as 5000 MPa whereas for weak infill it is taken as 350 MPa. The pushover
curves obtained due to the design of this type of building frame are shown below:
0
500
1000
1500
2000
2500
3000
3500
0 10 20 30 40 50 60 70 80
base
shea
r (KN
)
Displacement (mm)
1
2.5
3

49
Fig.3.10 shows the pushover curves of 4s6b-G-MF2.5-W-H, 4s6b-G-MF2.5-S-H
From the above diagram it can be concluded that the building designed with strong infill has the better
performance as compared to the weak infill condition. Strong infill 4S6B frame with hinged support has
almost 25 % more shear strength than that of weak infill also former can withstand 53 mm of deflection
when loaded whereas later can take only 38 mm.
The fact behind this is strong infill provides extra amount of stiffness to the building frame which results in
the better performance. The one with strong infill wall has the ability to withstand higher amount of load
and undergo higher amount of deflection as compared to that with the weak infill wall such that it provides
a clear warning before failing.
Fig 3.11 shows the pushover curves of 10s6b-G-MF2.5-W-F, 10s6b-G-MF2.5-S-F.
0
50
100
150
200
250
300
350
400
0 10 20 30 40 50 60
BASE
SH
EAR
(KN
)
DISPLACEMENT (mm)
WEAK INFILL-HINGED STRONG INFILL-HINGED
0
200
400
600
800
1000
1200
0 10 20 30 40 50 60 70
BASE
SH
EAR
(KN
)
DISPLACEMENT (mm)
WEAK INFILL-OGS-FIXED STRONG INFILL-OGS-FIXED
50
From this pushover curve above the same thing we can predict that the frame designed with strong infill has
the higher capacity than that of the weak infill. The magnitude of load that the strong infill can take is
about 1000 KN whereas that of weak infill has about 300 KN. Strong infill 10s frame with fixed support
can take 3 times more load than that with weak infill whereas the deflection being almost same about 66
mm for both the cases. Also for weak infill in this case it seems that this frame doesn’t provide any
warning before failure since it is varying linearly but the strong one it has a definite curve and possesses
the ability of giving some warning before failure.
Overall from this two curves above we can say that though the nature of the building
being the same the 10S building can withstand higher magnitude of base shear as compared to the 4S. In
4S case the building can take load upto 355 KN but in the case of 10S it can withstand load upto 1000 KN.
And hence that one with higher load can perform well and is considered good as compared to the other
one.
3.10.7 COMPARISON BETWEEN FIXED AND HINGED TYPE OF SUPPORT
Here we will be discussing between pushover curves that obtained between fixed and hinged type of
support only for strong infill for both 4 and 10 storeyed building frame.
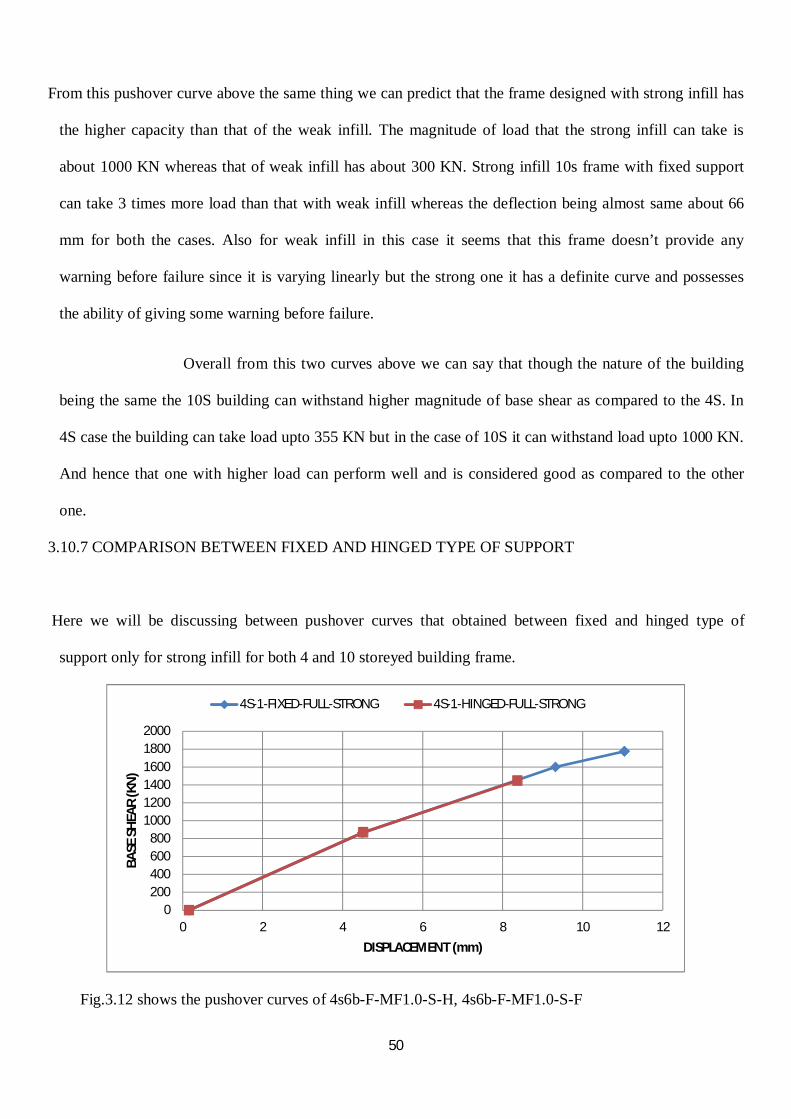
Fig.3.12 shows the pushover curves of 4s6b-F-MF1.0-S-H, 4s6b-F-MF1.0-S-F
0200400600800
100012001400160018002000
0 2 4 6 8 10 12
BASE
SH
EAR
(KN
)
DISPLACEMENT (mm)
4S-1-FIXED-FULL-STRONG 4S-1-HINGED-FULL-STRONG
51
Both 4S6B frame almost follows the same path but that designed with fixed support has 24% more strength
than that with hinged support also the former one can undergo deflection up to 11 mm whereas the later
only up to 8.5 mm
From this figure above we can sum up that both the building frames of 4S that with fixed and hinged support
have the same nature of pushover curves for fully strong infilled case. The only difference is that the one
with fixed support condition gives the higher performance than that of the hinged one. The former can take
high amount of load and undergo higher deflection than that of the later one. So preferably the former
building is considered as better among the two.
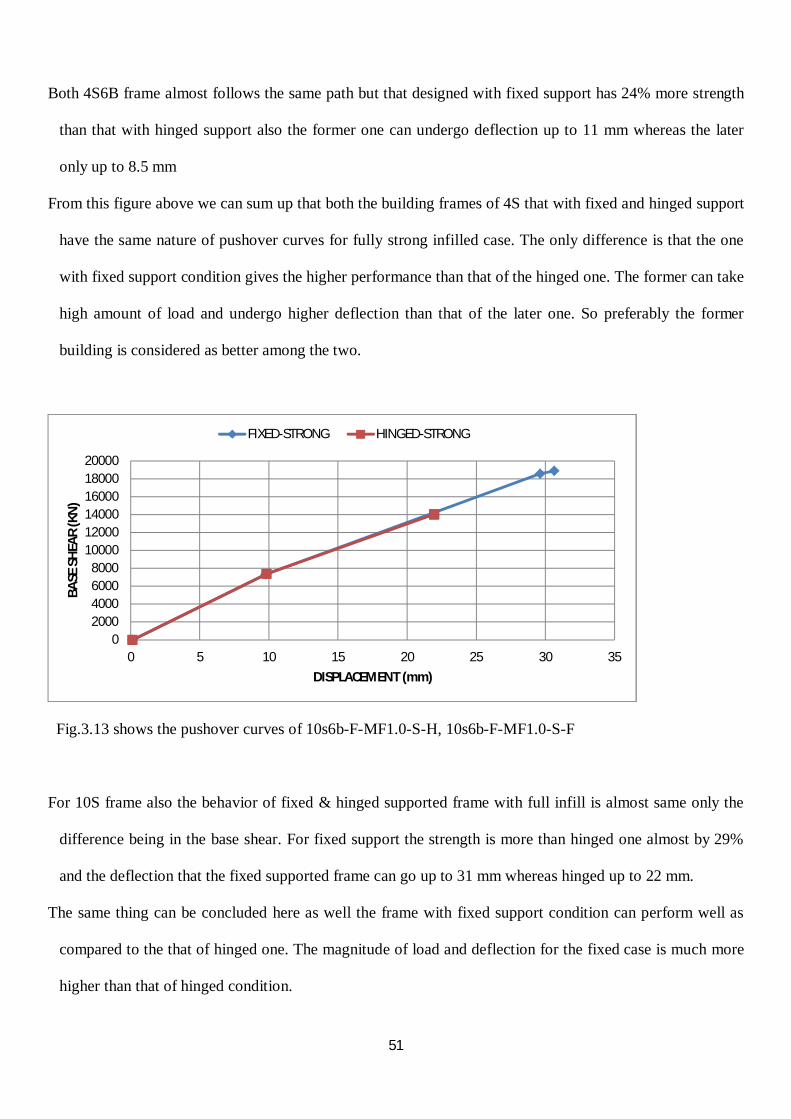
Fig.3.13 shows the pushover curves of 10s6b-F-MF1.0-S-H, 10s6b-F-MF1.0-S-F
For 10S frame also the behavior of fixed & hinged supported frame with full infill is almost same only the
difference being in the base shear. For fixed support the strength is more than hinged one almost by 29%
and the deflection that the fixed supported frame can go up to 31 mm whereas hinged up to 22 mm.
The same thing can be concluded here as well the frame with fixed support condition can perform well as
compared to the that of hinged one. The magnitude of load and deflection for the fixed case is much more
higher than that of hinged condition.
02000400060008000
100001200014000160001800020000
0 5 10 15 20 25 30 35
BASE
SH
EAR
(KN
)
DISPLACEMENT (mm)
FIXED-STRONG HINGED-STRONG

52
Fig.3.14 shows the pushover curves of OGS 4s6b-G-MF2.5-S-H, 4s6b-G-MF2.5-S-F (OGS 2.5)
Here in this case we can clearly observe that the capacity of the frame designed with fixed support condition
is much more higher than that of the hinged support. The former one can take load of about 2000 KN
whereas the later one is limited to 700 KN. Hence the frame with fixed support has 2.7 times higher load
bearing capacity during failure than the hinged support but the deflection of hinged being more than fixed
support by 15 mm.
Fig.3.15 shows the pushover curves of OGS 10s6b-G-MF2.5-S-H, 10s6b-G-MF2.5-S-F
0
500
1000
1500
2000
2500
0 20 40 60 80 100 120
BASE
SH
EAR
(KN
)
DISPLACEMENT (mm)
FIXED-STRONG-OGS HINGED-STRONG-OGS
0
500
1000
1500
2000
2500
0 20 40 60 80 100 120
BASE
SH
EAR
(KN
)
DISPLACEMENT (mm)
FIXED-OGS HINGED-OGS
53
From the pushover curves above we can conclude that the frame with fixed support possesses 3 times higher
strength than that with hinged support whereas in deflection point of view hinged has higher ability of
deforming than fixed by 10 mm.
The capacity of the building designed with fixed support can perform well than that designed with hinged
support.
Conclusion: hence from the above 4 figures we can conclude that the building frames designed with MF 1
exibit the same nature and follows the same curve only difference being in the magnitude of deflection it
undergoes but for the same frame in the case of MF value 2.5 we can see that their nature changes. Both
show different pushover curves with clear differentiation between them.
3.10.8.1 COMPARISON OF PUSHOVER CURVES OF 4S BUILDING FRAME
Fig 3.16 showing all pushover curves of 4S building frame.
Here we display the result of all pushover curves of 4S and 10S building frame. in this we have the pushover
curves of the frames in different conditions. They are: with bare frame, with MF value 1, OGS frame with
0200400600800
100012001400160018002000
0 20 40 60 80 100
BASE
SH
EAR
(KN
)
DISPLACEMENT (mm)
BARE FRAMEOGS-1OGS-2.5OGS-3FULL INFILL

54
MF 2.5 and 3.0 and finally with full infill wall. All the desired pushover curves of different frames as
mentioned are shown in the figure below:
1. Base shear capacity of OGS frame designed for MF = 3 is about 2.4 times more than that of MF =
2.5,
2. Base shear capacity of OGS frame designed for MF = 2.5 is about 1.5 times more than that of MF =
1.0,
3. Base shear capacity of full infilled frame designed for MF = 1.0 is about 1.1 times more than that of
Bare frame,
4. Base shear capacity of full infilled frame designed for MF = 1.0 is about 6 times more more than that
of OGS frame designed with MF = 2.5,
5. The base shear capacity of bare frame is the lowest
6. Frame with MF 3 has the highest ability of undergoing deflection i.e. up to 85 mm whereas other can
go up to 58 mm maximum.
7. From the figure below we can say that the building frame without infill wall i.e. with bare frame has
the least performance and can withstand least magnitude of base shear as compared to other curves.
Also in terms of deflection we can say it fails under lower deflection value.
8. The frame with high load withstanding capacity is that of with full infill wall condition. It can take
load upto 1800 KN but it fails soon after reaching the value of 12 mm. in other words despite of high
load withstanding value this building frame is not considered as the effective because it fails soon
without warning. So this type of frame is more vulnerable than others with the fact that it reaches its
maximum permissible value within shorter time period.
9. The most convinced graph is of with MF value 3.0. Though it doesn’t have the capacity of
undertaking as much load to that of infill case but it can undergo higher deformation and has the
ability to provide clear warning before failure.
10. Among OGS type of building frame that with MF 3.0 gives better performance having the maximum
permissible load limit upto 800 KN but for MF 2.5 it is just below 300 KN and for MF 1 it has
around 200 KN.

55
11. Talking from the deflection point of view the frame with infill wall deforms first as compared to
others.
3.10.8.2 COMPARISON OF PUSHOVER CURVES OF 10S BUILDING FRAME
Fig 3.17 showing pushover curves of 10S building frame.
1. Base shear capacity of OGS frame designed for MF = 3 is about 1.5 times more than that of MF =
2.5,
2. Base shear capacity of OGS frame designed for MF = 2.5 is about 2.5 times more than that of MF =
1.0,
3. Base shear capacity of full infilled frame designed for MF = 1.0 is about 1.1 times more than that of
Bare frame,
4. Base shear capacity of full infilled frame designed for MF = 1.0 is about 9.5 times more than that of
OGS frame designed with MF = 2.5,
0
2000
4000
6000
8000
10000
12000
14000
16000
18000
20000
0 10 20 30 40 50 60 70 80 90 100
BASE
SH
EAR
(KN
)
DISPLACEMENT (mm)
BARE FRAME
OGS-1
OGS-2.5
OGS-3
FULL INFILL
56
5. The base shear capacity of bare frame is the lowest
6. The highest deformation can be seen in the case of frame designed with MF 2.5 which is about 90
mm whereas for others it’s maximum up to 75 mm only.
7. Here also the highest load taking frame is that designed with infill wall condition and has the value
of approximately 19000 KN but its deflection value is that with the least one which is about 30 mm.
8. Among the OGS frames though that designed with MF 3.0 has the highest value of undertaking load
but has the ability of deforming earlier than that designed with MF 2.5. earlier one can take load upto
more than 3000 KN whereas that with MF 2.5 can take below 2000 KN.
9. From deformation point of view the frame designed with MF value 2.5 has the higher value of
deformation to undergo than that of MF 3.0.
10. That designed with bare frame shows the least performance.
11. The load withstanding ability of bare frame and that with MF 1 are nearly same. The only difference
in their nature is in the term of deformation. The one with MF 1 has the higher ability of undergoing
higher deformation.
3.11 SUMMARY
So far in this chapter we have discussed about the building frames considered for the case study. Altogether
we have modelled 76 building frames with several variations like that in type of support (fixed & hinged),
type of infill wall (weak &strong), MF values (1, 2.5 & 3) and finally bare frame. The number of storeys of
the building chosen was 4, 6, 8 &10 with number of bays remaining constant i.e. 6. Also we discussed about
the magnification factor suggested by various codes.
The most important topic discussed above was the modelling and analysis of the building frames.
In course of modelling we have gone through the modelling of both beams & columns and that of infill wall
individually along their hinges property during modelling. The various performance levels (immediate
occupancy, life safety and collapse prevention) were defined on the proposed curve. Based on the

57
performance levels, simplified piece-wise linear relationship was proposed for the axial hinge property of a
strut. The nonlinearity in the strut is incorporated by the changes in slope of the linear segments. The
proposed hinge property was modified to incorporate the diagonal compression failure in the strut.
All of the above proposed model were modelled and finally non-linear analysis that is pushover analysis was
performed from where we were able to get the pushover curves (the curve between base shear of the
building versus roof displacement). After that all the building frames were compared with respect to their
aspects like in terms of support, infill wall and MF values from those pushover curves obtained at the time
of analysis which are shown in the graphs above.
And finally the results and conclusion of this project is provided on the next chapter.

58
CHAPTER 4
RESULTS AND CONCLUSIONS
• Base shear Capacity of 4S6B bare frame with fixed support designed with MF 3.0 & 2.5 is about
27% more than that of a building designed with MF 1.0. & the deflection they can undergo is up to
85 mm whereas that with MF 1.0 can go up to only 35 mm.
• Base shear Capacity of a 4S6B bare frame designed with MF of 3.0 & 2.5 is about 28% more than
that designed with MF 1.0 also they can undergo deflection twice than that with MF 1.0
• Base shear Capacity of a 10 S6B bare frame designed with MF of 3.0 & 2.5 is about 28 % more than
that designed with MF 1.0 whereas the deflection vary by note more than 15 mm between them
• Base shear Capacity of a 10S6B bare frame designed with MF of 3.0 & 2.5 is about 28% more than
that designed with MF equal to 1.0 whereas the deflection vary by note more than 10 mm between
them.
• Strong infill 4S6B frame with hinged support has almost 25 % more shear strength than that of weak
infill also former can withstand 53 mm of deflection when loaded whereas later can take only 38
mm.
• Strong infill 10s frame with fixed support can take 3 times more load than that with weak infill
whereas the deflection being almost same about 66 mm for both the cases.
• Both 4S6B frame almost follows the same path but that designed with fixed support has 24% more
strength than that with hinged support also the former one can undergo deflection up to 11 mm
whereas the later only up to 8.5 mm.
59
• For 10S frame also the behavior of fixed & hinged supported frame with full infill is almost same
only the difference being in the base shear. For fixed support the strength is more than hinged one
almost by 29% and the deflection that the fixed supported frame can go up to 31 mm whereas hinged
up to 22 mm.
• 4S6B OGS-2.5 frame with fixed support has 2.7 times higher load bearing capacity during failure
than the hinged support but the deflection of hinged support being more than fixed support by 15
mm.
• 10S OGS-2.5 frame with fixed support possesses 3 times higher strength than that with hinged
support whereas in deflection point of view hinged has higher ability of deforming than fixed by 10
mm.
• Conclusions from pushovers curves of 4S6B with all variations
• Base shear capacity of OGS frame designed for MF = 3 is about 2.4 times more than that of MF =
2.5,
• Base shear capacity of OGS frame designed for MF = 2.5 is about 1.5 times more than that of MF =
1.0,
• Base shear capacity of full infilled frame designed for MF = 1.0 is about 1.1 times more than that of
Bare frame,
• Base shear capacity of full infilled frame designed for MF = 1.0 is about 6 times more more than that
of OGS frame designed with MF = 2.5,
• The base shear capacity of bare frame is the lowest
• Frame with MF 3 has the highest ability of undergoing deflection i.e. up to 85 mm whereas other can
go up to 58 mm maximum.

60
• Conclusions from pushovers curves of 10S6B with all variations
• Base shear capacity of OGS frame designed for MF = 3 is about 1.5 times more than that of MF =
2.5,
• Base shear capacity of OGS frame designed for MF = 2.5 is about 2.5 times more than that of MF =
1.0,
• Base shear capacity of full infilled frame designed for MF = 1.0 is about 1.1 times more than that of
Bare frame,
• Base shear capacity of full infilled frame designed for MF = 1.0 is about 9.5 times more than that of
OGS frame designed with MF = 2.5,
• The base shear capacity of bare frame is the lowest
• The highest deformation can be seen in the case of frame designed with MF 2.5 which is about 90
mm whereas for others it’s maximum up to 75 mm only.

61
REFERENCES
http://onlinelibrary.wiley.com/
http://www.ngdc.noaa.gov/
http://ascelibrary.org/
http://www.iust.ac.ir/ijce/browse.php?a_id=343&sid=1&slc_lang=en
http://www.ngdc.noaa.gov/
http://www.technicaljournalsonline.com
IS code 1893-2000, 13920, 456
Bulgarian code.


![Gioncu [Framed Structures. Ductility and Seismic Response - 2000]](https://img.pdfslide.us/doc/110x75/5532c8424a79599f5e8b4753/gioncu-framed-structures-ductility-and-seismic-response-2000.jpg)