SECTORAL SHIFTS: IMPACT ON HONG KONG WORKERS
Wing Suen*
University of Hong Kong
August 1994
* I thank Julia Cheung for able research assistance. The paper has benefited from comments byWilliam Chan.
The restructuring of the Hong Kong economy in the 1980s is an often told story (e.g.,
Greenwood 1990; Lui and Chiu 1993; Mok 1993). Between 1981 and 1991 the abso-
lute level of employment in the manufacturing sector declined from 990,000 to 768,000
(employment share fell from 41 percent to 28 percent). The decline of manufacturing in-
dustries was associated with the growing importance of the services sector. Employment
share in financing, insurance, real estates and business services, for example, more than
doubled in ten years (Census and Statistics Department 1992). During this period eco-
nomic reform in China reinvigorated Hong Kong’s links to the Chinese economy. Total
trade with China increased more than twelve fold. Outward processing trade with China
was almost non-existent in the early 1980s; in 1991 Hong Kong people sent $114 billion
worth of raw materials and semi-manufactures into China for processing, and received
$197 billion worth of processed goods. The estimated value added from outward process-
ing was then $83 billion. To put this figure in perspective, the total value added from
the domestic manufacturing sector was $93 billion in 1991 (Annual Digest of Statistics,
various issues). The shift of Hong Kong’s manufacturing base is unmistakable.
The changing sectoral composition of the Hong Kong economy raises concerns that
range from labor shortage to unemployment. Wong et al. (1991) argue that economic
restructuring fuels wage growth which in turn increases inflation. Labor advocates con-
tend that de-industrialization causes relocation problems especially among older and
less skilled workers. Policy recommendations to deal with the problems of structural
transformation are rife, though there is little consensus as to what these problems really
are. This paper brings data that bear on the question, How did Hong Kong workers
fare under structural transformation? While theory about the functioning of labor mar-
kets offers some guidance, the question must ultimately be settled on empirical grounds.
After a brief description of the pattern of sectoral shifts in Hong Kong, the paper ad-
dresses the following issues: (1) What were the effects of sectoral shifts on sectoral wage
patterns? (2) Did relative wage for older and less educated workers fall? (3) Were there
significant labor market frictions in the adjustments to economic transformation? The
main findings are summarized in the concluding section of the paper.
1

1. Changes in Employment Patterns
While the public were not concerned about structural change in Hong Kong until very re-
cently, Table 1 shows that the relative decline of manufacturing employment has started
since the early 1970s. Similarly employment in financial and business services has grown
steadily for the past thirty years before Hong Kong emerged as one of the world’s lead-
ing financial centers. If sectoral shifts are not a recent phenomenon, is there anything
special about the changes during the 1980s?
Table 2 offers a partial answer. Columns (1) and (2) of the table shows the index
of sectoral shift for various periods. The index is calculated by the expression∑
i|sit −
sit′|/2 where sit is the employment share of sector i in year t. This index can be
interpreted as the minimum proportion of workers who have to change sectors as a
result of sectoral shifts. An alternative measure for the extent of sectoral shift, shown
in columns (3) and (4) of Table 2, is the standard deviation of the growth rates of
employment across different sectors. Both measures indicate that the pace of sectoral
shift was faster in the 1980s than in earlier periods. The trend towards faster structural
change was particularly evident for the second half of the eighties.
That the pace of structural shift was picking up in the late eighties can also be
verified from international comparison. Table 3 shows the index of sectoral shift for
Hong Kong, Singapore, South Korea, Japan and the United States. As in Young (1992),
the rate of structural transformation in Hong Kong was below that in Singapore and in
South Korea during the early eighties. However, this result does not hold for the more
recent period. The rate of structural change in Hong Kong surpassed other countries in
the period 1987–92. The accelerated pace of structural change suggests that the public’s
growing interest in this issue is not entirely unjustified.
To gain a more detailed picture beyond the broad trends of de-industrialization
and the rise of services, a closer look at employment patterns at the two-digit level is
necessary. To this end, I have constructed a data set from the 1976, 1981, 1986 and
1991 census one percent files. I recoded the industry codes for the economically active
2
population to conform to the 1991 classification system.1 This produces 25 two-digit
industries that are comparable across different years.2 For each industry I computed the
total count of the number of persons engaged in that industry, their average monthly
earnings, and a number of other sample characteristics. The result is a cross section of
25 industries repeated over 4 time periods at five year intervals.
Consistent with the findings from more aggregated data, this data set of twenty five
industries indicates accelerated structural change. The rates of economic transformation
were 9.01, 8.51, and 10.20 for the periods 1976–81, 1981–86, and 1986–91, respectively.
Moreover the change in employment shares are serially correlated: the Pearson cor-
relation coefficient between the change in employment shares in 1976–81 and that in
1986–91 is .30. This suggests the sectoral shifts represent permanent change rather than
temporary aberrations or mere measurement errors.
The finer classification of industries afforded by my data set also confirms the broad
trends shown in more aggregate data. Of the nine manufacturing industries in the census
data, none gained employment share. Thus the decline of manufacturing industries is
not confined to the hardest hit sectors (notably textiles, apparel, and plastic and rubber
products). Similarly the growing importance of services is not limited to the financial
sector. Among the fourteen services industries in the census data, only wholesale and
retail trade experienced a drop in employment share.
Another trend evident in the structural transformation of the Hong Kong economy is
the shift in occupational composition of the labor force. Unfortunately the occupational
classification used in the 1991 census was based on a different set of criteria than those
1 There are no industry codes for the unemployed in the 1991 census. So the 1991 sample onlyconsists of the employed population. Because of the small number of people is some industries, I haveexcluded those industries from the sample. Details of the recoding are available from me.
2 The industries are: electricity, gas and water (4); food, beverages and tobacco (31); textiles (32);wearing apparel (33); footwear and leather products (34); wood and wood products (35); paper products,printing and publishing (36); chemicals, rubber and plastic products (38); basic metal industries andmetal products (39); machinery and electronic products (40); construction (51); wholesale trade (61);retail trade (62); import and export trade (63); restaurants and hotels (64); transport and relatedservices (71); storage and warehouses (72); communications (73); banking and finance (81); insurance(82); real estate (83); business services (84); community and social services (91); recreational and
cultural services (92); and personal and household services (93).
3
used in earlier censuses. To maintain consistency across census years, I can only recode
the occupations into very broad groups: managers and administrators (1); professionals
and associate professionals (2, 3); clerks (4); service workers and shop workers (5); craft
and related workers, plant and machine operators and assemblers (7, 8); elementary
occupations (9); and others (0).3 As expected, there was a general upgrading in the
distribution of occupations. The proportion of workers who were managers and admin-
istrators rose from 5.0 percent in 1976 to 9.1 percent in 1991; and the proportion of
professionals and associate professionals increased from 7.0 percent to 14.7 percent.
Table 4 shows how the changing distribution of occupations varies across industries.
Perhaps the most interesting feature of the table is that the increase in percentage
of managerial and administrative workers is higher in the manufacturing sector than in
other sectors. Moreover the proportion of clerical workers (group 4) in the manufacturing
sector increased substantially by 7.9 percentage points while the proportion of direct
production workers (groups 7, 8, and 9) fell by 21.7 points. This is consistent with the
view that many local manufacturers have moved their production facilities to China and
used Hong Kong mainly as a distribution and control center for their regional operation.
The degree of de-industrialization in Hong Kong, then, is greater than that suggested
by the decline in total manufacturing employment alone.
2. Effect on Inter-Industry Earnings
Observed relationship between employment and earnings depends on underlying demand
and supply. If sectoral shifts are the result of the changing composition of final demand,
one would expect that earnings will rise in the expanding sectors relative to the declining
sectors. The magnitude of the response is a measure of the elasticity of labor supply to
individual industries. On the other hand, workers’ preferences might have changed. For
example, some argue that as income and education improve, fewer people are interested
in manufacturing work. The reduction in supply of manufacturing workers will result
in reduced employment and higher wages in the manufacturing sector. To empirically
3 The numeric codes are the one-digit occupational codes according to the 1991 classification. Detailsof the recoding are available from me.
4
distinguish these two effects requires the use of instrumental variables. However, as in
most labor market studies, it is extremely difficult to find valid instruments that can
safely be presumed to shift only the demand or the supply curve. In this paper I will
follow most researchers (e.g., Bound and Johnson 1991; Murphy and Welch 1991; Katz
and Murphy 1992) in assuming that shifts in industrial composition reflect changes in
demand. A priori, this seems to be an especially reasonable assumption for the case of
Hong Kong. The opening up of the Chinese economy, where average wages are about a
tenth of wages in Hong Kong, is bound to have significant impact on the demand for labor
in Hong Kong. The rate of economic growth in southern China has been unprecedented
by historical standards, and Hong Kong’s investment and trade links with it multiplied
in the past decade. All these are major developments which happened in a short period
of time. On the other hand, shifting preferences for employment in alternative sectors,
if they happen at all, are likely to affect only the new labor market entry cohorts. The
effect on the relative supply of labor to different sectors is likely to be small and gradual.
These considerations partially justify the decision to treat sectoral shifts as exogenous.
Table 5 displays the regression estimates for the change in mean sectoral earnings
on the change in employment shares and on other variables. The data set consists of
25 industries observed at 4 census years. Since the regressions are performed in first-
differenced form, the effective sample size is 75. Dummy variables for the three five-year
intervals are used to remove time-specific effects. The error terms are assumed to be
serially correlated but independent across sectors (i.e., the covariance matrix is of the
form Σ⊗
I25). The regressions are estimated by maximum likelihood method. I concen-
trate on the sample of men because male workers are the more stable component of the
workforce and because there were significant changes in the structure of female earnings
during the period (Lui and Suen 1993). The dependent variable used in the first three
regressions is the change in mean log earnings in different sectors. Column (1) indicates
that changes in employment shares are only weakly correlated with changes in relative
earnings: sectoral shifts account for less than .3 percent of the variation in sectoral earn-
ings growth. Columns (2) and (3) controls for changes in demographic characteristics
5
and in occupational structure in each sector. The demographic and occupational vari-
ables all come out with the expected sign. Moreover, with these control variables, the
coefficient on change in employment share becomes statistically significant (at the .01
level). In the last two columns of Table 5, I controlled for demographic characteristics in
a different way. For each census year, a human capital earnings regression is estimated
for the sample of men. The independent variables include place of birth, marital status,
activity status, education levels interacted with quartics in age, and a dummy variable
for each sector. Holding all the other demographic variables at their mean value, the
coefficients for the industry sector dummies will yield a predicted wage for each industry.
The change in the predicted wage for each industry across census years is then be used
as the dependent variable of the regression. The results are similar in pattern to those
in the first three columns.4
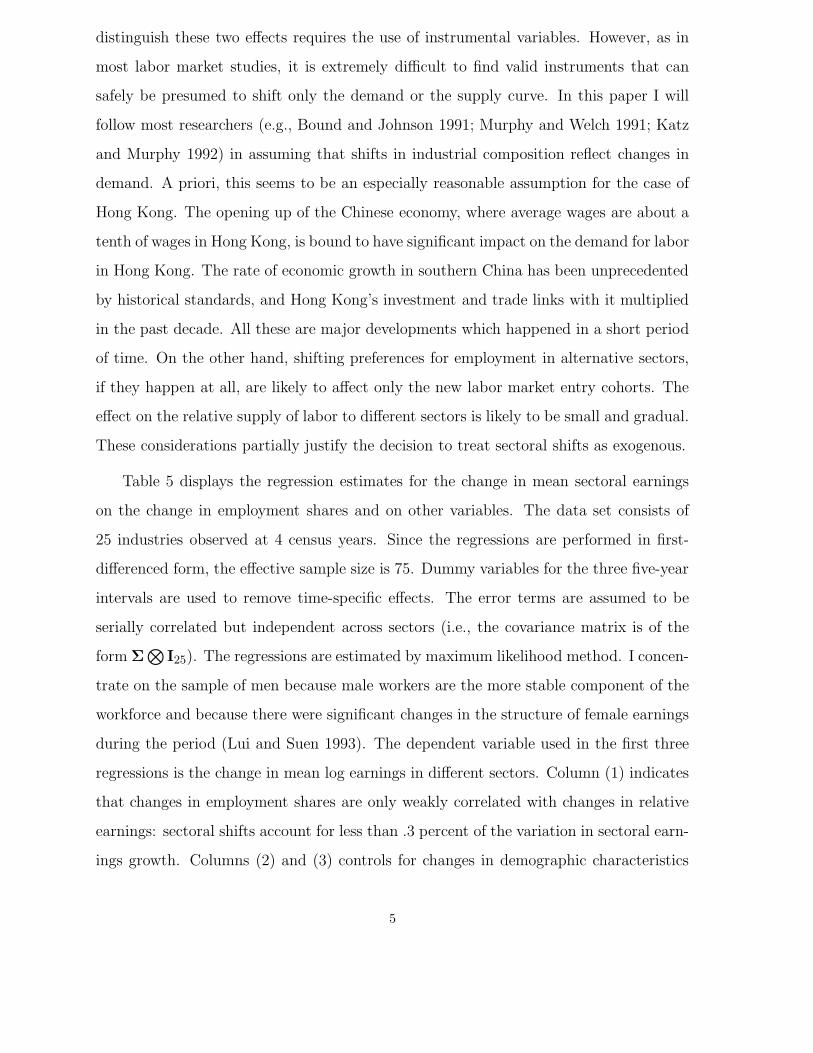
While earnings in expanding sectors seem to rise faster than earnings in declining
sectors, the magnitude of the effect is rather modest. The standard deviation of the
change in employment share in the sample is about one percentage point. According to
the coefficient estimates in columns (2) and (3) of Table 5, over a five year period, sectors
which experience a one percentage point increase in employment share will show a 1.8
percent (1.8 log points) higher increase in earnings relative to sectors with no change
in employment share. The average growth in real earnings, by contrast, is about 22.4
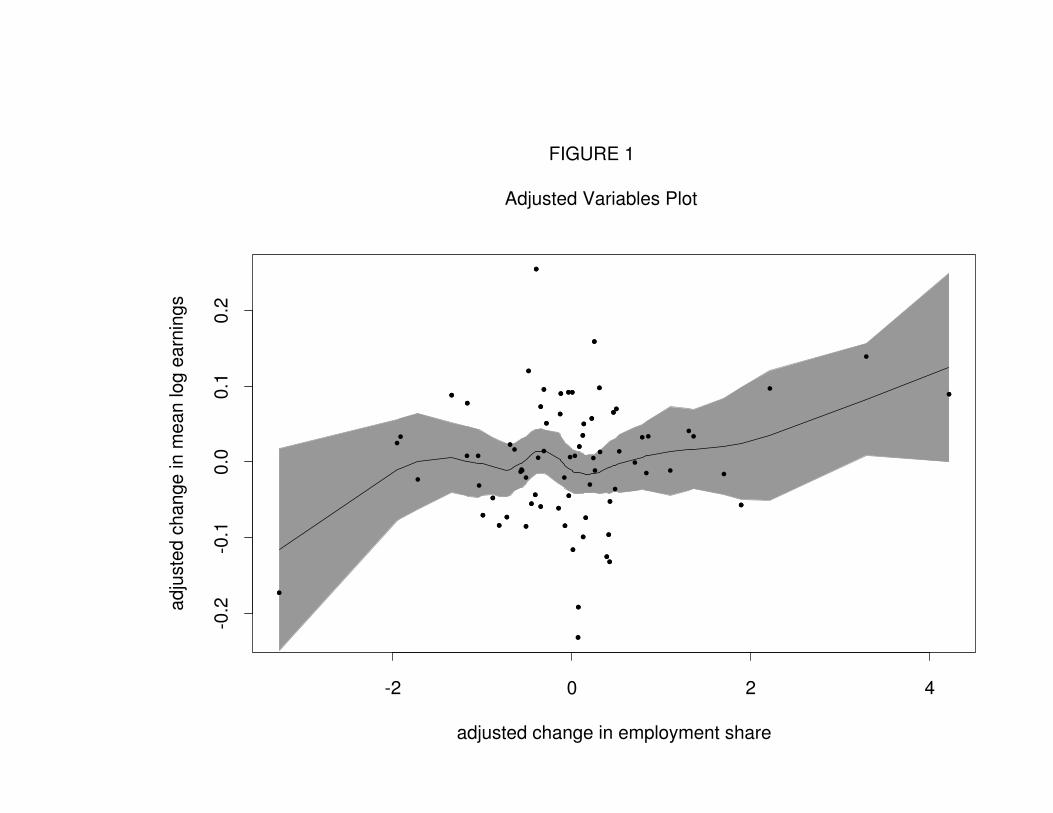
percent. Figure 1 gives the adjusted variable plot (see, for example, Chambers et al.
1983) of change in mean log earnings against change in employment shares after adjusting
for changes in demographic and occupational structure.5 The lowess fit (Cleveland 1979)
of the points near the middle is almost flat. This may be due to measurement errors in
employment shares, or it may reflect genuine non-linearities in the response of earnings
to sectoral shifts. The ±2-standard-error bounds also show that the relationship between
4 These regressions do not hold the unobserved characteristics of workers in an industry constantsince panel data are not available. The estimates would be biased if the quality of movers and stayersare systematically different.
5 The two extreme outliers are observations from the construction industry. I have removed theconstruction industry and re-estimated the models in Table 5. The coefficient on change in employmentshare falls from .018 to .014 but remains significant at the .05 level. Other coefficients are broadlysimilar to those shown in Table 5.
6
employment growth and earnings growth is not particularly tight.
The lack of a strong relationship between employment growth and earnings growth
indicates very elastic labor supply to individual sectors of the economy. Since a one per-
centage point increase in employment share (which corresponds to a 25 percent increase
in relative employment) brings about a 1.8 percent increase in earnings, the implied
elasticity of supply is 25/1.8 = 13.9. Two factors contribute to this large measured
elasticity: (1) Employment and earnings change are measured over five year intervals;
and long run elasticities are typically larger than short run elasticities. (2) Classification
of labor markets according to industrial sectors is an imperfect way of delineating the
extent of the relevant markets (see also Stigler and Sherwin 1985). For example, an office
clerk may care very little whether he works in a manufacturing firm or in a financial in-
stitution, and the amount of sector-specific human capital for such a worker is also likely
to be small. These two factors suggest that concerns about a permanently depressed
sector are premature. The evidence shows that Hong Kong workers are relatively mobile
across industries6 so that large sectoral shifts are only associated with minor changes in
relative earnings.
3. Effect on the Disadvantaged
The economic transformation of Hong Kong in the past decade has involved a shift to-
wards education-intensive industries: the correlation between average years of schooling
in a sector and the growth in employment share is .23 (t-statistics = 2.02). Other things
equal, rising demand for education will increase the earnings of more educated workers
relative to less educated workers. Some (e.g., Schultz 1975; Bartel and Lichtenberg 1987)
have also argued that more educated workers are more flexible and adaptable to change.
If this is the case, workers with relatively little education would suffer in periods of rapid
economic transformation. In the United States, it is well documented that returns to
education have risen sharply since the 1980s (Murphy and Welch 1989; Juhn et al. 1993).
Did Hong Kong share the same experience?
6 Worker mobility across sectors need not always involve a change of jobs. It may take the form ofdifferential entry into and differential attrition from different industries.
7

To assess the changing returns to education, I have estimated a human capital earn-
ings regression on the sample of men for each census year. The independent variables
include marital status, activity status, place of birth, and six education levels inter-
acted with quartics in age. The predicted log earning at each education level at the
sample mean is then calculated. Table 6 displays the results. Panel (A) compares the
predicted earnings with that of a Form 5 graduate. The returns to higher education
(post-secondary and degree courses) fell sharply from 1976 to 1981 but rose from 1986
to 1991. There is little change in relative earnings for those with primary or no educa-
tion. Panel (B) shows the change in log earnings at each education level. For the period
1976–81, the earnings growth of people with relatively less education was greater than
those with more education. From 1981 to 1991, however, the earnings of people with
less education grew slower than those with more education.
While Table 6 shows some evidence that people with little education fared less well
compared to others in the 1980s, it is difficult (and too easy) to discern a trend from
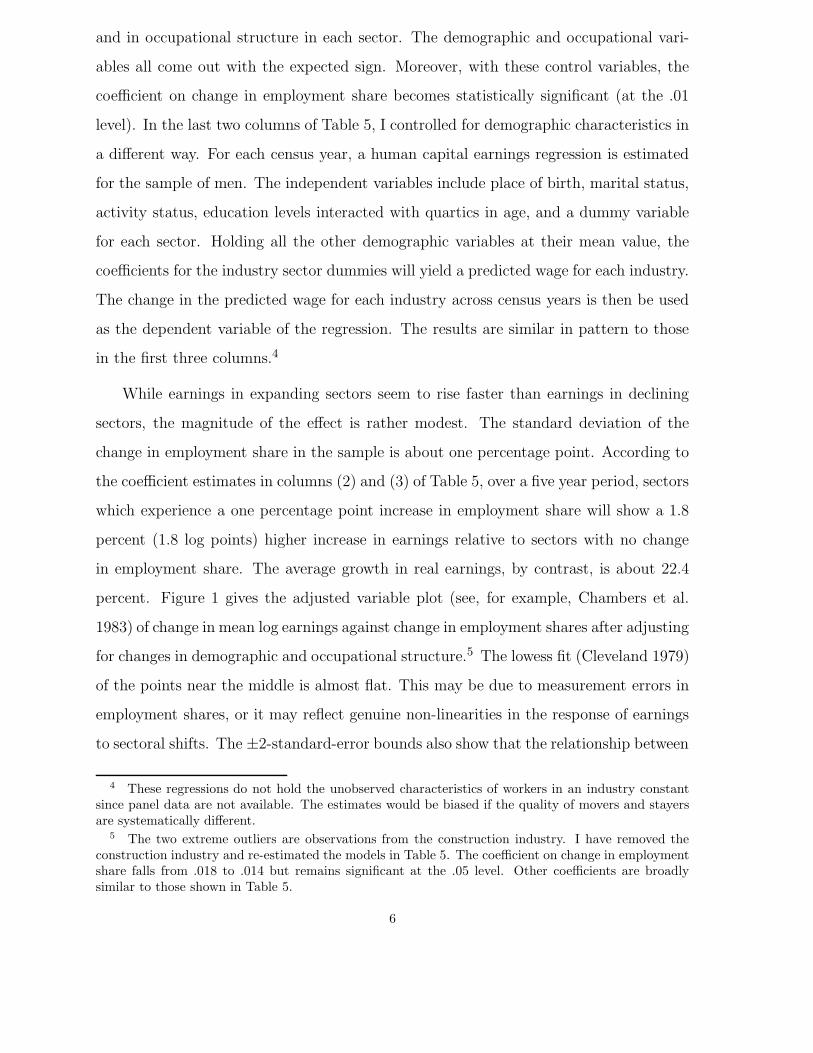
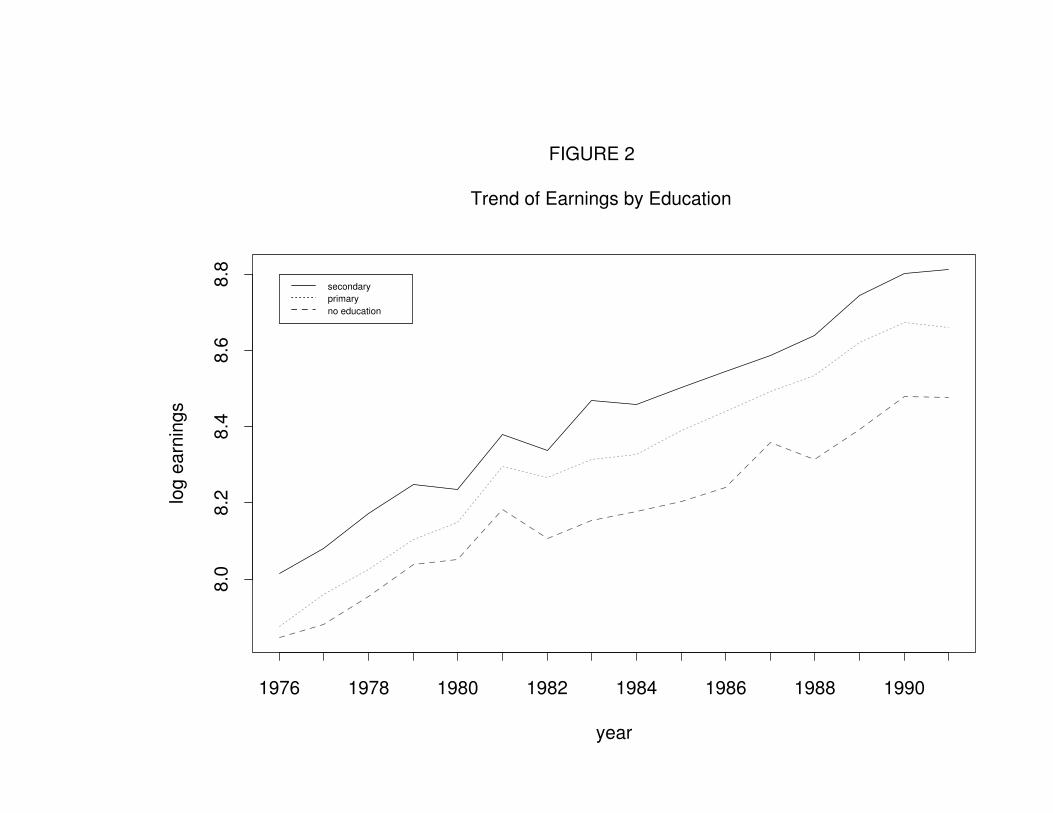
four data points. To investigate the changing returns to education, I have collected the
unpublished tabulations from the General Household Surveys from 1976 to 1991. Figure
2 shows the real log median earnings for the sample of men with secondary, primary,
and no education. The figure clearly shows that the gap between the secondary school
graduates and the uneducated has widened (from about 20 percent in the late 70s to
33 percent in the early 90s).7 The link between widening gap for the uneducated and
accelerated structural change, however, remains to be established.
Another group that is commonly asserted to suffer from economic transformation is
the elderly. People have argued that old people are less adaptable to change and will
lose out in periods of rapid economic transformation. There is some evidence that old
people are less likely to leave a declining industry and that young people are less likely
to enter it. As a result the average age in a declining industry will increase. I estimate
a model in which the change in average age in an industry depends on the change in
7 For people with primary education, the gap fluctuates but shows no definite increase. I have alsoplotted the gap between university degree holders and secondary school graduates. The earnings datafor degree holders are very noisy and there does not seem to be any trend either.
8
employment share. The coefficient is −.38 with an asymptotic t-ratio of 1.39. However,
the results in the previous section also suggest that earnings growth in declining sectors
is not substantially below that in expanding sectors. If this is the case, elderly workers
need not be especially hard hit by structural change.
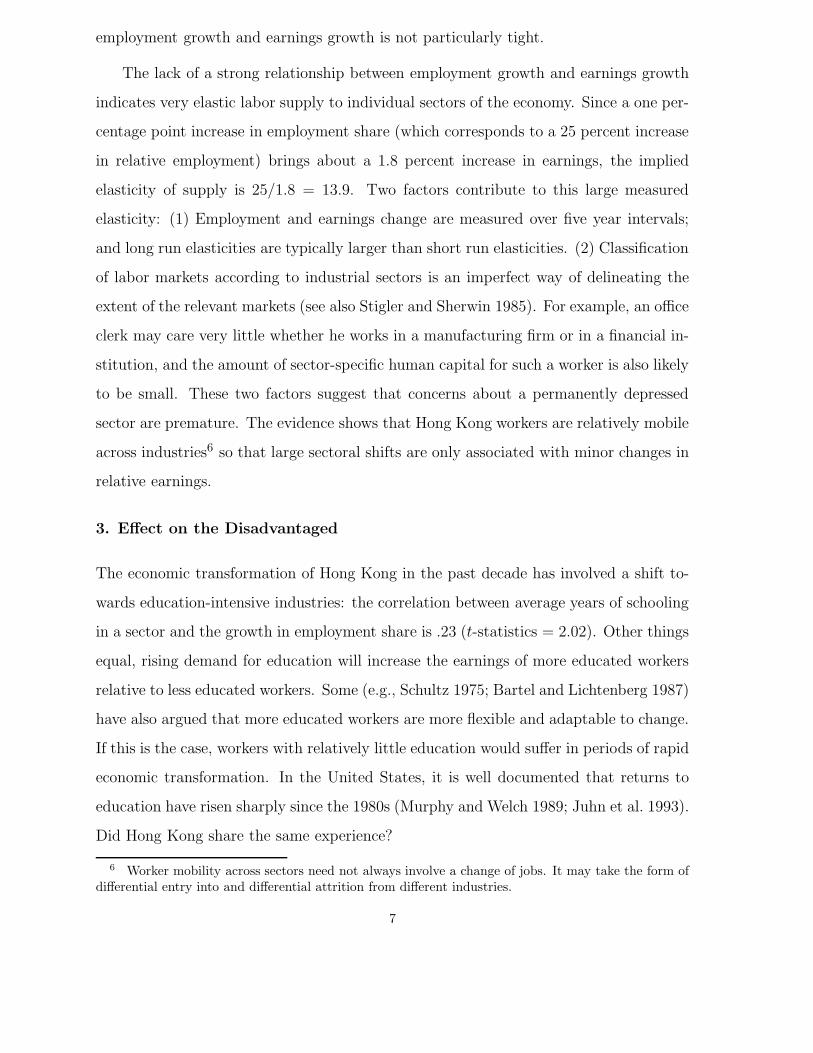
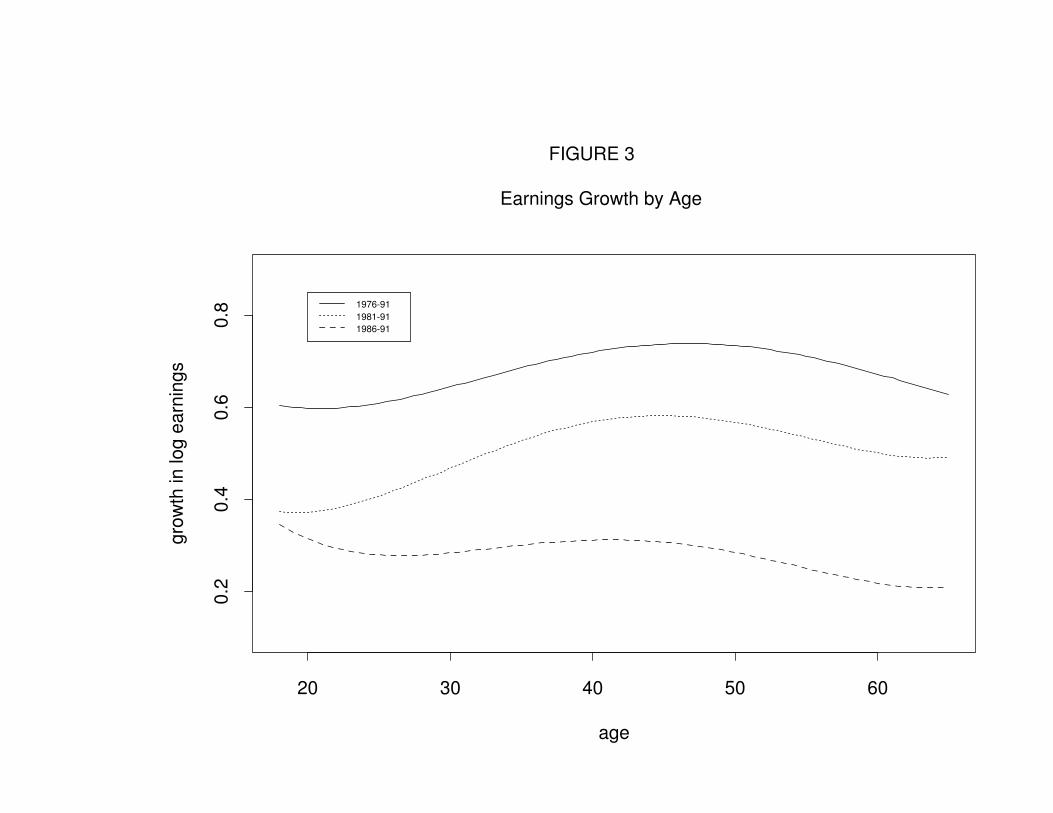
To compare the earnings of workers of different age, I use the human capital earnings
regressions estimated earlier to construct an age earnings profile for each sample year.
Using the estimated profiles (which are polynomials of degree four), one can compute
the growth in earnings for workers at various age.8 Figure 3 shows the earnings growth
for the periods 1986–91, 1981–91 and 1986–91. Compared to younger workers, the older
age groups seemed to experience slower growth during the period 1986–91, but they also
experienced faster growth in the period 1981–86. Over the entire period, there is little
difference in the growth of earnings by age.9 The fruits of economic growth are shared
more or less equally by workers of all age.
Old age and little schooling are crude characterization of the economically disad-
vantaged population. A more direct classification of the disadvantaged group is based
on earnings. The question about the impact of economic transformation on the disad-
vantaged then boils down to a question of how it affects earnings inequality. As shown
in Table 7(A), the Gini coefficient for male employment earnings has risen from .386 in
1976 to .427 in 1991. Other measures of earnings inequality tell a similar story. For
example, the standard deviation of log earnings has increased from .64 to .70, and the
gap between the tenth percentile earning and median earning has increased by 22 log
points. The measures in panel (C) are based on the residuals from earnings regressions.
They also indicate a trend towards greater inequality.
The trend towards greater wage inequality has been observed in a number of devel-
oped countries (e.g., Katz and Ravenga 1989; Green et al. 1992). The cause of rising
8 The computed growth rates are age-specific rather than cohort-specific.9 The estimates are based on employed workers. If older workers who suffered large earnings loss
retired early, this would induce an upward bias in the measure of the earnings of the elderly. How-ever, while the male labor force participation rate did decline over the years, the decline was modestand steady and was probably due to the income effect. There is little evidence that early retirementaccelerated as the economy was undergoing faster structural transformation.
9
inequality is still a subject of active research (see, for example, Bound and Johnson
1992). In an accounting sense, sectoral shifts in Hong Kong contribute to rising wage
dispersion because employment has shifted towards industries characterized by high in-
equality (such as the financial sector). Following Juhn et al. (1993), I decompose the
variance in log earnings, σ2, according to the formula:
σ2 =∑
i
siσ2
i +∑
i
si(wi − w̄)2,
where si is the employment share of sector i, σi and wi are the within-sector variance and
the within-sector mean of sector i log earnings, and w̄ is the overall average log earnings.
The change in variance through time can then be attributed to: (1) changes in sectoral
shares; (2) changes in within-industry variance; and (3) changes in between-industry
variance. Table 8 shows the result of such a decomposition. For the period 1981–91, for
example, changes in industrial composition alone account for more than forty percent
of the increase in variance. Changes in within-industry variance, however, remain the
more important factor in the overall rise in inequality.
It is difficult to establish conclusively that structural change in Hong Kong caused
rising wage inequality, although such a link remains a distinct possibility. However, in
interpreting the rise in wage dispersion, two points should be borne in mind: (1) The
identity of the people near the bottom of the earnings distribution in one year need to
be the same as those in another year, particularly when the degree of earnings mobility
is high. Longitudinal data would be needed to demonstrate conclusively that low wage
workers are made relative worse off over time. (2) Unlike the experience in countries
such as the United States, where real wages for low-wage jobs fell in absolute terms,
real wages in Hong Kong at all levels increased sharply. For example, real earning at
the tenth percentile of the distribution grew 39 percent between 1981 and 1991, even
though it fell by 19 percent relative to the median.10 Changes in relative earnings must
not be taken to mask the growth in real earnings.
4. Effect on Unemployment
10 Similarly, while workers with no education experienced a widening earnings gap relative to otherworkers, Figure 2 shows that their real earnings are continuously on the rise.
10
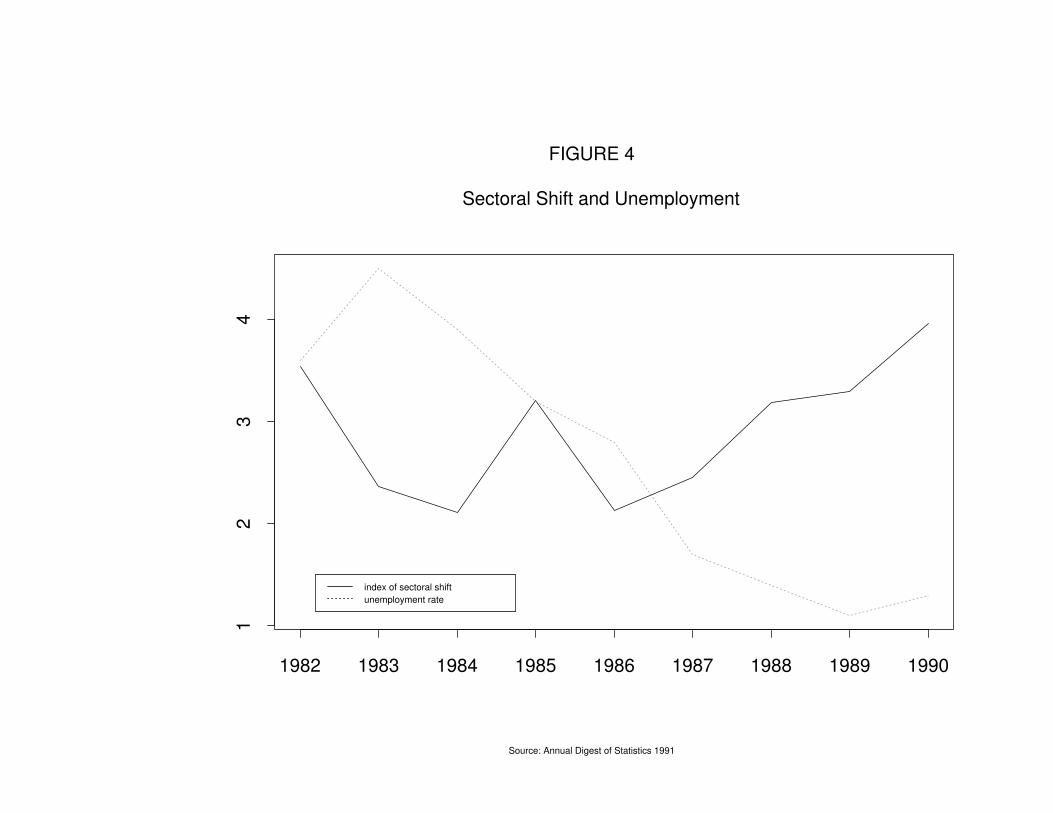
The sectoral shifts theory of unemployment holds that periods of accelerated structural
change generate labor market mismatch and increase the extent of frictional unemploy-
ment. Lilien (1982) offered some evidence for the relationship between sectoral shifts
and cyclical unemployment in the United States, though this is disputed by Abraham
and Katz (1986) and by Murphy and Topel (1987). For the case of Hong Kong, the
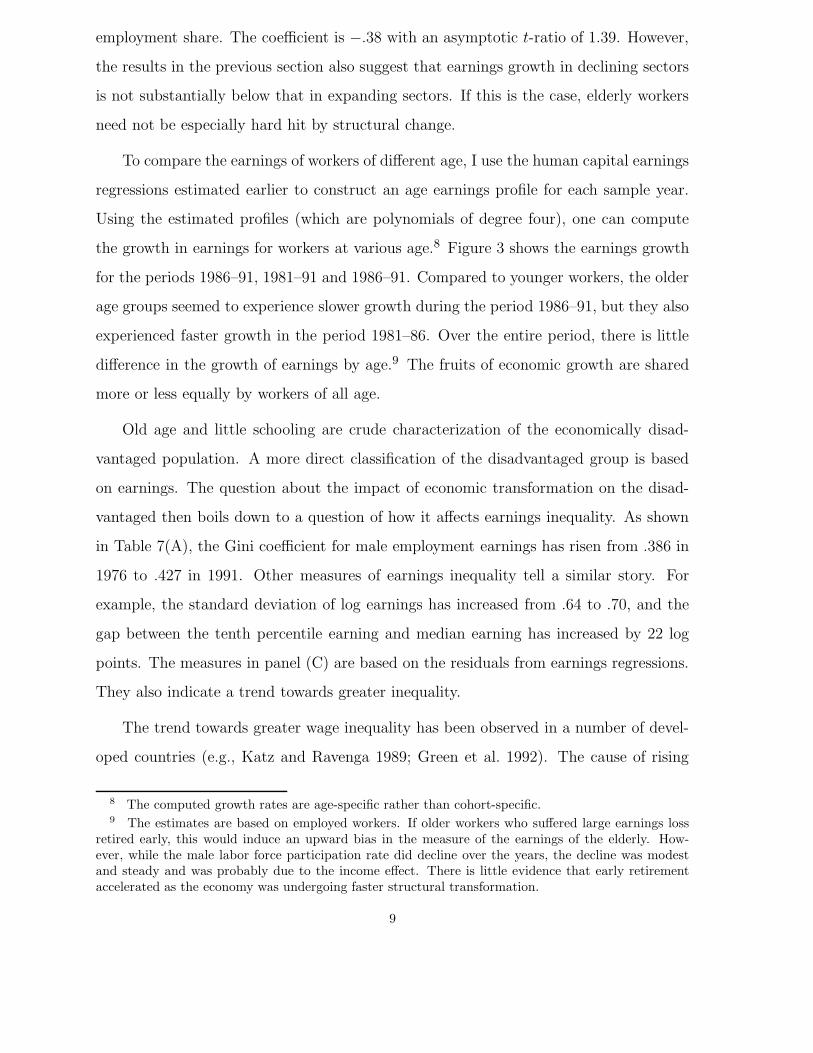
relevant time series is too short to allow a detailed investigation of the relationship. I
have constructed a yearly index of sectoral shifts based on 46 industries using data from
the Survey of Employment, Payroll and Vacancies. Figure 4 plots the movement of this
index and the movement of the unemployment rate. A quick look at the figure will
dispel any concern about the effect of structural change on Hong Kong’s unemployment
in the recent past.
Another common concern about structural change centers around the ability of dis-
placed workers to find new jobs. If displaced workers cannot find new jobs easily, this
would show up in industry-specific unemployment rates; in particular, the industry-
specific unemployment rate will rise in the declining sectors. On the other hand, if labor
markets function smoothly and there is relatively little industry-specific human capital,
there need not be any relationship between changes in sectoral shares and unemploy-
ment. The labor market adjustments can be achieved through wage changes and worker
mobility.
I have collected quarterly employment and unemployment figures from various issues
of the Quarterly Report of the General Household Survey. Industries are classified into
four broad categories: manufacturing; construction; wholesale and retail trade, restau-
rants and hotels; and services. I constructed the industry-specific unemployment rates
from the previous industry of the unemployed. The change in employment share is cal-
culated from four-quarter difference in employment share. The resulting series extends
from 1983Q1 to 1993Q2. Thus the sample contains a total of 164 observations from 4
sectors. Because of the relatively small size of the General Household Survey, some of the
estimates on unemployment are infested with large standard errors. With this caveat in
mind, I estimate a model in which the industry-specific unemployment rate depends on
11

lag unemployment and on change in employment share. Columns (1) and (2) of Table 9
show the results. The coefficient on change in employment share is negative but is small
in magnitude (a less than .1 percentage point increase in unemployment associated with
every 1 percentage point fall in employment share) and statistically insignificant (at the
.10 level). One problem of using ordinary least squares is that, since the unemployment
rate is measured as a fraction of employment, measurement errors in industry employ-
ment will introduce a negative correlation between the disturbance term and the change
in employment share. I use the lagged change in employment share as an instrumental
variable and re-estimate the model. The results are displayed in the last two columns
of Table 9. The magnitude and statistical significance of the coefficient on change in
employment share is further reduced.
4. Summary and Conclusions
This paper gathers microeconomic evidence to evaluate the impact of sectoral shifts on
workers in Hong Kong. Among the main findings are the following:
(1) The rate of economic transformation has accelerated since the 1980s.
(2) Earnings in expanding sectors have risen faster than earnings in declining sectors.
The magnitude of the effect, however, is small and variable. A one percentage point
increase (which represents a twenty five percent increase) in employment share is esti-
mated to increase sectoral earnings by about 1.8 percent.
(3) There is some evidence that workers with no education face a widening earnings gap
relative to other workers. There is no evidence that the gap between old workers and
other workers has widened.
(4) The degree of wage inequality has increased. This paper, however, does not address
the relation between accelerated structural change and the observed rising wage disper-
sion.
(5) There is no evidence that structural change increases aggregate unemployment or
unemployment in declining sectors.
The findings here paint a picture of a well-functioning labor market that adapts
12
smoothly to changes in labor demand. Workers in Hong Kong are relatively mobile across
different economic sectors. The reallocation of labor across sectors necessitated by accel-
erated economic transformation has been accomplished with little effect on inter-industry
wages and on unemployment. While the economically disadvantaged experienced a de-
cline in their relative economic position, the level of their real earnings continued to rise
at a rate much faster than workers in other developed countries. It is also important
to point out that economic transformation in Hong Kong has mainly involved a shift
towards high wage sectors. Even if real earnings in each sector had remained stagnant,
the reallocation of labor from the low wage sectors to the high wage sectors would have
increased average real earnings by 12.3 percent from 1976 to 1991. During this period
the actual increase in average real earnings was 78.7 percent. In other words the eco-
nomic transformation of Hong Kong accounts for more than 15 percent (i.e., 12.3/78.7)
of the growth in real earnings.
13
References
Abraham, Katherine and Lawrence Katz. “Cyclical Unemployment: Sectoral Shifts or
Aggregate Disturbances?” Journal of Political Economy 94 (June 1986): 507–522.
Bartel, Ann P. and Frank R. Lichtenberg. “The Comparative Advantage of Educated
Workers in Implementing New Technology.” Review of Economics and Statistics 69
(February 1987): 1:11.
Bound, John and George Johnson. “Wages in the United States During the 1980s and
Beyond.” In M. Kosters, ed., Workers and Their Wages. Washington: AEI Press,
1991.
. “Changes in the Structure of Wages in the 1980’s: An Evaluation of Alternative
Explanations.” American Economic Review 82 (June 1992): 371–392.
Census and Statistics Department. Hong Kong 1991 Population Census: Summary
Report. Hong Kong: Government Printer, 1992.
Chambers, J.M., Cleveland, W.S., Keiner, B. and P.A. Tukey. Graphical Methods for
Data Analysis. Belmont: Wadsworth, 1983.
Cleveland, W.S. “Robust Locally Weighted Regression and Smoothing Scatterplots.”
Journal of American Statistical Association 74 (December 1979): 829–836.
Green, G., Coder, J. and P. Ryscavage. “International Comparison of Earnings In-
equality for Men in the 1980s.” Review of Income and Wealth 38 (March 1992):
1–15.
Greenwood, John. “The Changing Structure and Competitiveness of the Hong Kong
Economy.” Asian Monetary Monitor 14 (November 1990): 21–31.
Juhn, Chinhui, Murphy, Kevin M. and Brooks Pierce. “Wage Inequality and the Rise
in Returns to Skill.” Journal of Political Economy 101 (June 1993): 410–442.
14
Katz, Lawrence F. and Kevin M. Murphy. “Changes in Relative Wages, 1963–1987:
Supply and Demand Factors.” Quarterly Journal of Economics 107 (February 1992):
35–78.
Lilien, David M. “Sectoral Shifts and Cyclical Unemployment.” Journal of Political
Economy 90 (August 1982): 777–793.
Lui, T.L. and S. Chiu. “Industrial Restructuring and Labour-Market Adjustment under
Positive Noninterventionism: The Case of Hong Kong.” Environment and Planning
A 25 (1993): 63–79.
Lui, Hon Kwong and Wing Suen. “The Narrowing Gender Gap in Hong Kong: 1976–
1986.” Asian Economic Journal 7 (July 1993): 167–180.
Mok, Victor. The Development and Structural Change of the Hong Kong Economy.
Hong Kong: Joint Publishing, 1993.
Murphy, Kevin M. and Robert H. Topel. “The Evolution of Unemployment in the
United States.” NBER Macroeconomics Annual 2 (1987): 11–58.
Murphy, Kevin M. and Finis Welch. “Wage Premiums for College Graduates: Recent
Growth and Possible Explanations.” Educational Researcher 18 (May 1989): 17–26.
. “The Role of International Trade in Wage Differentials.” In M. Kosters, ed.,
Workers and Their Wages. Washington: AEI Press, 1991.
Schultz, T.W. “The Value of the Ability to Deal with Disequilibria.” Journal of Eco-
nomic Literature 13 (1975): 872–876.
Stigler, George J. and Robert A. Sherwin. “The Extent of the Market.” Journal of Law
and Economics 28 (October 1985): 555–585.
Wong, R.Y.C., Liu, P.W. and A.K.F. Siu. Inflation in Hong Kong: Patterns, Causes
and Policies. Hong Kong: Business and Professional Federation of Hong Kong, 1991.
Young, Alwyn. “A Tale of Two Cities: Factor Accumulation and Technical Change in
Hong Kong and Singapore.” NBER Macroeconomics Annual 7 (1992): 13–54.
15
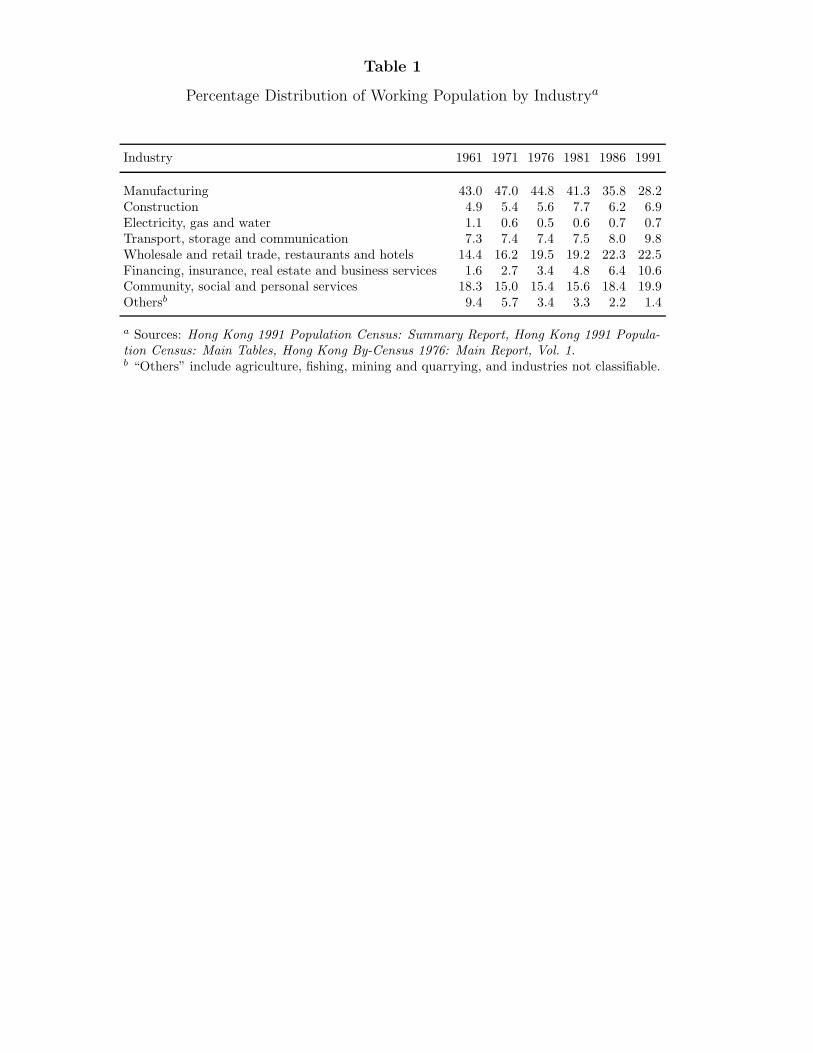
Table 1
Percentage Distribution of Working Population by Industrya
Industry 1961 1971 1976 1981 1986 1991
Manufacturing 43.0 47.0 44.8 41.3 35.8 28.2Construction 4.9 5.4 5.6 7.7 6.2 6.9Electricity, gas and water 1.1 0.6 0.5 0.6 0.7 0.7Transport, storage and communication 7.3 7.4 7.4 7.5 8.0 9.8Wholesale and retail trade, restaurants and hotels 14.4 16.2 19.5 19.2 22.3 22.5Financing, insurance, real estate and business services 1.6 2.7 3.4 4.8 6.4 10.6Community, social and personal services 18.3 15.0 15.4 15.6 18.4 19.9Othersb 9.4 5.7 3.4 3.3 2.2 1.4
a Sources: Hong Kong 1991 Population Census: Summary Report, Hong Kong 1991 Popula-
tion Census: Main Tables, Hong Kong By-Census 1976: Main Report, Vol. 1.b “Others” include agriculture, fishing, mining and quarrying, and industries not classifiable.
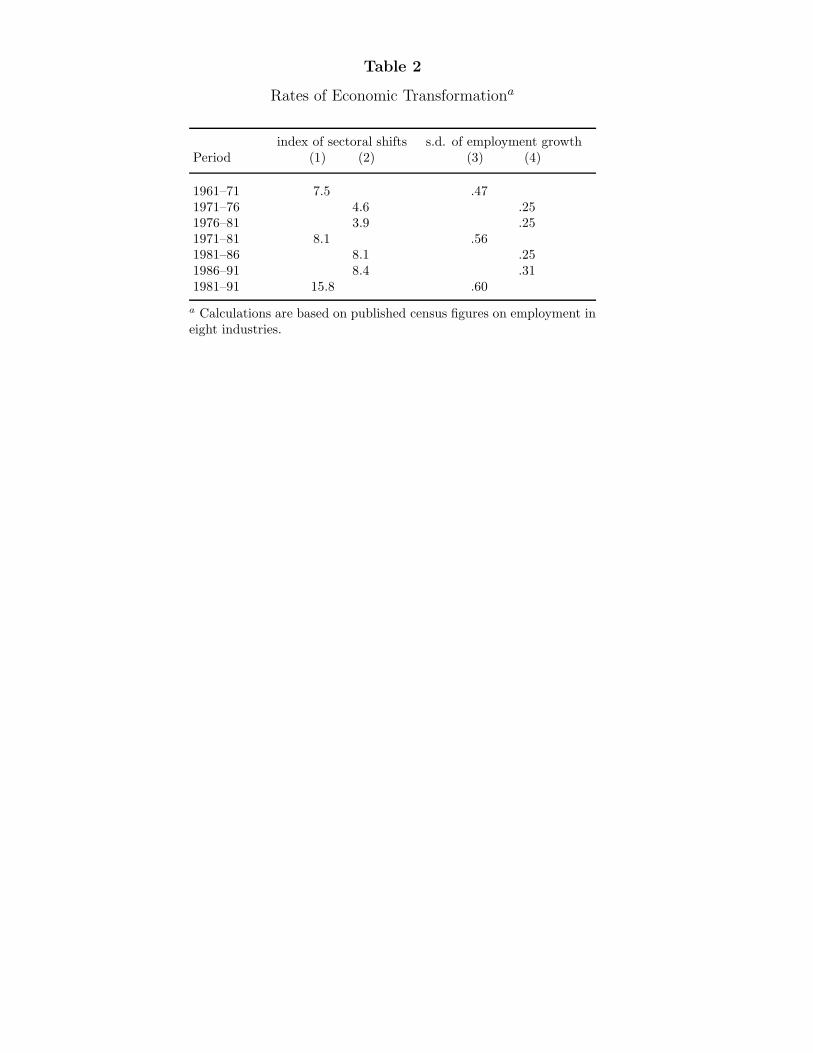
Table 2
Rates of Economic Transformationa
index of sectoral shifts s.d. of employment growthPeriod (1) (2) (3) (4)
1961–71 7.5 .471971–76 4.6 .251976–81 3.9 .251971–81 8.1 .561981–86 8.1 .251986–91 8.4 .311981–91 15.8 .60
a Calculations are based on published census figures on employment ineight industries.
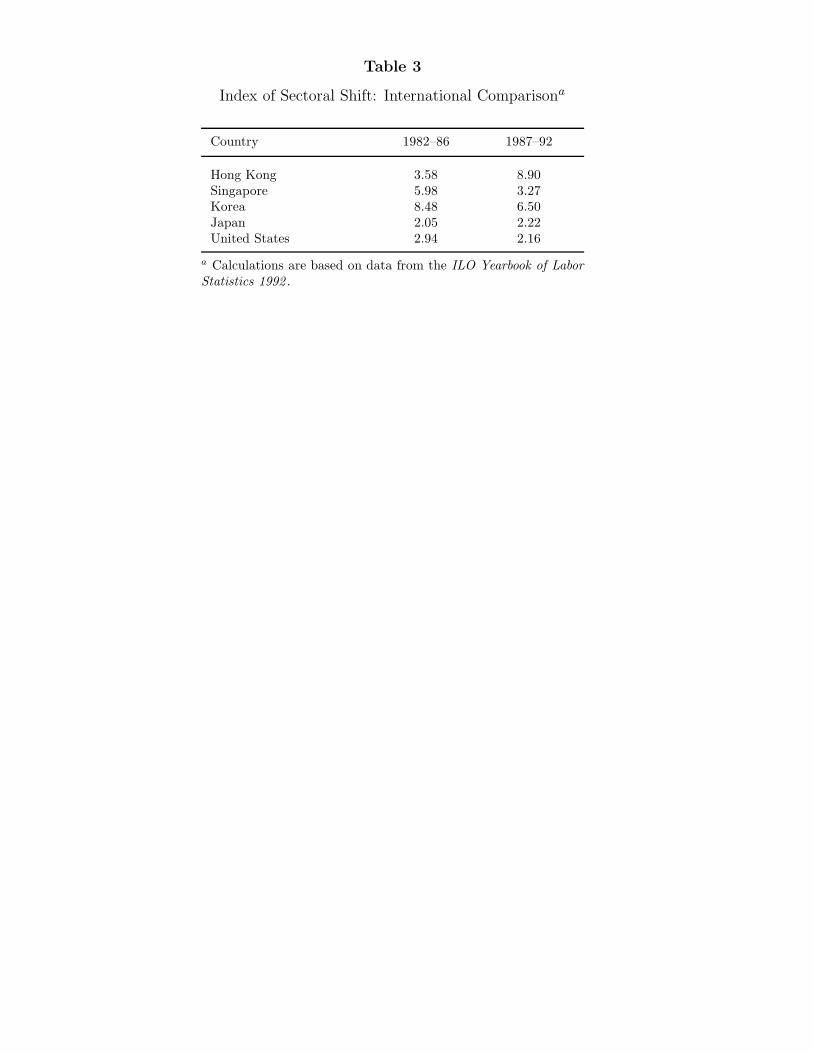
Table 3
Index of Sectoral Shift: International Comparisona
Country 1982–86 1987–92
Hong Kong 3.58 8.90Singapore 5.98 3.27Korea 8.48 6.50Japan 2.05 2.22United States 2.94 2.16
a Calculations are based on data from the ILO Yearbook of Labor
Statistics 1992 .
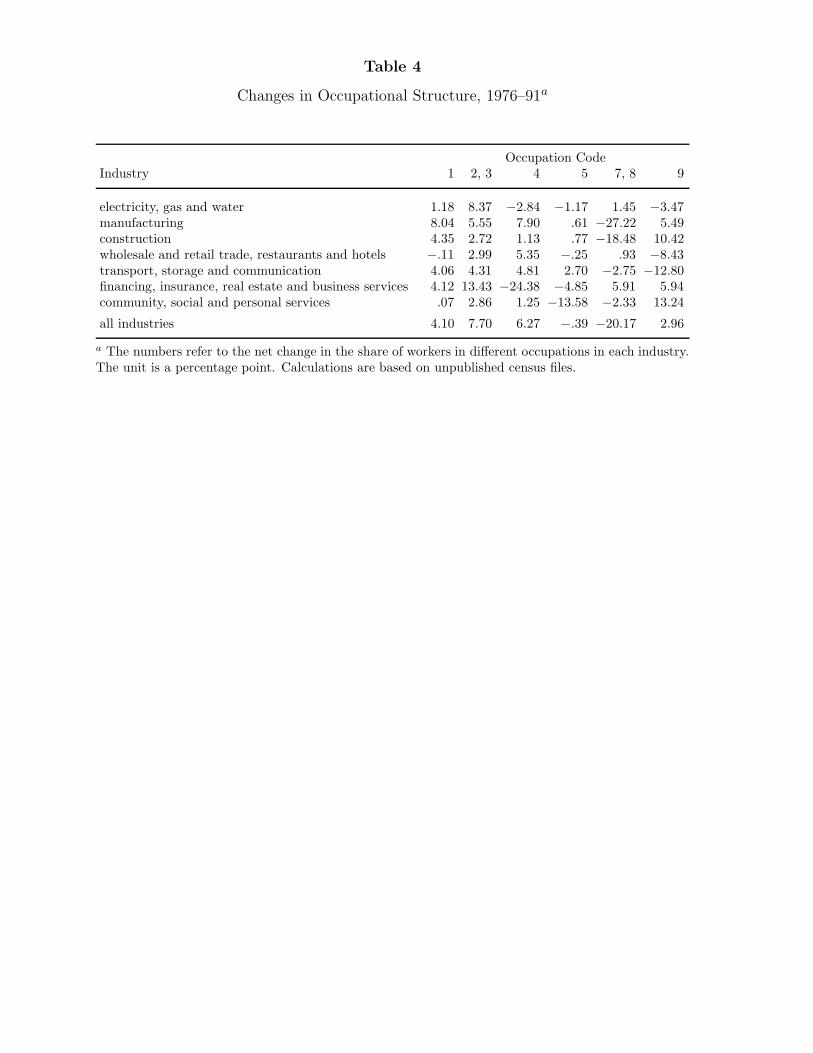
Table 4
Changes in Occupational Structure, 1976–91a
Occupation CodeIndustry 1 2, 3 4 5 7, 8 9
electricity, gas and water 1.18 8.37 −2.84 −1.17 1.45 −3.47manufacturing 8.04 5.55 7.90 .61 −27.22 5.49construction 4.35 2.72 1.13 .77 −18.48 10.42wholesale and retail trade, restaurants and hotels −.11 2.99 5.35 −.25 .93 −8.43transport, storage and communication 4.06 4.31 4.81 2.70 −2.75 −12.80financing, insurance, real estate and business services 4.12 13.43 −24.38 −4.85 5.91 5.94community, social and personal services .07 2.86 1.25 −13.58 −2.33 13.24
all industries 4.10 7.70 6.27 −.39 −20.17 2.96
a The numbers refer to the net change in the share of workers in different occupations in each industry.The unit is a percentage point. Calculations are based on unpublished census files.
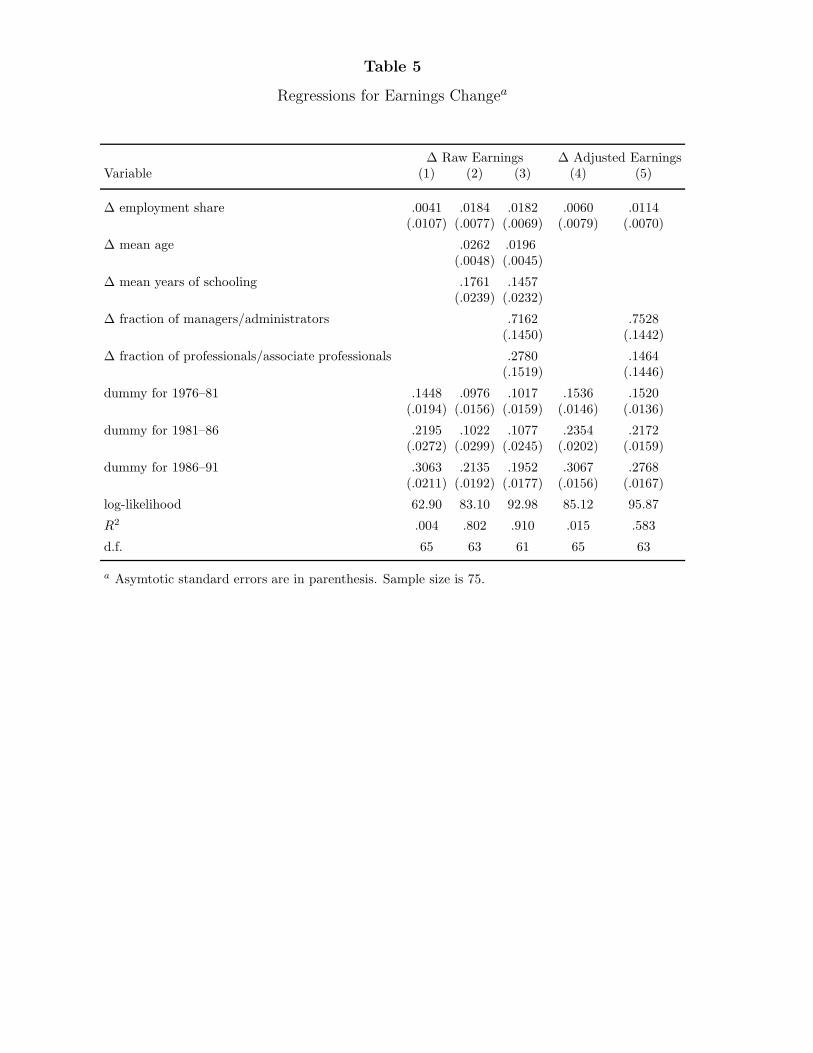
Table 5
Regressions for Earnings Changea
∆ Raw Earnings ∆ Adjusted EarningsVariable (1) (2) (3) (4) (5)
∆ employment share .0041 .0184 .0182 .0060 .0114(.0107) (.0077) (.0069) (.0079) (.0070)
∆ mean age .0262 .0196(.0048) (.0045)
∆ mean years of schooling .1761 .1457(.0239) (.0232)
∆ fraction of managers/administrators .7162 .7528(.1450) (.1442)
∆ fraction of professionals/associate professionals .2780 .1464(.1519) (.1446)
dummy for 1976–81 .1448 .0976 .1017 .1536 .1520(.0194) (.0156) (.0159) (.0146) (.0136)
dummy for 1981–86 .2195 .1022 .1077 .2354 .2172(.0272) (.0299) (.0245) (.0202) (.0159)
dummy for 1986–91 .3063 .2135 .1952 .3067 .2768(.0211) (.0192) (.0177) (.0156) (.0167)
log-likelihood 62.90 83.10 92.98 85.12 95.87
R2 .004 .802 .910 .015 .583
d.f. 65 63 61 65 63
a Asymtotic standard errors are in parenthesis. Sample size is 75.
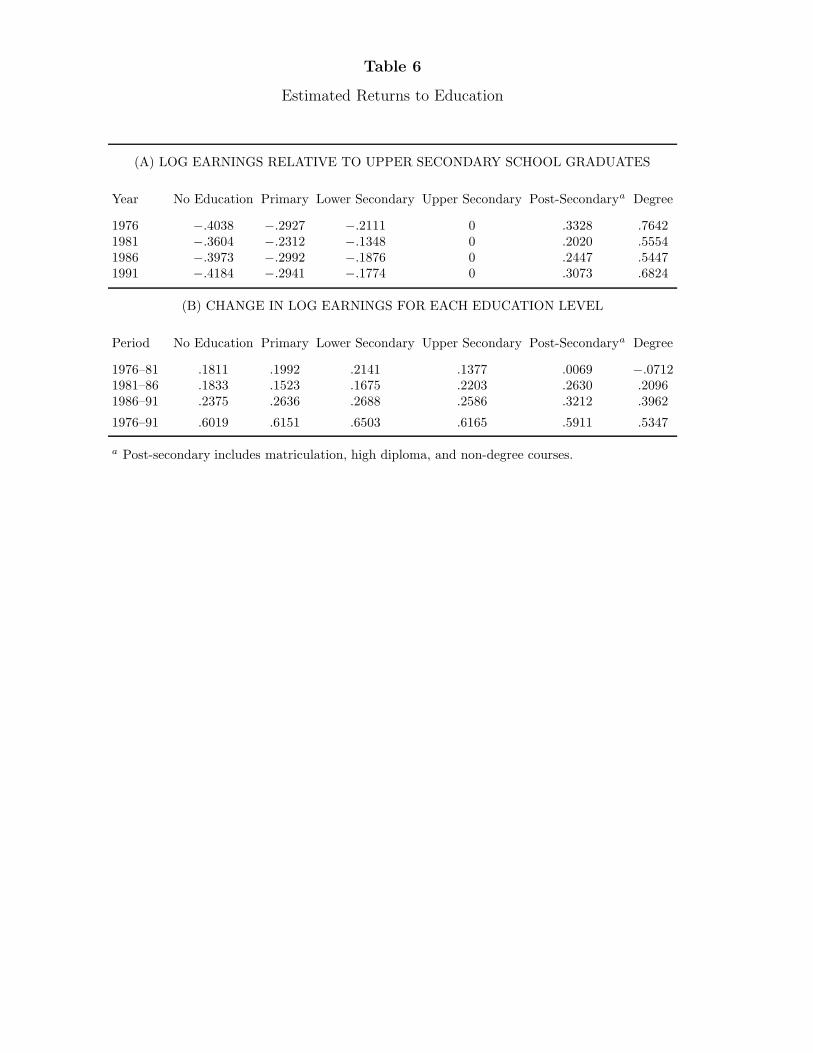
Table 6
Estimated Returns to Education
(A) LOG EARNINGS RELATIVE TO UPPER SECONDARY SCHOOL GRADUATES
Year No Education Primary Lower Secondary Upper Secondary Post-Secondarya Degree
1976 −.4038 −.2927 −.2111 0 .3328 .76421981 −.3604 −.2312 −.1348 0 .2020 .55541986 −.3973 −.2992 −.1876 0 .2447 .54471991 −.4184 −.2941 −.1774 0 .3073 .6824
(B) CHANGE IN LOG EARNINGS FOR EACH EDUCATION LEVEL
Period No Education Primary Lower Secondary Upper Secondary Post-Secondarya Degree
1976–81 .1811 .1992 .2141 .1377 .0069 −.07121981–86 .1833 .1523 .1675 .2203 .2630 .20961986–91 .2375 .2636 .2688 .2586 .3212 .3962
1976–91 .6019 .6151 .6503 .6165 .5911 .5347
a Post-secondary includes matriculation, high diploma, and non-degree courses.
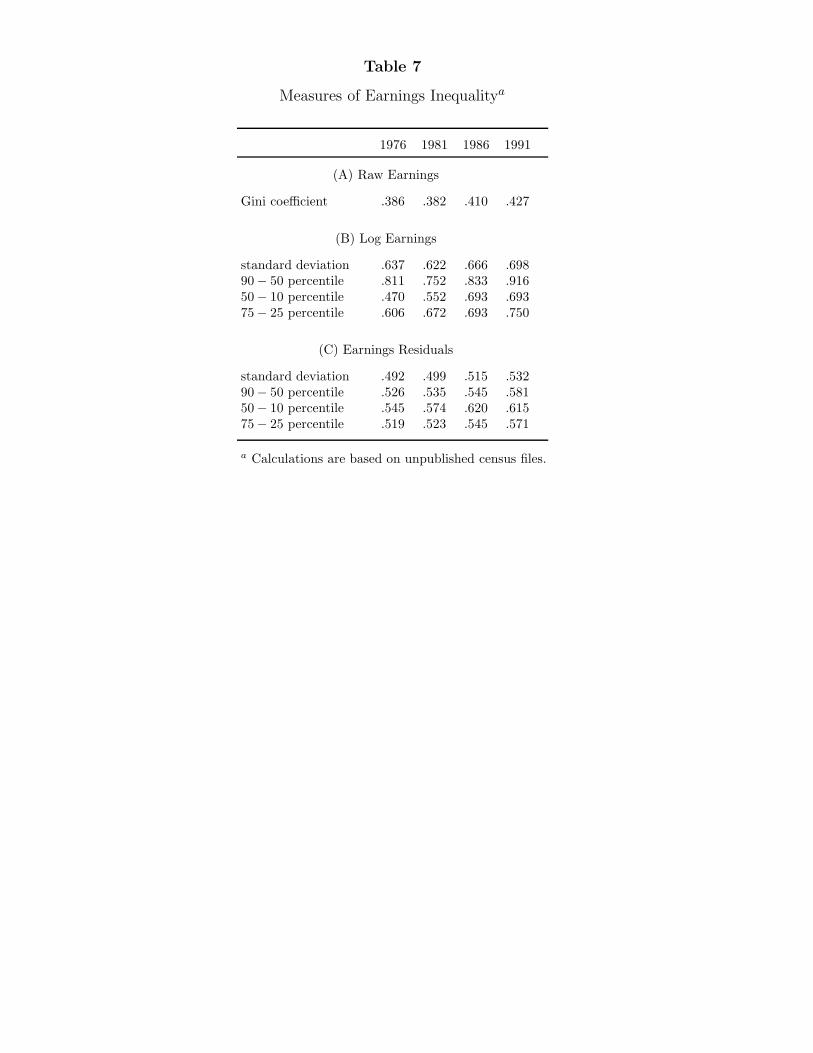
Table 7
Measures of Earnings Inequalitya
1976 1981 1986 1991
(A) Raw Earnings
Gini coefficient .386 .382 .410 .427
(B) Log Earnings
standard deviation .637 .622 .666 .69890− 50 percentile .811 .752 .833 .91650− 10 percentile .470 .552 .693 .69375− 25 percentile .606 .672 .693 .750
(C) Earnings Residuals
standard deviation .492 .499 .515 .53290− 50 percentile .526 .535 .545 .58150− 10 percentile .545 .574 .620 .61575− 25 percentile .519 .523 .545 .571
a Calculations are based on unpublished census files.
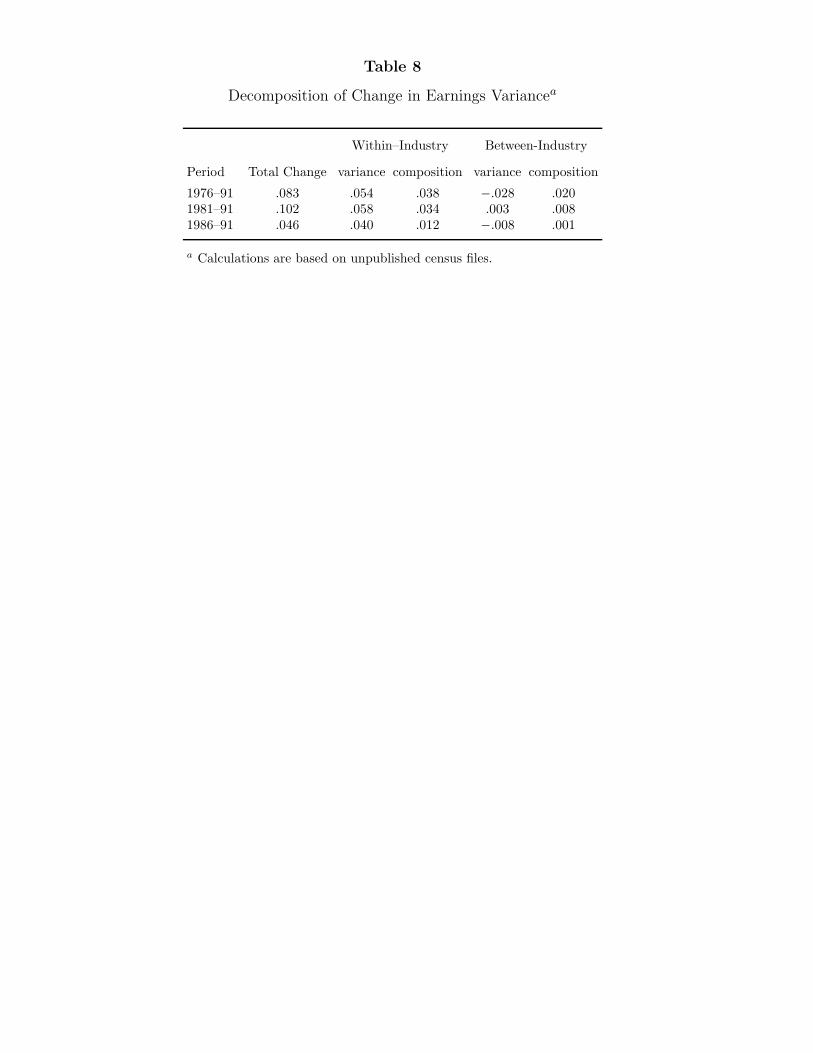
Table 8
Decomposition of Change in Earnings Variancea
Within–Industry Between-Industry
Period Total Change variance composition variance composition
1976–91 .083 .054 .038 −.028 .0201981–91 .102 .058 .034 .003 .0081986–91 .046 .040 .012 −.008 .001
a Calculations are based on unpublished census files.
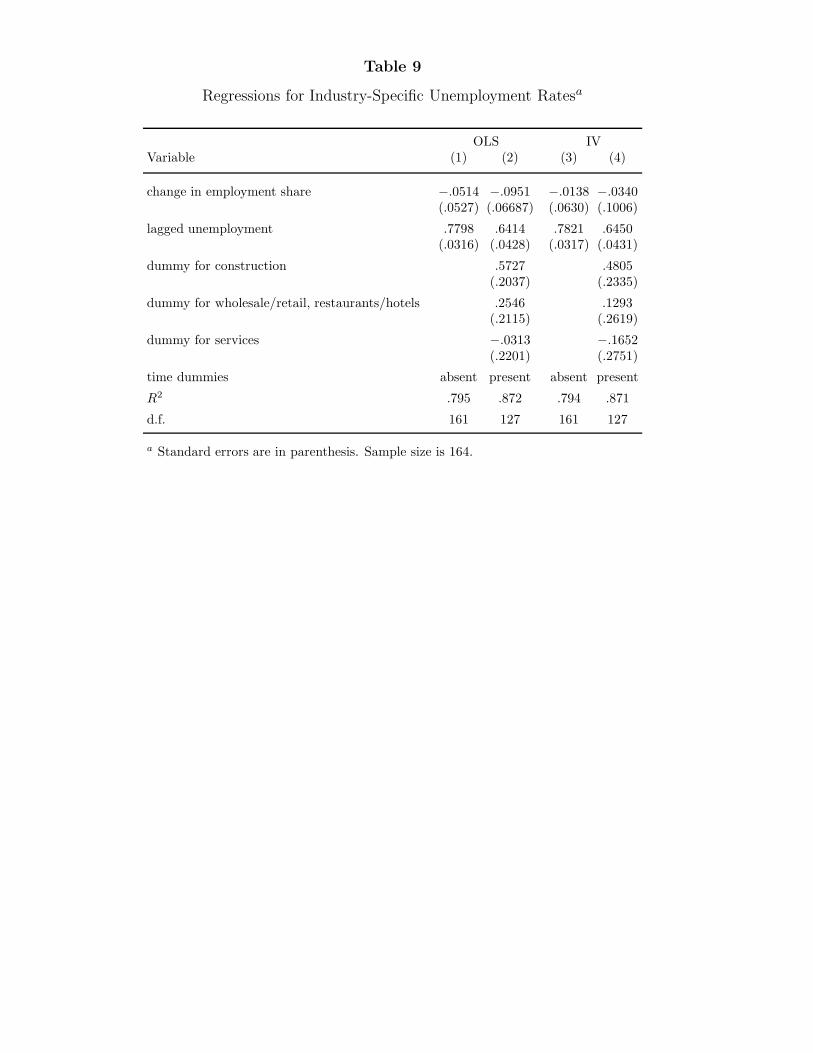
Table 9
Regressions for Industry-Specific Unemployment Ratesa
OLS IVVariable (1) (2) (3) (4)
change in employment share −.0514 −.0951 −.0138 −.0340(.0527) (.06687) (.0630) (.1006)
lagged unemployment .7798 .6414 .7821 .6450(.0316) (.0428) (.0317) (.0431)
dummy for construction .5727 .4805(.2037) (.2335)
dummy for wholesale/retail, restaurants/hotels .2546 .1293(.2115) (.2619)
dummy for services −.0313 −.1652(.2201) (.2751)
time dummies absent present absent present
R2 .795 .872 .794 .871
d.f. 161 127 161 127
a Standard errors are in parenthesis. Sample size is 164.
•
••
•
•
•
•
••••••
••••••
•
•
••
•
•
•
•
•
••
•
••
•
•
•
•
•
•
•
•
••
••
•
•
••
•
•
•
•
•
•
•••
•
•
•
•
• ••
•
••
••
••
••
•
adjusted change in employment share
adju
sted
cha
nge
in m
ean
log
earn
ings
-2 0 2 4
-0.2
-0.1
0.0
0.1
0.2
•
••
•
•
•
•
••••••
••••••
•
•
••
•
•
•
•
•
••
•
••
•
•
•
•
•
•
•
•
••
••
•
•
••
•
•
•
•
•
•
•••
•
•
•
•
• ••
•
••
••
••
••
•
FIGURE 1
Adjusted Variables Plot
year
log
earn
ings
1976 1978 1980 1982 1984 1986 1988 1990
8.0
8.2
8.4
8.6
8.8
secondaryprimaryno education
FIGURE 2
Trend of Earnings by Education
age
grow
th in
log
earn
ings
20 30 40 50 60
0.2
0.4
0.6
0.8 1976-91
1981-911986-91
FIGURE 3
Earnings Growth by Age
1982 1983 1984 1985 1986 1987 1988 1989 1990
12
34
index of sectoral shiftunemployment rate
FIGURE 4
Sectoral Shift and Unemployment
Source: Annual Digest of Statistics 1991
Recommended