Say Cheese: Jim and Gayle Tanner of Bonnie BlueFarm proudly display products in their new cheesecave. TDA is helping farmers, like the Tanners,realize their dreams all across Tennessee.
Table of Contents Tennessee Department of Agriculture
The ChangingFaces of
Agriculture
Tennessee Department of AgricultureGovernor Phil Bredesen ..................................................2
Commissioner Ken Givens ..............................................3Directory ..........................................................................4Administration ................................................................5
Ag Crime UnitCommodity DistributionWater ResourcesBoll Weevil ProgramAg Enhancement Summary ......................................8
Market Development ......................................................9Agribusiness DevelopmentInternational Marketing Pick Tennessee Products
Forestry ..........................................................................12Forest Protection, State Forests,Reforestation, Landowner Assistance, Water Quality, Urban Forestry
Regulatory Services ......................................................14Ag Inputs, Animal Health, Food & Dairy,Laboratory, Motor Fuel Quality, Pesticides,Plant Certification, Weights & Measures
USDA, National Agricultural Statistics Service ............17
Statistical Summary
Tennessee Agriculture & Forestry ................................18State Summary ..............................................................19
Farms, Land in Farms & ValueCash ReceiptsFinancial IndicatorsRank in U.S. AgricultureTop Ranking Livestock & Crop Counties
Crops ..............................................................................24SummaryRecord Highs & LowsNursery, Floriculture & Hay StocksTillage Systems & Biotechnology
Livestock, Dairy & Poultry............................................28Livestock by ClassLivestock OperationsFederally Inspected SlaughterLivestock Production, Disposition & IncomeMilk, Dairy Products, Trout & HoneyPoultry & Equine
Agricultural Exports ......................................................32Weather ..........................................................................33
First and Last Freeze DatesPlanting and Harvesting DatesNormal Precipitation
Agricultural & Forestry Organizations 36
Markets for fiber crops, likeKenaf, are being explored byMemphis Bioworks and TDA.
1
Tennessee Forestry Training Camp
1952 Tree Planting - reforestation.
1944 Junior Champion, MurrayMiles Jr. proudly shows a Jerseyheifer in Rutherford County.
Tom Womack, Project Manager, TDACasey Mahoney, Project Manager, TDA
Cover photo by Andrew McMurtrie, Photographic Services
Design and layout by Art Colebank, Graphic Arts Selected text photographs courtesy of Photographic Services,
Tennessee Department of General Services

Commissioner Ken GivensGovernor Phil BredesenThe past year has been challenging in agriculture just as it
has been for other sectors of our economy.
As difficult as it has been, I’m as optimistic about the
future of farming in our state as I have ever been. Through the
Tennessee Agricultural Enhancement Program, farmers have
chosen in overwhelming numbers to re-invest in their
operations with an eye on the future.
Since the program’s inception and with the support of the
Tennessee General Assembly, we’ve been able to help nearly
11,000 Tennessee farmers invest in superior livestock, new technology, equipment and better
management practices that will help increase farm income in the future.
On one hand, ensuring a future for Tennessee farmers and forest landowners requires smart
investment. On the other, it requires better land-use planning and management on the part of
communities working with local landowners and developers.
I am proud to have joined with members of the Tennessee Tobacco Farmers Certifying Board
this year in announcing the donation of more than $165,700 to The Land Trust for Tennessee to
help protect working farms from development. Not only do profitable, viable farms help stimulate
our rural economy but they also add to the beauty of our landscape, provide balance in our
communities and improve our quality of life.
The donation follows the first statewide conference on farmland preservation held in 2008 and
a multi-year partnership between the Department of Agriculture and The Land Trust to provide
farm owners with options for the future.
These initiatives and others undertaken by the Department of Agriculture in concert with our
partners, I’m convinced, will help secure a brighter future for farmers, forest landowners and all
Tennesseans.
Sincerely,
Phil Bredesen
We have a great story to tell in agriculture!
While it’s easy to get discouraged in the face of what seems
to be negative news at every turn, we have many wonderful
things happening on Tennessee farms across the state.
Take the Tanners, for example. Our cover story is about
having a dream and making it happen. Jim and Gayle left a
fast-paced life in California and settled in Wayne County. Today
they're one of three licensed goat dairies in the state. They produce some of the country's best
gourmet cheeses sold fresh at farmers markets and served in fine restaurants.
Whether carrying on a family tradition or farming for the first time, carving out a future in new
and innovative ways is being replicated on farms throughout Tennessee thanks in part to the
Tennessee Agricultural Enhancement Program.
Since 2005, the department has invested nearly $58 million helping farmers like the Tanners
expand or improve their operation in order to be more profitable. And, for every TAEP dollar
invested, $4 to $5 is generated in additional economic activity.
From headgates, squeeze chutes and better cattle genetics, to hay barns, grain bins and organics,
we’re helping thousands of Tennesseans reach their dream and to secure their future in farming.
The investments we’re making through TAEP are complemented by the work that continues
everyday in our marketing, regulatory, water quality and forestry programs. From soil and water
conservation, forest fire protection and school lunches to animal health, pesticide safety and food
safety, we continue to provide important services to all Tennesseans.
I hope you’ll take time to read more about how we’re serving you. You’ll also find the latest
farm production numbers made possible through our long-standing partnership with the Tennessee
Field Office of the USDA National Agricultural Statistics Service.
Sincerely,
Ken Givens
Telling the story of agricultureat Ag Day on the Hill 2009.(Commissioner Ken Givens,Milking Champion state Rep.Dale Ford and state Rep. Joe Towns, Jr.)Helping to pres
erve working farms
in Tennessee. (Land Trust for
Tennessee Executive Director Jean
C. Nelson, Governor Phil Bredesen
and Commissioner Ken Givens)
2 3

Tennessee Department of Agriculture
Administration provides budgetary, legal,
human resources and communications support
to help department programs achieve goals and
objectives in an efficient and cost effective
manner. Staff also works with legislators and
industry to ensure programs have adequate
statutory authority, staffing and clerical support.
Agricultural Crime Unit - The ACU
provides law enforcement support for the
department’s regulatory and forestry
programs related to animal and plant health,
food safety, pesticide use and wildland fire
arson investigation. The unit frequently
assists local law enforcement agencies in the
investigation and prosecution of crimes
related to livestock theft and illegal drug
manufacturing.
Boll Weevil Eradication Program - In
2009, cotton growers voted overwhelmingly to
continue boll weevil monitoring following the
successful completion of the active phase of the
eradication program. Additionally, all debt
associated with the program – more than $39
million – was retired a full five years ahead of
schedule, making the program 100 percent
grower funded.
Despite various setbacks, the program has
contributed to a string of record cotton yields
since its inception. According to the USDA-
NASS, an average of 909 pounds of cotton per
acre was harvested in 2008, the second highest
yield on record. In 2007, cotton was the state’s
top crop generating more than $307.5 million in
farm income.
While favorable weather and improved
varieties contributed to record yields, a major
factor has been the Boll Weevil Eradication
Program. The program has exceeded early
expectations in delivering both economic and
environmental benefits. The program
has not only contributed to a 200-plus pound
per acre increase in average cotton yields but
also a 40 to 90 percent reduction in cotton
insecticide use—a benefit to all Tennesseans.
Commodity Distribution – Tennessee
Department of Agriculture administers USDA’s
food distribution program for the National
School Lunch Program. This program supports
American agriculture while providing nutritious
food to schoolchildren. TDA also administers
the Emergency Food Assistance Program,
which supplements the diets of low-income
people. In FY 2009, 43.6 million pounds of
food valued at $43 million were ordered and
allocated for schools, childcare institutions and
non-profit charities.
Water Resources - The state
Agricultural Resources Conservation Fund
helps landowners install Best Management
Practices to improve water quality. In FY 2009,
Three Champs - Jr. Beef HeiferShow (1967) – Camon Price,Alston Winingham, Jerry Felts.
AdministrationTennessee Department of Agriculture
Ellington Agricultural Center
P.O. Box 40627, Nashville, TN 37204
615-837-5103, Fax 615-837-5333
TN.gov/agriculture
burnsafetn.org
nass.usda.gov/tn
picktnproducts.org
tnagmuseum.org
The Changing Faces of Agriculture
Our Mission:To serve the citizens of Tennessee by
promoting wise uses of our agricultural
and forest resources, developing economic
opportunities, and ensuring safe and
dependable food and fiber.
Cattle grazing on a Tennessee
farm. Cattle and calves
continue to be Tennessee’s top
farm commodity.
AdministrationKen Givens, Commissioner . . . . . . . . . 615-837-5100
Fax . . . . . . . . . . . . . . . . . . . . . . . . . 615-837-5333
Terry J. Oliver, Deputy Commissioner 615-837-5103
Adam Hill, Asst. Commissioner for
Policy & Legislation . . . . . . . . . . . . 615-837-5172
Larry Maxwell, Asst. Commissioner for
Administration & Grants. . . . . . . . . 615-837-5111
Agricultural Crime Unit. . . . . . . . . . . . 615-837-5181
Boll Weevil Eradication. . . . . . . . . . . . 615-837-5136
Commodity Distribution . . . . . . . . . . . 615-837-5162
Water Resources . . . . . . . . . . . . . . . . . 615-837-5305
USDA, NASS, Tennessee Field Office
Debra Kenerson, State Director . . . . . . 615-781-5300
Fax . . . . . . . . . . . . . . . . . . . . . . . . . 615-781-5303
ForestrySteve Scott, State Forester & Director. 615-837-5420
Fax . . . . . . . . . . . . . . . . . . . . . . . . . 615-837-5003
Jere Jeter, Asst. State Forester for
Operations. . . . . . . . . . . . . . . . . . . . 615-837-5435
David Arnold, Asst. State Forester
for Grants, Programs & Support . . . 615-837-5426
District Offices
East Tennessee, Knoxville . . . . . . . . . . 865-594-6432
Cumberland, Cookeville . . . . . . . . . . . 931-526-9502
Highland Rim, Burns . . . . . . . . . . . . . . 615-797-3117
West Tennessee , Lexington . . . . . . . . . 731-968-6676
Market DevelopmentJoe Gaines, Asst. Commissioner . . . . . 615-837-5160
Fax . . . . . . . . . . . . . . . . . . . . . . . . . 615-837-5194
Dan Strasser, Director of Marketing . . 615-837-5298
Tennessee Agricultural Enhancement
Program. . . . . . . . . . . . . . . . . . . . . . 800-342-8206
Tennessee Agricultural Museum . . . . . 615-837-5197
USDA Market News . . . . . . . . . . . . . . 800-342-8206
Louis Langell, Officer in Charge . . . . . 615-837-5164
Regulatory ServicesJimmy Hopper, Director . . . . . . . . . . . 615-837-5150
Fax . . . . . . . . . . . . . . . . . . . . . . . . 615-837-5335
John Moore, Administrative Manager . 615-837-5341
Pesticide/Plant Certification Field Offices
Memphis . . . . . . . . . . . . . . . . . . . . . . . 901-754-0464
Jackson. . . . . . . . . . . . . . . . . . . . . . . . . 731-423-5647
McMinnville . . . . . . . . . . . . . . . . . . . . 931-815-9726
Knoxville . . . . . . . . . . . . . . . . . . . . . . . 865-594-6098
4 5

AdministrationTennessee Department of Agriculture
Approximately 1,400 BMPs were funded
through Soil Conservation Districts, local
Resource Conservation and Development
Districts and universities.
The goal of the federally-funded 319
Nonpoint Source Program is to remove rivers
and streams from the state’s list of impaired
waters. The program funds projects that address
nonpoint-source pollution from urban areas,
abandoned mine lands, farms and forests. In FY
2009, the program had 27 ongoing watershed
restoration projects, 13 educational projects and
13 watershed planning projects.
TDA reviews nutrient management plans
associated with the federal permitting program
for Concentrated Animal Feeding Operations,
administered by the Tennessee Department of
Environment and Conservation. A total of 366
farms have applied since the program’s
inception in 1999.
Community Facilities: Boosting AgEducation and Enhancing Livestock
Community facilities designed to support
youth and adult agricultural education programs
and to promote better livestock management skills
are cropping up across Tennessee thanks to the
Tennessee Agricultural Enhancement Program.
“These multi-purpose facilities are not only
meant to support 4-H and FFA activities but to
encourage better animal care and marketing
practices by area farmers,” said state Agriculture
Commissioner Ken Givens. “In three years, we’ve
been able to help construct, expand and equip 11
facilities all across the state that will support local
agricultural activities for years to come.”
In 2006, the department began funding the
development of local facilities, usually centered
around high school agricultural education FFA and
4-H programs, where there is community support
and a local government entity to oversee the
project.
“By partnering with local school systems, FFA
and Extension programs, they are truly community
supported and help serve the needs of the greater
agricultural community where they are located,”
added Givens.
There is a great demand for community
agricultural learning facilities.
“We’ve had more requests than we’ve been
able to fund, which tells us that these facilities are
needed and will be put to good use,” said Larry
Maxwell, program coordinator and Assistant
Commissioner. “We’ve been able to partner with
county governments, USDA Rural Development,
local suppliers and organizations in many cases.
And, that’s what we’re looking for– demonstrated
community support so that there is pride of
ownership involved.”
Heritage High School in Blount County opened
the doors on a new agricultural pavilion last year,
complete with a 40- by 75-foot arena, with the help
of a $73,000 TAEP grant. Agricultural instructors
Jon Waters and Judy Pearson described the project
as a “dream come true.”
“So many more of our students will have the
opportunity to be involved in the livestock industry
because of this facility,” said Waters. “We knew we
had a need here, and the kids showed the interest
and really worked hard to make it a reality. With the
help of the state, Foothills Farmers Cooperative, the
county, and the community as a whole, it has
provided for us an opportunity that a lot of places
don’t have.”
Other features of the facility include a wash bay,
meeting room, concession stand, restrooms and a
dry composting bin that handles animal waste and
minimizes odor. The facility will be used for adult
education and farmer demonstrations as well as
classroom instruction for high school students.
McEwen High School in Humphreys County
opened a new multi-purpose facility in May, funded
in part with a $150,000 TAEP grant from the
department. The facility will help greatly improve
students’ experience in animal science, livestock
management and in the program’s new pre-
veterinary classes.
“We wanted a place to give students hands-on
experience in dealing with livestock as well as a
place to hold local livestock shows and adult
education events,” said Glenn Ross, agriculture
instructor and FFA Advisor. “We think we have the
ideal facility.”
The 60-by-140-foot facility features a covered,
open-sided arena and an enclosed space that
includes a meeting room, break area and office.
“It’s the best thing that has happened to the
agriculture department since I have been here,
without a doubt,” added Ross.
With the help of TAEP funding, facilities have
also opened in Dyer, Gibson, Grainger, Lauderdale,
McMinn, Putnam, Trousdale and Weakley counties
with others in progress or under consideration for
funding.
“These projects mean a lot for the rural
communities that they serve, and we hope to simply
spark a vision for what agriculture can do for our
kids, our farmers and our rural economy by making
them happen,” said Givens.
Excerpts courtesy of Tennessee Cooperator.
The Changing Faces of Agriculture
Governor Phil Bredesen gets up closeand personal with cattle shown at the Trousdale County Agricultural Pavilion.
Governor Phil Bredesen, state Rep.
Stratton Bone and other officials h
elp
dedicate the Trousdale County
Agricultural Pavilion.
FFA students beam with pride
at the Heritage High School
Agricultural Pavilion in
Blount County.
Pho
to b
y C
hris
Vil
line
s
6 7
AdministrationTennessee Department of Agriculture
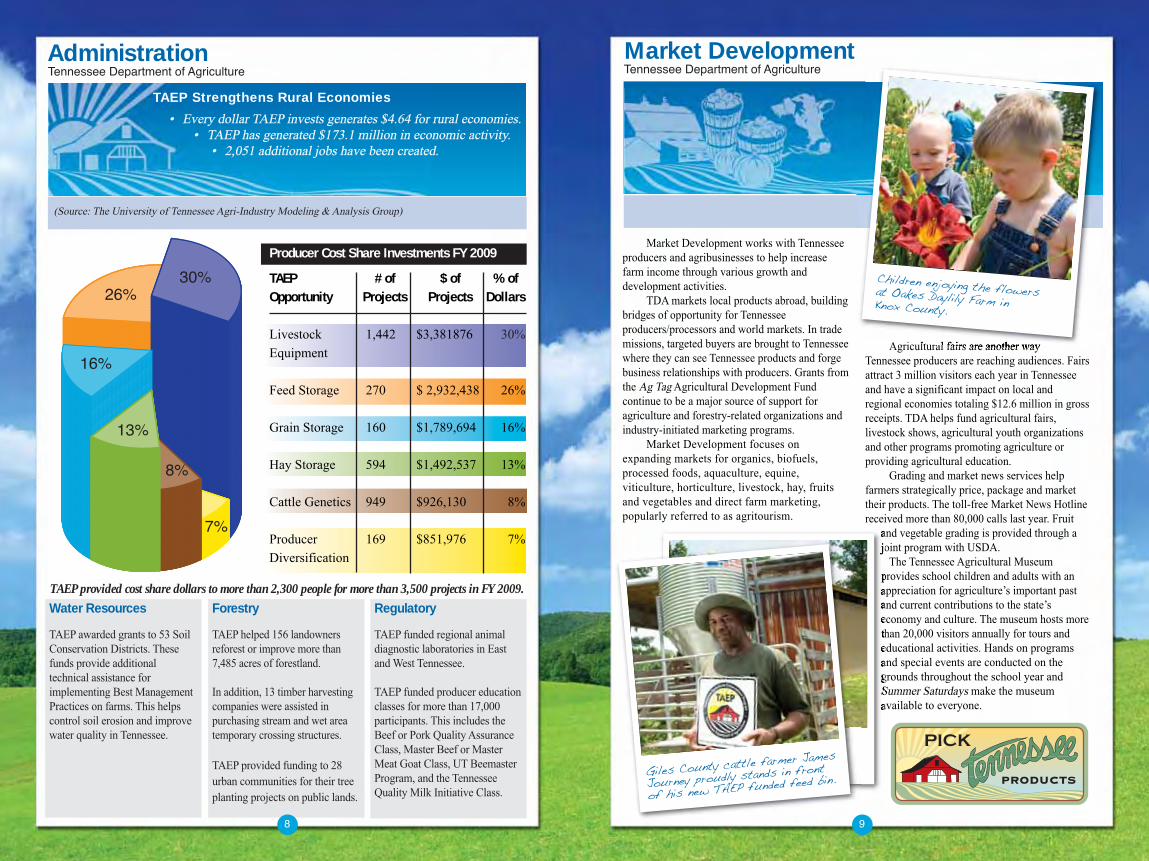
Market Development works with Tennessee
producers and agribusinesses to help increase
farm income through various growth and
development activities.
TDA markets local products abroad, building
bridges of opportunity for Tennessee
producers/processors and world markets. In trade
missions, targeted buyers are brought to Tennessee
where they can see Tennessee products and forge
business relationships with producers. Grants from
the Ag Tag Agricultural Development Fund
continue to be a major source of support for
agriculture and forestry-related organizations and
industry-initiated marketing programs.
Market Development focuses on
expanding markets for organics, biofuels,
processed foods, aquaculture, equine,
viticulture, horticulture, livestock, hay, fruits
and vegetables and direct farm marketing,
popularly referred to as agritourism.
Agricultural fairs are another way
Tennessee producers are reaching audiences. Fairs
attract 3 million visitors each year in Tennessee
and have a significant impact on local and
regional economies totaling $12.6 million in gross
receipts. TDA helps fund agricultural fairs,
livestock shows, agricultural youth organizations
and other programs promoting agriculture or
providing agricultural education.
Grading and market news services help
farmers strategically price, package and market
their products. The toll-free Market News Hotline
received more than 80,000 calls last year. Fruit
and vegetable grading is provided through a
joint program with USDA.
The Tennessee Agricultural Museum
provides school children and adults with an
appreciation for agriculture’s important past
and current contributions to the state’s
economy and culture. The museum hosts more
than 20,000 visitors annually for tours and
educational activities. Hands on programs
and special events are conducted on the
grounds throughout the school year and
Summer Saturdays make the museum
available to everyone.
Market Development
Children enjoying the flowers at Oakes Daylily Farm in Knox County.
TAEP Strengthens Rural Economies
• Every dollar TAEP invests generates $4.64 for rural economies.
• TAEP has generated $173.1 million in economic activity.
• 2,051 additional jobs have been created.
Producer Cost Share Investments FY 2009
TAEP # of $ of % of Opportunity Projects Projects Dollars
Livestock 1,442 $3,381876 30%
Equipment
Feed Storage 270 $ 2,932,438 26%
Grain Storage 160 $1,789,694 16%
Hay Storage 594 $1,492,537 13%
Cattle Genetics 949 $926,130 8%
Producer 169 $851,976 7%
Diversification
Water Resources
TAEP awarded grants to 53 Soil
Conservation Districts. These
funds provide additional
technical assistance for
implementing Best Management
Practices on farms. This helps
control soil erosion and improve
water quality in Tennessee.
Forestry
TAEP helped 156 landowners
reforest or improve more than
7,485 acres of forestland.
In addition, 13 timber harvesting
companies were assisted in
purchasing stream and wet area
temporary crossing structures.
TAEP provided funding to 28
urban communities for their tree
planting projects on public lands.
Regulatory
TAEP funded regional animal
diagnostic laboratories in East
and West Tennessee.
TAEP funded producer education
classes for more than 17,000
participants. This includes the
Beef or Pork Quality Assurance
Class, Master Beef or Master
Meat Goat Class, UT Beemaster
Program, and the Tennessee
Quality Milk Initiative Class.
TAEP provided cost share dollars to more than 2,300 people for more than 3,500 projects in FY 2009.
(Source: The University of Tennessee Agri-Industry Modeling & Analysis Group)
30%26%
7%
13%
16%
8%
8 9
Giles County cattle farmer James
Journey proudly stands in front
of his new TAEP funded feed bin.
Tennessee Department of Agriculture

Market DevelopmentTennessee Department of Agriculture
Bonnie Blue Farms: Finding Successin Value-Added Products
Jim and Gayle Tanner are the faces of a new
era of agriculture. They are responsible for their
product from beginning to when it is served. By
taking the beginning product, milk, and creating
a value-added product they ensure quality while
increasing their profits.
The Tanners operate a goat dairy in Wayne
County, Tenn. According to the American Dairy
Goat Association, more people consume goat
milk worldwide than any other milk, and it is
growing in popularity in the U.S. Goat milk can
be used to make cheese, butter, ice cream,
yogurt and soap.
The Tanners use their goat milk to make
award-winning farmstead fresh and aged
cheeses. Their goat cheeses are sold in
restaurants, natural food
stores, farmers markets across the state and in
their on-farm store. This is a win—win situation
because the restaurant owners and consumers
are able to have a personal relationship with the
farmers, they purchase a fresher product and the
farmers have increased their profit share by
selling directly to consumers.
The Tennessee Department of Agriculture
has played a significant role in their continued
success. The Tanners have participated in the
Tennessee Agricultural Enhancement Program
since 2006. With the assistance of
TAEP funds, they have purchased cheese studio
equipment, handling equipment for goats,
marketing materials and recently constructed a
cheese cave.
“Through Ag Enhancement, we were able to
purchase better equipment sooner than we
otherwise would have,” said Jim Tanner.
Producer Diversification is one of the cost
share opportunities in which the Tanners have
participated. The Producer Diversification cost
share opportunity encourages agricultural
producers to expand or improve their operations
through the production of diversified
agricultural products.
“We really have three businesses here,” said
Jim Tanner. “We have a grade A dairy. We have a
cheese making plant and we have an agritourism
destination, so we have to invest in all three.”
Agritourism is a new venture for the
Tanners. Their farm has a log cabin available for
visitors year-round. Next to the cabin is the new
cheese cave. The cave utilizes cool ground
temperature and humidity, perfect for aging
cheese, and it also serves as a unique place for
people to visit. The cave has a polished quality
with a custom made castle door, a knight
standing guard as well as amazing stonework.
No detail has been overlooked.
Last year, there were more than 29,000
commercial and hobby milk goat operations in
the U.S., up six percent from the previous year.
Tennessee is at the forefront of goat farming.
The Tanners are just one example of farmers
using mankind’s second domesticated animal,
goats. Currently, Tennessee is second in the
nation for meat goat production.
Agriculture in Tennessee is changing.
Farmers are looking to sell directly to their
consumers through new emerging markets and
the traditional farmer demographic is changing.
Agriculture is becoming more diverse which
helps minimize risks traditionally experienced
with farming, and the Tanners are just one
example of a success story.
Bonnie Blue Farm owners Jim
and Gayle Tanner indulge their
goats with care and attention.
The Changing Faces of Agriculture
Jim Tanner pours fresh milk intoa holding tank for processing.Jim and Gayle Tanner milk goats in
their TDA approved milking parlor
.
Gayle Tanner makes her fresh
chèvre logs in the cheese studio.
For Tennessee AgriculturalEnhancement Program questions:
TAEP Information Line 1-800-342-8206
www.TN.gov/agriculture/enhancement
10 11

ForestryTennessee Department of Agriculture
The Division of Forestry promotes the wise use
of forest resources by helping landowners, fighting
wildfires, providing quality seedlings, monitoring
insects and diseases, improving urban forests,
managing state forests, protecting water quality and
collecting forest inventory data. To prevent wildfires,
the division trains volunteer fire departments, issues
burning permits, enforces fire laws and teaches the
public fire safety.
The division grows millions of pine and
hardwood seedlings for timber production, wildlife
habitat and erosion control, while developing
genetically superior stock able to increase yields by
up to 30 percent.
The Division of Forestry continues to protect
Tennessee’s forests by monitoring insect pests,
provides information to the public and takes action to
control or slow the spread of certain forest pests.
Certified inventory foresters take detailed
measurements of tree growth, quality, health and use
for an annual update on the condition of Tennessee’s
forests. The division monitors
the demand for roundwood and
the total volume of timber
harvested on private lands. The
division also administers federal
grants and provides technical
assistance for urban forestry and
manages state forests for multiple
benefits including recreation,
wildlife, unique features, timber
and water quality.
The division works with the
Tennessee Department of
Environment and Conservation to
monitor compliance with state
water quality regulations and
trains loggers in the use of Best
Management Practices.
Tennessee Forestry Camp: Growing aFuture Grounded in Tradition
What do former Tennessee Department of
Agriculture Commissioner John Rose, state
Agritourism marketing coordinator Pamela
Bartholomew, and Tipton County’s Munford High
School senior Parker Graham all have in
common? They each know the difference between
a red oak and black oak, the importance of best
management practices in protecting water quality
during logging operations, how to use a Biltmore
stick and how varying harvesting practices affect
future forest stand conditions and benefits. They
each learned all of this
while attending Tennessee
Forestry Camp as a
representative of their
county’s FFA chapter.
Since 1950, Tennessee
Forestry Camp has been
providing a wonderful
opportunity for high
school students to
discover and enhance
their environmental
conservation knowledge,
skills and ethics through
the leadership and
instruction of camp
counselors and forestry
professionals.
Celebrating 60 years, the
Tennessee Forestry Camp is one the longest
running forestry camps in the nation. The camp’s
mission is to introduce the scientific, technical
and professional aspects of the forestry natural
resource profession to these young people in
hopes that they will carry this knowledge
forward in their careers and to their friends and
family. It may even spark an interest in the
profession.
“Forestry Camp fostered in me a deep
appreciation for the important balance between
conservation and maintaining working forests
and landscapes” said Rose, a successful
businessman and farmer, who served as state
Agriculture Commissioner from 2002 to 2003. “I
am a better advocate for sensible land use
policies because of the perspectives I gained at
the camp. The knowledge I gained there has
served me as a landowner, farmer and as
Commissioner of Agriculture.”
The TDA Division of Forestry and the
Tennessee Department of Education, Career and
Technical Education Division are avid supporters
of Forestry Camp. They provide knowledgeable
instructors with extensive forest management
experience, and develop leadership skills through
the guidance of camp counselors, respectively.
This support goes a long way in making camp
fun and educational all while making it efficient
to host camp at a reasonable fee. In addition to
the state of Tennessee sponsors, the Tennessee
Forestry Association and forest industries in the
state contribute to the camp through donations
and/or personnel.
The camp is held the first week of June at
Fall Creek Falls State Park, and features outdoor,
hands-on instruction on the core knowledge and
responsibilities of the forestry profession.
Courses are taught in the field by professional
foresters and include tree identification and
measurement, compass and pacing, hardwood
and pine silviculture, wildlife management,
water quality protection, fire, insect and disease,
best management practices, soils and a hike to
Fall Creek Falls. A forestry conclave (think
timber sports) is held in the middle of the week
and gives the campers a chance to show off their
sawyering skills to distinguished guests,
including some parents who make the long trek
to this state gem.
2009 camper Parker Graham said “Forestry
camp was an amazing experience for me. Not
only did I learn a lot, but I also made friends
from all over Tennessee. The teachers were great,
the kids were amazing and the memories are
everlasting.”
The Changing Faces of Agriculture
Sustainable harvesting practicesare explained by Area ForesterTom Hall.
Area Forester Stephen Peairs
explains how to use a Biltmore
stick to a camper.
Hands-on demonstration of a dozer
used to fight wildfire led by District
Forester John Connelly in 1952.
12 13

Regulatory ServicesTennessee Department of Agriculture
TDA’s Regulatory Services Division monitors
agricultural materials, products and services to
assure quality, consumer protection, public safety
and a fair marketplace.
The division works to control animal diseases.
Accomplishments include the complete eradication
of bovine brucellosis and tuberculosis, swine
brucellosis and pseudorabies; and a reduction in the
incidence of equine infectious anemia.
Nursery, greenhouse and plant dealer
certification ensures healthy, pest-free plant
material in interstate and international trade.
Regulatory Services registers pesticides, certifies
applicators, monitors groundwater quality and
inspects pest control businesses.
Ensuring a safe food supply, the division
inspects dairy farms, plants, milk transport trucks,
dairy and trade product distributors and milk
samplers and registers dairy products. The division
also licenses and inspects retail food stores, food
manufacturers, warehouses and distributors. Other
responsibilities include enforcing bottled water
regulations, performing custom slaughterhouse
inspections, hazardous substance inspections and
labeling and enforcing state laws prohibiting the
sale of tobacco products to minors.
The Weights and Measures section works to
ensure citizens get what they pay for by testing
devices such as fuel pumps, scales and liquid
propane gas meters for accuracy. Inspections are
also made for net quantity on packaged products
and for the accuracy of price verification systems.
The state metrologist ensures the accuracy of mass
and volume standards. Truth in labeling is also
verified for fuel quality standards.
TDA’s laboratory supports many programs
through animal diagnostics, food microbiology,
toxicology, food residue, environmental monitoring
and quality assurance for agricultural inputs such as
feed, seed and fertilizer.
Flying S Farms: Baking the BestThrough Food Safety
Farmers markets are full of many great local
products to buy, including produce, flowers and
other food products. At a farmers market,
consumers have the opportunity to get to know
their farmer, establishing relationships that may
last for years.
In 2007, the Tennessee Department of
Agriculture implemented new rules known as
domestic kitchen rules which allow for non-
potentially hazardous foods to be processed in the
home kitchen and offered for commercial sale at
retail establishments including farmers markets.
Currently, there are 70 permitted Domestic
Kitchens and more than 500 people have
completed the prerequisite course. With a
growing interest by consumers in knowing where
their food comes from and how it is processed, it
is important that they know it is being processed
in a clean and safe environment.
“The domestic kitchen rules are really
common sense,” said Catherine Simmons of
Flying S Farms. “My customers can be assured
that their baked goods are made in a safe, clean
and pet-free environment.”
Catherine Simmons sells breads, brownies
and other treats across the state in various
farmers markets. She also sells produce and
offers Community Supported Agriculture
shares.
Just like restaurants and grocery stores,
Catherine’s home kitchen is inspected. Every
year, inspectors from TDA go to Catherine’s
home and check for proper labeling, any signs of
pets or pests and even refrigerator temperature.
The purpose of the domestic kitchen rules is
to allow individuals to commercially prepare,
manufacture and sell non-potentially hazardous
foods that are prepared in the home while
ensuring that the public’s health is protected.
“The domestic kitchen rules represent a
reasonable approach to help meet the needs of a
growing industry, and more importantly, they’re
the result of a cooperative effort to provide for
the safe preparation and commercial sale of
home-based foods,” said John Sanford, TDA
administrator for food manufacturing.
The domestic kitchen rules provide for the
preparation of non-potentially hazardous foods only.
Non-potentially hazardous foods include products
such as jam, jellies, candy and baked goods. Foods
are considered non-potentially hazardous if they do
not consist mainly of meat, poultry, liquid eggs,
Catherine Simmons of Flying S
Farms prepares sour dough
bread to be sold at a local
farmers market.
The Changing Faces of Agriculture
For Regulatory Services questions,comments or complaints regarding:
• Agri-security
• Animal and plant health
• Feed, seeds and fertilizers
• Food and dairy products
• Food store sanitation
• Pesticide use
• Motor fuel quality
• Weights and measures
Call toll-free 1-800-OCTANE1 (628-2631)TDA inspector c
hecks Catherine
Simmons’ measuring utensils.
TDA inspector looks for properlabeling and storage of ingredients.
14 15
Regulatory ServicesTennessee Department of Agriculture
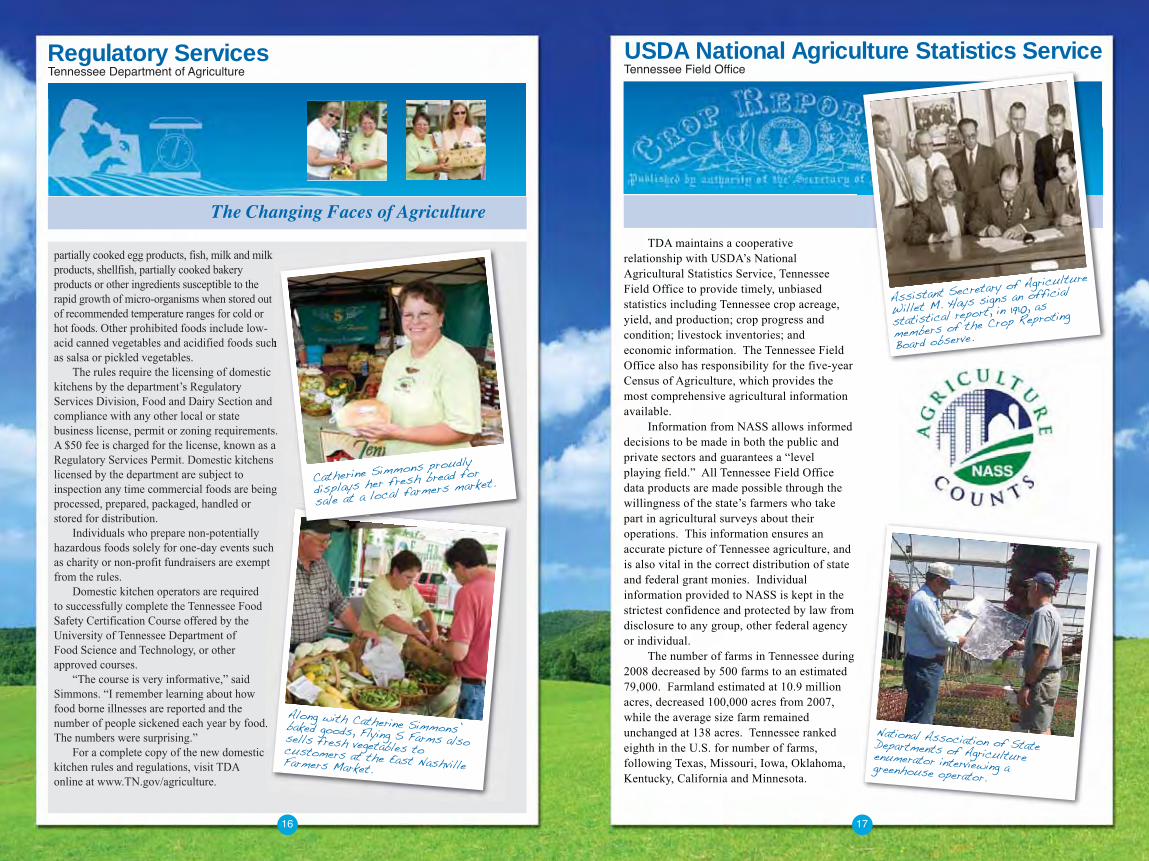
TDA maintains a cooperative
relationship with USDA’s National
Agricultural Statistics Service, Tennessee
Field Office to provide timely, unbiased
statistics including Tennessee crop acreage,
yield, and production; crop progress and
condition; livestock inventories; and
economic information. The Tennessee Field
Office also has responsibility for the five-year
Census of Agriculture, which provides the
most comprehensive agricultural information
available.
Information from NASS allows informed
decisions to be made in both the public and
private sectors and guarantees a “level
playing field.” All Tennessee Field Office
data products are made possible through the
willingness of the state’s farmers who take
part in agricultural surveys about their
operations. This information ensures an
accurate picture of Tennessee agriculture, and
is also vital in the correct distribution of state
and federal grant monies. Individual
information provided to NASS is kept in the
strictest confidence and protected by law from
disclosure to any group, other federal agency
or individual.
The number of farms in Tennessee during
2008 decreased by 500 farms to an estimated
79,000. Farmland estimated at 10.9 million
acres, decreased 100,000 acres from 2007,
while the average size farm remained
unchanged at 138 acres. Tennessee ranked
eighth in the U.S. for number of farms,
following Texas, Missouri, Iowa, Oklahoma,
Kentucky, California and Minnesota.
USDA National Agriculture Statistics ServiceTennessee Field Office
partially cooked egg products, fish, milk and milk
products, shellfish, partially cooked bakery
products or other ingredients susceptible to the
rapid growth of micro-organisms when stored out
of recommended temperature ranges for cold or
hot foods. Other prohibited foods include low-
acid canned vegetables and acidified foods such
as salsa or pickled vegetables.
The rules require the licensing of domestic
kitchens by the department’s Regulatory
Services Division, Food and Dairy Section and
compliance with any other local or state
business license, permit or zoning requirements.
A $50 fee is charged for the license, known as a
Regulatory Services Permit. Domestic kitchens
licensed by the department are subject to
inspection any time commercial foods are being
processed, prepared, packaged, handled or
stored for distribution.
Individuals who prepare non-potentially
hazardous foods solely for one-day events such
as charity or non-profit fundraisers are exempt
from the rules.
Domestic kitchen operators are required
to successfully complete the Tennessee Food
Safety Certification Course offered by the
University of Tennessee Department of
Food Science and Technology, or other
approved courses.
“The course is very informative,” said
Simmons. “I remember learning about how
food borne illnesses are reported and the
number of people sickened each year by food.
The numbers were surprising.”
For a complete copy of the new domestic
kitchen rules and regulations, visit TDA
online at www.TN.gov/agriculture.
Along with Catherine Simmons’baked goods, Flying S Farms alsosells fresh vegetables tocustomers at the East NashvilleFarmers Market.
Catherine Simmons proudly
displays her fresh bread for
sale at a local farmers market.
The Changing Faces of Agriculture
Assistant Secretary of Agriculture
Willet M. Hays signs an official
statistical report, in 19
10, as
members of the Crop Reproting
Board observe.
16 17
National Association of StateDepartments of Agricultureenumerator interviewing agreenhouse operator.
Tennessee Agriculture & Forestry State Summary
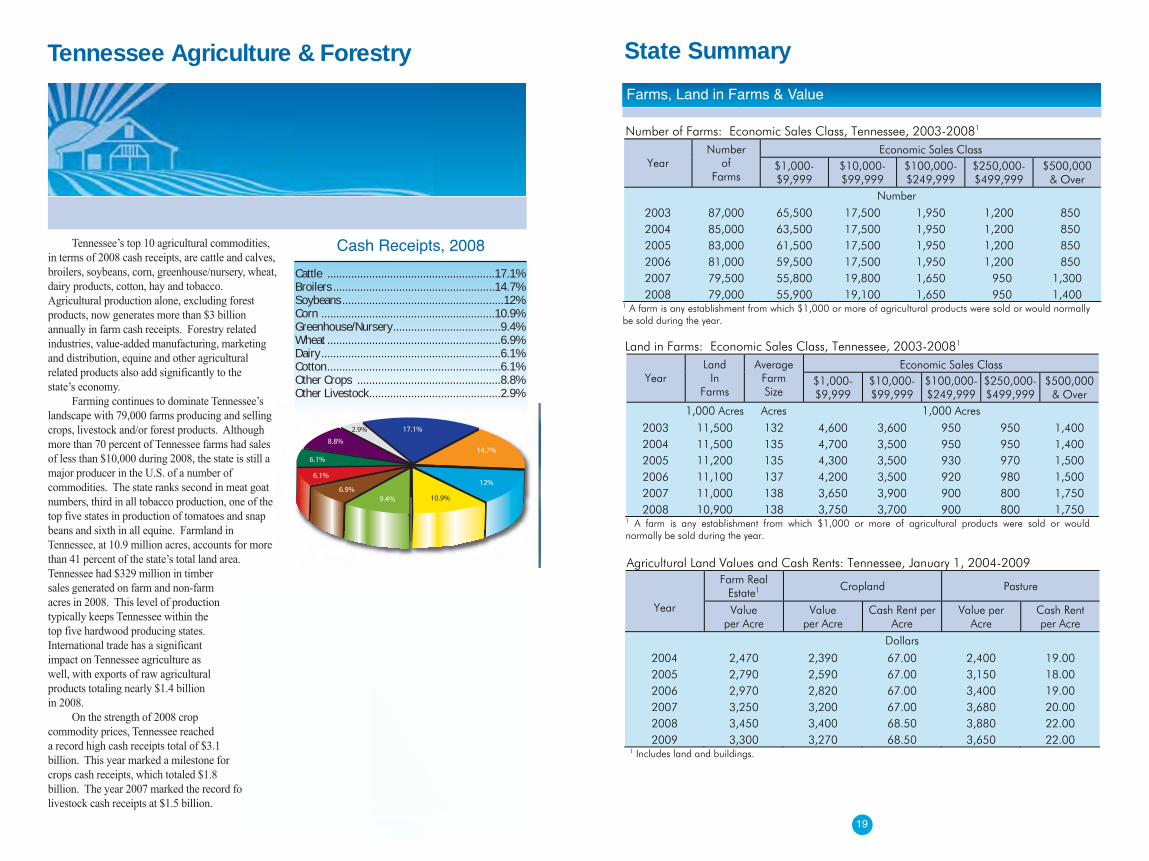
Tennessee’s top 10 agricultural commodities,
in terms of 2008 cash receipts, are cattle and calves,
broilers, soybeans, corn, greenhouse/nursery, wheat,
dairy products, cotton, hay and tobacco.
Agricultural production alone, excluding forest
products, now generates more than $3 billion
annually in farm cash receipts. Forestry related
industries, value-added manufacturing, marketing
and distribution, equine and other agricultural
related products also add significantly to the
state’s economy.
Farming continues to dominate Tennessee’s
landscape with 79,000 farms producing and selling
crops, livestock and/or forest products. Although
more than 70 percent of Tennessee farms had sales
of less than $10,000 during 2008, the state is still a
major producer in the U.S. of a number of
commodities. The state ranks second in meat goat
numbers, third in all tobacco production, one of the
top five states in production of tomatoes and snap
beans and sixth in all equine. Farmland in
Tennessee, at 10.9 million acres, accounts for more
than 41 percent of the state’s total land area.
Tennessee had $329 million in timber
sales generated on farm and non-farm
acres in 2008. This level of production
typically keeps Tennessee within the
top five hardwood producing states.
International trade has a significant
impact on Tennessee agriculture as
well, with exports of raw agricultural
products totaling nearly $1.4 billion
in 2008.
On the strength of 2008 crop
commodity prices, Tennessee reached
a record high cash receipts total of $3.1
billion. This year marked a milestone for
crops cash receipts, which totaled $1.8
billion. The year 2007 marked the record for
livestock cash receipts at $1.5 billion.
18 19
Number of Farms: Economic Sales Class, Tennessee, 2003-20081 Economic Sales Class
Year Number
of Farms
$1,000- $9,999
$10,000- $99,999
$100,000- $249,999
$250,000- $499,999
$500,000 & Over
Number
2003 87,000 65,500 17,500 1,950 1,200 850 2004 85,000 63,500 17,500 1,950 1,200 850 2005 83,000 61,500 17,500 1,950 1,200 850 2006 81,000 59,500 17,500 1,950 1,200 850 2007 79,500 55,800 19,800 1,650 950 1,300 2008 79,000 55,900 19,100 1,650 950 1,400
1 A farm is any establishment from which $1,000 or more of agricultural products were sold or would normally be sold during the year.
Land in Farms: Economic Sales Class, Tennessee, 2003-20081
Economic Sales Class Year
Land In
Farms
Average Farm Size
$1,000- $9,999
$10,000- $99,999
$100,000- $249,999
$250,000- $499,999
$500,000 & Over
1,000 Acres Acres 1,000 Acres
2003 11,500 132 4,600 3,600 950 950 1,400 2004 11,500 135 4,700 3,500 950 950 1,400 2005 11,200 135 4,300 3,500 930 970 1,500 2006 11,100 137 4,200 3,500 920 980 1,500 2007 11,000 138 3,650 3,900 900 800 1,750 2008 10,900 138 3,750 3,700 900 800 1,750
1 A farm is any establishment from which $1,000 or more of agricultural products were sold or would normally be sold during the year.
Agricultural Land Values and Cash Rents: Tennessee, January 1, 2004-2009
Farm Real Estate1 Cropland Pasture
Year Value
per Acre Value
per Acre Cash Rent per
Acre Value per
Acre Cash Rent per Acre
Dollars
2004 2,470 2,390 67.00 2,400 19.00 2005 2,790 2,590 67.00 3,150 18.00 2006 2,970 2,820 67.00 3,400 19.00 2007 3,250 3,200 67.00 3,680 20.00 2008 3,450 3,400 68.50 3,880 22.00 2009 3,300 3,270 68.50 3,650 22.00
1 Includes land and buildings.
Farms, Land in Farms & Value
2.9% 17.1%
14.7%
12%
10.9%9.4%6.9%
6.1%
6.1%
8.8%
Cash Receipts, 2008
Cattle ........................................................17.1%Broilers ......................................................14.7%Soybeans......................................................12%Corn ..........................................................10.9%Greenhouse/Nursery....................................9.4%Wheat ..........................................................6.9%Dairy ............................................................6.1%Cotton..........................................................6.1%Other Crops ................................................8.8%Other Livestock............................................2.9%
State Summary
20 21
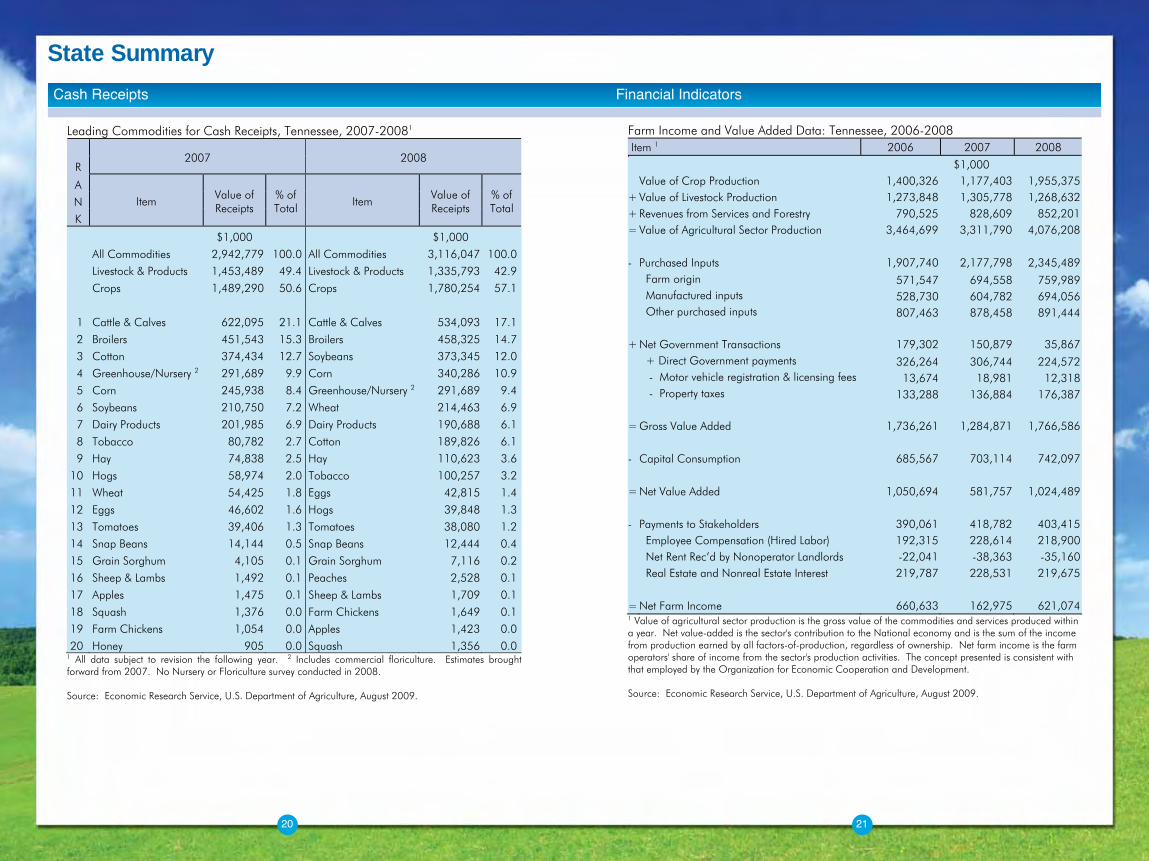
Cash Receipts
Leading Commodities for Cash Receipts, Tennessee, 2007-20081
R 2007 2008
A
N
K
Item Value of Receipts
% of Total
Item Value of Receipts
% of Total
$1,000 $1,000
All Commodities 2,942,779 100.0 All Commodities 3,116,047 100.0 Livestock & Products 1,453,489 49.4 Livestock & Products 1,335,793 42.9 Crops 1,489,290 50.6 Crops 1,780,254 57.1
1 Cattle & Calves 622,095 21.1 Cattle & Calves 534,093 17.1
2 Broilers 451,543 15.3 Broilers 458,325 14.7 3 Cotton 374,434 12.7 Soybeans 373,345 12.0
4 Greenhouse/Nursery 2 291,689 9.9 Corn 340,286 10.9
5 Corn 245,938 8.4 Greenhouse/Nursery 2 291,689 9.4
6 Soybeans 210,750 7.2 Wheat 214,463 6.9
7 Dairy Products 201,985 6.9 Dairy Products 190,688 6.1
8 Tobacco 80,782 2.7 Cotton 189,826 6.1 9 Hay 74,838 2.5 Hay 110,623 3.6
10 Hogs 58,974 2.0 Tobacco 100,257 3.2
11 Wheat 54,425 1.8 Eggs 42,815 1.4
12 Eggs 46,602 1.6 Hogs 39,848 1.3
13 Tomatoes 39,406 1.3 Tomatoes 38,080 1.2 14 Snap Beans 14,144 0.5 Snap Beans 12,444 0.4
15 Grain Sorghum 4,105 0.1 Grain Sorghum 7,116 0.2
16 Sheep & Lambs 1,492 0.1 Peaches 2,528 0.1
17 Apples 1,475 0.1 Sheep & Lambs 1,709 0.1
18 Squash 1,376 0.0 Farm Chickens 1,649 0.1 19 Farm Chickens 1,054 0.0 Apples 1,423 0.0
20 Honey 905 0.0 Squash 1,356 0.0 1 All data subject to revision the following year. 2 Includes commercial floriculture. Estimates brought forward from 2007. No Nursery or Floriculture survey conducted in 2008. Source: Economic Research Service, U.S. Department of Agriculture, August 2009.
Financial Indicators
Farm Income and Value Added Data: Tennessee, 2006-2008 Item 1 2006 2007 2008
$1,000 Value of Crop Production 1,400,326 1,177,403 1,955,375 + Value of Livestock Production 1,273,848 1,305,778 1,268,632 + Revenues from Services and Forestry 790,525 828,609 852,201 = Value of Agricultural Sector Production 3,464,699 3,311,790 4,076,208 - Purchased Inputs 1,907,740 2,177,798 2,345,489 Farm origin 571,547 694,558 759,989 Manufactured inputs 528,730 604,782 694,056 Other purchased inputs 807,463 878,458 891,444 + Net Government Transactions 179,302 150,879 35,867 + Direct Government payments 326,264 306,744 224,572 - Motor vehicle registration & licensing fees 13,674 18,981 12,318 - Property taxes 133,288 136,884 176,387 = Gross Value Added 1,736,261 1,284,871 1,766,586 - Capital Consumption 685,567 703,114 742,097 = Net Value Added 1,050,694 581,757 1,024,489 - Payments to Stakeholders 390,061 418,782 403,415 Employee Compensation (Hired Labor) 192,315 228,614 218,900 Net Rent Rec’d by Nonoperator Landlords -22,041 -38,363 -35,160 Real Estate and Nonreal Estate Interest 219,787 228,531 219,675 = Net Farm Income 660,633 162,975 621,074 1 Value of agricultural sector production is the gross value of the commodities and services produced within a year. Net value-added is the sector's contribution to the National economy and is the sum of the income from production earned by all factors-of-production, regardless of ownership. Net farm income is the farm operators' share of income from the sector's production activities. The concept presented is consistent with that employed by the Organization for Economic Cooperation and Development. Source: Economic Research Service, U.S. Department of Agriculture, August 2009.
Cash Receipts Financial Indicators
State Summary
22 23
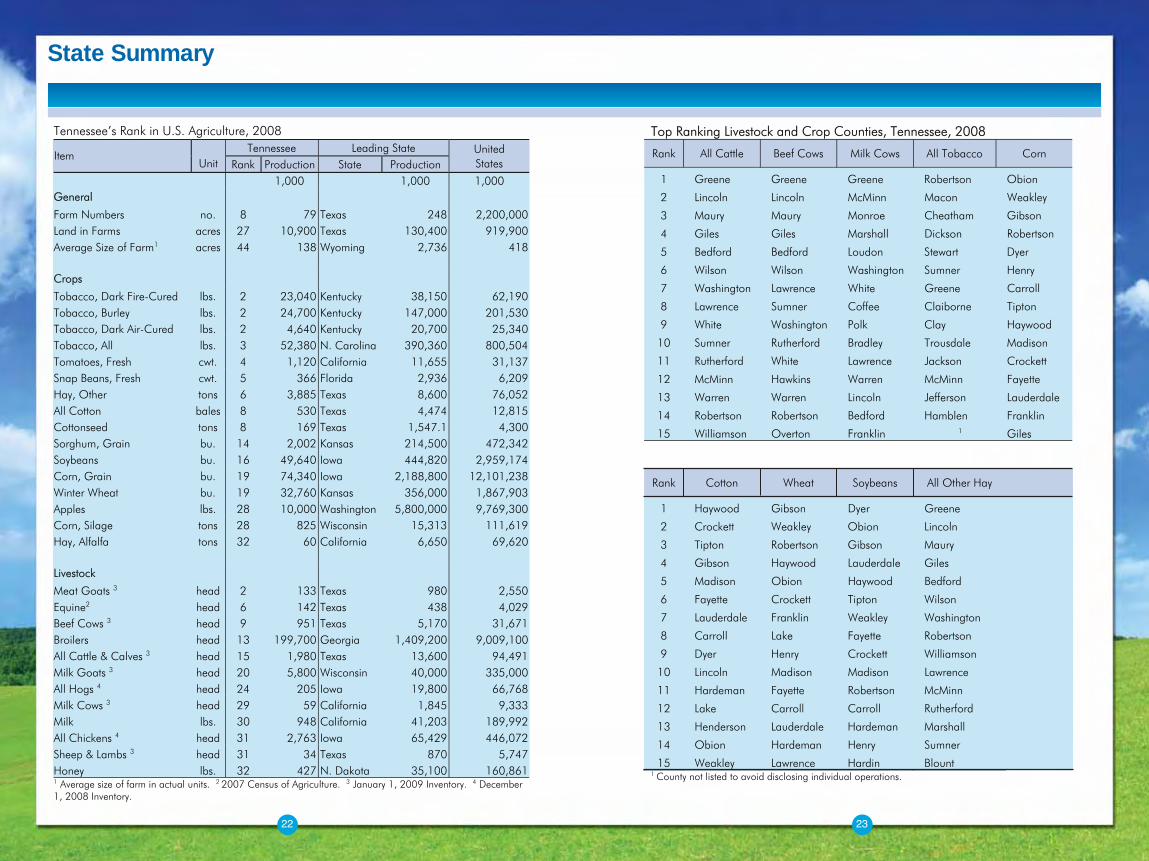
Tennessee’s Rank in U.S. Agriculture, 2008 Tennessee Leading State
Item Unit Rank Production State Production
United States
1,000 1,000 1,000 GGeneral
Farm Numbers no. 8 79 Texas 248 2,200,000 Land in Farms acres 27 10,900 Texas 130,400 919,900 Average Size of Farm1 acres 44 138 Wyoming 2,736 418 Crops Tobacco, Dark Fire-Cured lbs. 2 23,040 Kentucky 38,150 62,190 Tobacco, Burley lbs. 2 24,700 Kentucky 147,000 201,530 Tobacco, Dark Air-Cured lbs. 2 4,640 Kentucky 20,700 25,340 Tobacco, All lbs. 3 52,380 N. Carolina 390,360 800,504 Tomatoes, Fresh cwt. 4 1,120 California 11,655 31,137 Snap Beans, Fresh cwt. 5 366 Florida 2,936 6,209 Hay, Other tons 6 3,885 Texas 8,600 76,052 All Cotton bales 8 530 Texas 4,474 12,815 Cottonseed tons 8 169 Texas 1,547.1 4,300 Sorghum, Grain bu. 14 2,002 Kansas 214,500 472,342 Soybeans bu. 16 49,640 Iowa 444,820 2,959,174 Corn, Grain bu. 19 74,340 Iowa 2,188,800 12,101,238 Winter Wheat bu. 19 32,760 Kansas 356,000 1,867,903 Apples lbs. 28 10,000 Washington 5,800,000 9,769,300 Corn, Silage tons 28 825 Wisconsin 15,313 111,619 Hay, Alfalfa tons 32 60 California 6,650 69,620 Livestock Meat Goats 3 head 2 133 Texas 980 2,550 Equine2 head 6 142 Texas 438 4,029 Beef Cows 3 head 9 951 Texas 5,170 31,671 Broilers head 13 199,700 Georgia 1,409,200 9,009,100 All Cattle & Calves 3 head 15 1,980 Texas 13,600 94,491 Milk Goats 3 head 20 5,800 Wisconsin 40,000 335,000 All Hogs 4 head 24 205 Iowa 19,800 66,768 Milk Cows 3 head 29 59 California 1,845 9,333 Milk lbs. 30 948 California 41,203 189,992 All Chickens 4 head 31 2,763 Iowa 65,429 446,072 Sheep & Lambs 3 head 31 34 Texas 870 5,747 Honey lbs. 32 427 N. Dakota 35,100 160,861 1 Average size of farm in actual units. 2 2007 Census of Agriculture. 3 January 1, 2009 Inventory. 4 December 1, 2008 Inventory.
TTop Ranking Livestock and Crop Counties, Tennessee, 2008
Rank All Cattle Beef Cows Milk Cows All Tobacco Corn
1 Greene Greene Greene Robertson Obion
2 Lincoln Lincoln McMinn Macon Weakley
3 Maury Maury Monroe Cheatham Gibson
4 Giles Giles Marshall Dickson Robertson
5 Bedford Bedford Loudon Stewart Dyer
6 Wilson Wilson Washington Sumner Henry
7 Washington Lawrence White Greene Carroll
8 Lawrence Sumner Coffee Claiborne Tipton
9 White Washington Polk Clay Haywood
10 Sumner Rutherford Bradley Trousdale Madison
11 Rutherford White Lawrence Jackson Crockett
12 McMinn Hawkins Warren McMinn Fayette
13 Warren Warren Lincoln Jefferson Lauderdale
14 Robertson Robertson Bedford Hamblen Franklin
15 Williamson Overton Franklin 1 Giles
Rank Cotton Wheat Soybeans All Other Hay
1 Haywood Gibson Dyer Greene
2 Crockett Weakley Obion Lincoln
3 Tipton Robertson Gibson Maury
4 Gibson Haywood Lauderdale Giles
5 Madison Obion Haywood Bedford
6 Fayette Crockett Tipton Wilson
7 Lauderdale Franklin Weakley Washington
8 Carroll Lake Fayette Robertson
9 Dyer Henry Crockett Williamson
10 Lincoln Madison Madison Lawrence
11 Hardeman Fayette Robertson McMinn
12 Lake Carroll Carroll Rutherford
13 Henderson Lauderdale Hardeman Marshall
14 Obion Hardeman Henry Sumner
15 Weakley Lawrence Hardin Blount 1 County not listed to avoid disclosing individual operations.
Crops
24 25
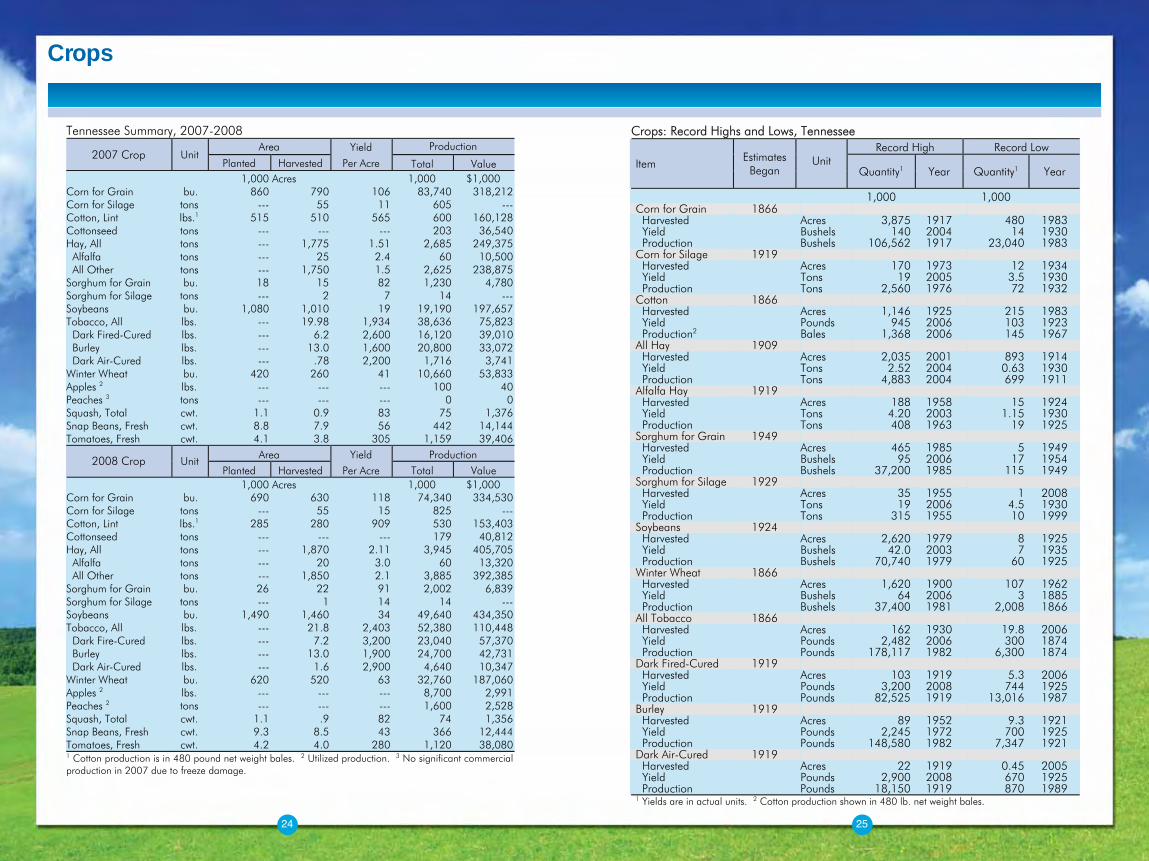
Tennessee Summary, 2007-2008 Area Yield Production
2007 Crop Unit Planted Harvested Per Acre Total Value
1,000 Acres 1,000 $1,000 Corn for Grain bu. 860 790 106 83,740 318,212 Corn for Silage tons --- 55 11 605 --- Cotton, Lint lbs.1 515 510 565 600 160,128 Cottonseed tons --- --- --- 203 36,540 Hay, All tons --- 1,775 1.51 2,685 249,375 Alfalfa tons --- 25 2.4 60 10,500 All Other tons --- 1,750 1.5 2,625 238,875 Sorghum for Grain bu. 18 15 82 1,230 4,780 Sorghum for Silage tons --- 2 7 14 --- Soybeans bu. 1,080 1,010 19 19,190 197,657 Tobacco, All lbs. --- 19.98 1,934 38,636 75,823 Dark Fired-Cured lbs. --- 6.2 2,600 16,120 39,010 Burley lbs. --- 13.0 1,600 20,800 33,072 Dark Air-Cured lbs. --- .78 2,200 1,716 3,741 Winter Wheat bu. 420 260 41 10,660 53,833 Apples 2 lbs. --- --- --- 100 40 Peaches 3 tons --- --- --- 0 0 Squash, Total cwt. 1.1 0.9 83 75 1,376 Snap Beans, Fresh cwt. 8.8 7.9 56 442 14,144 Tomatoes, Fresh cwt. 4.1 3.8 305 1,159 39,406
Area Yield Production 2008 Crop Unit Planted Harvested Per Acre Total Value
1,000 Acres 1,000 $1,000 Corn for Grain bu. 690 630 118 74,340 334,530 Corn for Silage tons --- 55 15 825 --- Cotton, Lint lbs.1 285 280 909 530 153,403 Cottonseed tons --- --- --- 179 40,812 Hay, All tons --- 1,870 2.11 3,945 405,705 Alfalfa tons --- 20 3.0 60 13,320 All Other tons --- 1,850 2.1 3,885 392,385 Sorghum for Grain bu. 26 22 91 2,002 6,839 Sorghum for Silage tons --- 1 14 14 --- Soybeans bu. 1,490 1,460 34 49,640 434,350 Tobacco, All lbs. --- 21.8 2,403 52,380 110,448 Dark Fire-Cured lbs. --- 7.2 3,200 23,040 57,370 Burley lbs. --- 13.0 1,900 24,700 42,731 Dark Air-Cured lbs. --- 1.6 2,900 4,640 10,347 Winter Wheat bu. 620 520 63 32,760 187,060 Apples 2 lbs. --- --- --- 8,700 2,991 Peaches 2 tons --- --- --- 1,600 2,528 Squash, Total cwt. 1.1 .9 82 74 1,356 Snap Beans, Fresh cwt. 9.3 8.5 43 366 12,444 Tomatoes, Fresh cwt. 4.2 4.0 280 1,120 38,080 1 Cotton production is in 480 pound net weight bales. 2 Utilized production. 3 No significant commercial production in 2007 due to freeze damage.
CCrops: Record Highs and Lows, Tennessee Record High Record Low
Item Estimates
Began
Unit
Quantity1 Year Quantity1 Year
1,000 1,000 Corn for Grain 1866 Harvested Acres 3,875 1917 480 1983 Yield Bushels 140 2004 14 1930 Production Bushels 106,562 1917 23,040 1983 Corn for Silage 1919 Harvested Acres 170 1973 12 1934 Yield Tons 19 2005 3.5 1930 Production Tons 2,560 1976 72 1932 Cotton 1866 Harvested Acres 1,146 1925 215 1983 Yield Pounds 945 2006 103 1923 Production2 Bales 1,368 2006 145 1967 All Hay 1909 Harvested Acres 2,035 2001 893 1914 Yield Tons 2.52 2004 0.63 1930 Production Tons 4,883 2004 699 1911 Alfalfa Hay 1919 Harvested Acres 188 1958 15 1924 Yield Tons 4.20 2003 1.15 1930 Production Tons 408 1963 19 1925 Sorghum for Grain 1949 Harvested Acres 465 1985 5 1949 Yield Bushels 95 2006 17 1954 Production Bushels 37,200 1985 115 1949 Sorghum for Silage 1929 Harvested Acres 35 1955 1 2008 Yield Tons 19 2006 4.5 1930 Production Tons 315 1955 10 1999 Soybeans 1924 Harvested Acres 2,620 1979 8 1925 Yield Bushels 42.0 2003 7 1935 Production Bushels 70,740 1979 60 1925 Winter Wheat 1866 Harvested Acres 1,620 1900 107 1962 Yield Bushels 64 2006 3 1885 Production Bushels 37,400 1981 2,008 1866 All Tobacco 1866 Harvested Acres 162 1930 19.8 2006 Yield Pounds 2,482 2006 300 1874 Production Pounds 178,117 1982 6,300 1874 Dark Fired-Cured 1919 Harvested Acres 103 1919 5.3 2006 Yield Pounds 3,200 2008 744 1925 Production Pounds 82,525 1919 13,016 1987 Burley 1919 Harvested Acres 89 1952 9.3 1921 Yield Pounds 2,245 1972 700 1925 Production Pounds 148,580 1982 7,347 1921 Dark Air-Cured 1919 Harvested Acres 22 1919 0.45 2005 Yield Pounds 2,900 2008 670 1925 Production Pounds 18,150 1919 870 1989 1 Yields are in actual units. 2 Cotton production shown in 480 lb. net weight bales.
Crops
26 27
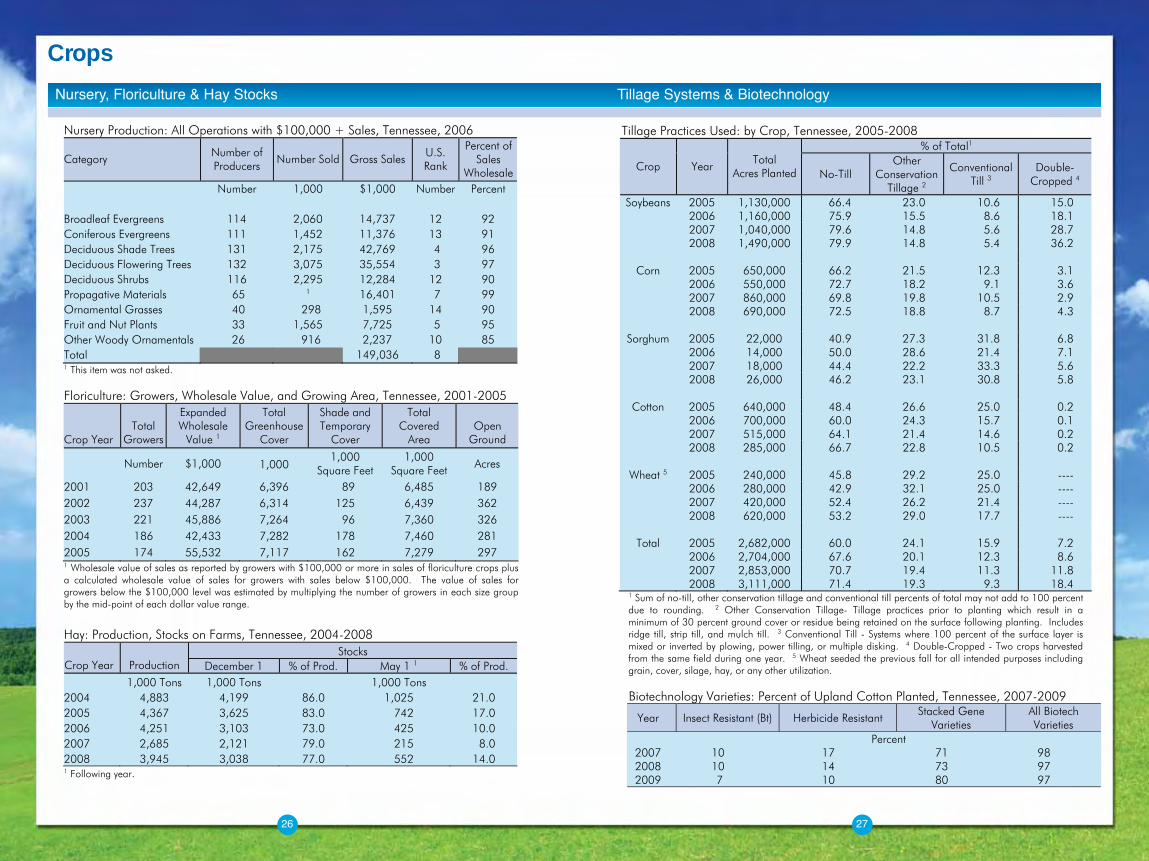
Nursery, Floriculture, and Hay Stocks
Nursery Production: All Operations with $100,000 + Sales, Tennessee, 2006
Category Number of Producers
Number Sold Gross Sales U.S. Rank
Percent of Sales
Wholesale Number 1,000 $1,000 Number Percent
Broadleaf Evergreens 114 2,060 14,737 12 92 Coniferous Evergreens 111 1,452 11,376 13 91 Deciduous Shade Trees 131 2,175 42,769 4 96 Deciduous Flowering Trees 132 3,075 35,554 3 97 Deciduous Shrubs 116 2,295 12,284 12 90 Propagative Materials 65 1 16,401 7 99 Ornamental Grasses 40 298 1,595 14 90 Fruit and Nut Plants 33 1,565 7,725 5 95 Other Woody Ornamentals 26 916 2,237 10 85 Total 149,036 8 1 This item was not asked. Floriculture: Growers, Wholesale Value, and Growing Area, Tennessee, 2001-2005
Crop Year Total
Growers
Expanded Wholesale
Value 1
Total Greenhouse
Cover
Shade and Temporary
Cover
Total Covered
Area
Open Ground
Number $1,000 1,000
1,000 Square Feet
1,000 Square Feet Acres
2001 203 42,649 6,396 89 6,485 189
2002 237 44,287 6,314 125 6,439 362
2003 221 45,886 7,264 96 7,360 326
2004 186 42,433 7,282 178 7,460 281
2005 174 55,532 7,117 162 7,279 297 1 Wholesale value of sales as reported by growers with $100,000 or more in sales of floriculture crops plus a calculated wholesale value of sales for growers with sales below $100,000. The value of sales for growers below the $100,000 level was estimated by multiplying the number of growers in each size group by the mid-point of each dollar value range. Hay: Production, Stocks on Farms, Tennessee, 2004-2008
Stocks Crop Year Production December 1 % of Prod. May 1 1 % of Prod. 1,000 Tons 1,000 Tons 1,000 Tons 2004 4,883 4,199 86.0 1,025 21.0 2005 4,367 3,625 83.0 742 17.0 2006 4,251 3,103 73.0 425 10.0 2007 2,685 2,121 79.0 215 8.0 2008 3,945 3,038 77.0 552 14.0 1 Following year.
Tillage Systems & Biotechnology
Tillage Practices Used: by Crop, Tennessee, 2005-2008 % of Total1
Crop Year Total
Acres Planted No-Till Other
Conservation Tillage 2
Conventional Till 3
Double- Cropped 4
Soybeans 2005 1,130,000 66.4 23.0 10.6 15.0 2006 1,160,000 75.9 15.5 8.6 18.1 2007 1,040,000 79.6 14.8 5.6 28.7 2008 1,490,000 79.9 14.8 5.4 36.2
Corn 2005 650,000 66.2 21.5 12.3 3.1 2006 550,000 72.7 18.2 9.1 3.6 2007 860,000 69.8 19.8 10.5 2.9 2008 690,000 72.5 18.8 8.7 4.3
Sorghum 2005 22,000 40.9 27.3 31.8 6.8 2006 14,000 50.0 28.6 21.4 7.1 2007 18,000 44.4 22.2 33.3 5.6 2008 26,000 46.2 23.1 30.8 5.8
Cotton 2005 640,000 48.4 26.6 25.0 0.2 2006 700,000 60.0 24.3 15.7 0.1 2007 515,000 64.1 21.4 14.6 0.2 2008 285,000 66.7 22.8 10.5 0.2
Wheat 5 2005 240,000 45.8 29.2 25.0 ---- 2006 280,000 42.9 32.1 25.0 ---- 2007 420,000 52.4 26.2 21.4 ---- 2008 620,000 53.2 29.0 17.7 ----
Total 2005 2,682,000 60.0 24.1 15.9 7.2 2006 2,704,000 67.6 20.1 12.3 8.6 2007 2,853,000 70.7 19.4 11.3 11.8 2008 3,111,000 71.4 19.3 9.3 18.4
1 Sum of no-till, other conservation tillage and conventional till percents of total may not add to 100 percent due to rounding. 2 Other Conservation Tillage- Tillage practices prior to planting which result in a minimum of 30 percent ground cover or residue being retained on the surface following planting. Includes ridge till, strip till, and mulch till. 3 Conventional Till - Systems where 100 percent of the surface layer is mixed or inverted by plowing, power tilling, or multiple disking. 4 Double-Cropped - Two crops harvested from the same field during one year. 5 Wheat seeded the previous fall for all intended purposes including grain, cover, silage, hay, or any other utilization. Biotechnology Varieties: Percent of Upland Cotton Planted, Tennessee, 2007-2009
Year Insect Resistant (Bt) Herbicide Resistant Stacked Gene
Varieties All Biotech Varieties
Percent 2007 10 17 71 98 2008 10 14 73 97 2009 7 10 80 97
Nursery, Floriculture & Hay Stocks Tillage Systems & Biotechnology
Livestock, Dairy & Poultry
28 29
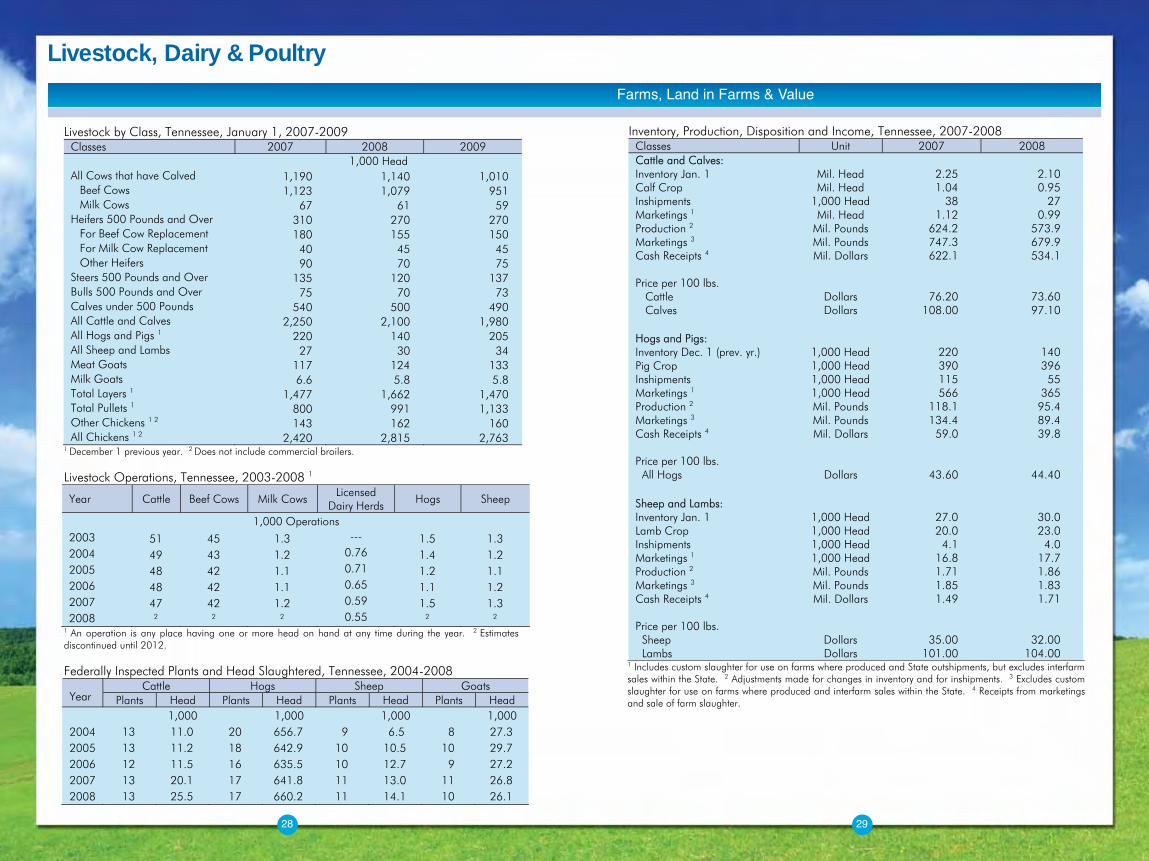
Livestock by Class, Tennessee, January 1, 2007-2009 Classes 2007 2008 2009 1,000 Head All Cows that have Calved 1,190 1,140 1,010
Beef Cows 1,123 1,079 951 Milk Cows 67 61 59
Heifers 500 Pounds and Over 310 270 270 For Beef Cow Replacement 180 155 150 For Milk Cow Replacement 40 45 45 Other Heifers 90 70 75
Steers 500 Pounds and Over 135 120 137 Bulls 500 Pounds and Over 75 70 73 Calves under 500 Pounds 540 500 490 All Cattle and Calves 2,250 2,100 1,980 All Hogs and Pigs 1 220 140 205 All Sheep and Lambs 27 30 34 Meat Goats 117 124 133 Milk Goats 6.6 5.8 5.8 Total Layers 1 1,477 1,662 1,470 Total Pullets 1 800 991 1,133 Other Chickens 1 2 143 162 160 All Chickens 1 2 2,420 2,815 2,763
1 December 1 previous year. 2 Does not include commercial broilers. Livestock Operations, Tennessee, 2003-2008 1
Year Cattle Beef Cows Milk Cows Licensed
Dairy Herds Hogs Sheep
1,000 Operations 2003 51 45 1.3 --- 1.5 1.3 2004 49 43 1.2 0.76 1.4 1.2 2005 48 42 1.1 0.71 1.2 1.1 2006 48 42 1.1 0.65 1.1 1.2 2007 47 42 1.2 0.59 1.5 1.3 2008 2 2 2 0.55 2 2
1 An operation is any place having one or more head on hand at any time during the year. 2 Estimates discontinued until 2012. Federally Inspected Plants and Head Slaughtered, Tennessee, 2004-2008
Cattle Hogs Sheep Goats Year Plants Head Plants Head Plants Head Plants Head 1,000 1,000 1,000 1,000 2004 13 11.0 20 656.7 9 6.5 8 27.3 2005 13 11.2 18 642.9 10 10.5 10 29.7 2006 12 11.5 16 635.5 10 12.7 9 27.2 2007 13 20.1 17 641.8 11 13.0 11 26.8 2008 13 25.5 17 660.2 11 14.1 10 26.1
Livestock
Inventory, Production, Disposition and Income, Tennessee, 2007-2008 Classes Unit 2007 2008 Cattle and Calves: Inventory Jan. 1 Mil. Head 2.25 2.10 Calf Crop Mil. Head 1.04 0.95 Inshipments 1,000 Head 38 27 Marketings 1 Mil. Head 1.12 0.99 Production 2 Mil. Pounds 624.2 573.9 Marketings 3 Mil. Pounds 747.3 679.9 Cash Receipts 4 Mil. Dollars 622.1 534.1 Price per 100 lbs.
Cattle Dollars 76.20 73.60 Calves Dollars 108.00 97.10
Hogs and Pigs: Inventory Dec. 1 (prev. yr.) 1,000 Head 220 140 Pig Crop 1,000 Head 390 396 Inshipments 1,000 Head 115 55 Marketings 1 1,000 Head 566 365 Production 2 Mil. Pounds 118.1 95.4 Marketings 3 Mil. Pounds 134.4 89.4 Cash Receipts 4 Mil. Dollars 59.0 39.8 Price per 100 lbs.
All Hogs Dollars 43.60 44.40
Sheep and Lambs: Inventory Jan. 1 1,000 Head 27.0 30.0 Lamb Crop 1,000 Head 20.0 23.0 Inshipments 1,000 Head 4.1 4.0 Marketings 1 1,000 Head 16.8 17.7 Production 2 Mil. Pounds 1.71 1.86 Marketings 3 Mil. Pounds 1.85 1.83 Cash Receipts 4 Mil. Dollars 1.49 1.71 Price per 100 lbs.
Sheep Dollars 35.00 32.00 Lambs Dollars 101.00 104.00
1 Includes custom slaughter for use on farms where produced and State outshipments, but excludes interfarmsales within the State. 2 Adjustments made for changes in inventory and for inshipments. 3 Excludes customslaughter for use on farms where produced and interfarm sales within the State. 4 Receipts from marketingsand sale of farm slaughter.
Farms, Land in Farms & Value
Livestock, Dairy & Poultry
30 31
Milk, Dairy Products, Trout & Honey
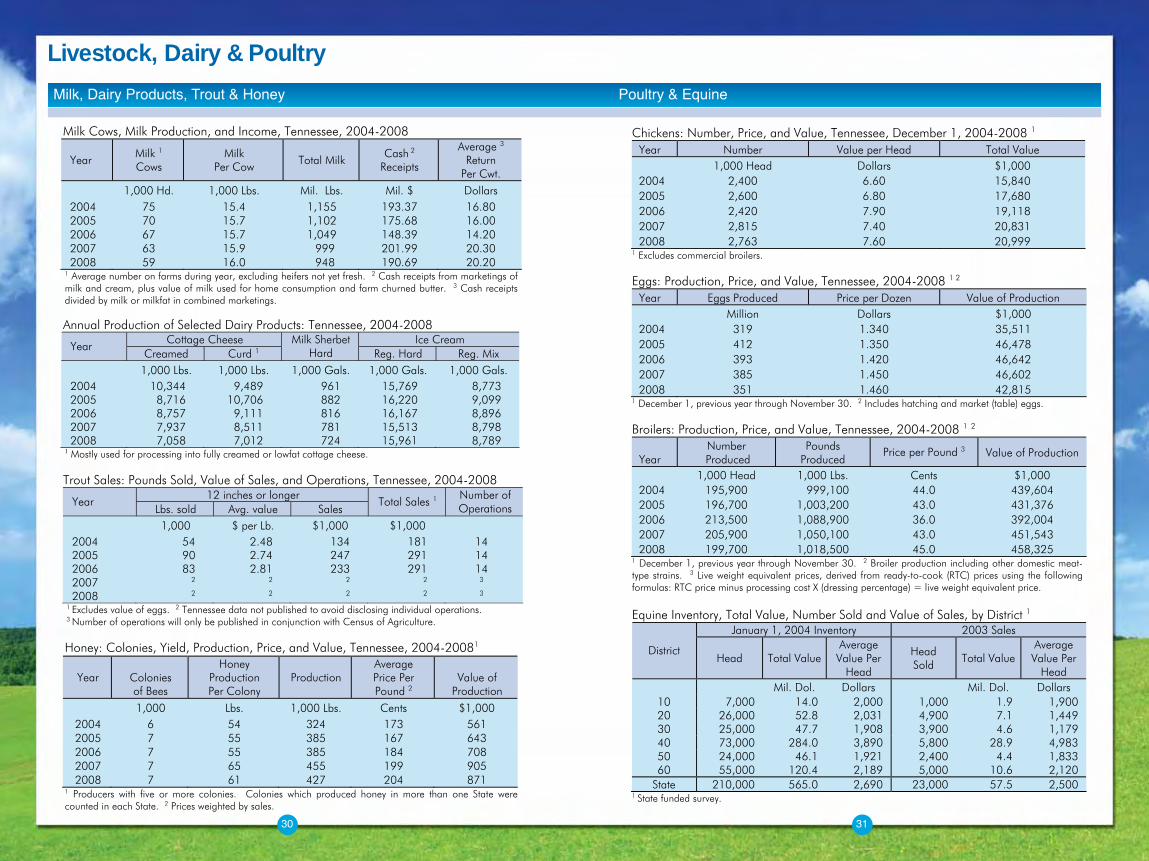
Milk Cows, Milk Production, and Income, Tennessee, 2004-2008
Year Milk 1 Cows
Milk Per Cow Total Milk
Cash 2 Receipts
Average 3 Return
Per Cwt. 1,000 Hd. 1,000 Lbs. Mil. Lbs. Mil. $ Dollars
2004 75 15.4 1,155 193.37 16.80 2005 70 15.7 1,102 175.68 16.00 2006 67 15.7 1,049 148.39 14.20 2007 63 15.9 999 201.99 20.30 2008 59 16.0 948 190.69 20.20
1 Average number on farms during year, excluding heifers not yet fresh. 2 Cash receipts from marketings of milk and cream, plus value of milk used for home consumption and farm churned butter. 3 Cash receipts divided by milk or milkfat in combined marketings. Annual Production of Selected Dairy Products: Tennessee, 2004-2008
Cottage Cheese Ice Cream Year
Creamed Curd 1 Milk Sherbet
Hard Reg. Hard Reg. Mix 1,000 Lbs. 1,000 Lbs. 1,000 Gals. 1,000 Gals. 1,000 Gals.
2004 10,344 9,489 961 15,769 8,773 2005 8,716 10,706 882 16,220 9,099 2006 8,757 9,111 816 16,167 8,896 2007 7,937 8,511 781 15,513 8,798 2008 7,058 7,012 724 15,961 8,789
1 Mostly used for processing into fully creamed or lowfat cottage cheese. Trout Sales: Pounds Sold, Value of Sales, and Operations, Tennessee, 2004-2008
12 inches or longer Year
Lbs. sold Avg. value Sales Total Sales 1 Number of
Operations
1,000 $ per Lb. $1,000 $1,000 2004 54 2.48 134 181 14 2005 90 2.74 247 291 14 2006 83 2.81 233 291 14 2007 2 2 2 2 3
2008 2 2 2 2 3 1 Excludes value of eggs. 2 Tennessee data not published to avoid disclosing individual operations. 3 Number of operations will only be published in conjunction with Census of Agriculture. Honey: Colonies, Yield, Production, Price, and Value, Tennessee, 2004-20081
Year Colonies of Bees
Honey Production Per Colony
Production Average Price Per Pound 2
Value of Production
1,000 Lbs. 1,000 Lbs. Cents $1,000 2004 6 54 324 173 561 2005 7 55 385 167 643 2006 7 55 385 184 708 2007 7 65 455 199 905 2008 7 61 427 204 871
1 Producers with five or more colonies. Colonies which produced honey in more than one State were counted in each State. 2 Prices weighted by sales.
Poultry & Equine
Chickens: Number, Price, and Value, Tennessee, December 1, 2004-2008 1 Year Number Value per Head Total Value 1,000 Head Dollars $1,000 2004 2,400 6.60 15,840 2005 2,600 6.80 17,680 2006 2,420 7.90 19,118 2007 2,815 7.40 20,831 2008 2,763 7.60 20,999
1 Excludes commercial broilers. Eggs: Production, Price, and Value, Tennessee, 2004-2008 1 2
Year Eggs Produced Price per Dozen Value of Production Million Dollars $1,000 2004 319 1.340 35,511 2005 412 1.350 46,478 2006 393 1.420 46,642 2007 385 1.450 46,602 2008 351 1.460 42,815
1 December 1, previous year through November 30. 2 Includes hatching and market (table) eggs. Broilers: Production, Price, and Value, Tennessee, 2004-2008 1 2
Year
Number Produced
Pounds Produced
Price per Pound 3 Value of Production
1,000 Head 1,000 Lbs. Cents $1,000 2004 195,900 999,100 44.0 439,604 2005 196,700 1,003,200 43.0 431,376 2006 213,500 1,088,900 36.0 392,004 2007 205,900 1,050,100 43.0 451,543 2008 199,700 1,018,500 45.0 458,325
1 December 1, previous year through November 30. 2 Broiler production including other domestic meat-type strains. 3 Live weight equivalent prices, derived from ready-to-cook (RTC) prices using the following formulas: RTC price minus processing cost X (dressing percentage) = live weight equivalent price. Equine Inventory, Total Value, Number Sold and Value of Sales, by District 1
January 1, 2004 Inventory 2003 Sales
District Head Total Value
Average Value Per
Head
Head Sold
Total Value Average Value Per
Head Mil. Dol. Dollars Mil. Dol. Dollars
10 7,000 14.0 2,000 1,000 1.9 1,900 20 26,000 52.8 2,031 4,900 7.1 1,449 30 25,000 47.7 1,908 3,900 4.6 1,179 40 73,000 284.0 3,890 5,800 28.9 4,983 50 24,000 46.1 1,921 2,400 4.4 1,833 60 55,000 120.4 2,189 5,000 10.6 2,120
State 210,000 565.0 2,690 23,000 57.5 2,500 1 State funded survey.
Milk, Dairy Products, Trout & Honey Poultry & Equine
Agricultural Exports
32 33
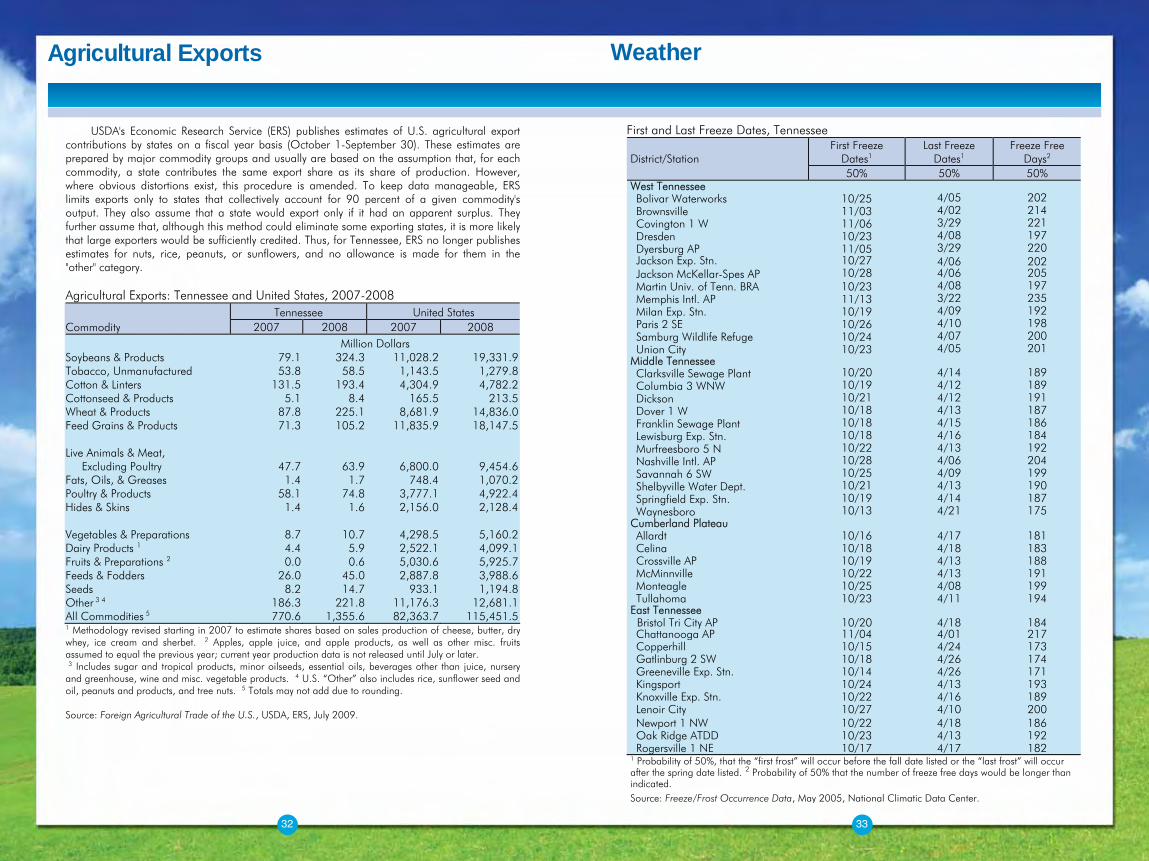
USDA's Economic Research Service (ERS) publishes estimates of U.S. agricultural export contributions by states on a fiscal year basis (October 1-September 30). These estimates are prepared by major commodity groups and usually are based on the assumption that, for each commodity, a state contributes the same export share as its share of production. However, where obvious distortions exist, this procedure is amended. To keep data manageable, ERS limits exports only to states that collectively account for 90 percent of a given commodity's output. They also assume that a state would export only if it had an apparent surplus. They further assume that, although this method could eliminate some exporting states, it is more likely that large exporters would be sufficiently credited. Thus, for Tennessee, ERS no longer publishes estimates for nuts, rice, peanuts, or sunflowers, and no allowance is made for them in the "other" category. Agricultural Exports: Tennessee and United States, 2007-2008 Tennessee United States Commodity 2007 2008 2007 2008 Million Dollars Soybeans & Products 79.1 324.3 11,028.2 19,331.9 Tobacco, Unmanufactured 53.8 58.5 1,143.5 1,279.8 Cotton & Linters 131.5 193.4 4,304.9 4,782.2 Cottonseed & Products 5.1 8.4 165.5 213.5 Wheat & Products 87.8 225.1 8,681.9 14,836.0 Feed Grains & Products 71.3 105.2 11,835.9 18,147.5 Live Animals & Meat, Excluding Poultry 47.7 63.9 6,800.0 9,454.6 Fats, Oils, & Greases 1.4 1.7 748.4 1,070.2 Poultry & Products 58.1 74.8 3,777.1 4,922.4 Hides & Skins 1.4 1.6 2,156.0 2,128.4 Vegetables & Preparations 8.7 10.7 4,298.5 5,160.2 Dairy Products 1 4.4 5.9 2,522.1 4,099.1 Fruits & Preparations 2 0.0 0.6 5,030.6 5,925.7 Feeds & Fodders 26.0 45.0 2,887.8 3,988.6 Seeds 8.2 14.7 933.1 1,194.8 Other 3 4 186.3 221.8 11,176.3 12,681.1 All Commodities 5 770.6 1,355.6 82,363.7 115,451.5 1 Methodology revised starting in 2007 to estimate shares based on sales production of cheese, butter, dry whey, ice cream and sherbet. 2 Apples, apple juice, and apple products, as well as other misc. fruits assumed to equal the previous year; current year production data is not released until July or later. 3 Includes sugar and tropical products, minor oilseeds, essential oils, beverages other than juice, nursery and greenhouse, wine and misc. vegetable products. 4 U.S. “Other” also includes rice, sunflower seed and oil, peanuts and products, and tree nuts. 5 Totals may not add due to rounding. Source: Foreign Agricultural Trade of the U.S., USDA, ERS, July 2009.
Weather First and Last Freeze Dates, Tennessee
First Freeze
Dates1 Last Freeze
Dates1 Freeze Free
Days2 District/Station 50% 50% 50%
WWest Tennessee Bolivar Waterworks 10/25 4/05 202 Brownsville 11/03 4/02 214 Covington 1 W 11/06 3/29 221 Dresden 10/23 4/08 197 Dyersburg AP 11/05 3/29 220 Jackson Exp. Stn.
10/2410/27 4/06 202
Jackson McKellar-Spes AP 10/28 4/06 205 Martin Univ. of Tenn. BRA 10/23 4/08 197 Memphis Intl. AP 11/13 3/22 235 Milan Exp. Stn. 10/19 4/09 192 Paris 2 SE 10/26 4/10 198 Samburg Wildlife Refuge 10/24 4/07 200 Union City 10/23 4/05 201 Middle Tennessee Clarksville Sewage Plant 10/20 4/14 189 Columbia 3 WNW 10/19 4/12 189 Dickson 10/21 4/12 191 Dover 1 W 10/18 4/13 187 Franklin Sewage Plant 10/18 4/15 186 Lewisburg Exp. Stn. 10/18 4/16 184 Murfreesboro 5 N 10/22 4/13 192 Nashville Intl. AP 10/28 4/06 204 Savannah 6 SW 10/25 4/09 199 Shelbyville Water Dept. 10/21 4/13 190 Springfield Exp. Stn. 10/19 4/14 187 Waynesboro 10/13 4/21 175 Cumberland Plateau Allardt 10/16 4/17 181 Celina 10/18 4/18 183 Crossville AP 10/19 4/13 188 McMinnville 10/22 4/13 191 Monteagle 10/25 4/08 199 Tullahoma 10/23 4/11 194 East Tennessee Bristol Tri City AP 10/20 4/18 184 Chattanooga AP 11/04 4/01 217 Copperhill 10/15 4/24 173 Gatlinburg 2 SW 10/18 4/26 174 Greeneville Exp. Stn. 10/14 4/26 171 Kingsport 10/24 4/13 193 Knoxville Exp. Stn. 10/22 4/16 189 Lenoir City 10/27 4/10 200 Newport 1 NW 10/22 4/18 186 Oak Ridge ATDD 10/23 4/13 192 Rogersville 1 NE 10/17 4/17 182 1 Probability of 50%, that the “first frost” will occur before the fall date listed or the “last frost” will occur after the spring date listed. 2 Probability of 50% that the number of freeze free days would be longer than indicated. Source: Freeze/Frost Occurrence Data, May 2005, National Climatic Data Center.
Weather
Weather
34 35
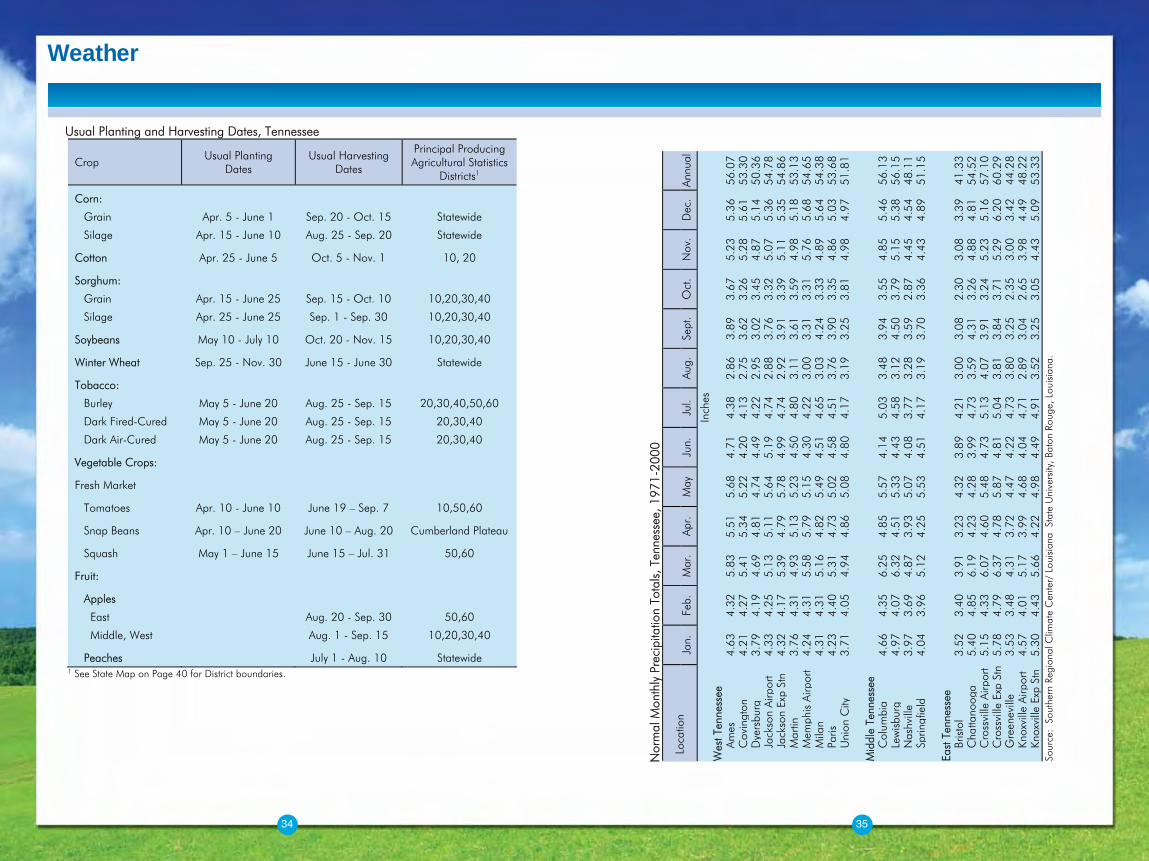
UUsual Planting and Harvesting Dates, Tennessee
Crop Usual Planting Dates
Usual Harvesting Dates
Principal Producing Agricultural Statistics
Districts1
Corn:
Grain Apr. 5 - June 1 Sep. 20 - Oct. 15 Statewide
Silage Apr. 15 - June 10 Aug. 25 - Sep. 20 Statewide
Cotton Apr. 25 - June 5 Oct. 5 - Nov. 1 10, 20
Sorghum:
Grain Apr. 15 - June 25 Sep. 15 - Oct. 10 10,20,30,40
Silage Apr. 25 - June 25 Sep. 1 - Sep. 30 10,20,30,40
Soybeans May 10 - July 10 Oct. 20 - Nov. 15 10,20,30,40
Winter Wheat Sep. 25 - Nov. 30 June 15 - June 30 Statewide
Tobacco:
Burley May 5 - June 20 Aug. 25 - Sep. 15 20,30,40,50,60
Dark Fired-Cured May 5 - June 20 Aug. 25 - Sep. 15 20,30,40
Dark Air-Cured May 5 - June 20 Aug. 25 - Sep. 15 20,30,40
Vegetable Crops:
Fresh Market
Tomatoes Apr. 10 - June 10 June 19 – Sep. 7 10,50,60
Snap Beans Apr. 10 – June 20 June 10 – Aug. 20 Cumberland Plateau
Squash May 1 – June 15 June 15 – Jul. 31 50,60
Fruit:
Apples
East Aug. 20 - Sep. 30 50,60
Middle, West Aug. 1 - Sep. 15 10,20,30,40
Peaches July 1 - Aug. 10 Statewide 1 See State Map on Page 40 for District boundaries.
NNor
mal
Mon
thly
Pre
cipi
tatio
n To
tals
, Ten
ness
ee, 1
971-
2000
Loc
atio
n
Jan.
Feb.
Mar
.
Apr.
May
Jun.
Jul.
Au
g.
Se
pt.
O
ct.
N
ov.
D
ec.
An
nual
In
ches
W
est T
enne
ssee
A
mes
4.
63
4.32
5.
83
5.51
5.
68
4.71
4.
38
2.86
3.
89
3.67
5.
23
5.36
56
.07
C
ovin
gton
4.
21
4.27
5.
41
5.34
5.
22
4.20
4.
13
2.75
3.
62
3.26
5.
28
5.61
53
.30
D
yers
burg
3.
79
4.19
4.
69
4.81
4.
74
4.49
4.
22
2.95
3.
02
3.45
4.
87
5.14
50
.36
J
acks
on A
irpor
t 4.
33
4.25
5.
13
5.11
5.
64
5.19
4.
74
2.88
3.
76
3.32
5.
07
5.36
54
.78
J
acks
on E
x p S
tn
4.32
4.
17
5.39
4.
79
5.78
4.
99
4.74
2.
92
3.91
3.
39
5.11
5.
35
54.8
6
Mar
tin
3.76
4.
31
4.93
5.
13
5.23
4.
50
4.80
3.
11
3.61
3.
59
4.98
5.
18
53.1
3
Mem
phis
Airp
ort
4.24
4.
31
5.58
5.
79
5.15
4.
30
4.22
3.
00
3.31
3.
31
5.76
5.
68
54.6
5
Mila
n 4.
31
4.31
5.
16
4.82
5.
49
4.51
4.
65
3.03
4.
24
3.33
4.
89
5.64
54
.38
P
aris
4.
23
4.40
5.
31
4.73
5.
02
4.58
4.
51
3.76
3.
90
3.35
4.
86
5.03
53
.68
U
nion
Cit y
3.
71
4.05
4.
94
4.86
5.
08
4.80
4.
17
3.19
3.
25
3.81
4.
98
4.97
51
.81
Mid
dle
Tenn
esse
e
C
olum
bia
4.66
4.
35
6.25
4.
85
5.57
4.
14
5.03
3.
48
3.94
3.
55
4.85
5.
46
56.1
3
Lew
isbu
r g
4.97
4.
07
6.32
4.
51
5.33
4.
43
4.58
3.
12
4.50
3.
79
5.15
5.
38
56.1
5
Nas
hvill
e 3.
97
3.69
4.
87
3.93
5.
07
4.08
3.
77
3.28
3.
59
2.87
4.
45
4.54
48
.11
S
prin
gfie
ld
4.04
3.
96
5.12
4.
25
5.53
4.
51
4.17
3.
19
3.70
3.
36
4.43
4.
89
51.1
5
Ea
st T
enne
ssee
B
risto
l 3.
52
3.40
3.
91
3.23
4.
32
3.89
4.
21
3.00
3.
08
2.30
3.
08
3.39
41
.33
C
hatta
noo g
a 5.
40
4.85
6.
19
4.23
4.
28
3.99
4.
73
3.59
4.
31
3.26
4.
88
4.81
54
.52
C
ross
ville
Air p
ort
5.15
4.
33
6.07
4.
60
5.48
4.
73
5.13
4.
07
3.91
3.
24
5.23
5.
16
57.1
0
Cro
ssvi
lle E
xp S
tn5.
78
4.79
6.
37
4.78
5.
87
4.81
5.
04
3.81
3.
84
3.71
5.
29
6.20
60
.29
G
reen
evill
e 3.
53
3.48
4.
31
3.72
4.
47
4.22
4.
73
3.80
3.
25
2.35
3.
00
3.42
44
.28
K
noxv
ille
Air p
ort
4.57
4.
01
5.17
3.
99
4.68
4.
04
4.71
2.
89
3.04
2.
65
3.98
4.
49
48.2
2
Kno
xvill
e Ex
p St
n 5.
30
4.43
5.
66
4.22
4.
98
4.49
4.
91
3.52
3.
25
3.05
4.
43
5.09
53
.33
Sour
ce:
Sou
ther
n Re
gion
al C
limat
e C
ente
r/ L
ouis
iana
Sta
te U
nive
rsity
, Bat
on R
ouge
, Lou
isia
na.
State Agricultural & Forestry Organizations
4-H Club, Tenn.205 Morgan Hall, 2621 Morgan CircleKnoxville, TN 37996-4510Ph: 865-974-2128 Fax: 865-974-1628www.utextension.utk.edu/4H
4-H Foundation, Inc., Tenn. 205 Morgan Hall, 2621 Morgan Circle Knoxville, TN 37901-4510Ph: 865-974-7436 Fax: 865-974-1628http://4hfoundation.tennessee.edu/
Ag-In-The-Classroom FoundationP.O. Box 313, 147 Bear Creek Pk.Columbia, TN 38402-0313Ph: 931-388-7872 Fax: 931-388-5815tnfarmbureau.org/index.asp?view=AgInTheClassroom
Agricenter International7777 Walnut Grove Rd.Memphis, TN 38120Ph: 901-757-7777 Fax: 901-757-7783 www.agricenter.org
Agricultural Museum Assn, Oscar L Farris Ellington Agricultural CenterP.O. Box 40627, Nashville, TN 37204Ph: 615-837-5197www.tnagmuseum.org
Agricultural Production Association, Tenn. 7633 Breckenridge LaneKnoxville, TN 37938-4129Ph: 865-925-4448 Fax: 865-925-4439 http://bioengr.ag.utk.edu/tapa
Austin Peay State University Department ofAgricultureSundquist Science Complex, Rm D232P.O. Box 4607Clarksville, TN 37044Ph: 931-221-7272 Fax: 931-221-6385www.apsu.edu/agriculture
Beef Industry Council, Tenn. 128 Holiday Court, Ste. 113Franklin, TN 37067Ph: 615-790-3947 Fax: 615-791-4822 www.beefup.org
Beekeepers Association, Tenn.Jim Garrison1014 Valley Forge Dr.Arrington, TN 37014 Ph: 615-377-7696, Fx 615-377-7697
Boll Weevil Eradication Foundation, Inc., Tenn. Ellington Agricultural CenterP.O. Box 40627Nashville, TN 37204Ph: 615-837-5136 Fax: 615-837-5025www.tn.gov/agriculture/general/bollweevil.html
Burley Stabilization Corporation 320 McCalla Ave.Knoxville, TN 37914Ph: 865-525-9381 Fax: 865-525-8383www.burleystabilization.com
Cattlemen’s Association, Tenn. 826 Memorial Blvd., Suite 102, Murfreesboro TN 37129, Ph: 615-896-2333, Fx 615-896-0244 www.tncattle.org
Conservation Districts, Tenn. Assn. ofP.O. Box 107 Hidden Valley, TN 38042, Ph: 731-764-2909www.tnacd.org
Cooperative, Tennessee Farmers P.O. Box 3003, 200 Waldron Rd.LaVergne, TN 37086-1983Ph: 615-793-8011 Fax: 615-793-8404www.ourcoop.com
Cooperatives, Tenn. Council of c/o Roberta Smith, Bledsoe Telephone Cooperative, PO Box 609 Pikeville TN 37367Ph: 423-447-2121, fx 423-447-2498www.tennesseecouncilofcoops.org
Cotton Council, NationalP.O. Box 2995Cordova TN 38088-2995Ph: 901-274-9030 Fax: 901-725-0510 www.cotton.org
Cotton Ginners Assn., Southern874 Cotton Gin PlaceMemphis, TN 38106Ph: 901-947-3104 Fax: 901-947-3103www.southerncottonginners.org
Dairy Association of Tenn., American 9201 Bunsen Pkwy, Ste. 100Louisville, KY 40220Ph: 502-495-7760 Fax: 502-495-7764www.southeastdairy.org or www.got-milk.com
Dairy Products Association, Tenn. 4395 Dugger RoadCulleoka TN 38451Ph: 931-987-2597
Egg & Poultry Association, Tenn. P.O. Box 10194Murfreesboro, TN 37129Ph: 615-896-2372www.tnpoultry.org
Emu Association, Tenn.P.O. Box 9Hickman, TN 38567Ph: 615-286-2509www.tn-emu.org
Fairs, Tennessee Association of 123 Clark Mill Rd.Fayetteville, TN 37334Ph: 931-438-7242 www.tennesseefairs.com
Farm & Forest Families of Tenn., TheP.O. Box 313, 147 Bear Creek Pk.Columbia, TN 38402-0313Ph: 931-388-7872 Fax: 931-381-5818
Farm Bureau Federation, Tenn. P.O. Box 313, 147 Bear Creek Pk.Columbia, TN 38402-0313Ph: 931-388-7872 Fax: 931-381-3540www.tnfarmbureau.org
Farm Credit Services of Mid-America 813 South Church St.Murfreesboro, TN 37130-0609Ph: 615-893-7631 Fax: 615-893-4522www.farmcredit.com
Farm Winegrowers Association, Tenn.Louisa Cooke1100 Dunlop LaneClarksville TN 37040Ph: 931-645-8867www.tennesseewines.com
Feed & Grain Association, Tenn.P.O. Box 901Guntersville, AL 35976Ph: 256-582-5245www.tnfeedandgrain.org
FFA Alumni Association, Tenn. P.O. Box 720White House, TN 37188Ph: 615-419-9950 Fax: 615-384-3321www.tnffa.org
FFA Foundation, Inc., Tenn. Box 5165, TN Tech UniversityCookeville, TN 38505-0001Ph: 931-372-6050 Fax: 931-372-6051www.tnffa.org
FFA, Tennessee Association of4th Floor, Andrew Johnson Tower710 James Robertson ParkwayNashville, TN 37243-0383Ph: 615-532-2847 Fax: 615-532-8226www.tnffa.org
Forage & Grassland Council, Tenn. P.O. Box 3003LaVergne, TN 37086Ph: 615-793-8475 Fax: [email protected]
Forestry Association, Tenn. P.O. Box 290693Nashville, TN 37229Ph/Fax: 615-883-3832www.tnforestry.com
Forestry Commission, Tenn. P.O. Box 40627Nashville, TN 37204Ph: 615-837-5520 Fax: 615-837-5003www.tn.gov/agriculture/forestry/forestrycommission.html
Fruit & Vegetable Association, Tenn.Betty Coning2837 Taylor RoadMaryville, TN 37803Ph: 865-983-0153www.tfva.org
Fuel & Convenience Store Assn., Tenn. P.O. Box 101334Nashville, TN 37224Ph: 615-242-4377 Fax: 615-254-8117
Goat Producers Association., Tenn.4453 Hwy 11EBluff City, TN 37618Ph: 888-538-4279
36 37
State Agricultural & Forestry Organizations
USDA Natural Resources Conservation Svc.801 Broadway, 675 U.S. CourthouseNashville, TN 37203Ph: 615-277-2531 Fax: 615-277-2577www.tn.nrcs.usda.gov
USDA Rural Development3322 West End Avenue, Ste. 300Nashville, TN 37203-6835Ph: 615-783-1300 Fax: 615-783-1301www.rurdev.usda.gov/tn
USDA National Ag Statistics Service, Tennessee Field OfficeEllington Agricultural CenterP.O. Box 41505 Nashville, TN 37204-1505Ph: 615-781-5300 or 800-626-0987 Fax: 615-781-5303www.nass.usda.gov/tn
UT Center for Profitable AgricultureP.O. Box 1819Spring Hill, TN 37174Ph: 931-486-2777 Fax: 931-486-0141http://cpa.utk.edu
UT College of Agricultural Sciences & NaturalResources2621 Morgan Circle, 125 Morgan HallKnoxville, TN 37996-4500Ph: 865-974-7303 Fax: 865-974-9329http://casnr.tennessee.edu
UT College of Veterinary Medicine 2407 River DriveKnoxville, TN 37996Ph: 865-974-8387 Fax: 865-974-4773www.vet.utk.edu
UT Agricultural Experiment Station103 Morgan HallKnoxville, TN 37996-4506Ph: 865-974-7121 Fax: 865-974-6479http://taes.tennessee.edu
UT Extension 121 Morgan HallKnoxville, TN 37996-4530Ph: 865-974-7114 Fax: 865-974-1068www.utextension.utk.edu
UT Institute of Agriculture101 Morgan HallKnoxville, TN 37996-4505Ph: 865-974-7342 Fax: 865-974-8781www.agriculture.utk.edu
UT Martin College of Agriculture and Applied Sciences250 Brehm Hall Martin, TN 38238Ph: 731-881-7250 Fax: 731-881-7948www.utm.edu/departments/caas
UT Martin Dept. of Agriculture & Natural Resources 256 Brehm Hall Martin, TN 38238Ph: 731-881-7262 Fax: 731-881-7968www.utm.edu/departments/caas/anr
Urban Forestry Council, Tenn.6820 Cloudland DriveNashville, TN 37205Ph: 615-352-8985 www.tufc.com
Viticulture & Oenological Society, Tenn.Louisa Cooke1100 Dunlop LaneClarksville TN 37040Ph: 931-645-8867www.tvos.org
Walking Horse Breeders & Exhibitors Assn, Tenn. P.O. Box 286Lewisburg, TN 37091Ph: 931-359-1574 Fax: 931-359-2539www.twhbea.com
Walking Horse National Celebration, Tenn. P.O. Box 1010Shelbyville, TN 37162Ph: 931-684-5915 Fax: 931-684-5949www.twhnc.com
Grocers Association, Tenn. 1838 Elm Hill Pike, Ste. 136Nashville, TN 37210-3726Ph: 615-889-0136 Fax: 615-889-2877www.tngrocer.org
Hardwood Lumber Assn., National6830 Raleigh/LaGrange Rd.Memphis, TN 38134-0518Ph: 901-377-1818 Fax: 901-382-6419www.natlhardwood.org
Equine Association, Tenn.
P.O. Box 975Columbia, TN 38402-0975Ph: 931-698-0423
Livestock Marketing Association, Tenn. P.O. Box 322Kingsport, TN 37662Ph: 423-378-3254 Fax: 423-378-9412www.lmaweb.com
MTSU School of Agribusiness & AgriscienceP.O. Box 5Murfreesboro, TN 37132Ph: 615-898-2523http://deptabas.web.mtsu.edu
Nursery Association, Middle Tenn.201 Locust St., Suite 14, McMinnville, TN 37110Ph: 931-507-7322 Fax: 931-507-9601www.mtna.com
Nursery & Landscape Association, Inc., Tenn.P.O. Box 57, 115 Lyon St.McMinnville, TN 37111Ph: 931-473-3951 Fax: 931-473-5883www.tnla.com
Pest Control Association, Tenn. 1235 Mattoxtown Rd.Lawrenceburg, TN 38464Ph: 931-829-1122www.tennpca.org
Pork Producers Association, Tenn.13994 Versailles RoadRockvale, TN 37153Ph/Fax: 615-274-6533 [email protected]
Ratite Association, Tenn.2101 W. Division St.Mt. Juliet, TN 37122Ph: [email protected]
Soybean Promotion Board, Tenn. 199 Carriage House Dr.Jackson, TN 38305Ph: 731-668-2850 Fax: 731-668-2772www.tnsoybeans.org
Specialty Foods Association, Tenn.c/o Ron Boyle, Porky’s Gourmet Foods, 644 Blythe St., Gallatin, TN 37066Ph: 615-230-7000http://tsfagourmet.com
Tenn Tech Univ College of Agricultural andHuman SciencesP.O. Box 5165Cookville, TN 38505Ph: 931-372-3149 Fax: 931-372-3150www.tntech.edu/aghec
Tenn. Tech. Univ. School of AgricultureP.O. Box 5034Cookeville, TN 38505Ph: 931-372-3019 Fax: 931-372-3899www.tntech.edu/agriculture
Tenn. State Univ. School of Agriculture & Consumer Sciences3500 John A. Merritt Blvd.Nashville, TN 37209-1561Ph: 615-963-7620 Fax: 615-963-5888www.agfacs.tnstate.edu
Tenn. State Univ. Cooperative Extension Service3500 John A. Merritt Blvd.Nashville, TN 37209-1561Ph: 615-963-1351 Fax: 615-963-5833www.tnstate.edu/cep/
USDA Farm Service Agency801 Broadway, 579 U.S. CourthouseNashville, TN 37203-3816Ph: 615-277-2600 Fax: 615-277-2659www.fsa.usda.gov/tn
38 39
Tennessee Agriculture Statistics Districts
40 41
40 50 60
10 20 30

Every Animal Friendly license plate sale contributes morethan $15 to fund spay/neuter grants. The grants help reducethe number of unwanted animals, therefore reducing thecases of animal cruelty, starvation and lowering theinstances of disease. Last year, 56 non-profit animal careand rescue organizationsacross Tennesseereceived grants fromAnimal Friendlylicense plate funds.
42 43

STATE OF TENNESSEEPOLICY OF NON-DISCRIMINATION
Pursuant to the State of Tennessee’s policy of non-discrimination, the Tennessee Department of Agriculturedoes not discriminate on the basis of race, sex, religion, color, national or ethnic origin, age, disability or
military service in its policies or in the admission or access to or treatment or employment in its programs,services or activities.
Equal Employment Opportunity / Affirmative Action / ADA inquiries or complaints should be directed to theTennessee Department of Agriculture, EEO / AA / ADA Coordinator, P.O. Box 40627, Nashville, TN 37204,
(615)837-5115.
Tennessee Department of Agriculture, Auth. No. 325339,3,000 copies, Sept. 2009. This public document waspromulgated at a cost of $1.72 per copy.
Recommended