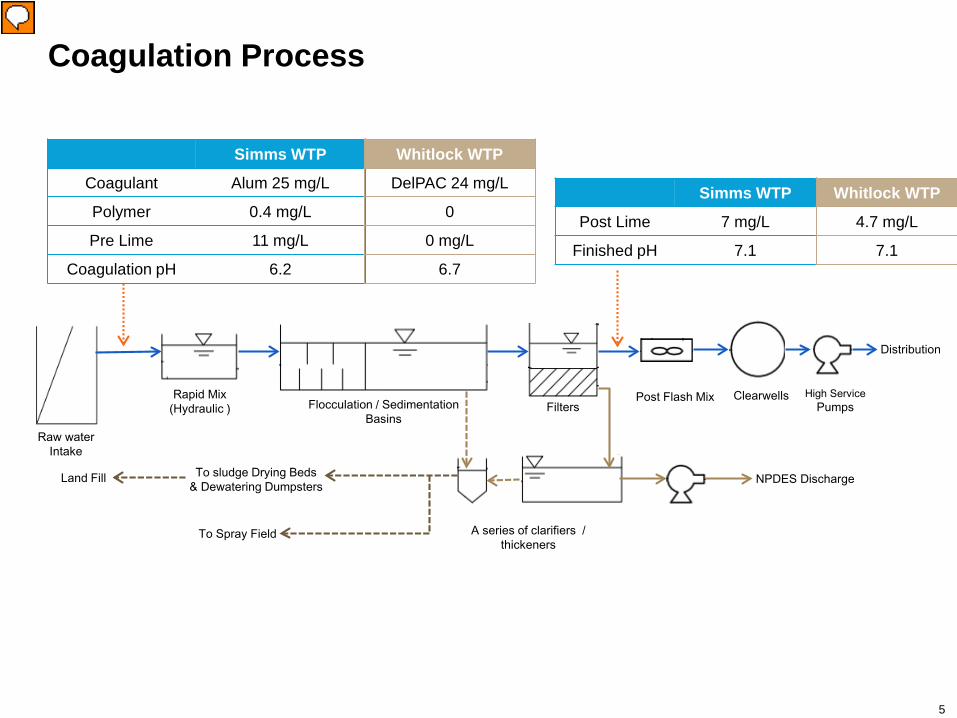
We evaluated the coagulant, lime, powdered activated carbon, corrosion inhibitor, and sodium thiosulfate feed systems. Today, I am going to focus on the work that we did for coagulation related chemicals. Currently, Simms plant feeds about 25 mg/L alum and 0.4 parts of polymer for coagulation at pH 6.2. The average dose of pre lime for pH control is about 11 mg/L. 7mg/L of lime is again fed in the post mix for pH adjustment in the finished water. Since the plant does not have sufficient bulk liquid storage volume for alum and lime to meet the 30-day storage requirement, bags of dry chemicals and feeders systems are kept on site. In long run, Spartanburg is planning for removing these dry chemical feeders and add more storage tanks. While we are working on the long term plan, Spartanburg water also wants to consider an alternative coagulant DelPAC. DelPAC 24 mg/L ( ≈ 18 mg/L alum) When Whitlock plant was online, it was using a poly aluminum chloride product, DelPAC. Based upon operator’s experience, DelPAC performs better than alum in TOC and turbidity removal , particularly during high flow rate condition Whitlock did not feed polymer In addition, DelPAC does not suppress coagulation pH so much. And it coagulates under a wider range of pH. Whitlock plant did not feed pre lime for pH control for majority time of the year. Since the coagulation pH is higher at 6.7, whitlock Because the pH was higher through the coagulation process, also feeding a smaller dose of post lime for finished water pH adjustment. .
Given all the potential benefits offered by DelPAC, We wanted to reevaluate coagulation using Alum vs DelPAC at Simms plant. We want consider their impact on coagulation process, operational cost, residual handling, capital improvement cost for additional chemical storage, We also want to look if there is any potential concerns by switching to DelPAc.
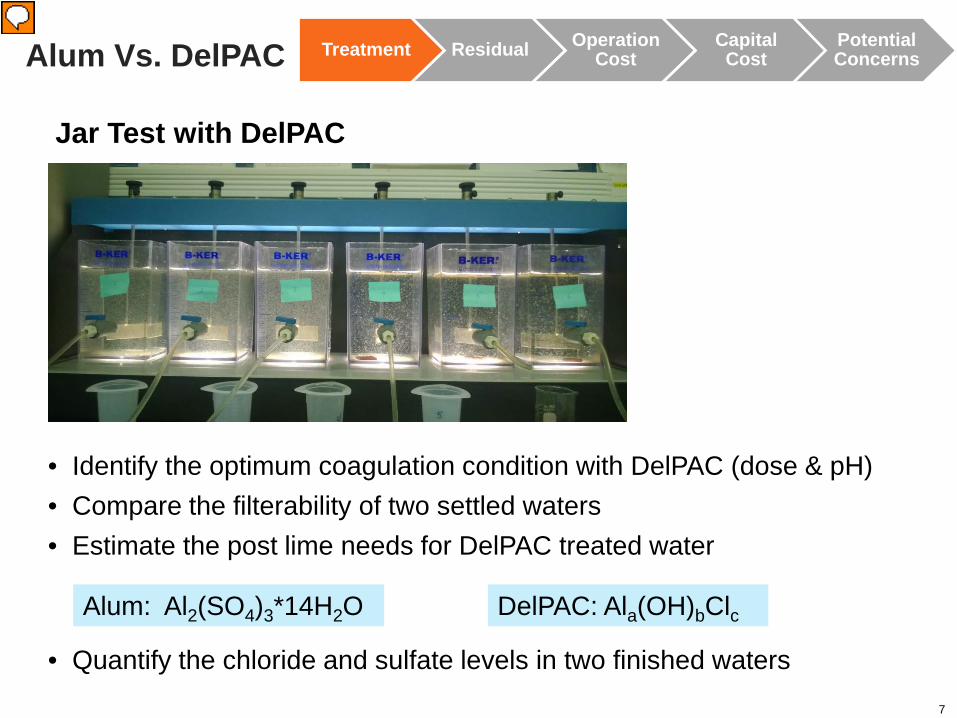
• Identify the optimum coagulation condition with DelPAC (dose & pH)• Compare the filterability of two settled waters• Estimate the post lime needs for DelPAC treated water
Alum Vs. DelPAC
7
Alum: Al2(SO4)3*14H2O DelPAC: Ala(OH)bClc
• Quantify the chloride and sulfate levels in two finished waters
Jar Test with DelPAC
Treatment Residual Operation Cost
Capital Cost
Potential Concerns
Presenter
Presentation Notes
We started evaluating DelPAC by doing jar test The objective the optimum coagulation condition with DelPAC Compare the filterability DelPAC treated water and alum treated water Estimate the post lime needs for DelPAC treated water% Alum [Al2(SO4)3*14H2O ] in solution (wt./wt.) Alum is hydrated aluminum sulfate, where as DelPAC contains aluminum chloride. After coagulation, aluminum settles out in the sludge, but sulfate and the chloride will stay in the finished water. Water treated with these two coagulants, contain different levels of sulfate and chloride in the finished water. Some research indicated that changing levels of sulfate and chloride can lead to potential issues in the distribution system. Quantify the chloride and sulfate levels in finished water treated with DelPAC versus Alum Based on the testing results on treatment side, a benefit-to-cost comparison can be made for a potential switch to DelPAC.
8
DelPAC Dose (mg/L)
Coagulation pH Control
6.0 6.25 6.5 6.75 7.0
7
14
21
27
34
41
48
Alum Vs. DelPAC Treatment Residual Operation Cost
Capital Cost
Potential Concerns
– Testing matrix for optimum coagulation condition with DelPAC
25 mg/L alum ≈in aluminum content
Presenter
Presentation Notes
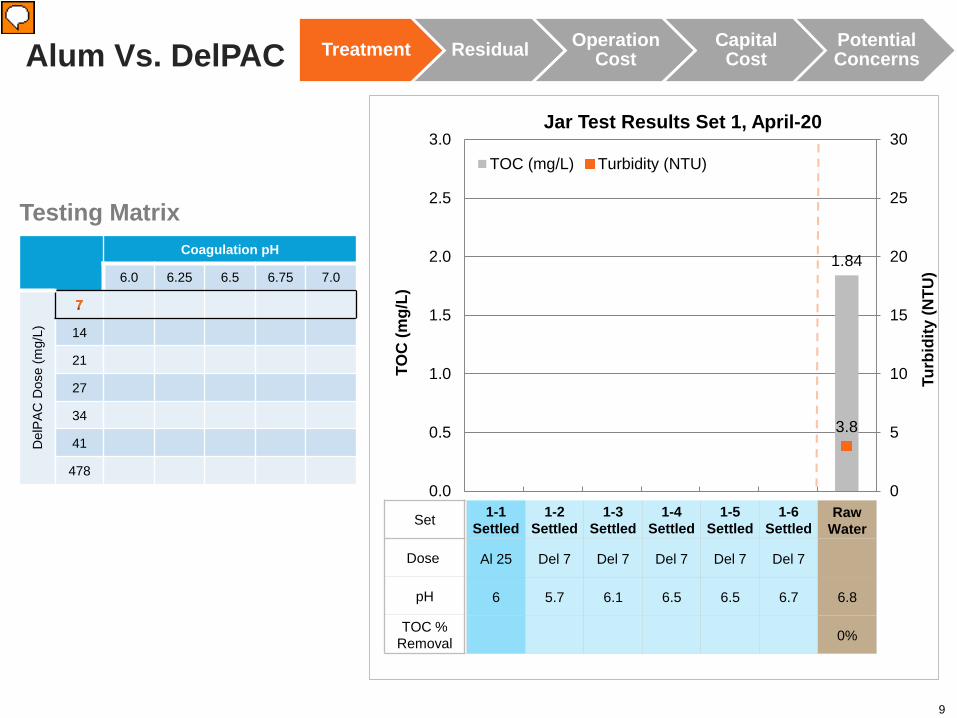
Here is our testing matrix for optimum coagulation condition. We want to test a series of DelPAC dose, a dose of 34.2 mg/L provides equivalent amount of aluminum content as 25 mg/L, which is Simms’s plant current operation condition. Then we reduce and increase the DelPAC dose in 20% increment. Spangenberg is hoping to stop feeding pre lime if switch to DelPAC in future. The raw water pH ranges from 6.5 to 7.2 depending on seasons. So in each set, test one DelPAC dose under five different coagulation pH from 6.0 to 7.0. We want the DelPAC to coagulate year-round without pH adjustment. Alum was added in the 6th jar to represent the plant condition. Repeat the test for seven DelPAC doses.
1.84
3.8
0
5
10
15
20
25
30
0.0
0.5
1.0
1.5
2.0
2.5
3.0
Turb
idity
(NTU
)
TOC
(mg/
L)
Jar Test Results Set 1, April-20
TOC (mg/L) Turbidity (NTU)
9
Coagulation pH
6.0 6.25 6.5 6.75 7.0
Del
PAC
Dos
e (m
g/L) 14
21
27
34
41
478
Testing Matrix
1-1Settled
1-2Settled
1-3Settled
1-4Settled
1-5Settled
1-6Settled
Raw Water
Al 25 Del 7 Del 7 Del 7 Del 7 Del 7
6 5.7 6.1 6.5 6.5 6.7 6.8
0%
Alum Vs. DelPAC Treatment Residual Operation Cost
Capital Cost
Potential Concerns
Set
Dose
pH
TOC % Removal
Presenter
Presentation Notes
The first series of jar test April 20, last year. The raw water turbidity was 3.8 NTU, and TOC was 1.84 mg/L, raw water pH 6.8 We added alum in the first jar, and DelPAC dose of 7 but different coagulation pH in the rest of the jars.
0.79 0.76 0.831.05 1.13 1.16
1.84
1.72.9
1.6 0.8 0.3 0.2
3.8
0
5
10
15
20
25
30
0.0
0.5
1.0
1.5
2.0
2.5
3.0
Turb
idity
(NTU
)
TOC
(mg/
L)
Jar Test Results Set 1, April-20
TOC (mg/L) Turbidity (NTU)
10
Coagulation pH
6.0 6.25 6.5 6.75 7.0
Del
PAC
Dos
e (m
g/L) 14
21
27
34
41
478
Testing Matrix
1-1Settled
1-2Settled
1-3Settled
1-4Settled
1-5Settled
1-6Settled
Raw Water
Al 25 Del 7 Del 7 Del 7 Del 7 Del 7
6 5.7 6.1 6.5 6.5 6.7 6.8
57% 59% 55% 43% 39% 37% 0%
Alum Vs. DelPAC Treatment Residual Operation Cost
Capital Cost
Potential Concerns
Set
Dose
pH
TOC % Removal
X X X X X
Presenter
Presentation Notes
The graph shows settled water TOC and turbidity from each jar. For DelPAC dose of 7, it performed well in settled turbidity but poor in TOC at higher coagulation pH, the opposite is true in low coagulation pH. It would be difficult to get this DelPAC dose working for both TOC and turbidity removal simultaneously. Therefore, a DelPAC dose of 6.8 mg/L is considered insufficient for coagulation under these conditions.
1.04
0.80 0.81 0.740.95
0.83
2.39
1.5 0.8 1.02.3
6.4 6.3
12.9
0
5
10
15
20
25
30
0.0
0.5
1.0
1.5
2.0
2.5
3.0
Turb
idity
(NTU
)
TOC
(mg/
L)
Jar Test Results Set 2, April-21
TOC (mg/L) Turbidity (NTU)
Coagulation pH
6.0 6.25 6.5 6.75 7.0
Del
PAC
Dos
e (m
g/L)
7 X X X X X
11
X X X X X
X X X X X
X X X X X
Alum Vs. DelPAC Treatment Residual Operation Cost
Capital Cost
Potential Concerns
Testing Matrix
2-1Settled
2-2Settled
2-3Settled
2-4Settled
2-5Settled
2-6Settled
Simms Raw
Del 14 Del 21 Del 27 Del 34 Del 41 Del 48
6.8 6.7 6.8 6.6 6.5 6.4 6.8
0%
Set
Dose
pH
TOC % Removal
Presenter
Presentation Notes
There was sever thunderstorm on over night April 20. When we started testing on April 21, the raw water turbidity increased from 3.8 NTU to 12.9 NTU on. The TOC jumped to 2.4. In order to evaluate different DelPAC doses under the same raw water quality, we the modified jar test plan, and tested six DelPAC doses ranging from 14 to 48. No caustic or sulfuric acid was used in any jar for pH control during Series 2. DelPAC doses of 13.7, 20.5, and 27.4 mg/L achieved settled water turbidity less than 2 NTU. The dose of 34.2 mg/L produced higher settled water turbidity of 2.3 NTU. A DelPAC dose above 40 mg/L was obviously overdosing for turbidity removal. Therefore, DelPAC doses of 13.7, 20.5, and 27.4 mg/L were selected to be further tested under different coagulation pH conditions.
Coagulation pH
6.0 6.25 6.5 6.75 7.0
Del
PAC
Dos
e (m
g/L)
7
21
27
34
41
48
12
X X X X X
Alum Vs. DelPAC Treatment Residual Operation Cost
Capital Cost
Potential Concerns
X X X X X
X X X X X
X X X X X
X X X X X
Testing Matrix
1.73 1.741.62 1.66 1.58 1.63
2.35
1.2 1.5 2.1 2.33.2 3.4
26.4
0
5
10
15
20
25
30
0.0
0.5
1.0
1.5
2.0
2.5
3.0
Turb
idity
(NTU
)
TOC
(mg/
L)
Jar Test Results Set 3, April-22
TOC (mg/L) Turbidity (NTU)
3-1Settled
3-2Settled
3-3Settled
3-4Settled
3-5Settled
3-6Settled
Simms Raw
Al 29 Del 14 Del 14 Del 14 Del 14 Del 14
6.8 6.1 6.3 6.5 6.6 6.7 6.7
26% 26% 31% 29% 33% 31% 0%
Set
Dose
pH
TOC % Removal
Presenter
Presentation Notes
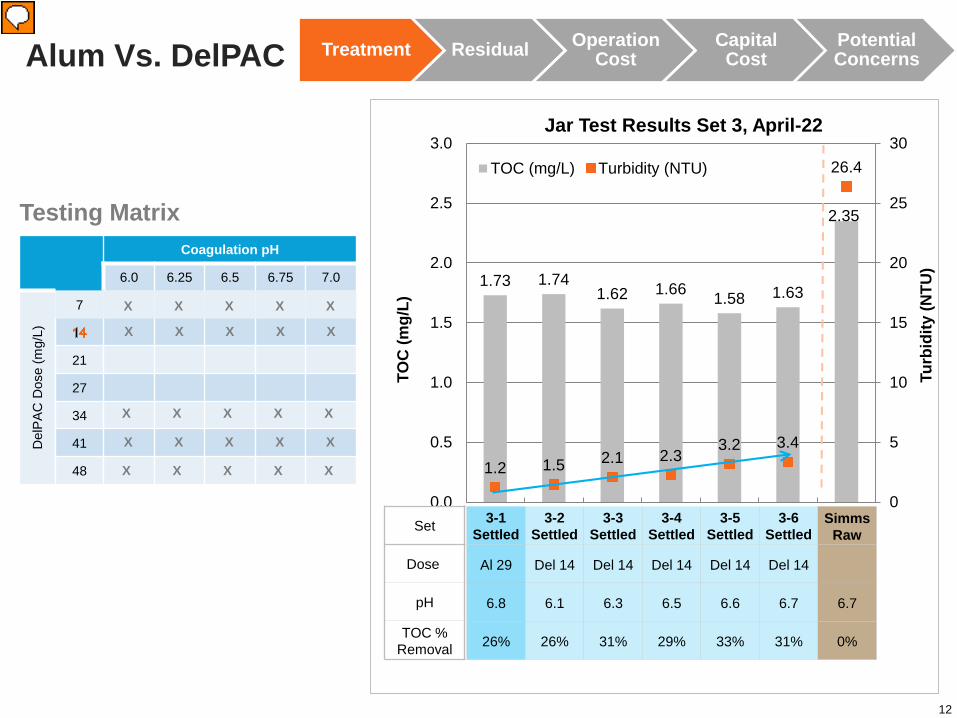
On April 22, the raw water turbidity was 26.4 NTU, and TOC was 2.35 mg/L. We started testing DelPAC dose of 13.7 mg/L at different pHs Again we added alum in the first jar to represent the plant condition. At dose of 14 mg/L, DelPAC was worse than Alum for turbidity removal in all pH conditions, most DelPAC jars had settled turbidity above 2 NTU. Therefore, this dose of 13.7 mg/L is considered insufficient for coagulation due to turbidity removal.
Coagulation pH
6.0 6.25 6.5 6.75 7.0
Del
PAC
Dos
e (m
g/L)
7 X X X X X
14 X X X X X
27
34 X X X X X
41 X X X X X
48 X X X X X
13
Alum Vs. DelPAC Treatment Residual Operation Cost
Capital Cost
Potential Concerns
Testing Matrix
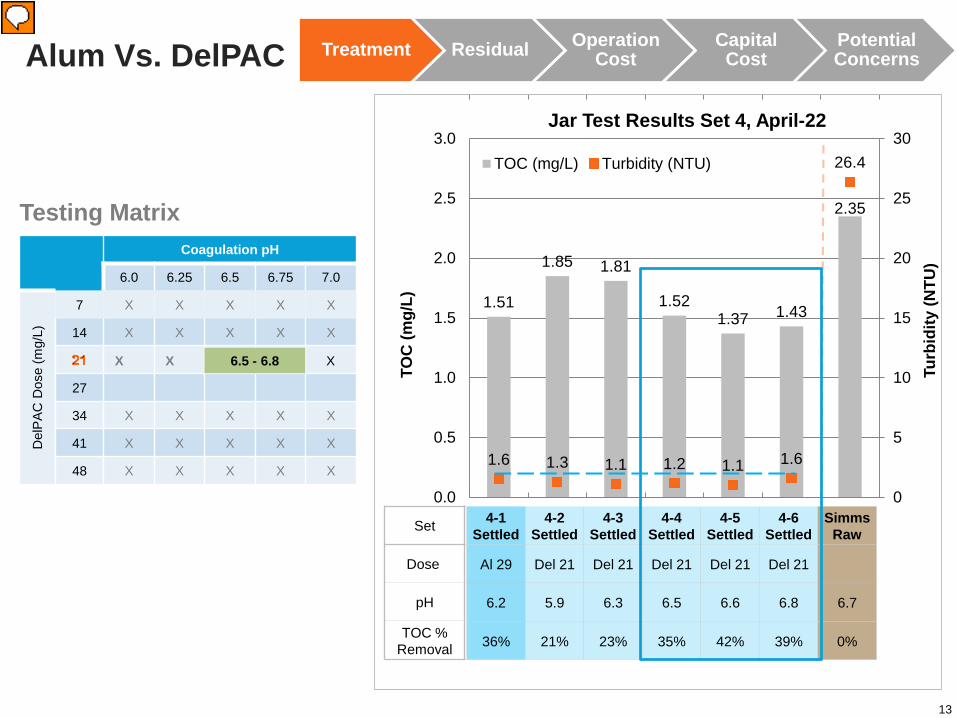
1.51
1.85 1.81
1.521.37 1.43
2.35
1.6 1.3 1.1 1.2 1.1 1.6
26.4
0
5
10
15
20
25
30
0.0
0.5
1.0
1.5
2.0
2.5
3.0
Turb
idity
(NTU
)
TOC
(mg/
L)
Jar Test Results Set 4, April-22
TOC (mg/L) Turbidity (NTU)
4-1Settled
4-2Settled
4-3Settled
4-4Settled
4-5Settled
4-6Settled
Simms Raw
Al 29 Del 21 Del 21 Del 21 Del 21 Del 21
6.2 5.9 6.3 6.5 6.6 6.8 6.7
36% 21% 23% 35% 42% 39% 0%
Set
Dose
pH
TOC % Removal
X X 6.5 - 6.8 X
Presenter
Presentation Notes
Following that, we tested DelPAC dose of 20.5 mg/L At this dose, DelPAC achieved better or equal settled turbidity than alum under all pH conditions. Between pH 6.5 to 6.8, DelPAC achieved better or equal TOC removal than Alum, and it removed more than 35% TOC as required by enhanced coagulation rule. DelPAC dose of 20.5 and coagulation pH of 6.5 to 6.8 is considered the optimum coagulation window.
14
Alum Vs. DelPAC Treatment Residual Operation Cost
Capital Cost
Potential Concerns
Coagulation pH
6.0 6.25 6.5 6.75 7.0
Del
PAC
Dos
e (m
g/L)
7 X X X X X
14 X X X X X
21
34 X X X X X
41 X X X X X
48 X X X X X
X X 6.5 - 6.8 X
Testing Matrix
X 6.3-6.8 X
1.61 1.57 1.58
1.34
1.57
1.80
2.7
0.71.8 1.2 1.4 0.9
3.1
21.1
0
5
10
15
20
25
30
0.0
0.5
1.0
1.5
2.0
2.5
3.0
Turb
idity
(NTU
)
TOC
(mg/
L)
Jar Test Results Set 5, April-23
TOC (mg/L) Turbidity (NTU)
5-1Settled
5-2Settled
5-3Settled
5-4Settled
5-5Settled
5-6Settled
Simms Raw
Al 29 Del 27 Del 27 Del 27 Del 27 Del 27 Del 27
6.3 6.1 6.3 6.5 6.8 7.0 6.7
40% 42% 41% 50% 42% 33% 0%
Set
Dose
pH
TOC % Removal
Presenter
Presentation Notes
On April 23, the raw water turbidity was 21.1 NTU, and TOC was 2.70 mg/L. At coagulation pH range of 6.3 to 6.8, DelPAC produced better or equal settled TOC and turbidity compared to alum. So this combination of DelPAC dose and pH range is considered as optimum coagulation window as well. With 27.4 mg/L DelPAC, the settled water turbidity was less than 1.5 NTU in pH range of 6.3 to 6.8. Considering settled water turbidity tends to be higher on jars than actual basin, coagulation with 27.4 mg/L DelPAC with pH range of 6.3 to 6.8 will achieve good TOC and turbidity removal in plant.
Pre lime dose 10.9 mg/L 0 mg/L (2 mg/L occasionally)
Presenter
Presentation Notes
Based on the jar testing results, the optimum coagulation window with DelPAC is between 21 mg/L to 27 mg/L. We took the average number of 24 for the following cost-to-benefit analysis. DelPAC at a lower dose performs equally if not better than the current alum dose. DelPAC will eliminate the need for coagulant polymer. The optimum coagulation pH is between 6.3 and 6.8. DelPAC typically drops raw water pH for 0.2 units during coagulation. Based upon the raw water pH at Simms, the plant will be in the optimum pH range for coagulation using DelPAC for most of the year without pH adjustment. Only when the raw water pH is at the lowest level of 6.5 in summer, the plant is expected to feed a small dose of lime (e.g. 2 mg/L)
Alum Vs. DelPAC
16
Rapid Mix(Hydraulic )
Flocculation / Sedimentation
Coagulation Chemicals
Filtration
Hypochlorite
Post Flash Mix
Finished Water
Lime HypochloriteFluoridePhosphate
Alum DelPAC
Chloride 8.4 mg/L 11.7 mg/L
Sulfate 18.1 mg/L 2.2 mg/L
Chloride to SulfateMass Ratio (CSMR) 0.46 Expected 2.7 – 4.5
– Optimum Coagulation Condition
Alum DelPAC
Coagulant dose 25 mg/L 24 mg/L
Polymer 0.4 mg/L none
Coagulation pH 6.2 6.3 – 6.8
Pre lime dose 10.9 mg/L 0 mg/L (2 mg/L occasionally)
– Similar filterability of alum and DelPAC treated water
– Finished water chloride and sulfate levels
Treatment Residual Operation Cost
Capital Cost
Potential Concerns
Post lime dose 7.0 mg/L 3.5 mg/L
Residual Operation Cost
Capital Cost
Potential Concerns
Presenter
Presentation Notes
Following sedimentation, we did bench scale filtration test of the two settled waters. They showed similar filterability. After filtration, we simulated post chemical addition on bench to match the plant performance. We expect the plant to reduce the post lime dose by half if switch from Alum to DelPAC. Finally, we measured chloride and sulfate level in the finished water. DelPAC treated water contains more chloride but significantly less sulfate compared to alum treated water. The chloride to sulfate mass ratio is expected to increase from 0.46 with Alum coagulant to an estimated range of 2.7 to 4.5 with DelPAC coagulant. Based on the testing results on treatment side, a benefit-to-cost comparison can be made for a potential switch to DelPAC. We chlorinated the settled water and did the filtration test on bench. The time required to filter one liter of settled water was recorded. The filtration time for settled water correlates with how fast headloss would develop across full scale filter bed. Similar filterability were observed fro alum and DelPAC treated water.
Alum Vs. DelPAC
– Estimated annual dry sludge production with alum and DelPAC at average flow rate of 25 MGD:
Treatment Residual Operation Cost
Capital Cost
Potential Concerns
Alum
Sludge Type Average
NTU or mg/L
Dry Sludge
lb/year
Turbidity 6.8 517,000
Coagulant 25 837,000
Carbon 4.3 17,000
Polymer 0.4 30,400
1% Inert Solids in Lime 10.9 8,300
Estimated Annual Dry Sludge (lb) 1,410,000
DelPAC
Average
NTU or mg/L
Dry Sludge
lb/year
6.8 517,000
24 574,000
4.3 17,000
0 0
2 1,500
1,110,000
21% reduction
17
24 mg/L DelPAC ≈ 18 mg/L Alum in Aluminum
Presenter
Presentation Notes
The first factor we looked at is the residual handling . We compared the annual quantity of dry sludge (in other words sludge after dewatering) generated by Alum vs DelPAC at current plant flow rate of 25 MGD. With alum, sludge is composed of turbidity, coagulant, carbon, polymer, and inert solids in pre lime. The average turbidity is very low at Spartanburg 6.8 NTU. approximately 60% of the sludge is contributed by the aluminum in alum. If we switch to DelPAC, 24 mg/L DalPAC provides equivalent amount of aluminum as 18 mg/L of alum. The sludge contributed by coagulant will be reduced by a quarter. We will also cut down the sludge from polymer and pre lime. The estimated annual dry sludge is 1,410,395 pounds from alum coagulant. The estimated quantity is 1,110,083 pounds if the plant switches to DelPAC as its coagulant, which reduces the sludge production by 20% compared to Alum. Convert it to sludge,
Alum Vs. DelPAC Treatment Residual Operation Cost
Capital Cost
Potential Concerns
18
4 2356
781
• Sedimentation basins cleaningo #5-8 with mechanical sludge removal
equipment: 2 / yearo #1-4 without mechanical sludge
There are 8 sedimentation basins at Simms plant. Currently, these basins are not equipped with mechanical sludge removal system. Operators manually drain the basin and clean up the sludge. If a basin is taken off line after 1/3 of the volume is occupied by sludge. With alum, each basin needs to be cleaned 11 times per year With DelPAC, the number will be reduced to 9 times per year. After sludge is collected to clarifier and thickeners, operators do onsite sludge dewatering with mechanical equipment and drying beds. Reduction on sludge quantity with DelPAC will ease the work load on operators.
Treatment Residual Operation Cost
Capital Cost
Potential ConcernsAlum Vs. DelPAC
– Estimated annual chemical cost for coagulant, polymer, and lime at average flow rate of 25 MGD:
19
Alum$0.1101 / lb
DelPAC $0.1990 / lb
Coagulant dose 25 mg/L 24 mg/L
Polymer$0.8826 / lb 0.4 mg/L none
Pre & post lime dose$0.0425 / lb 17.9 mg/L 5.5 mg/L
$431,901 $363,466
$192,983
$59,297
$26,867
0
100,000
200,000
300,000
400,000
500,000
600,000
700,000
Coagulation with Alum Coagulation with DelPAC
Che
mic
al C
ost (
$)
Annual Chemical Cost For Coagulant, Coagulant Aid, and Lime(25 MGD)
Polymer PRP 3050* Pre & Post Lime Coagulant
Presenter
Presentation Notes
The next factor we looked at is operation cost. We calculated annual chemical cost for coagulant, lime, and coagulation polymer were calculated for alum versus DelPAC coagulation at average plant flow rate of 25 MGD. Even through the unit cost per pound of DelPAC is higher than alum. DelPAC is more concentrated product, containing more effective ingredient per pound. The end result is that it would be cheaper for DelPAC than Alum. The additional cost saving with DelPAC coagulation come from elimination of polymer and reduction of lime. It is estimated that the plant will be able to reduce the cost for these three chemicals from 650 K to 420 K if switched to DelPAC. Potentially a quarter million dollars could be saved annually. $230,000 in chemical cost annually at 25 MGD average flow rate by switching from alum to DelPAC.
Treatment Residual Operation Cost
Capital Cost
Potential ConcernsAlum Vs. DelPAC
– Estimated capital cost for additional chemical storage volume to meet the 30-day supply requirement at plant rated capacity of 64 MGD:
- Replacing polymer feed system in future - Use existing Alum tank for DelPAC- Abandon polymer feed system in future
Presenter
Presentation Notes
As we mentioned earlier, that Simms plant is short of bulk coagulant and lime storage volume. With the testing result, we calculated the required 30-day storage volume at plant rated capacity of 64 MGD. The plant currently has 3 alum tanks with 20,000 gal, 2 liquid lime tanks with 40,000 gal. If the plant keeps alum as its coagulant, an additional 55,700 gallons of storage is required., an additional 75,000 gallons of liquid lime storage is required if diluted to 25%. The plant will keep the existing polymer batching and feed system. If the plant switches to DelPAC as its coagulant, an additional 15,500 gallons of storage is required. It is assumed that the existing alum tanks will be used for storing DelPAC, No additional storage volume is needed for liquid lime if the plant stores lime at 25%. The existing lime feed pumps may need to be replaced with smaller feed pumps. The polymer feed system will be abandoned.
Alum DelPAC
Coagulant dose 25 mg/L 24 mg/L
Pre & post lime dose 17.9 mg/L 5.5 mg/L
Capital Cost $ 2,440,000 $ 815,000
Treatment Residual Operation Cost
Capital Cost
Potential ConcernsAlum Vs. DelPAC
– Estimated capital cost for additional chemical storage volume to meet the 30-day supply requirement:
21
Existing Chemical Feed BuildingAlum Tanks
Liquid Lime
New Lime
Coa
gula
nt
Presenter
Presentation Notes
The alum tanks are located in the existing chemical building. There is no more space for additional tanks in the building. The lime slurry tanks were installed in the last plant upgrade. New bulk storage tanks for alum or DelPAC will be located in a new 2,500-square-foot building. Additional lime tanks for alum coagulation will be located across the drive way of the existing lime tanks. Preliminary budget cost for improvements in chemical storage volume is 2.4 M with alum coagulation, where as the budget cost for improvements associated with DelPAC coagulation is only one third of that.
Treatment Residual Operation Cost
Capital Cost
Potential ConcernsAlum Vs. DelPAC
22
Finished Water Alum DelPAC
Chloride 8.4 mg/L 11.7 mg/L
Sulfate 18.1 mg/L 2.2 mg/L
Chloride to SulfateMass Ratio (CSMR) 0.46 Expected
2.7 – 4.5
– Increasing chloride to sulfate mass ratio in finished water may trigger potential lead release in the distribution system
• Successes and failures in coagulant changeover at WTPs of Carolinas
• Whitlock WTP of Spartanburg Water was using DelPAC when it was online
Nguyen, C., Stone, K., Clark, B., Edwards, M., Gagnon, G., Knowles, A., 2010. Impact of chloride: sulfate mass ratio (CSMR) changes on Lead leaching in potable water. Water Research Foundation, Denver, CO.
Figure. Level of Lead Concern Relative to CSMR of Water
Presenter
Presentation Notes
Before we get too excited about switching from alum to DelPAC. We have to address the potential concerns related to increasing chloride to sulfate mass ratio in the finished water. Professor Marc Edwards in Virginia Tech researched impact of this ratio on potential lead leaching in the distribution system. The greatest concerns are at utilities that have lead solder and / or partially replaced lead pipe in their distribution system, which is the case for Spartanburg. These utilities are at risk particularly if the chloride to sulfate mass ratio is increasing from below 0.5 to above 0.5. Although DelPAC has great advantages over alum in all other factors, it is uncertain if coagulant changeover will trigger lead release in the distribution system. There are examples of success as well as failure in coagulant changeover in WTPS of Carolinas. In fact, when Whitlock WTP was online, it was using DelPAC.
Treatment Residual Operation Cost
Capital Cost
Potential ConcernsAlum Vs. DelPAC
23
Simms
Whitlock
> 75%
< 25%
50-75%
25-50%
No Lead Concerns Reported
Presenter
Presentation Notes
At that time, Both Whitlock and Simms plants fed into the main distribution system. Area in black shade gets more than 75% of water from Whitlock plant, green area gets less than a quarter of water from Whitlock. No lead concerns were reported in the main distribution system when Whitlock was still online, or in the isolated system fed by Landrum WTP. It is recommended that SW review past lead and copper data as well as pipe material in the distribution area dominated by water from each plant prior to switching coagulants. If the risk for lead leaching appears high based upon this review, pilot scale testing can be conducted to confirm corrosion rates. If the risk appears to be minimal, Simms plant can move forward with a plant scale test of DelPAC. During the test, lead level needs to be closely monitored in the distribution system.
Saving Money by Changing Chemicals ($)?Not So Fast, My Friend!
Treatment Residual Operation Cost Capital Cost Potential Concerns
24
• The final lead and copper rule requires that water systems obtain approval from the State prior to adding a new source of water or making any long-term changes in the water treatment process.
• The EPA’s rationale for this requirement is that these changes can unintentionally affect the system's optimal corrosion control.
- DelPAC – poly aluminum chloride
Treatment Residual Operation Cost Capital Cost Potential Concerns
• Test another alternative coagulant product poly aluminum sulfate.
- PAS – poly aluminum sulfate
Presenter
Presentation Notes
The final lead and copper rule [3] requires that water systems obtain approval from the State prior to adding a new source of water or making any long-term changes in the water treatment process. The EPA’s rationale for this requirement is that these changes can unintentionally affect the system's optimal corrosion control. Examples of treatment changes include switching coagulants EPA believes that State review and approval of changes in long-term treatment or addition of a new source will provide an opportunity to minimize any potential impacts on optimal corrosion control. Long-term treatment changes include the addition of a new treatment process or modification of an existing treatment process.
25
Presenter
Presentation Notes
The final lead and copper rule [3] requires that water systems obtain approval from the State prior to adding a new source of water or making any long-term changes in the water treatment process. The EPA’s rationale for this requirement is that these changes can unintentionally affect the system's optimal corrosion control. Examples of treatment changes include switching coagulants EPA believes that State review and approval of changes in long-term treatment or addition of a new source will provide an opportunity to minimize any potential impacts on optimal corrosion control. Long-term treatment changes include the addition of a new treatment process or modification of an existing treatment process.
The final lead and copper rule [3] requires that water systems obtain approval from the State prior to adding a new source of water or making any long-term changes in the water treatment process. The EPA’s rationale for this requirement is that these changes can unintentionally affect the system's optimal corrosion control. Examples of treatment changes include switching coagulants EPA believes that State review and approval of changes in long-term treatment or addition of a new source will provide an opportunity to minimize any potential impacts on optimal corrosion control. Long-term treatment changes include the addition of a new treatment process or modification of an existing treatment process.