© CRISIL Limited. All Rights Reserved.
Sagar Cements Ltd
Enhancing investment decisions
Q4FY11 Result Update

© CRISIL Limited. All Rights Reserved.
Explanation of CRISIL Fundamental and Valuation (CFV) matrix
The CFV Matrix (CRISIL Fundamental and Valuation Matrix) addresses the two important analysis of an investment making process –
Analysis of Fundamentals (addressed through Fundamental Grade) and Analysis of Returns (Valuation Grade) The fundamental
grade is assigned on a five-point scale from grade 5 (indicating Excellent fundamentals) to grade 1 (Poor fundamentals) The
valuation grade is assigned on a five-point scale from grade 5 (indicating strong upside from the current market price (CMP)) to
grade 1 (strong downside from the CMP).
CRISIL Fundamental Grade
Assessment CRISIL Valuation Grade
Assessment
5/5 Excellent fundamentals 5/5 Strong upside (>25% from CMP)
4/5 Superior fundamentals 4/5 Upside (10-25% from CMP)
3/5 Good fundamentals 3/5 Align (+-10% from CMP)
2/5 Moderate fundamentals 2/5 Downside (- 10-25% from CMP)
1/5 Poor fundamentals 1/5 Strong downside (<-25% from CMP)
Analyst Disclosure Each member of the team involved in the preparation of the grading report, hereby affirms that there exists no conflict of interest
that can bias the grading recommendation of the company. Additional Disclosure This report has been sponsored by NSE - Investor Protection Fund Trust (NSEIPFT). Disclaimer: This Exchange-commissioned Report (Report) is based on data publicly available or from sources considered reliable by CRISIL
(Data). However, CRISIL does not guarantee the accuracy, adequacy or completeness of the Data / Report and is not responsible for
any errors or omissions or for the results obtained from the use of Data / Report. The Data / Report are subject to change without
any prior notice. Opinions expressed herein are our current opinions as on the date of this Report. Nothing in this Report constitutes
investment, legal, accounting or tax advice or any solicitation, whatsoever. The Report is not a recommendation to buy / sell or hold
any securities of the Company. CRISIL especially states that it has no financial liability, whatsoever, to the subscribers / users of this
Report. This Report is for the personal information only of the authorized recipient in India only. This Report should not be
reproduced or redistributed or communicated directly or indirectly in any form to any other person – especially outside India or
published or copied in whole or in part, for any purpose.
© CRISIL Limited. All Rights Reserved. CRISIL EQUITIES | 1
Sagar Cements Ltd Growth driven by improved realisations
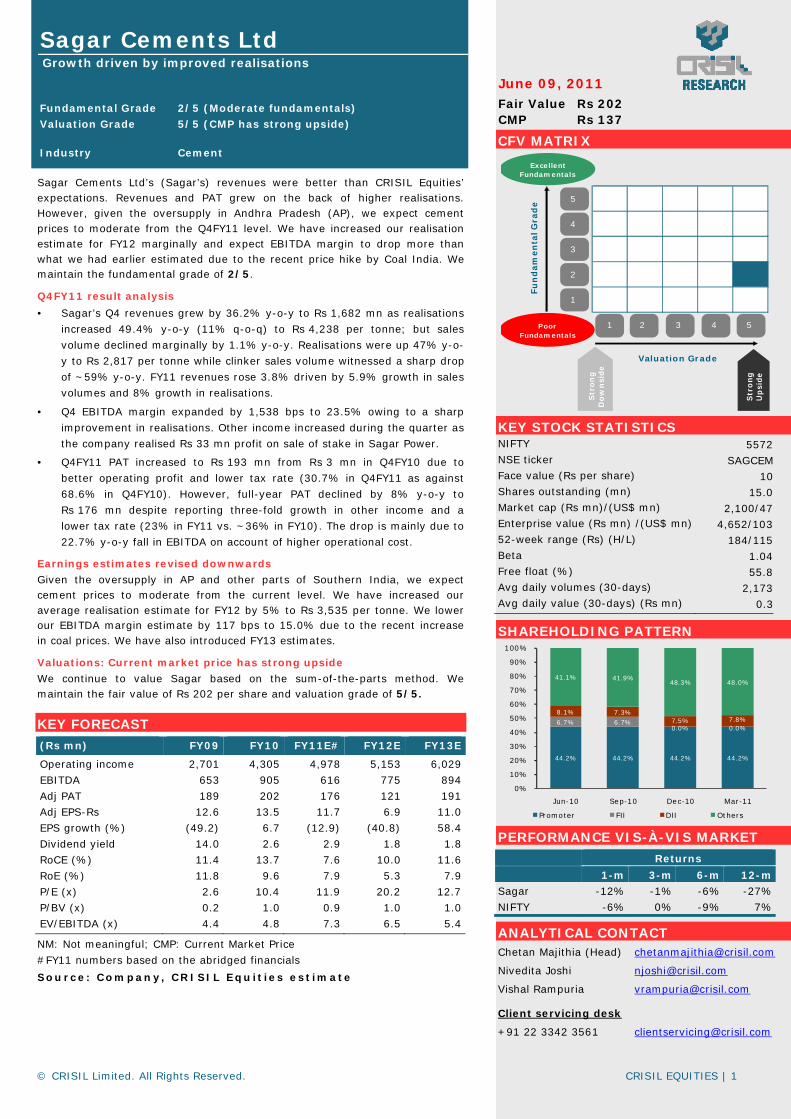
Fundamental Grade 2/5 (Moderate fundamentals)
Valuation Grade 5/5 (CMP has strong upside) Industry Cement
Fair Value Rs 202 CMP Rs 137
June 09, 2011
Sagar Cements Ltd’s (Sagar’s) revenues were better than CRISIL Equities’ expectations. Revenues and PAT grew on the back of higher realisations. However, given the oversupply in Andhra Pradesh (AP), we expect cement prices to moderate from the Q4FY11 level. We have increased our realisation estimate for FY12 marginally and expect EBITDA margin to drop more than what we had earlier estimated due to the recent price hike by Coal India. We maintain the fundamental grade of 2/5.
Q4FY11 result analysis
• Sagar’s Q4 revenues grew by 36.2% y-o-y to Rs 1,682 mn as realisations
increased 49.4% y-o-y (11% q-o-q) to Rs 4,238 per tonne; but sales
volume declined marginally by 1.1% y-o-y. Realisations were up 47% y-o-
y to Rs 2,817 per tonne while clinker sales volume witnessed a sharp drop
of ~59% y-o-y. FY11 revenues rose 3.8% driven by 5.9% growth in sales
volumes and 8% growth in realisations.
• Q4 EBITDA margin expanded by 1,538 bps to 23.5% owing to a sharp
improvement in realisations. Other income increased during the quarter as
the company realised Rs 33 mn profit on sale of stake in Sagar Power.
• Q4FY11 PAT increased to Rs 193 mn from Rs 3 mn in Q4FY10 due to
better operating profit and lower tax rate (30.7% in Q4FY11 as against
68.6% in Q4FY10). However, full-year PAT declined by 8% y-o-y to
Rs 176 mn despite reporting three-fold growth in other income and a
lower tax rate (23% in FY11 vs. ~36% in FY10). The drop is mainly due to
22.7% y-o-y fall in EBITDA on account of higher operational cost.
Earnings estimates revised downwards
Given the oversupply in AP and other parts of Southern India, we expect cement prices to moderate from the current level. We have increased our average realisation estimate for FY12 by 5% to Rs 3,535 per tonne. We lower our EBITDA margin estimate by 117 bps to 15.0% due to the recent increase in coal prices. We have also introduced FY13 estimates.
Valuations: Current market price has strong upside
We continue to value Sagar based on the sum-of-the-parts method. We maintain the fair value of Rs 202 per share and valuation grade of 5/5.
KEY FORECAST
(Rs mn) FY09 FY10 FY11E# FY12E FY13E
Operating income 2,701 4,305 4,978 5,153 6,029
EBITDA 653 905 616 775 894
Adj PAT 189 202 176 121 191
Adj EPS-Rs 12.6 13.5 11.7 6.9 11.0
EPS growth (%) (49.2) 6.7 (12.9) (40.8) 58.4
Dividend yield 14.0 2.6 2.9 1.8 1.8
RoCE (%) 11.4 13.7 7.6 10.0 11.6
RoE (%) 11.8 9.6 7.9 5.3 7.9
P/E (x) 2.6 10.4 11.9 20.2 12.7
P/BV (x) 0.2 1.0 0.9 1.0 1.0
EV/EBITDA (x) 4.4 4.8 7.3 6.5 5.4
NM: Not meaningful; CMP: Current Market Price
#FY11 numbers based on the abridged financials
Source: Company, CRISIL Equ it ies est imate
CFV MATRIX
KEY STOCK STATISTICS NIFTY 5572NSE ticker SAGCEMFace value (Rs per share) 10Shares outstanding (mn) 15.0Market cap (Rs mn)/(US$ mn) 2,100/47Enterprise value (Rs mn) /(US$ mn) 4,652/10352-week range (Rs) (H/L) 184/115Beta 1.04Free float (%) 55.8Avg daily volumes (30-days) 2,173Avg daily value (30-days) (Rs mn) 0.3
SHAREHOLDING PATTERN
PERFORMANCE VIS-À-VIS MARKET
Returns
1-m 3-m 6-m 12-m
Sagar -12% -1% -6% -27%
NIFTY -6% 0% -9% 7%
ANALYTICAL CONTACT Chetan Majithia (Head) [email protected]
Nivedita Joshi [email protected]
Vishal Rampuria [email protected]
Client servicing desk
+91 22 3342 3561 [email protected]
1 2 3 4 5
1
2
3
4
5
Valuation Grade
Fu
nd
am
en
tal G
rad
e
Poor Fundamentals
ExcellentFundamentals
Str
on
gD
ow
nsi
de
Str
ong
Up
side
44.2% 44.2% 44.2% 44.2%
6.7% 6.7%0.0% 0.0%
8.1% 7.3%7.5% 7.8%
41.1% 41.9%48.3% 48.0%
0%
10%
20%
30%
40%
50%
60%
70%
80%
90%
100%
Jun-10 Sep-10 Dec-10 Mar-11
Promoter FII DII Others

© CRISIL Limited. All Rights Reserved. CRISIL EQUITIES | 2
Sagar Cements Ltd
Q4FY11 Result Summary (Rs mn) Q4FY11 Q3FY11 Q4FY10 q-o-q (%) y-o-y (%) FY11 FY10 y-o-y (%)
Net sales 1,682 1,126 1,236 49.3 36.2 4,978 4,305 15.6
Consumption of Raw Materials 763 456 657 67.2 16.2 2,402 2,378 1.0
Raw material as a % of sales 36% 44% 50% (772) bps (1,415) bps 44% 56% (1,198) bps
(Increase) / Decrease in Stock in Trade (158) 36 (38) 542.8 (319.8) (229) 17 (1,470.6)
Other expenses 639 452 465 41.2 37.3 2,028 825 146.0
Employees Cost 42 41 50 3.2 (15.8) 161 180 (10.9)
EBITDA 396 141 101 180.9 292.9 616 905 (31.9)
EBITDA margin 23.5% 12.5% 8.2% 1,102 bps 1,538 bps 12.4% 21.0% (865) bps
Depreciation 68 66 68 2.3 (0.9) 270 287 (5.7)
EBIT 328 75 33 338.2 906.4 346 618 (44.1)
Interest and finance charges 83 83 69 0.5 20.2 306 301 1.8
Operating PBT 245 (8) (37) NM NM 39 317 (87.6)
Other Income 33 43 45 (23.0) (26.1) 190 3 NM
Extraordinary Income/(expense) - - - NM NM - - NM
PBT 278 35 8 695.9 NM 229 321 (28.5)
Tax 85 4 6 NM NM 53 119 (55.0)
PAT 193 31 3 520.8 NM 176 202 (12.9)
Adj PAT 193 31 3 520.8 NM 176 202 (12.9)
Adj PAT margin 11.5% 2.8% 0.2% 9 bps 1,125 bps 3.5% 4.7% (116) bps
No of equity shares (mn) 15.0 15.0 15.0 (0.0) (0.0) 15.0 15.0 -
Adj EPS (Rs) 12.8 2.1 0.2 520.9 NM 11.7 13.5 (12.9)
Source: Company, CRISIL Equ it ies
Strong growth in revenues... ... driven by improved realisations
Source: Company, CRISIL Equ it ies Source: Company, CRISIL Equ it ies
Quarterly EBITDA and PAT margin trend Fair value movement since initiation
Source: Company, CRISIL Equ it ies Source: NSE, CRISIL Equ ities
1,236 1,304
864
1,126
1,682
-
200
400
600
800
1,000
1,200
1,400
1,600
1,800
Q4FY10 Q1FY11 Q2FY11 Q3FY11 Q4FY11
(Rs mn)
2,837 3,251
2,822
3,818 4,238
0.42
0.39
0.31 0.30
0.42
0.00
0.05
0.10
0.15
0.20
0.25
0.30
0.35
0.40
0.45
0
500
1,000
1,500
2,000
2,500
3,000
3,500
4,000
4,500
Q4FY10 Q1FY11 Q2FY11 Q3FY11 Q4FY11
(mn tonnes)(Rs)
Revenue per tonne Sales volumes (RHS)
8.2%9.8%
-5.6%
12.5%
23.5%
0.2% 0.4%
-6.1%
2.8%
11.5%
-10%
-5%
0%
5%
10%
15%
20%
25%
30%
Mar-10 Jun-10 Sep-10 Dec-10 Mar-11
EBITDA Margin PAT Margin
0
50
100
150
200
250
0
25
50
75
100
125
150
175
200
225
02-N
ov-
10
16-N
ov-
10
30-N
ov-
10
14-D
ec-
10
28-D
ec-
10
11-
Jan-
11
25-
Jan-
11
08-F
eb-
11
22-F
eb-
11
08-
Mar-
11
22-
Mar-
11
05-A
pr-
11
19-A
pr-
11
03-M
ay-
11
('000)(Rs)
Traded Traded Quantity (RHS) CRISIL Fair Value Sagar
© CRISIL Limited. All Rights Reserved. CRISIL EQUITIES | 3
Sagar Cements Ltd
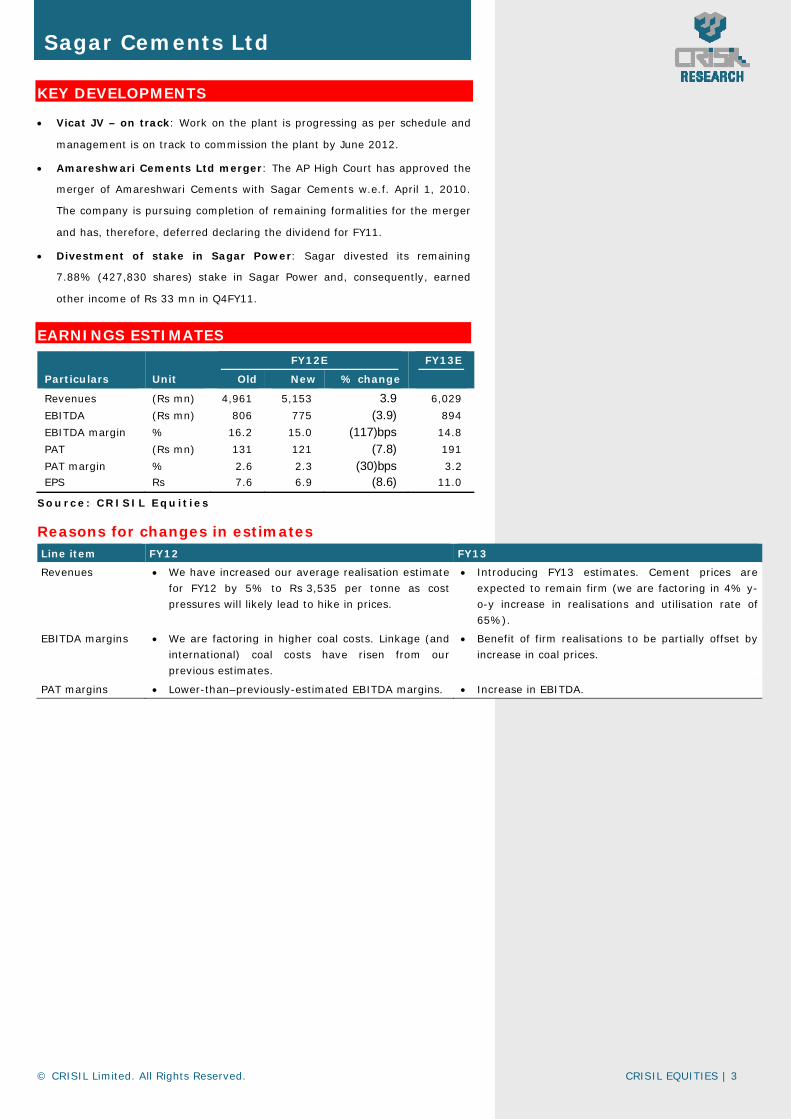
KEY DEVELOPMENTS
• Vicat JV – on track: Work on the plant is progressing as per schedule and
management is on track to commission the plant by June 2012.
• Amareshwari Cements Ltd merger: The AP High Court has approved the
merger of Amareshwari Cements with Sagar Cements w.e.f. April 1, 2010.
The company is pursuing completion of remaining formalities for the merger
and has, therefore, deferred declaring the dividend for FY11.
• Divestment of stake in Sagar Power: Sagar divested its remaining
7.88% (427,830 shares) stake in Sagar Power and, consequently, earned
other income of Rs 33 mn in Q4FY11.
EARNINGS ESTIMATES
FY12E FY13E
Particulars Unit Old New % change
Revenues (Rs mn) 4,961 5,153 3.9 6,029
EBITDA (Rs mn) 806 775 (3.9) 894
EBITDA margin % 16.2 15.0 (117)bps 14.8
PAT (Rs mn) 131 121 (7.8) 191
PAT margin % 2.6 2.3 (30)bps 3.2
EPS Rs 7.6 6.9 (8.6) 11.0
Source: CRISIL Equ it ies
Reasons for changes in estimates Line item FY12 FY13
Revenues • We have increased our average realisation estimate
for FY12 by 5% to Rs 3,535 per tonne as cost
pressures will likely lead to hike in prices.
• Introducing FY13 estimates. Cement prices are
expected to remain firm (we are factoring in 4% y-
o-y increase in realisations and utilisation rate of
65%).
EBITDA margins • We are factoring in higher coal costs. Linkage (and
international) coal costs have risen from our
previous estimates.
• Benefit of firm realisations to be partially offset by
increase in coal prices.
PAT margins • Lower-than–previously-estimated EBITDA margins. • Increase in EBITDA.

© CRISIL Limited. All Rights Reserved. CRISIL EQUITIES | 4
Sagar Cements Ltd
VALUATION
We continue to value Sagar based on the sum-of-the-parts method by using
EV/tonne of Rs 1,720 for the core business and its investments in Sagar-Vicat
JV at 6x EV/EBITDA; the core business is valued at Rs 143/share and Vicat JV at
Rs 59/share. We have rolled over our fair value to FY13 and maintain it at
Rs 202.
One-year forward P/E band One-year forward EV/tonne band
Source: NSE, CRISIL Equ ities Source: NSE, CRISIL Equ ities
One-year forward EV/EBITDA band P/E movement
Source: NSE, CRISIL Equ ities Source: NSE, CRISIL Equ ities
CRISIL IER reports released on Sagar Cements Ltd
Date Nature of report
Fundamental
grade Fair value
Valuation
grade
CMP
(on the date of report)
01-Dec-10 Initiating coverage* 2/5 Rs 202 5/5 Rs 125
25-Feb-11 Q3FY11 result update 2/5 Rs 202 5/5 Rs 135
09-June-11 Q4FY11 result update 2/5 Rs 202 5/5 Rs 137
* For detailed initiating coverage report please visit: www.ier.co.in
CRISIL Independent Equity Research reports are also available on Bloomberg (CRI <go>) and Thomson Reuters.
0
100
200
300
400
500
600
700
Mar
-07
Jul-
07
Oct
-07
Jan-0
8
May
-08
Aug
-08
Nov
-08
Mar
-09
Jun-0
9
Sep-
09
Jan-1
0
Apr-
10
Jul-
10
Nov
-10
Feb
-11
May
-11
(Rs)
Sagar Cements 8x 12x 16x 18x 24x
0
2,000
4,000
6,000
8,000
10,000
May-
06
Aug-
06
Nov-
06
Feb-
07
May-
07
Aug-
07
Nov-
07
Feb-
08
May-
08
Aug-
08
Nov-
08
Feb-
09
May-
09
Aug-
09
Nov-
09
Feb-
10
May-
10
Aug-
10
Nov-
10
Feb-
11
May-
11
(Rs)
Sagar EV Rs.1500/tonne Rs.2000/tonne
Rs.3000/tonne Rs.4000/tonne
0
1,000
2,000
3,000
4,000
5,000
6,000
7,000
8,000
9,000
10,000
Mar
-07
Jul-
07
Oct
-07
Jan-0
8
May
-08
Aug
-08
Nov
-08
Mar
-09
Jun-0
9
Sep-
09
Jan-1
0
Apr-
10
Jul-
10
Nov
-10
Feb
-11
May
-11
(Rs mn)
Sagar Cements 4x 6x 8x 10x
0
10
20
30
40
50
60
70
80
Mar-
07
Jul-
07
Oct
-07
Jan-
08
May-
08
Aug-
08
Nov-
08
Mar-
09
Jun-0
9
Sep-0
9
Jan-
10
Apr
-10
Jul-
10
Nov-
10
Feb
-11
May-
11
(x)
1yr Fwd PE (x) Median PE
+1 std dev
-1 std dev

© CRISIL Limited. All Rights Reserved. CRISIL EQUITIES | 5
Sagar Cements Ltd
FINANCIALS
#FY11 numbers based on the abridged financials
Source: Company, CRISIL Equ it ies est imate
Income statement
(Rs mn) FY09 FY10 FY11# FY12E FY13E (Rs mn) FY09 FY10 FY11# FY12E FY13E
Operating income 2,701 4,305 4,978 5,153 6,029 Liabilities
EBITDA 653 905 616 775 894 Equity share capital 150 150 150 174 174
EBITDA margin 24.2% 21.0% 12.4% 15.0% 14.8% Reserves 1,888 2,038 2,098 2,168 2,309
Depreciation 207 287 270 287 292 Minorities - - - - -
EBIT 447 618 346 488 601 Net worth 2,038 2,188 2,248 2,342 2,482
Interest 164 301 306 311 329 Convertible debt 10 10 10 10 10
Operating PBT 283 317 39 178 273 Other debt 2,510 2,296 2,388 2,788 2,688
Other income 4 3 190 3 13 Total debt 2,520 2,306 2,398 2,798 2,698
Exceptional inc/(exp) 6 0 - - - Deferred tax liability (net) 159 271 347 347 347
PBT 293 321 229 180 286 Total liabilities 4,717 4,765 4,993 5,487 5,528
Tax provision 98 119 53 59 94 Assets
Minority interest - - - - - Net fixed assets 3,822 3,782 3,382 3,195 3,003
PAT (Reported) 195 202 176 121 191 Capital WIP 183 103 61 61 61
Less: Exceptionals 6 0 - - - Total fixed assets 4,005 3,885 3,443 3,256 3,064
Adjusted PAT 189 202 176 121 191 Investments 150 381 860 1,360 1,360
Current assets
Ratios Inventory 430 493 558 578 676
FY09 FY10 FY11# FY12E FY13E Sundry debtors 249 418 429 444 519
Growth Loans and advances 468 387 621 643 753
Operating income (%) 20.9 59.4 15.6 3.5 17.0 Cash & bank balance 115 31 27 162 276
EBITDA (%) 1.6 38.5 (31.9) 25.8 15.3 Marketable securities - - - - -
Adj PAT (%) (42.9) 6.7 (12.9) (31.4) 58.4 Total current assets 1,261 1,330 1,635 1,827 2,224
Adj EPS (%) (49.2) 6.7 (12.9) (40.8) 58.4 Total current liabilities 700 831 945 956 1,120
Net current assets 562 499 690 871 1,104
Profitability Intangibles/Misc. expenditure - - - - -
EBITDA margin (%) 24.2 21.0 12.4 15.0 14.8 Total assets 4,717 4,765 4,993 5,487 5,528
Adj PAT Margin (%) 7.0 4.7 3.5 2.3 3.2
RoE (%) 11.8 9.6 7.9 5.3 7.9 Cash flow
RoCE (%) 11.4 13.7 7.6 10.0 11.6 (Rs mn) FY09 FY10 FY11# FY12E FY13E
RoIC (%) 9.6 12.1 17.2 11.8 14.9 Pre-tax profit 287 321 229 180 286
Total tax paid (13) (7) 23 (59) (94)
Valuations Depreciation 207 287 270 287 292
Price-earnings (x) 2.6 10.4 11.9 20.2 12.7 Working capital changes (354) (21) (195) (46) (119)
Price-book (x) 0.2 1.0 0.9 1.0 1.0 Net cash from operations 127 580 327 361 365
EV/EBITDA (x) 4.4 4.8 7.3 6.5 5.4 Cash from investments
EV/Sales (x) 1.1 1.0 0.9 1.0 0.8 Capital expenditure (1,050) (167) 172 (100) (100)
Dividend payout ratio (%) 35.1 27.1 34.1 36.0 22.7 Investments and others (150) (231) (479) (500) -
Dividend yield (%) 14.0 2.6 2.9 1.8 1.8 Net cash from investments (1,200) (398) (307) (600) (100)
Cash from financing
B/S ratios Equity raised/(repaid) 198 - (1,050) 1,074 -
Inventory days 88 66 47 63 61 Debt raised/(repaid) 431 (214) 92 400 (100)
Creditors days 109 81 75 75 75 Dividend (incl. tax) (68) (55) (70) (51) (51)
Debtor days 38 34 25 30 29 Others (incl extraordinaries) 557 3 1,005 (1,050) -
Working capital days 36 39 41 49 47 Net cash from financing 1,117 (265) (24) 373 (151)
Gross asset turnover (x) 0.8 0.9 1.0 1.1 1 Change in cash position 44 (84) (4) 135 114
Net asset turnover (x) 1.1 1.1 1.4 1.6 2 C losing cash 115 31 27 162 276
Sales/operating assets (x) 0.75 1.1 1.36 1.54 1.91
Current ratio (x) 1.8 1.6 1.7 1.9 2.0 Quarterly financials
Debt-equity (x) 123.7 105.4 106.7 119.5 108.7 (Rs mn) Q4FY10 Q1FY11 Q2FY11 Q3FY11 Q4FY11
Net debt/equity (x) 118.0 104.0 105.5 112.6 97.6 Net Sales 1,236 1,304 864 1,126 1,682
Interest coverage 2.7 2.1 1.1 1.6 1.8 Change (q-o-q) 38.0% 5.6% -33.7% 30.3% 49.3%
EBITDA 101 127 (48) 141 396
Per share Change (q-o-q) -28.5% 26.4% -137.8% -392.6% 180.9%
FY09 FY10 FY11# FY12E FY13E EBITDA margin 8.2% 9.8% -5.6% 12.5% 23.5%
Adj EPS (Rs) 12.6 13.5 11.7 6.9 11.0 PAT 3 5 (53) 31 193
CEPS 26.4 32.6 29.7 23.4 27.8 Adj PAT 3 5 (53) 31 193
Book value 135.8 145.9 149.9 134.7 142.8 Change (q-o-q) NM 109.9% -1100% -158.7% 520.8%
Dividend (Rs) 4.6 3.7 4.0 2.5 2.5 Adj PAT margin 0.2% 0.4% -6.1% 2.8% 11.5%
Actual o/s shares (mn) 15.0 15.0 15.0 17.4 17.4 Adj EPS 0.2 0.4 (3.5) 2.1 12.8
Balance Sheet

© CRISIL Limited. All Rights Reserved.
CRISIL Independent Equity Research Team
Mukesh Agarwal Senior Director +91 (22) 3342 3035 [email protected]
Tarun Bhatia Director, Capital Markets +91 (22) 3342 3226 [email protected]
Chetan Majithia Head, Equities +91 (22) 3342 4148 [email protected]
Sudhir Nair Head, Equities +91 (22) 3342 3526 [email protected]
Prasad Koparkar Head, Research +91 (22) 3342 3137 [email protected]
Ajay D'Souza Head, Research +91 (22) 3342 3567 [email protected]
Aparna Joshi Head, Research +91 (22) 3342 3540 [email protected]
Manoj Mohta Head, Research +91 (22) 3342 3554 [email protected]
Sridhar C Head, Research +91 (22) 3342 3546 [email protected] CRISIL’s Equity Offerings The Equity Group at CRISIL Research provides a wide range of services including:
Independent Equity Research IPO Grading White Labelled Research Valuation on companies for use of Institutional Investors, Asset Managers, Corporate
Other Services by the Research group include
CRISINFAC Industry research on over 60 industries and Economic Analysis Customised Research on Market sizing, Demand modelling and Entry strategies Customised research content for Information Memorandum and Offer documents

© CRISIL Limited. All Rights Reserved.
About CRISIL Limited
CRISIL is a global analytical company providing ratings, research, and risk and policy advisory services. We are
India's leading ratings agency. We are also the foremost provider of high-end research to the world's largest banks
and leading corporations.
About CRISIL Research CRISIL Research is the country’s largest independent and integrated research house with strong domain expertise
on Indian economy, industries and capital markets. We leverage our unique research platform and capabilities to
deliver superior perspectives and insights to over 1200 domestic and global clients, through a range of research
reports, analytical tools, subscription products and customised solutions.
Head Office: CRISIL House, Central Avenue, Hiranandani Business Park, Powai, Mumbai - 400 076 Phone : 91-22-3342 3000 Web: www.crisil.com Download reports from: www.ier.co.in
Ashish Sethi – Head, Business Development
Email : [email protected] I Phone : 9920807575
To know more about CRISIL IER, please contact our team members:
Sagar Sawarkar – Senior Manager, Business Development Email : [email protected] I Phone : 9821638322
Regional Contacts:
Vinaya Dongre – Head, Business Development
Email : [email protected] I Phone : 9920225174
Hyderabad Kaliprasad Ponnuru - Manager, Business Development Email : [email protected] I Phone : 9642004668 Kolkata / Delhi Priyanka Agarwal - Manager, Business Development Email : [email protected] I Phone : 9903060685
Ahmedabad / Mumbai / Pune Vishal Shah - Manager, Business Development Email : [email protected] I Phone : 9820598908 Bengaluru / Chennai Anand Krishnamoorthy - Manager, Business Development Email : [email protected] I Phone : 9884704111
Recommended