0
Royal Bank of CanadaInvestor Presentation
Q1/2018
All amounts are in Canadian dollars unless otherwise stated and are based on financial statements prepared in compliance with International
34 Interim Financial Reporting, unless otherwise noted. Our Q1/2018 Report to Shareholders and Q1/2018 Supplementary Financial
Information are available on our website at rbc.com/investorrelations.
1
Caution regarding forward-looking statements
About RBC
From time to time, we make written or oral forward-looking statements within the meaning of certain securities laws, including the “safe harbour” provisions of the United States Private Securities Litigation Reform Act of 1995 and any applicable Canadian securities legislation. We may make forward-looking statements in this presentation, in other filings with Canadian regulators or the SEC, in reports to shareholders and in other communications. Forward-looking statements in this presentation include, but are not limited to, statements relating to our financial performance objectives, vision and strategic goals, the economic and market review and outlook for Canadian, U.S., European and global economies, the regulatory environment in which we operate, the outlook and priorities for each of our business segments, the risk environment including our liquidity and funding risk. The forward-looking information contained in this document is presented for the purpose of assisting the holders of our securities and financial analysts in understanding our financial position and results of operations as at and for the periods ended on the dates presented, as well as our financial performance objectives, vision and strategic goals, and may not be appropriate for other purposes. Forward-looking statements are typically identified by words such as “believe”, “expect”, “foresee”, “forecast”, “anticipate”, “intend”, “estimate”, “goal”, “plan” and “project” and similar expressions of future or conditional verbs such as “will”, “may”, “should”, “could” or “would”.
By their very nature, forward-looking statements require us to make assumptions and are subject to inherent risks and uncertainties, which give rise to the possibility that our predictions, forecasts, projections, expectations or conclusions will not prove to be accurate, that our assumptions may not be correct and that our financial performance objectives, vision and strategic goals will not be achieved. We caution readers not to place undue reliance on these statements as a number of risk factors could cause our actual results to differ materially from the expectations expressed in such forward-looking statements. These factors – many of which are beyond our control and the effects of which can be difficult to predict – include: credit, market, liquidity and funding, insurance, operational, regulatory compliance, strategic, reputation, legal and regulatory environment, competitive and systemic risks and other risks discussed in the risk sections of our 2017 Annual Report and the Risk management section of our Q1 2018 Report to Shareholders; including global uncertainty and volatility, elevated Canadian housing prices and household indebtedness, information technology and cyber risk including the risk of cyber-attacks or other information security events at or impacting our service providers or other third parties with whom we interact, regulatory change, technological innovation and non-traditional competitors, global environmental policy and climate change, changes in consumer behavior, the end of quantitative easing, the business and economic conditions in the geographic regions in which we operate, the effects of changes in government fiscal, monetary and other policies, tax risk and transparency and environmental and social risk.
We caution that the foregoing list of risk factors is not exhaustive and other factors could also adversely affect our results. When relying on our forward-looking statements to make decisions with respect to us, investors and others should carefully consider the foregoing factors and other uncertainties and potential events. Material economic assumptions underlying the forward-looking statements contained in this presentation are set out in the Economic, market and regulatory review and outlook section and for each business segment under the Strategic priorities and Outlook headings in our 2017 Annual Report, as updated by the Economic, market and regulatory review and outlook section of our Q1 2018 Report to Shareholders. Except as required by law, we do not undertake to update any forward-looking statement, whether written or oral, that may be made from time to time by us or on our behalf.
Additional information about these and other factors can be found in the risk sections of our 2017 Annual Report and in the Risk management section of our Q1 2018 Report to Shareholders.
Information contained in or otherwise accessible through the websites mentioned does not form part of this presentation. All references in this presentation to websites are inactive textual references and are for your information only.
2
About RBC
3
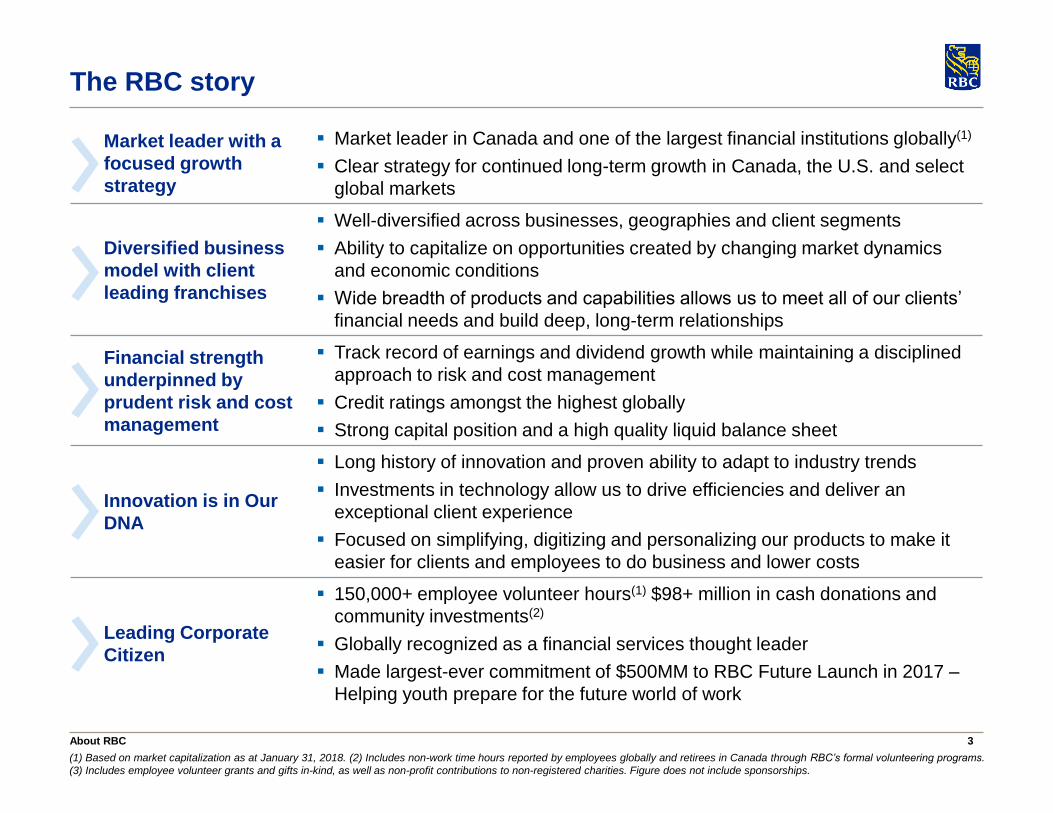
Market leader with a
focused growth
strategy
Market leader in Canada and one of the largest financial institutions globally(1)
Clear strategy for continued long-term growth in Canada, the U.S. and select
global markets
Diversified business
model with client
leading franchises
Well-diversified across businesses, geographies and client segments
Ability to capitalize on opportunities created by changing market dynamics
and economic conditions
Wide breadth of products and capabilities allows us to meet all of our clients’
financial needs and build deep, long-term relationships
Financial strength
underpinned by
prudent risk and cost
management
Track record of earnings and dividend growth while maintaining a disciplined
approach to risk and cost management
Credit ratings amongst the highest globally
Strong capital position and a high quality liquid balance sheet
Innovation is in Our
DNA
Long history of innovation and proven ability to adapt to industry trends
Investments in technology allow us to drive efficiencies and deliver an
exceptional client experience
Focused on simplifying, digitizing and personalizing our products to make it
easier for clients and employees to do business and lower costs
Leading Corporate
Citizen
150,000+ employee volunteer hours(1) $98+ million in cash donations and
community investments(2)
Globally recognized as a financial services thought leader
Made largest-ever commitment of $500MM to RBC Future Launch in 2017 –
Helping youth prepare for the future world of work
About RBC
(1) Based on market capitalization as at January 31, 2018. (2) Includes non-work time hours reported by employees globally and retirees in Canada through RBC’s formal volunteering programs.
(3) Includes employee volunteer grants and gifts in-kind, as well as non-profit contributions to non-registered charities. Figure does not include sponsorships.
The RBC story
4
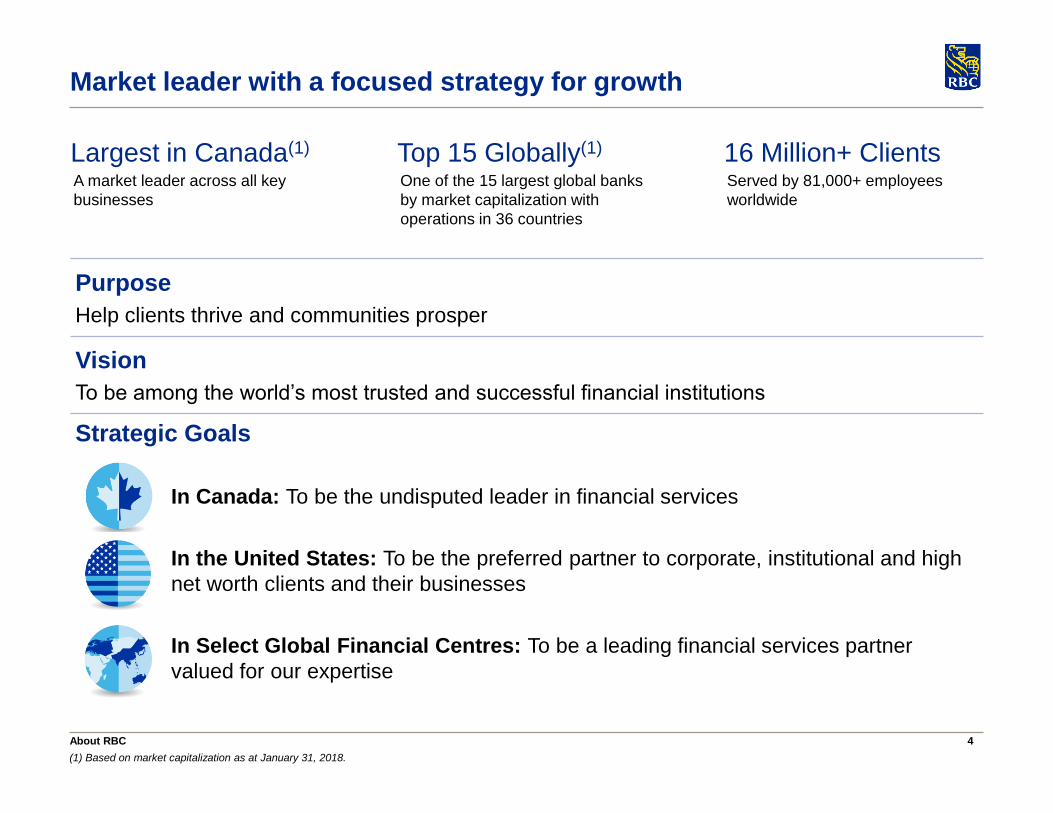
Market leader with a focused strategy for growth
About RBC
(1) Based on market capitalization as at January 31, 2018.
Top 15 Globally(1)
One of the 15 largest global banks
by market capitalization with
operations in 36 countries
16 Million+ ClientsServed by 81,000+ employees
worldwide
Purpose
Help clients thrive and communities prosper
Vision
To be among the world’s most trusted and successful financial institutions
Strategic Goals
In Canada: To be the undisputed leader in financial services
In the United States: To be the preferred partner to corporate, institutional and high
net worth clients and their businesses
In Select Global Financial Centres: To be a leading financial services partner
valued for our expertise
Largest in Canada(1)
A market leader across all key
businesses
5
Diversified business model with client leading franchises
About RBC
(1) Amounts exclude Corporate Support. These are non-GAAP measures. For more information, refer to the Business segment results and results by geographic segment sections of our
Q1/2018 Report to Shareholders.
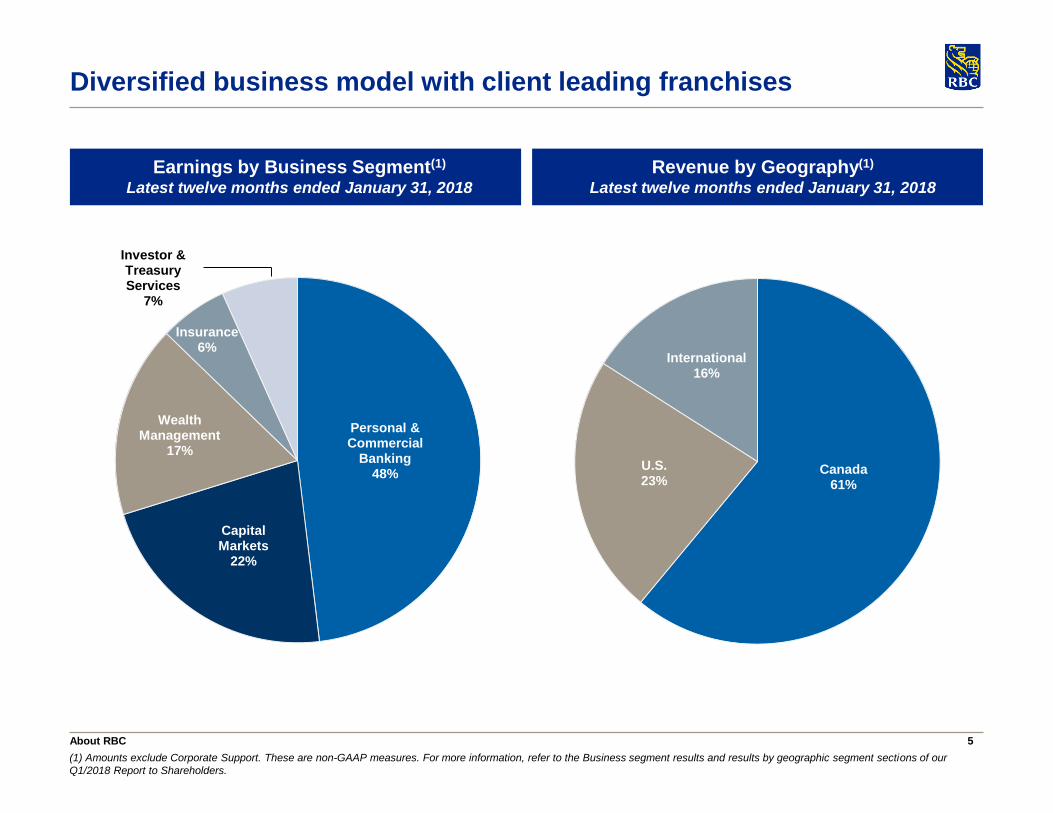
Earnings by Business Segment(1)
Latest twelve months ended January 31, 2018
Revenue by Geography(1)
Latest twelve months ended January 31, 2018
Personal &
Commercial
Banking
Capital
Markets
U.S.
Canada
Personal & Commercial
Banking48%
Capital Markets
22%
Wealth Management
17%
Insurance6%
Investor & Treasury Services
7%
Canada61%
U.S.23%
International16%
6
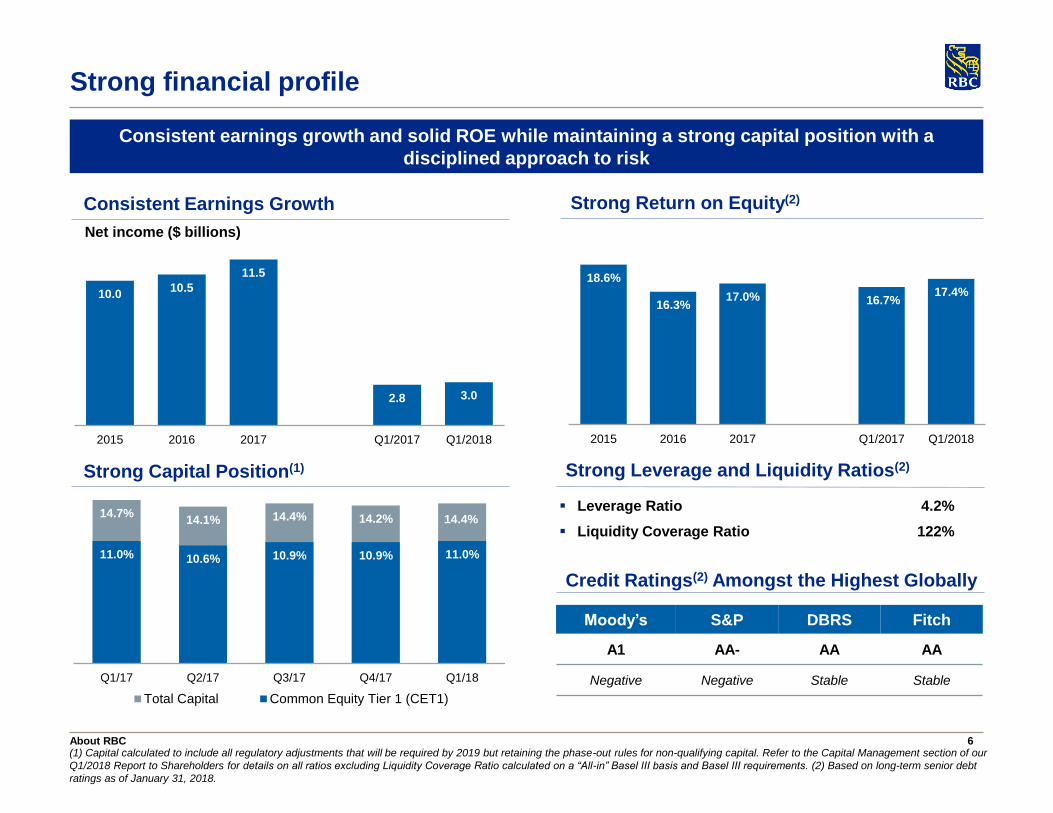
18.6%
16.3%17.0% 16.7%
17.4%
2015 2016 2017 Q1/2017 Q1/2018
10.010.5
11.5
2.8 3.0
2015 2016 2017 Q1/2017 Q1/2018
Consistent Earnings Growth
Strong financial profile
Leverage Ratio
Liquidity Coverage Ratio
4.2%
122%
Moody’s S&P DBRS Fitch
A1 AA- AA AA
Negative Negative Stable Stable
Strong Capital Position(1)
Strong Return on Equity(2)
Strong Leverage and Liquidity Ratios(2)
Credit Ratings(2) Amongst the Highest Globally
Consistent earnings growth and solid ROE while maintaining a strong capital position with a
disciplined approach to risk
About RBC
Net income ($ billions)
14.7%14.1% 14.4% 14.2% 14.4%
11.0% 10.6% 10.9% 10.9% 11.0%
Q1/17 Q2/17 Q3/17 Q4/17 Q1/18
Total Capital Common Equity Tier 1 (CET1)
(1) Capital calculated to include all regulatory adjustments that will be required by 2019 but retaining the phase-out rules for non-qualifying capital. Refer to the Capital Management section of our
Q1/2018 Report to Shareholders for details on all ratios excluding Liquidity Coverage Ratio calculated on a “All-in” Basel III basis and Basel III requirements. (2) Based on long-term senior debt
ratings as of January 31, 2018.
(1)
7
3132
24
27
2223 23
17
23
10
15
20
25
30
35
40
45
Q1/2016 Q2/2016 Q3/2016 Q4/2016 Q1/2017 Q2/2017 Q3/2017 Q4/2017 Q1/2018
Breakdown by Region of Total Loans and Acceptances(1)
Loan Book Diversified by Portfolio(1) PCL Ratio on Impaired Financial Assets(2) (bps)
A disciplined approach and diversification have driven stable credit trends
Residential Mortgages
49%
Personal Loans16%
Wholesale31%
Credit Cards3%
Small Business
1%
Breakdown of Canadian Total Loans and Acceptances(1)
6%
Prudent risk management
About RBC
(1) Loans and acceptances outstanding as at January 31, 2018. Does not include letters of credit or guarantees. (2) Effective November 1, 2017, we adopted IFRS 9, which introduced a three-
stage expected credit loss impairment model that differs significantly from the incurred loss model under IAS 39. Stage 3 allowances are held against impaired loans and effectively replace the
allowance for impaired loans under IAS 39 . Provision for Credit Losses (PCL) ratio is PCL as a percentage of average loans & acceptances (annualized).
Canada82%
Other International
5%
U.S.13%
Ontario44%
B.C. and Territories
17%
Alberta15%
Quebec12%
Manitoba/Sask.
7%
Atlantic5%
Historic Range:
30-35 bps
PCL ratio on
impaired loans
8
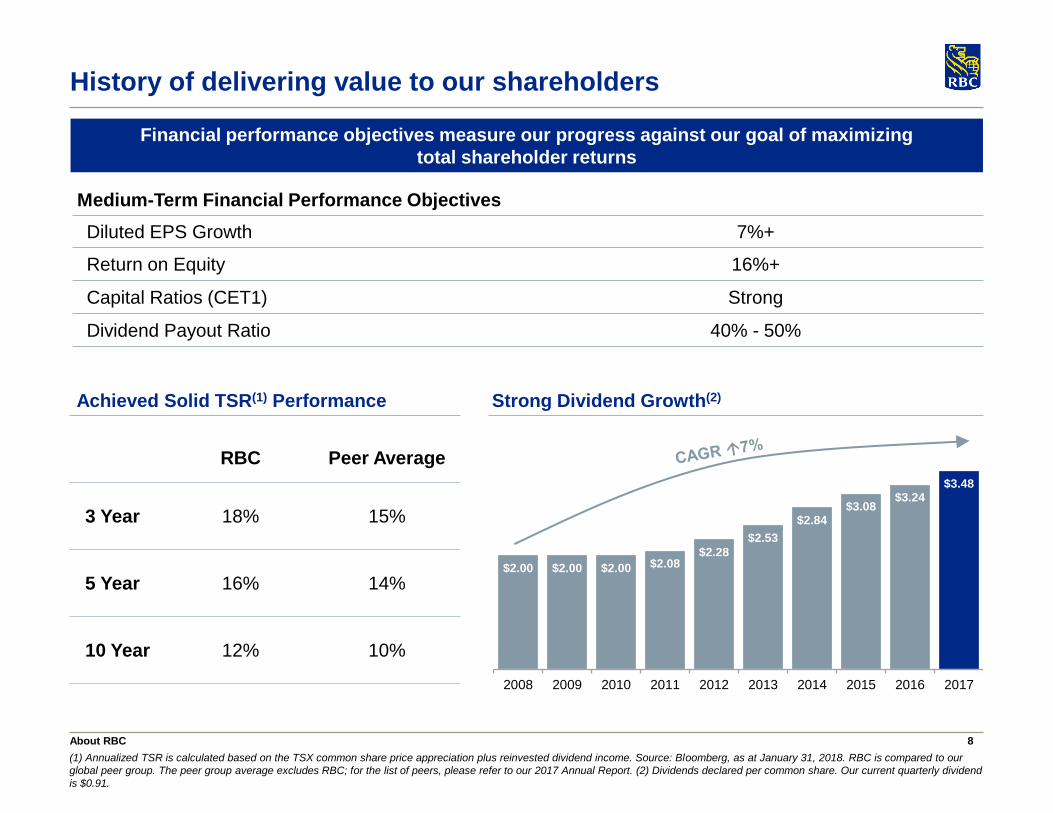
History of delivering value to our shareholders
About RBC
(1) Annualized TSR is calculated based on the TSX common share price appreciation plus reinvested dividend income. Source: Bloomberg, as at January 31, 2018. RBC is compared to our
global peer group. The peer group average excludes RBC; for the list of peers, please refer to our 2017 Annual Report. (2) Dividends declared per common share. Our current quarterly dividend
is $0.91.
$2.00 $2.00 $2.00 $2.08 $2.28
$2.53
$2.84 $3.08
$3.24 $3.48
2008 2009 2010 2011 2012 2013 2014 2015 2016 2017
Financial performance objectives measure our progress against our goal of maximizing
total shareholder returns
Achieved Solid TSR(1) Performance Strong Dividend Growth(2)
Medium-Term Financial Performance Objectives
Diluted EPS Growth 7%+
Return on Equity 16%+
Capital Ratios (CET1) Strong
Dividend Payout Ratio 40% - 50%
RBC Peer Average
3 Year 18% 15%
5 Year 16% 14%
10 Year 12% 10%

9
Business Segments
10
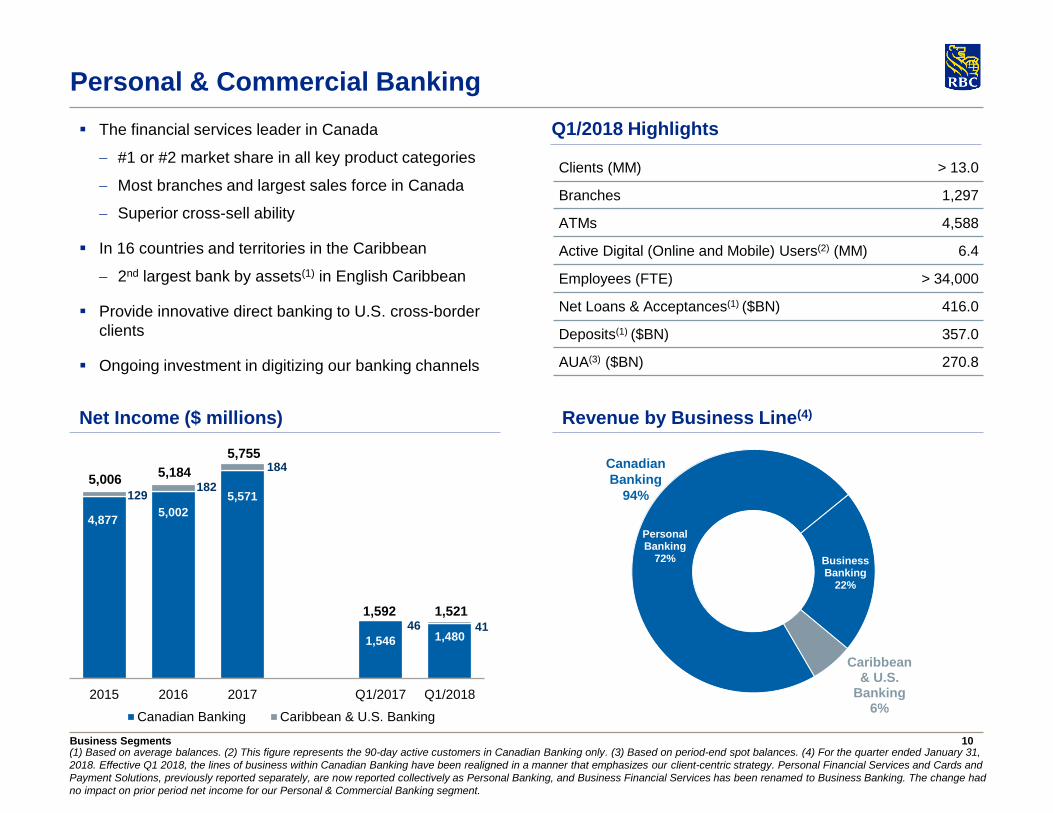
4,8775,002
5,571
1,546 1,480
129182
184
46 41
2015 2016 2017 Q1/2017 Q1/2018
Canadian Banking Caribbean & U.S. Banking
Business Segments(1) Based on average balances. (2) This figure represents the 90-day active customers in Canadian Banking only. (3) Based on period-end spot balances. (4) For the quarter ended January 31,
2018. Effective Q1 2018, the lines of business within Canadian Banking have been realigned in a manner that emphasizes our client-centric strategy. Personal Financial Services and Cards and
Payment Solutions, previously reported separately, are now reported collectively as Personal Banking, and Business Financial Services has been renamed to Business Banking. The change had
no impact on prior period net income for our Personal & Commercial Banking segment.
Personal & Commercial Banking
Net Income ($ millions)
Personal Banking
72% Business Banking
22%
Caribbean & U.S.
Banking6%
Canadian
Banking
94%
Revenue by Business Line(4)
Q1/2018 Highlights
Clients (MM) > 13.0
Branches 1,297
ATMs 4,588
Active Digital (Online and Mobile) Users(2) (MM) 6.4
Employees (FTE) > 34,000
Net Loans & Acceptances(1) ($BN) 416.0
Deposits(1) ($BN) 357.0
AUA(3) ($BN) 270.8
The financial services leader in Canada
#1 or #2 market share in all key product categories
Most branches and largest sales force in Canada
Superior cross-sell ability
In 16 countries and territories in the Caribbean
2nd largest bank by assets(1) in English Caribbean
Provide innovative direct banking to U.S. cross-border
clients
Ongoing investment in digitizing our banking channels
5,006
1,592
5,184
5,755
1,521
11
Recent Awards
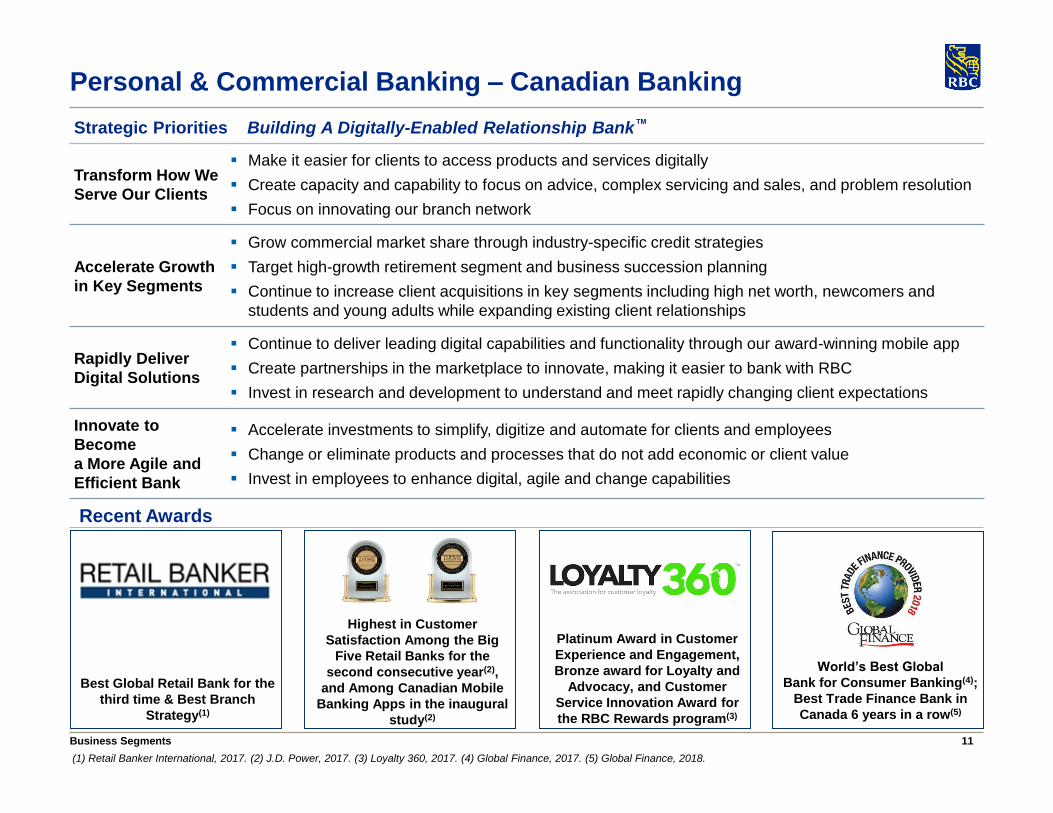
Strategic Priorities Building A Digitally-Enabled Relationship Bank™
Transform How We
Serve Our Clients
Make it easier for clients to access products and services digitally
Create capacity and capability to focus on advice, complex servicing and sales, and problem resolution
Focus on innovating our branch network
Accelerate Growth
in Key Segments
Grow commercial market share through industry-specific credit strategies
Target high-growth retirement segment and business succession planning
Continue to increase client acquisitions in key segments including high net worth, newcomers and
students and young adults while expanding existing client relationships
Rapidly Deliver
Digital Solutions
Continue to deliver leading digital capabilities and functionality through our award-winning mobile app
Create partnerships in the marketplace to innovate, making it easier to bank with RBC
Invest in research and development to understand and meet rapidly changing client expectations
Innovate to
Become
a More Agile and
Efficient Bank
Accelerate investments to simplify, digitize and automate for clients and employees
Change or eliminate products and processes that do not add economic or client value
Invest in employees to enhance digital, agile and change capabilities
Personal & Commercial Banking – Canadian Banking
(1) Retail Banker International, 2017. (2) J.D. Power, 2017. (3) Loyalty 360, 2017. (4) Global Finance, 2017. (5) Global Finance, 2018.
Business Segments
Best Global Retail Bank for the
third time & Best Branch
Strategy(1)
Highest in Customer
Satisfaction Among the Big
Five Retail Banks for the
second consecutive year(2),
and Among Canadian Mobile
Banking Apps in the inaugural
study(2)
World’s Best Global
Bank for Consumer Banking(4);
Best Trade Finance Bank in
Canada 6 years in a row(5)
Platinum Award in Customer
Experience and Engagement,
Bronze award for Loyalty and
Advocacy, and Customer
Service Innovation Award for
the RBC Rewards program(3)
12Business Segments
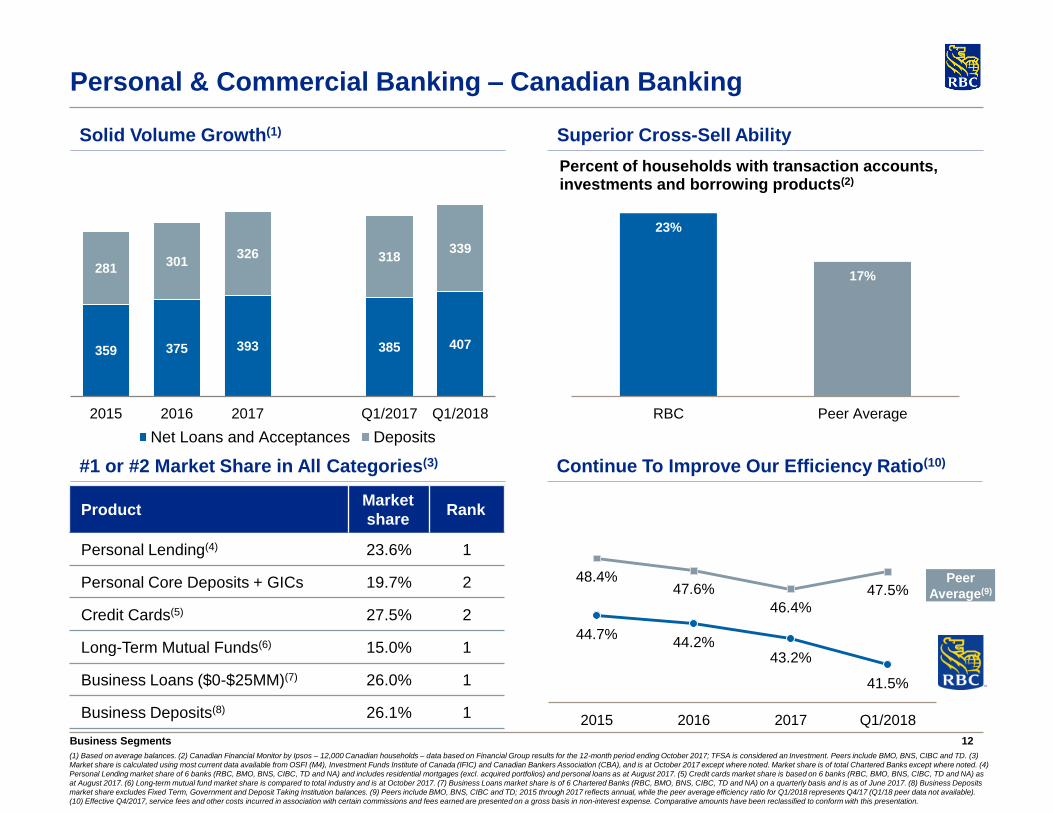
(1) Based on average balances. (2) Canadian Financial Monitor by Ipsos – 12,000 Canadian households – data based on Financial Group results for the 12-month period ending October 2017; TFSA is considered an Investment. Peers include BMO, BNS, CIBC and TD. (3)
Market share is calculated using most current data available from OSFI (M4), Investment Funds Institute of Canada (IFIC) and Canadian Bankers Association (CBA), and is at October 2017 except where noted. Market share is of total Chartered Banks except where noted. (4)
Personal Lending market share of 6 banks (RBC, BMO, BNS, CIBC, TD and NA) and includes residential mortgages (excl. acquired portfolios) and personal loans as at August 2017. (5) Credit cards market share is based on 6 banks (RBC, BMO, BNS, CIBC, TD and NA) as
at August 2017. (6) Long-term mutual fund market share is compared to total industry and is at October 2017. (7) Business Loans market share is of 6 Chartered Banks (RBC, BMO, BNS, CIBC, TD and NA) on a quarterly basis and is as of June 2017. (8) Business Deposits
market share excludes Fixed Term, Government and Deposit Taking Institution balances. (9) Peers include BMO, BNS, CIBC and TD; 2015 through 2017 reflects annual, while the peer average efficiency ratio for Q1/2018 represents Q4/17 (Q1/18 peer data not available).
(10) Effective Q4/2017, service fees and other costs incurred in association with certain commissions and fees earned are presented on a gross basis in non-interest expense. Comparative amounts have been reclassified to conform with this presentation.
Personal & Commercial Banking – Canadian Banking
23%
17%
RBC Peer Average
Percent of households with transaction accounts, investments and borrowing products(2)
#1 or #2 Market Share in All Categories(3) Continue To Improve Our Efficiency Ratio(10)
Solid Volume Growth(1) Superior Cross-Sell Ability
ProductMarket
shareRank
Personal Lending(4) 23.6% 1
Personal Core Deposits + GICs 19.7% 2
Credit Cards(5) 27.5% 2
Long-Term Mutual Funds(6) 15.0% 1
Business Loans ($0-$25MM)(7) 26.0% 1
Business Deposits(8) 26.1% 1
Peer
Average(9)
48.4%47.6%
46.4%
47.5%
44.7%44.2%
43.2%
41.5%
2015 2016 2017 Q1/2018
359 375 393 385 407
281301
326 318339
2015 2016 2017 Q1/2017 Q1/2018
Net Loans and Acceptances Deposits
13
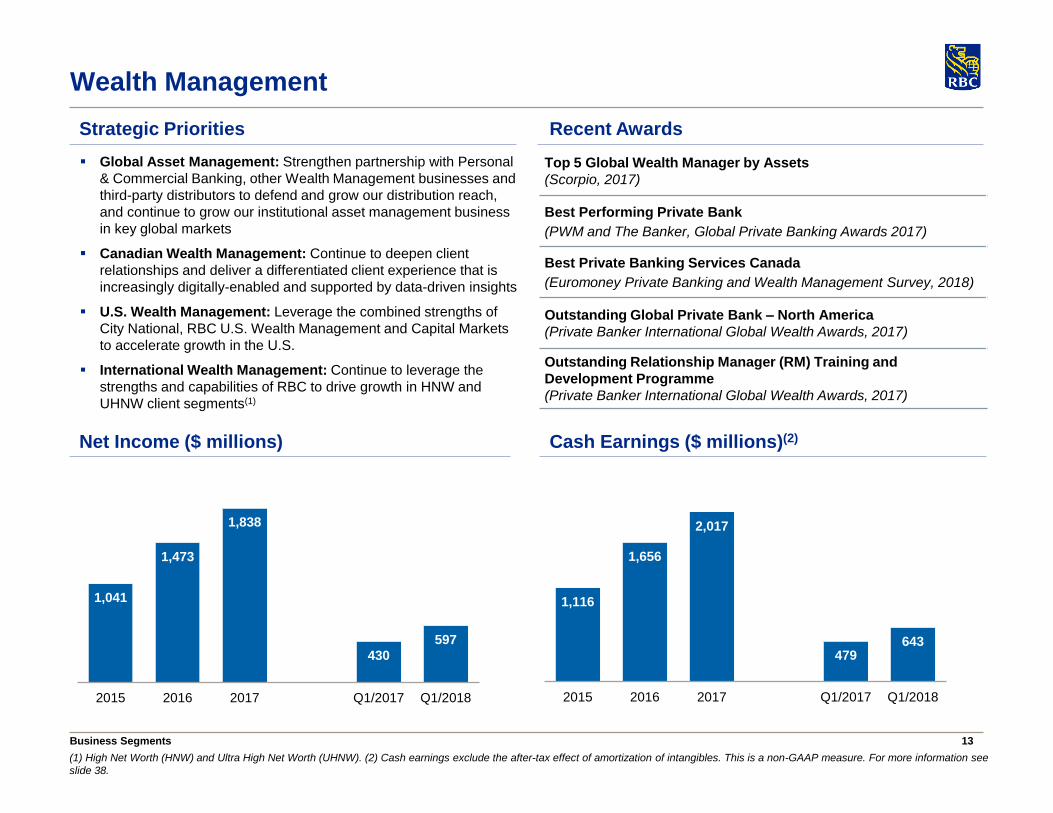
Top 5 Global Wealth Manager by Assets
(Scorpio, 2017)
Best Performing Private Bank
(PWM and The Banker, Global Private Banking Awards 2017)
Best Private Banking Services Canada
(Euromoney Private Banking and Wealth Management Survey, 2018)
Outstanding Global Private Bank – North America
(Private Banker International Global Wealth Awards, 2017)
Outstanding Relationship Manager (RM) Training and
Development Programme
(Private Banker International Global Wealth Awards, 2017)
Business Segments
(1) High Net Worth (HNW) and Ultra High Net Worth (UHNW). (2) Cash earnings exclude the after-tax effect of amortization of intangibles. This is a non-GAAP measure. For more information see
slide 38.
Wealth Management
Net Income ($ millions) Cash Earnings ($ millions)(2)
Global Asset Management: Strengthen partnership with Personal
& Commercial Banking, other Wealth Management businesses and
third-party distributors to defend and grow our distribution reach,
and continue to grow our institutional asset management business
in key global markets
Canadian Wealth Management: Continue to deepen client
relationships and deliver a differentiated client experience that is
increasingly digitally-enabled and supported by data-driven insights
U.S. Wealth Management: Leverage the combined strengths of
City National, RBC U.S. Wealth Management and Capital Markets
to accelerate growth in the U.S.
International Wealth Management: Continue to leverage the
strengths and capabilities of RBC to drive growth in HNW and
UHNW client segments(1)
Strategic Priorities Recent Awards
1,041
1,473
1,838
430
597
2015 2016 2017 Q1/2017 Q1/2018
1,116
1,656
2,017
479643
2015 2016 2017 Q1/2017 Q1/2018
14Business Segments
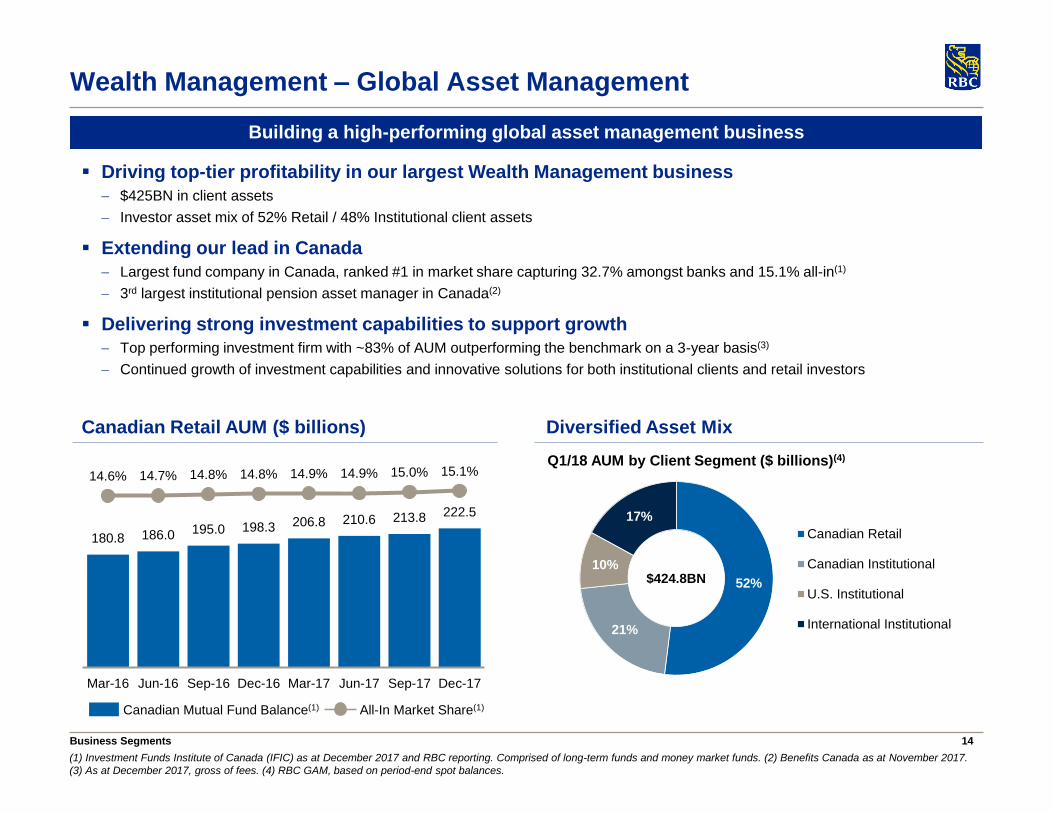
(1) Investment Funds Institute of Canada (IFIC) as at December 2017 and RBC reporting. Comprised of long-term funds and money market funds. (2) Benefits Canada as at November 2017.
(3) As at December 2017, gross of fees. (4) RBC GAM, based on period-end spot balances.
Wealth Management – Global Asset Management
Driving top-tier profitability in our largest Wealth Management business
$425BN in client assets
Investor asset mix of 52% Retail / 48% Institutional client assets
Extending our lead in Canada
Largest fund company in Canada, ranked #1 in market share capturing 32.7% amongst banks and 15.1% all-in(1)
3rd largest institutional pension asset manager in Canada(2)
Delivering strong investment capabilities to support growth
Top performing investment firm with ~83% of AUM outperforming the benchmark on a 3-year basis(3)
Continued growth of investment capabilities and innovative solutions for both institutional clients and retail investors
Building a high-performing global asset management business
Diversified Asset Mix
Q1/18 AUM by Client Segment ($ billions)(4)
Canadian Retail AUM ($ billions)
52%
21%
10%
17%
Canadian Retail
Canadian Institutional
U.S. Institutional
International Institutional
$424.8BN
180.8 186.0 195.0 198.3 206.8 210.6 213.8 222.5
14.6% 14.7% 14.8% 14.8% 14.9% 14.9% 15.0% 15.1%
0.0%
3.0%
6.0%
9.0%
12.0%
15.0%
0
20
40
60
80
100
120
140
160
180
200
220
240
260
280
300
Mar-16 Jun-16 Sep-16 Dec-16 Mar-17 Jun-17 Sep-17 Dec-17
Canadian Mutual Fund Balance(1) All-In Market Share(1)
15Business Segments
(1) High Net Worth (HNW) and Ultra High Net Worth (UHNW). (2) Investor Economics report on RBC’s full wealth and investment offering in Canada, October 2017. (3) Investor Economics report,
October 2017. (4) Source: Quarterly earnings release (10-Q) from peer firms.
Wealth Management
Canadian Wealth Management
U.S. Wealth Management (including City National)
U.S. Wealth Management
7th largest full-service brokerage in the U.S. among peers as measured by number of financial advisors and 6th largest among peers by
assets under administration(4)
Enhancing the client-advisor experience through a digitally-enabled, goals-based planning approach and strengthening the range of
advisory solutions and product offerings
Continuing to attract and onboard new advisors and clearing relationships while improving advisory productivity and operational efficiency
City National
A premier U.S. private and commercial bank that creates a platform for long-term growth in the U.S.
Operates with a high touch, branch light client service model in selected high growth markets including Los Angeles, the San Francisco
Bay area, Orange County, San Diego and New York
Expanding the CNB business model to selected high growth markets
International Wealth Management
Enhancing advisor and product capabilities to accelerate organic client acquisition
Continuing to focus on high-priority client segments across HNW and UHNW(1), especially in select target markets where we have scale
Leveraging RBC’s global capabilities to bring the best of RBC to our clients (e.g., RBC innovation labs)
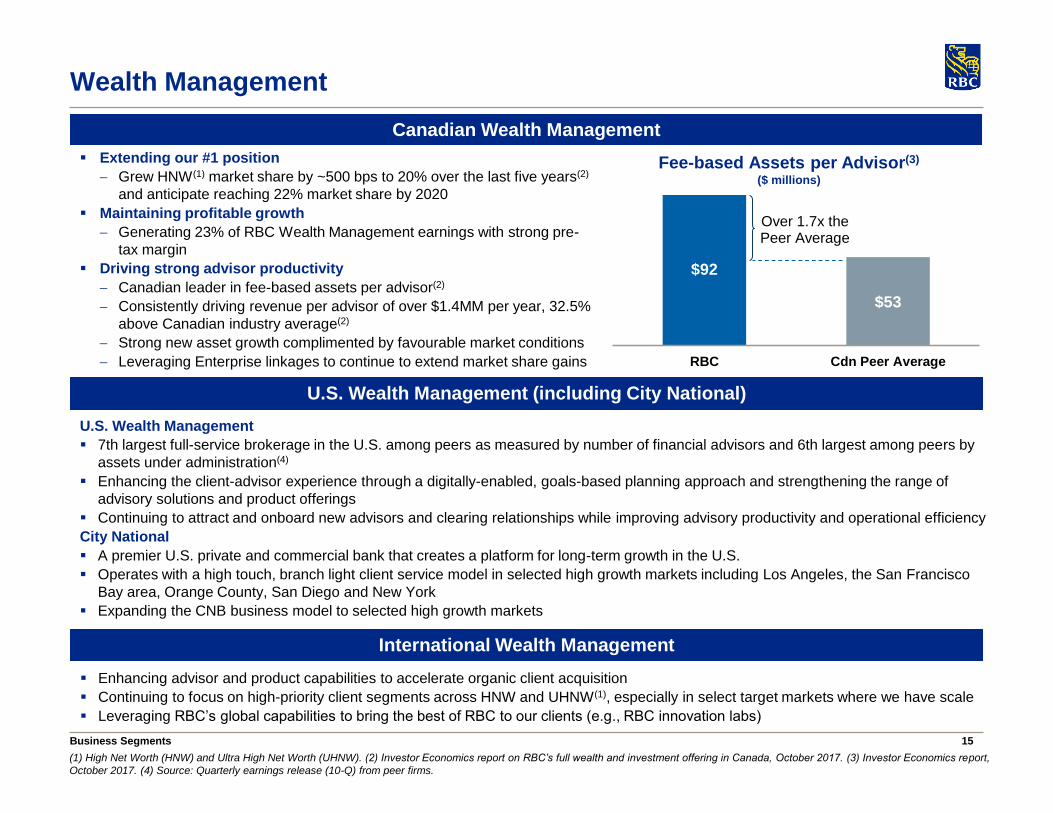
$92
$53
RBC Cdn Peer Average
Over 1.7x the Peer Average
Extending our #1 position
Grew HNW(1) market share by ~500 bps to 20% over the last five years(2)
and anticipate reaching 22% market share by 2020
Maintaining profitable growth
Generating 23% of RBC Wealth Management earnings with strong pre-
tax margin
Driving strong advisor productivity
Canadian leader in fee-based assets per advisor(2)
Consistently driving revenue per advisor of over $1.4MM per year, 32.5%
above Canadian industry average(2)
Strong new asset growth complimented by favourable market conditions
Leveraging Enterprise linkages to continue to extend market share gains
Fee-based Assets per Advisor(3)
($ millions)
16
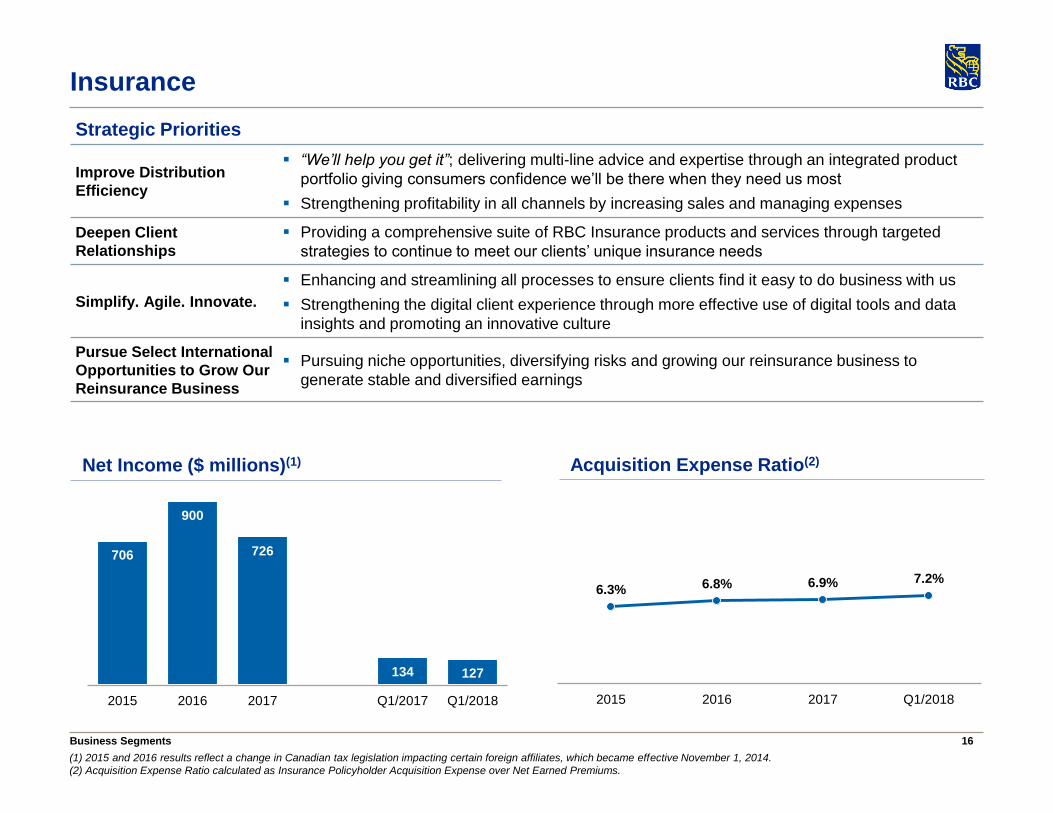
Net Income ($ millions)(1) Acquisition Expense Ratio(2)
Business Segments
(1) 2015 and 2016 results reflect a change in Canadian tax legislation impacting certain foreign affiliates, which became effective November 1, 2014.
(2) Acquisition Expense Ratio calculated as Insurance Policyholder Acquisition Expense over Net Earned Premiums.
Insurance
Strategic Priorities
Improve Distribution
Efficiency
“We’ll help you get it”; delivering multi-line advice and expertise through an integrated product
portfolio giving consumers confidence we’ll be there when they need us most
Strengthening profitability in all channels by increasing sales and managing expenses
Deepen Client
Relationships
Providing a comprehensive suite of RBC Insurance products and services through targeted
strategies to continue to meet our clients’ unique insurance needs
Simplify. Agile. Innovate.
Enhancing and streamlining all processes to ensure clients find it easy to do business with us
Strengthening the digital client experience through more effective use of digital tools and data
insights and promoting an innovative culture
Pursue Select International
Opportunities to Grow Our
Reinsurance Business
Pursuing niche opportunities, diversifying risks and growing our reinsurance business to
generate stable and diversified earnings
(2)
900
6.3% 6.8% 6.9% 7.2%
2015 2016 2017 Q1/2018
706
900
726
134 127
2015 2016 2017 Q1/2017 Q1/2018
17Business Segments
(1) Global Investor/ISF Global Custody Survey, 2017. (2) Global Custodian Agent Banks in Major Markets Survey, 2017. (3) R&M Fund Accounting and Administration Survey, 2017. (4) Global
Finance, 2017.
Investor & Treasury Services
Net Income ($ millions) Efficiency Ratio
31
28(6)
28
Strategic Priorities
(4)
556
613
741
214 219
2015 2016 2017 Q1/2017 Q1/2018(6)
64% 64%
60%
58%
2015 2016 2017 Q1/2018
Specialist provider of asset services, custody, payments
and treasury services for financial and other institutional
investors worldwide
Rated by clients as the #1 Global Custodian for the
seventh consecutive year(1)
Named #1 Canadian Sub-Custodian for the second
consecutive year(2)
Ranked the #1 Fund Administrator overall for the fifth
consecutive year(3)
Named Best Trade Finance Bank in Canada for the sixth
consecutive year(4)
Canadian leader in cash management, correspondent
banking and trade finance for financial institutions
Short-term funding and liquidity management for RBC
In Canada, maintain position as the #1 provider of domestic
custody, asset services and cash management
Compete as a leading provider of asset services in the major
offshore fund domicile markets of Luxembourg and Ireland
Continue to deliver a high-level of investment in client-
focused technology solutions
Enhance our client centric service offering and improve
efficiency
18Business Segments
Capital Markets
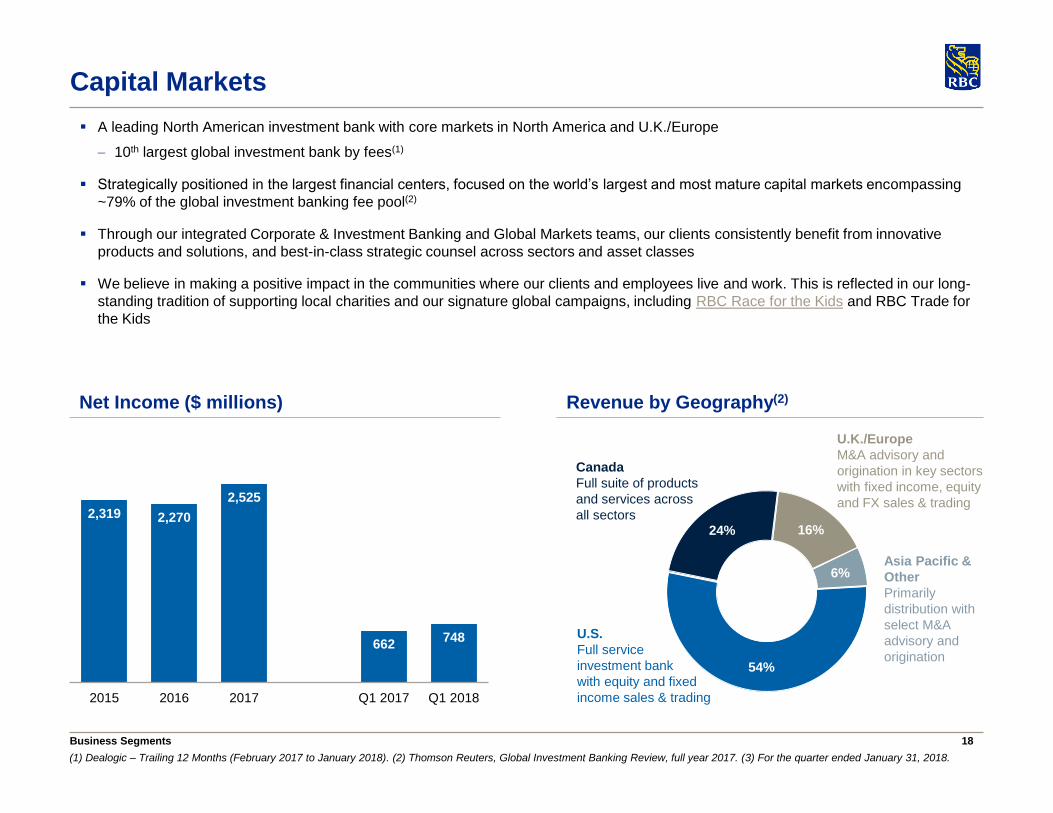
Net Income ($ millions) Revenue by Geography(2)
U.S.
Full service
investment bank
with equity and fixed
income sales & trading
Canada
Full suite of products
and services across
all sectors
U.K./Europe
M&A advisory and
origination in key sectors
with fixed income, equity
and FX sales & trading
Asia Pacific &
Other
Primarily
distribution with
select M&A
advisory and
origination
2,319 2,270
2,525
662748
2015 2016 2017 Q1 2017 Q1 2018
54%
24% 16%
6%
A leading North American investment bank with core markets in North America and U.K./Europe
10th largest global investment bank by fees(1)
Strategically positioned in the largest financial centers, focused on the world’s largest and most mature capital markets encompassing
~79% of the global investment banking fee pool(2)
Through our integrated Corporate & Investment Banking and Global Markets teams, our clients consistently benefit from innovative
products and solutions, and best-in-class strategic counsel across sectors and asset classes
We believe in making a positive impact in the communities where our clients and employees live and work. This is reflected in our long-
standing tradition of supporting local charities and our signature global campaigns, including RBC Race for the Kids and RBC Trade for
the Kids
(1) Dealogic – Trailing 12 Months (February 2017 to January 2018). (2) Thomson Reuters, Global Investment Banking Review, full year 2017. (3) For the quarter ended January 31, 2018.
19Business Segments
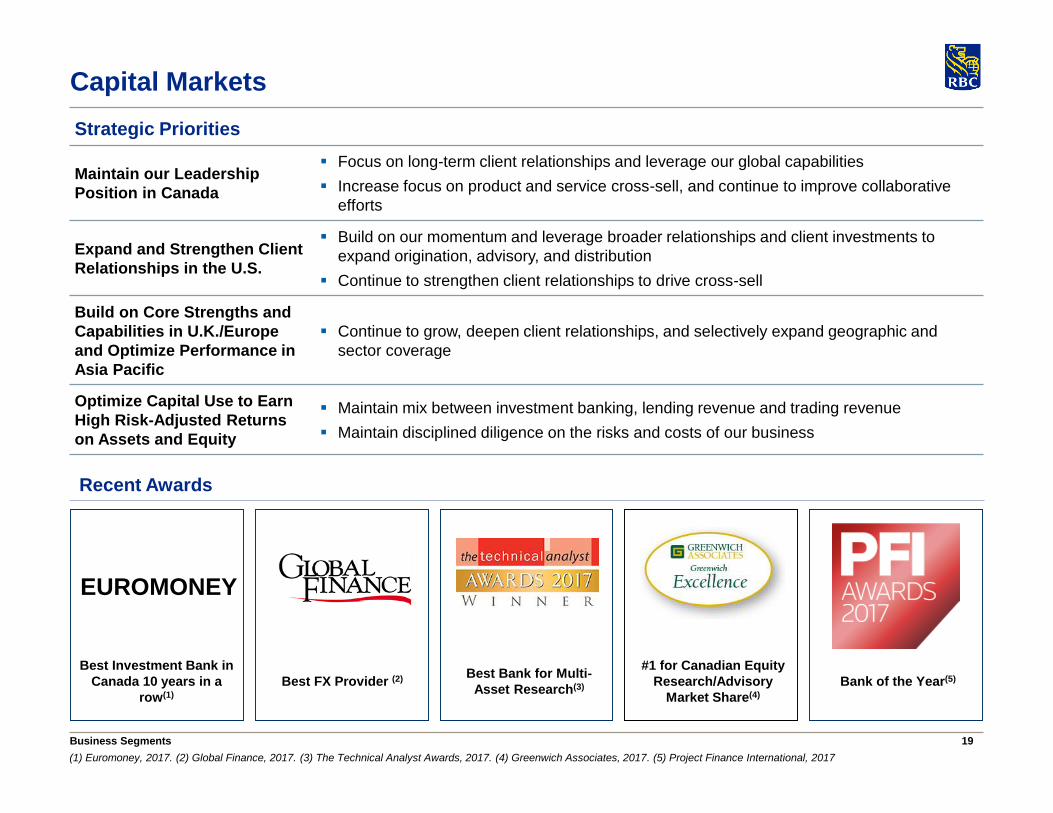
(1) Euromoney, 2017. (2) Global Finance, 2017. (3) The Technical Analyst Awards, 2017. (4) Greenwich Associates, 2017. (5) Project Finance International, 2017
Capital Markets
Strategic Priorities
Maintain our Leadership
Position in Canada
Focus on long-term client relationships and leverage our global capabilities
Increase focus on product and service cross-sell, and continue to improve collaborative
efforts
Expand and Strengthen Client
Relationships in the U.S.
Build on our momentum and leverage broader relationships and client investments to
expand origination, advisory, and distribution
Continue to strengthen client relationships to drive cross-sell
Build on Core Strengths and
Capabilities in U.K./Europe
and Optimize Performance in
Asia Pacific
Continue to grow, deepen client relationships, and selectively expand geographic and
sector coverage
Optimize Capital Use to Earn
High Risk-Adjusted Returns
on Assets and Equity
Maintain mix between investment banking, lending revenue and trading revenue
Maintain disciplined diligence on the risks and costs of our business
Recent Awards
Best Investment Bank in
Canada 10 years in a
row(1)
Best FX Provider (2)
EUROMONEY
Best Bank for Multi-
Asset Research(3) Bank of the Year(5)
#1 for Canadian Equity
Research/Advisory
Market Share(4)
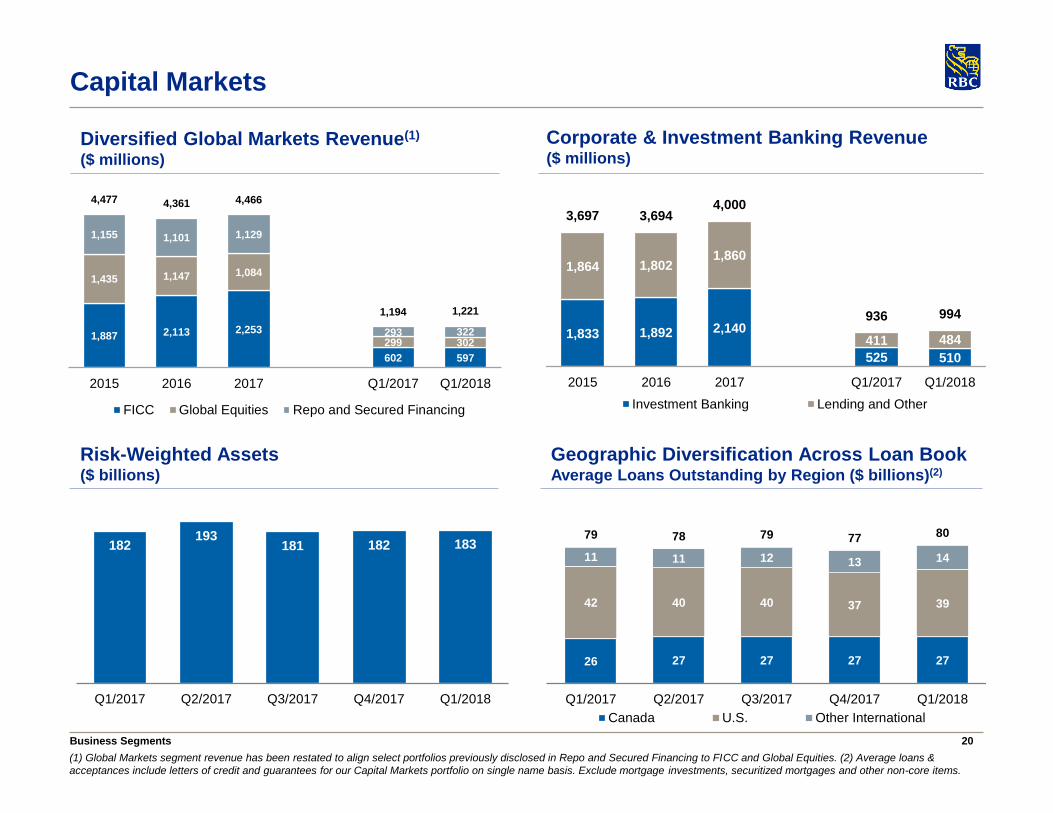
20
1,887 2,113 2,253
602 597
1,435 1,147 1,084
299 302
1,155 1,101 1,129
293 322
4,477 4,361 4,466
1,194 1,221
2015 2016 2017 Q1/2017 Q1/2018
FICC Global Equities Repo and Secured Financing
Business Segments
(1) Global Markets segment revenue has been restated to align select portfolios previously disclosed in Repo and Secured Financing to FICC and Global Equities. (2) Average loans &
acceptances include letters of credit and guarantees for our Capital Markets portfolio on single name basis. Exclude mortgage investments, securitized mortgages and other non-core items.
Capital Markets
Geographic Diversification Across Loan BookAverage Loans Outstanding by Region ($ billions)(2)
Corporate & Investment Banking Revenue ($ millions)
Diversified Global Markets Revenue(1)
($ millions)
Risk-Weighted Assets ($ billions)
26 27 27 27 27
42 40 40 37 39
11 11 12 13 14
79 78 79 77 80
Q1/2017 Q2/2017 Q3/2017 Q4/2017 Q1/2018
Canada U.S. Other International
182193
181 182 183
Q1/2017 Q2/2017 Q3/2017 Q4/2017 Q1/2018
1,833 1,892 2,140
525 510
1,864 1,8021,860
411 484
3,697 3,6944,000
936 994
2015 2016 2017 Q1/2017 Q1/2018
Investment Banking Lending and Other
21
Economic Backdrop
22
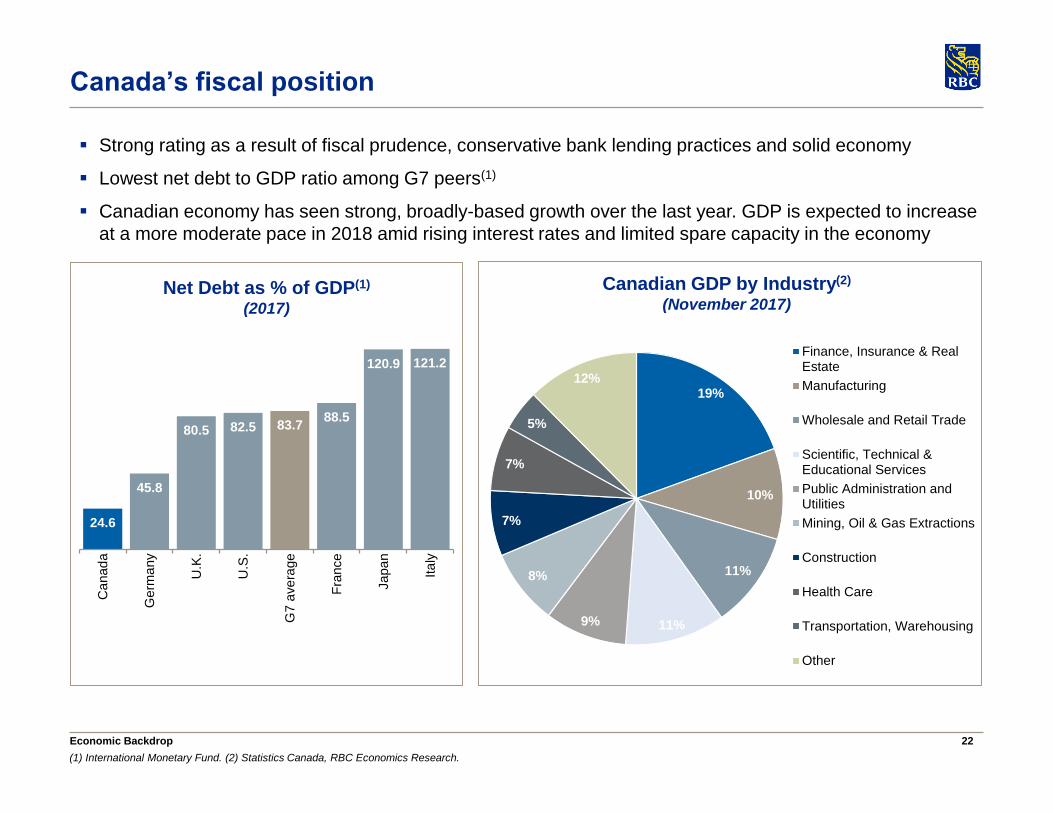
Strong rating as a result of fiscal prudence, conservative bank lending practices and solid economy
Lowest net debt to GDP ratio among G7 peers(1)
Canadian economy has seen strong, broadly-based growth over the last year. GDP is expected to increase
at a more moderate pace in 2018 amid rising interest rates and limited spare capacity in the economy
19%
10%
11%
11%9%
8%
7%
7%
5%
12%
Finance, Insurance & RealEstate
Manufacturing
Wholesale and Retail Trade
Scientific, Technical &Educational Services
Public Administration andUtilities
Mining, Oil & Gas Extractions
Construction
Health Care
Transportation, Warehousing
Other
Canadian GDP by Industry(2)
(November 2017)
24.6
45.8
80.5 82.5 83.788.5
120.9 121.2
Ca
nad
a
Germ
any
U.K
.
U.S
.
G7 a
ve
rage
Fra
nce
Japa
n
Ita
ly
Net Debt as % of GDP(1)
(2017)
Economic Backdrop
(1) International Monetary Fund. (2) Statistics Canada, RBC Economics Research.
Canada’s fiscal position
23
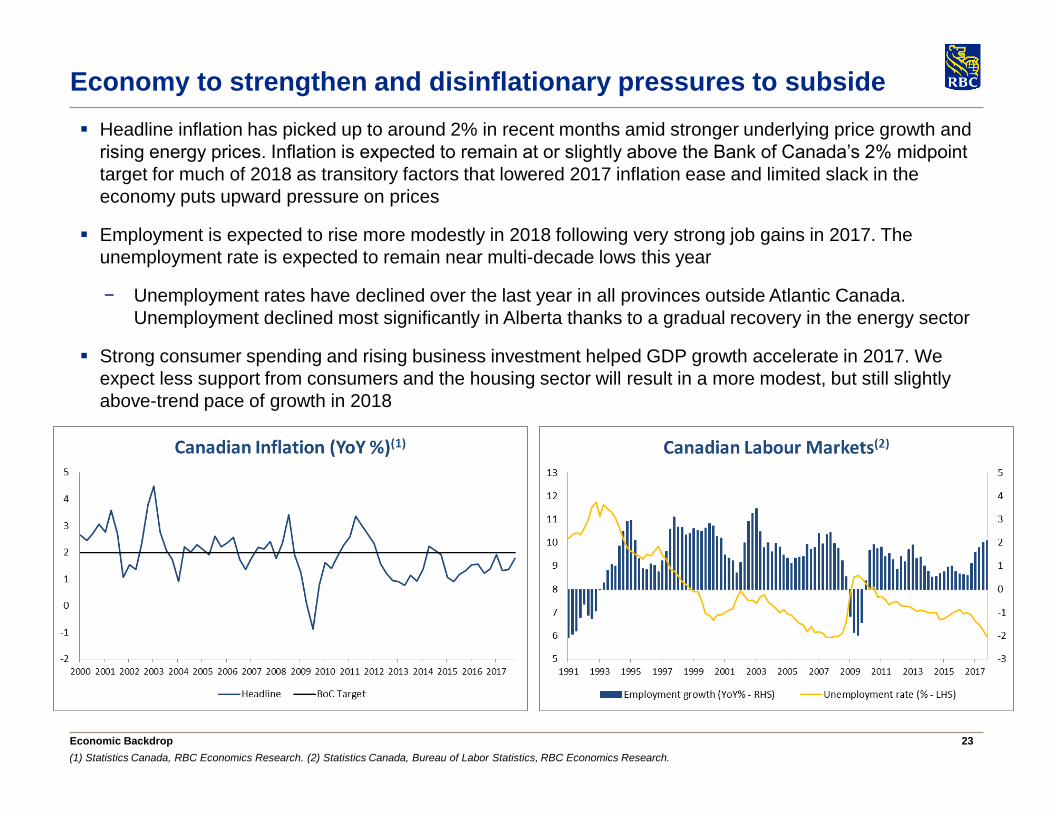
Headline inflation has picked up to around 2% in recent months amid stronger underlying price growth and
rising energy prices. Inflation is expected to remain at or slightly above the Bank of Canada’s 2% midpoint
target for much of 2018 as transitory factors that lowered 2017 inflation ease and limited slack in the
economy puts upward pressure on prices
Employment is expected to rise more modestly in 2018 following very strong job gains in 2017. The
unemployment rate is expected to remain near multi-decade lows this year
− Unemployment rates have declined over the last year in all provinces outside Atlantic Canada.
Unemployment declined most significantly in Alberta thanks to a gradual recovery in the energy sector
Strong consumer spending and rising business investment helped GDP growth accelerate in 2017. We
expect less support from consumers and the housing sector will result in a more modest, but still slightly
above-trend pace of growth in 2018
Economic Backdrop
(1) Statistics Canada, RBC Economics Research. (2) Statistics Canada, Bureau of Labor Statistics, RBC Economics Research.
Economy to strengthen and disinflationary pressures to subside
24
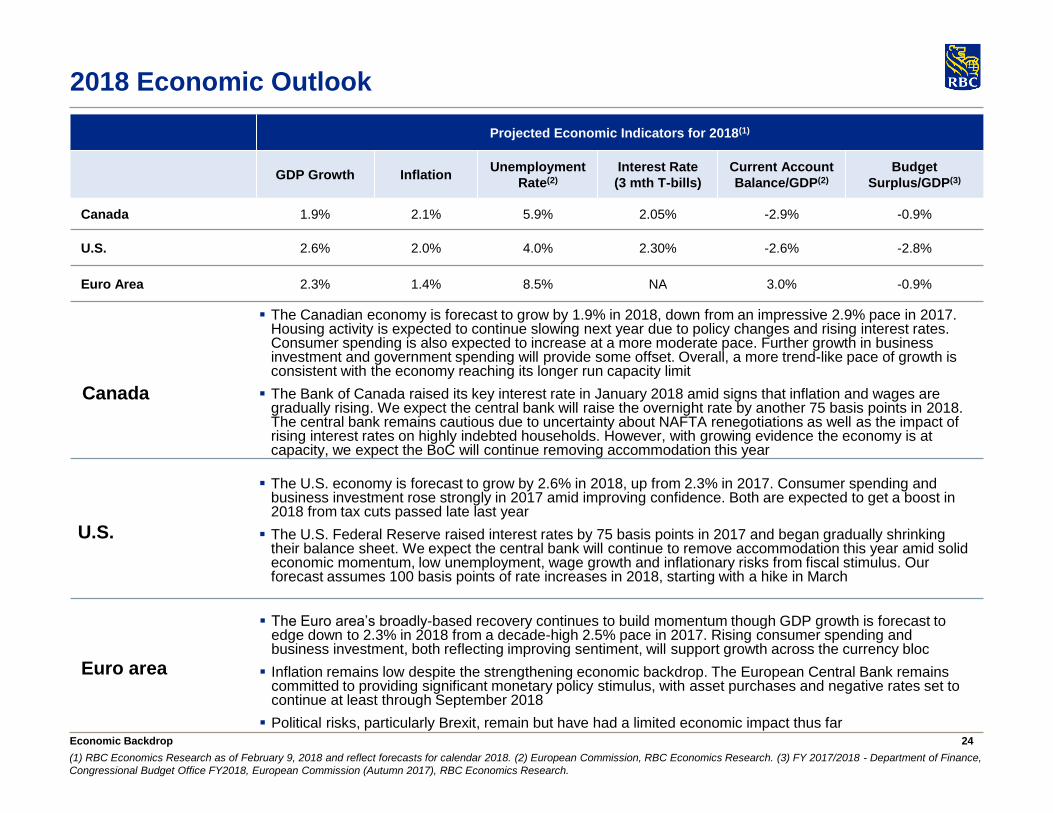
Projected Economic Indicators for 2018(1)
GDP Growth InflationUnemployment
Rate(2)
Interest Rate
(3 mth T-bills)
Current Account
Balance/GDP(2)
Budget
Surplus/GDP(3)
Canada 1.9% 2.1% 5.9% 2.05% -2.9% -0.9%
U.S. 2.6% 2.0% 4.0% 2.30% -2.6% -2.8%
Euro Area 2.3% 1.4% 8.5% NA 3.0% -0.9%
Canada
U.S.
Euro area
Economic Backdrop
(1) RBC Economics Research as of February 9, 2018 and reflect forecasts for calendar 2018. (2) European Commission, RBC Economics Research. (3) FY 2017/2018 - Department of Finance,
Congressional Budget Office FY2018, European Commission (Autumn 2017), RBC Economics Research.
2018 Economic Outlook
The U.S. economy is forecast to grow by 2.6% in 2018, up from 2.3% in 2017. Consumer spending and business investment rose strongly in 2017 amid improving confidence. Both are expected to get a boost in 2018 from tax cuts passed late last year
The U.S. Federal Reserve raised interest rates by 75 basis points in 2017 and began gradually shrinking their balance sheet. We expect the central bank will continue to remove accommodation this year amid solid economic momentum, low unemployment, wage growth and inflationary risks from fiscal stimulus. Our forecast assumes 100 basis points of rate increases in 2018, starting with a hike in March
The Canadian economy is forecast to grow by 1.9% in 2018, down from an impressive 2.9% pace in 2017. Housing activity is expected to continue slowing next year due to policy changes and rising interest rates. Consumer spending is also expected to increase at a more moderate pace. Further growth in business investment and government spending will provide some offset. Overall, a more trend-like pace of growth is consistent with the economy reaching its longer run capacity limit
The Bank of Canada raised its key interest rate in January 2018 amid signs that inflation and wages are gradually rising. We expect the central bank will raise the overnight rate by another 75 basis points in 2018. The central bank remains cautious due to uncertainty about NAFTA renegotiations as well as the impact of rising interest rates on highly indebted households. However, with growing evidence the economy is at capacity, we expect the BoC will continue removing accommodation this year
The Euro area’s broadly-based recovery continues to build momentum though GDP growth is forecast to edge down to 2.3% in 2018 from a decade-high 2.5% pace in 2017. Rising consumer spending and business investment, both reflecting improving sentiment, will support growth across the currency bloc
Inflation remains low despite the strengthening economic backdrop. The European Central Bank remains committed to providing significant monetary policy stimulus, with asset purchases and negative rates set to continue at least through September 2018
Political risks, particularly Brexit, remain but have had a limited economic impact thus far
25
Canadian Housing Market
26
Canada(1) U.S.(1)
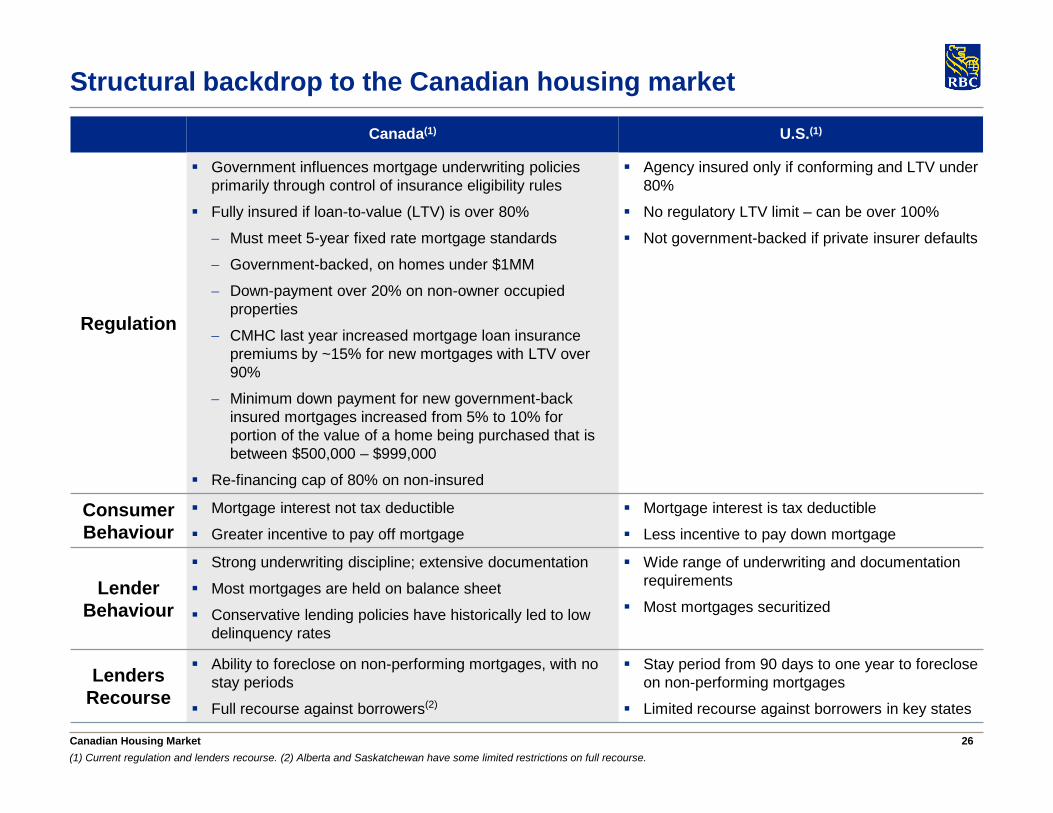
Regulation
Government influences mortgage underwriting policies
primarily through control of insurance eligibility rules
Fully insured if loan-to-value (LTV) is over 80%
Must meet 5-year fixed rate mortgage standards
Government-backed, on homes under $1MM
Down-payment over 20% on non-owner occupied
properties
CMHC last year increased mortgage loan insurance
premiums by ~15% for new mortgages with LTV over
90%
Minimum down payment for new government-back
insured mortgages increased from 5% to 10% for
portion of the value of a home being purchased that is
between $500,000 – $999,000
Re-financing cap of 80% on non-insured
Agency insured only if conforming and LTV under
80%
No regulatory LTV limit – can be over 100%
Not government-backed if private insurer defaults
Consumer
Behaviour
Mortgage interest not tax deductible
Greater incentive to pay off mortgage
Mortgage interest is tax deductible
Less incentive to pay down mortgage
Lender
Behaviour
Strong underwriting discipline; extensive documentation
Most mortgages are held on balance sheet
Conservative lending policies have historically led to low
delinquency rates
Wide range of underwriting and documentation
requirements
Most mortgages securitized
Lenders
Recourse
Ability to foreclose on non-performing mortgages, with no
stay periods
Full recourse against borrowers(2)
Stay period from 90 days to one year to foreclose
on non-performing mortgages
Limited recourse against borrowers in key states
Canadian Housing Market
(1) Current regulation and lenders recourse. (2) Alberta and Saskatchewan have some limited restrictions on full recourse.
Structural backdrop to the Canadian housing market
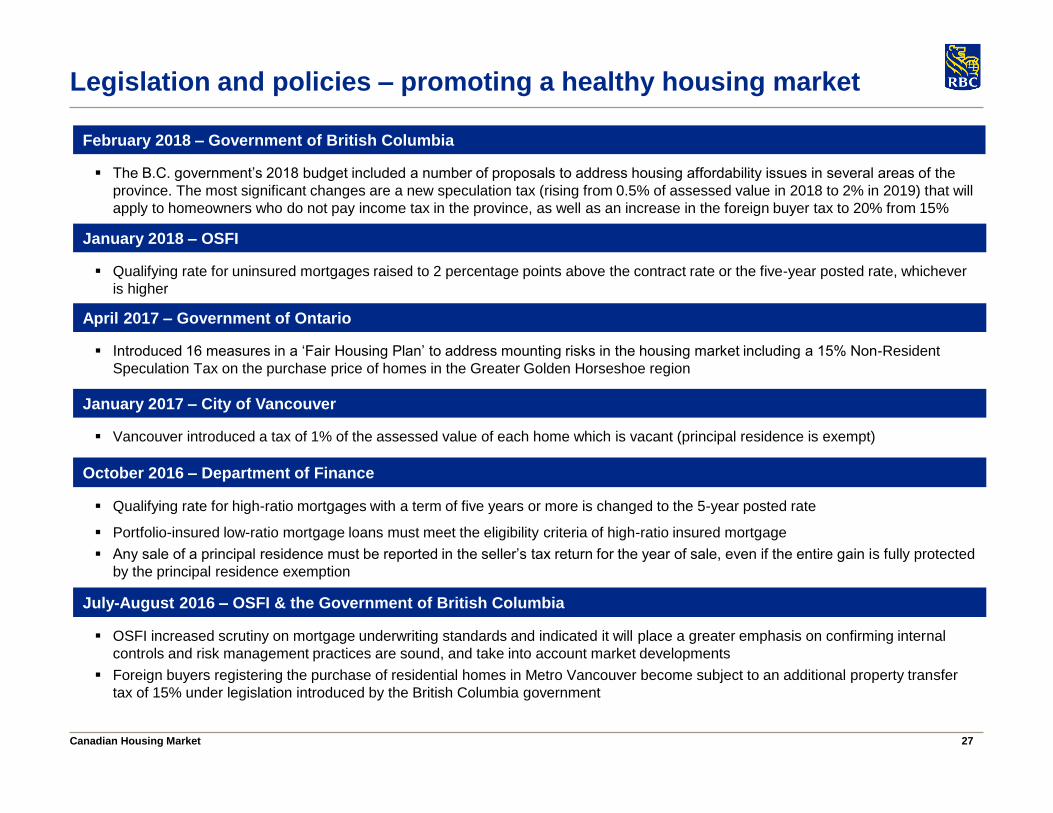
27Canadian Housing Market
February 2018 – Government of British Columbia
The B.C. government’s 2018 budget included a number of proposals to address housing affordability issues in several areas of the
province. The most significant changes are a new speculation tax (rising from 0.5% of assessed value in 2018 to 2% in 2019) that will
apply to homeowners who do not pay income tax in the province, as well as an increase in the foreign buyer tax to 20% from 15%
July-August 2016 – OSFI & the Government of British Columbia
OSFI increased scrutiny on mortgage underwriting standards and indicated it will place a greater emphasis on confirming internal
controls and risk management practices are sound, and take into account market developments
Foreign buyers registering the purchase of residential homes in Metro Vancouver become subject to an additional property transfer
tax of 15% under legislation introduced by the British Columbia government
October 2016 – Department of Finance
Qualifying rate for high-ratio mortgages with a term of five years or more is changed to the 5-year posted rate
Portfolio-insured low-ratio mortgage loans must meet the eligibility criteria of high-ratio insured mortgage
Any sale of a principal residence must be reported in the seller’s tax return for the year of sale, even if the entire gain is fully protected
by the principal residence exemption
Legislation and policies – promoting a healthy housing market
January 2017 – City of Vancouver
Vancouver introduced a tax of 1% of the assessed value of each home which is vacant (principal residence is exempt)
January 2018 – OSFI
Qualifying rate for uninsured mortgages raised to 2 percentage points above the contract rate or the five-year posted rate, whichever
is higher
April 2017 – Government of Ontario
Introduced 16 measures in a ‘Fair Housing Plan’ to address mounting risks in the housing market including a 15% Non-Resident
Speculation Tax on the purchase price of homes in the Greater Golden Horseshoe region
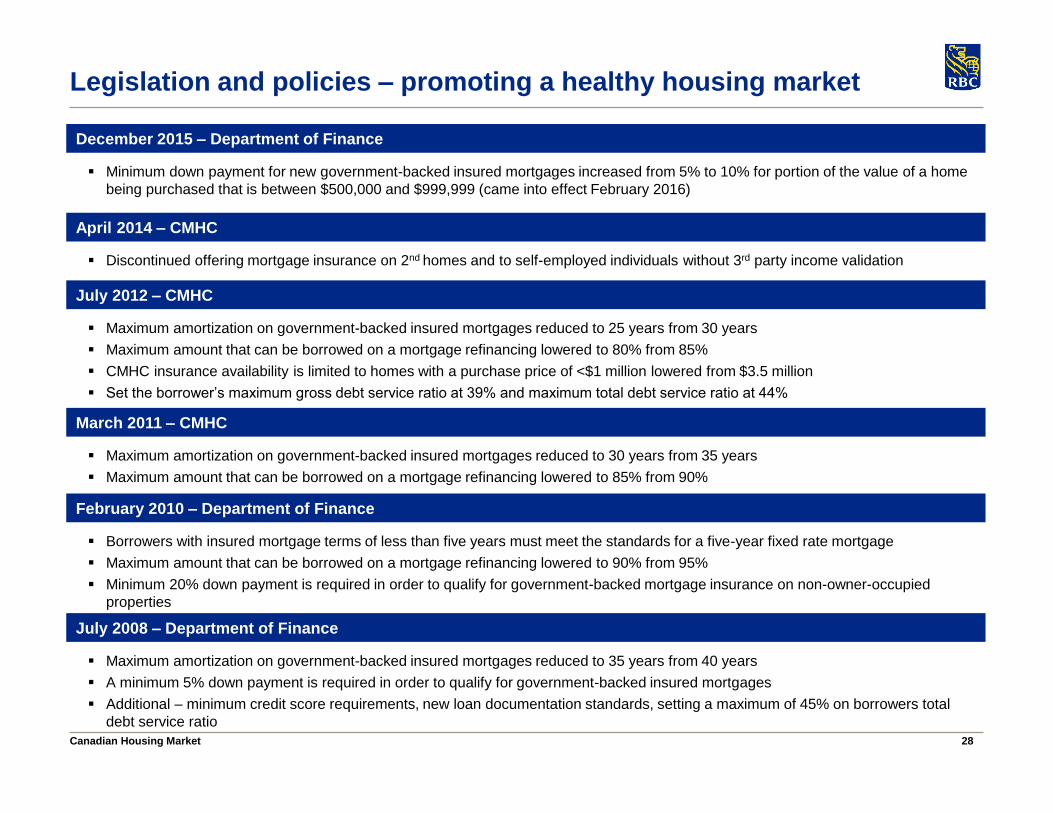
28Canadian Housing Market
February 2010 – Department of Finance
Borrowers with insured mortgage terms of less than five years must meet the standards for a five-year fixed rate mortgage
Maximum amount that can be borrowed on a mortgage refinancing lowered to 90% from 95%
Minimum 20% down payment is required in order to qualify for government-backed mortgage insurance on non-owner-occupied
properties
March 2011 – CMHC
Maximum amortization on government-backed insured mortgages reduced to 30 years from 35 years
Maximum amount that can be borrowed on a mortgage refinancing lowered to 85% from 90%
Legislation and policies – promoting a healthy housing market
July 2008 – Department of Finance
Maximum amortization on government-backed insured mortgages reduced to 35 years from 40 years
A minimum 5% down payment is required in order to qualify for government-backed insured mortgages
Additional – minimum credit score requirements, new loan documentation standards, setting a maximum of 45% on borrowers total
debt service ratio
July 2012 – CMHC
Maximum amortization on government-backed insured mortgages reduced to 25 years from 30 years
Maximum amount that can be borrowed on a mortgage refinancing lowered to 80% from 85%
CMHC insurance availability is limited to homes with a purchase price of <$1 million lowered from $3.5 million
Set the borrower’s maximum gross debt service ratio at 39% and maximum total debt service ratio at 44%
April 2014 – CMHC
Discontinued offering mortgage insurance on 2nd homes and to self-employed individuals without 3rd party income validation
December 2015 – Department of Finance
Minimum down payment for new government-backed insured mortgages increased from 5% to 10% for portion of the value of a home
being purchased that is between $500,000 and $999,999 (came into effect February 2016)
29
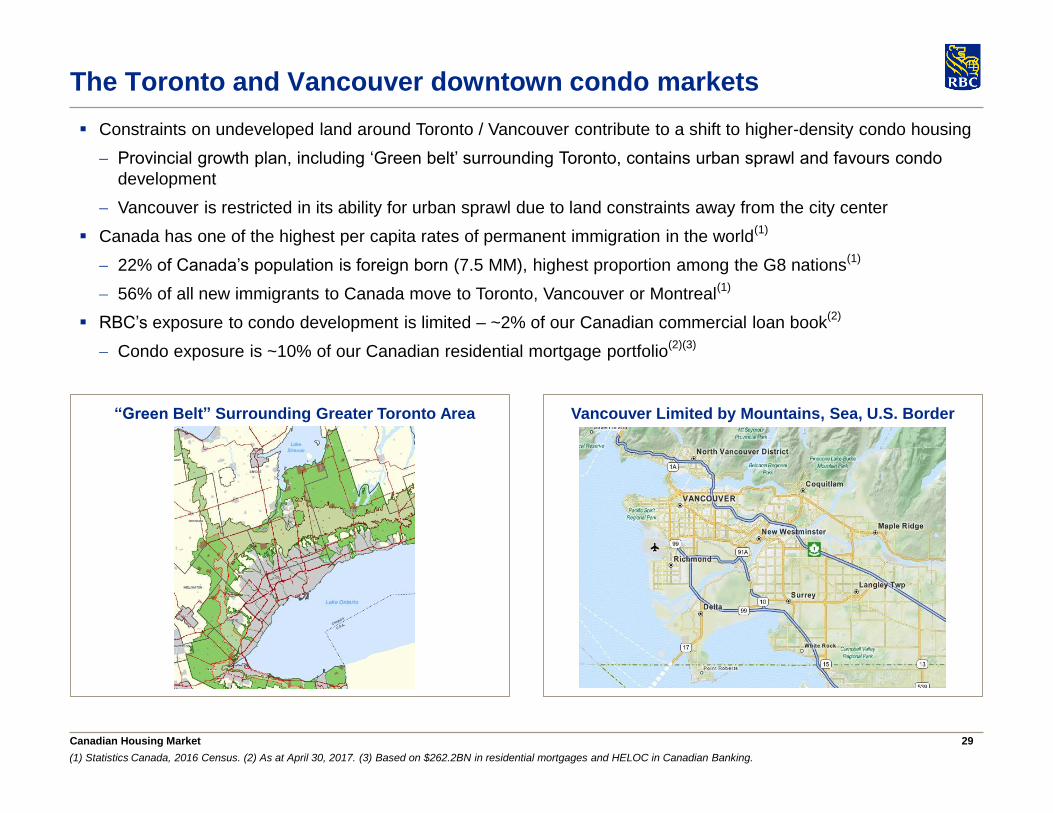
Constraints on undeveloped land around Toronto / Vancouver contribute to a shift to higher-density condo housing
Provincial growth plan, including ‘Green belt’ surrounding Toronto, contains urban sprawl and favours condo
development
Vancouver is restricted in its ability for urban sprawl due to land constraints away from the city center
Canada has one of the highest per capita rates of permanent immigration in the world(1)
22% of Canada’s population is foreign born (7.5 MM), highest proportion among the G8 nations(1)
56% of all new immigrants to Canada move to Toronto, Vancouver or Montreal(1)
RBC’s exposure to condo development is limited – ~2% of our Canadian commercial loan book(2)
Condo exposure is ~10% of our Canadian residential mortgage portfolio(2)(3)
“Green Belt” Surrounding Greater Toronto Area Vancouver Limited by Mountains, Sea, U.S. Border
Canadian Housing Market
(1) Statistics Canada, 2016 Census. (2) As at April 30, 2017. (3) Based on $262.2BN in residential mortgages and HELOC in Canadian Banking.
The Toronto and Vancouver downtown condo markets
30Canadian Housing Market
Canadian housing market risks remain localized
(1) Canadian Real Estate Association, RBC Economics Research. (2) Statistics Canada, RBC Economics Research. PDI: Personal Disposable Income.
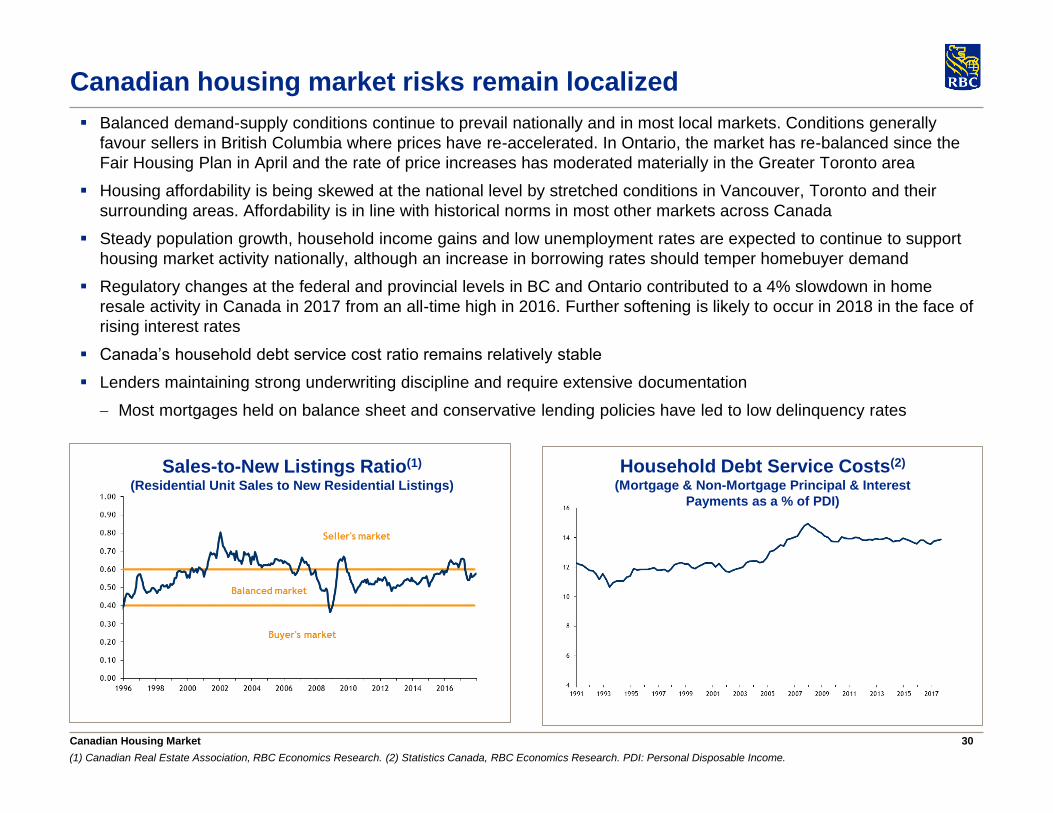
Balanced demand-supply conditions continue to prevail nationally and in most local markets. Conditions generally
favour sellers in British Columbia where prices have re-accelerated. In Ontario, the market has re-balanced since the
Fair Housing Plan in April and the rate of price increases has moderated materially in the Greater Toronto area
Housing affordability is being skewed at the national level by stretched conditions in Vancouver, Toronto and their
surrounding areas. Affordability is in line with historical norms in most other markets across Canada
Steady population growth, household income gains and low unemployment rates are expected to continue to support
housing market activity nationally, although an increase in borrowing rates should temper homebuyer demand
Regulatory changes at the federal and provincial levels in BC and Ontario contributed to a 4% slowdown in home
resale activity in Canada in 2017 from an all-time high in 2016. Further softening is likely to occur in 2018 in the face of
rising interest rates
Canada’s household debt service cost ratio remains relatively stable
Lenders maintaining strong underwriting discipline and require extensive documentation
Most mortgages held on balance sheet and conservative lending policies have led to low delinquency rates
Sales-to-New Listings Ratio(1)
(Residential Unit Sales to New Residential Listings)
Household Debt Service Costs(2)
(Mortgage & Non-Mortgage Principal & Interest
Payments as a % of PDI)
31
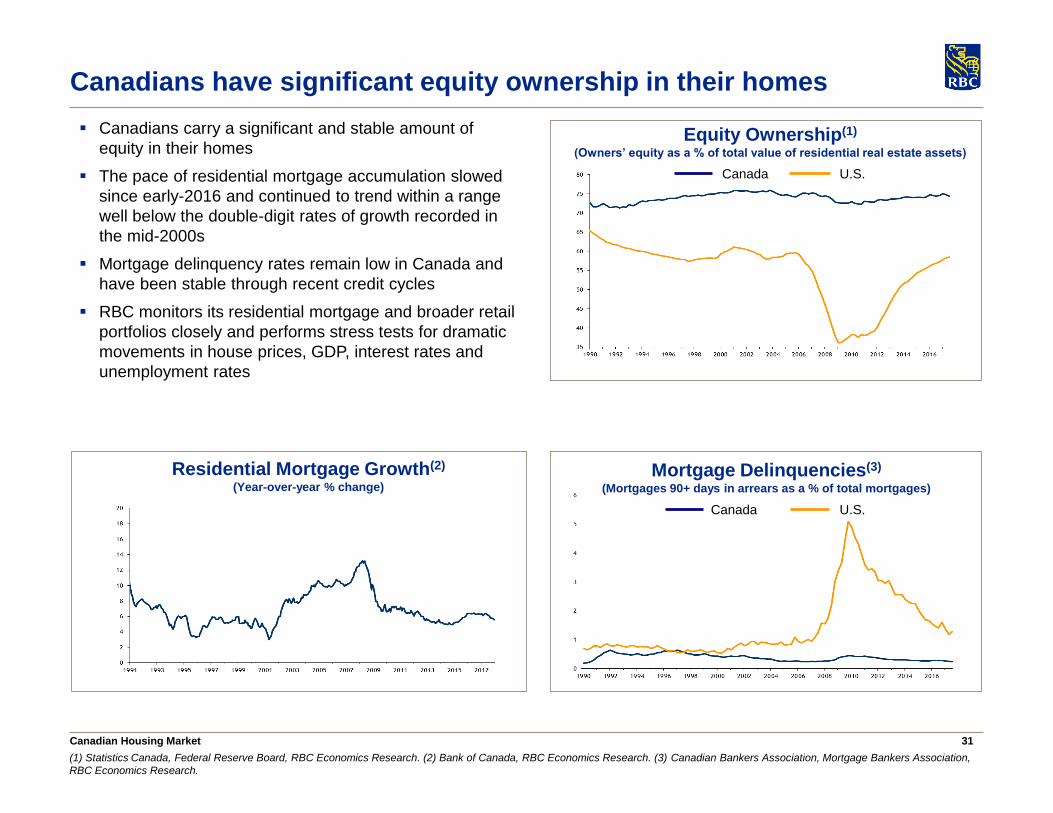
Canadians have significant equity ownership in their homes
Canadians carry a significant and stable amount of
equity in their homes
The pace of residential mortgage accumulation slowed
since early-2016 and continued to trend within a range
well below the double-digit rates of growth recorded in
the mid-2000s
Mortgage delinquency rates remain low in Canada and
have been stable through recent credit cycles
RBC monitors its residential mortgage and broader retail
portfolios closely and performs stress tests for dramatic
movements in house prices, GDP, interest rates and
unemployment rates
Canadian Housing Market
(1) Statistics Canada, Federal Reserve Board, RBC Economics Research. (2) Bank of Canada, RBC Economics Research. (3) Canadian Bankers Association, Mortgage Bankers Association,
RBC Economics Research.
Equity Ownership(1)
(Owners’ equity as a % of total value of residential real estate assets)
Canada U.S.
Residential Mortgage Growth(2)
(Year-over-year % change)
U.S.Canada
Mortgage Delinquencies(3)
(Mortgages 90+ days in arrears as a % of total mortgages)
32
Appendix A – Liquidity & Funding
33
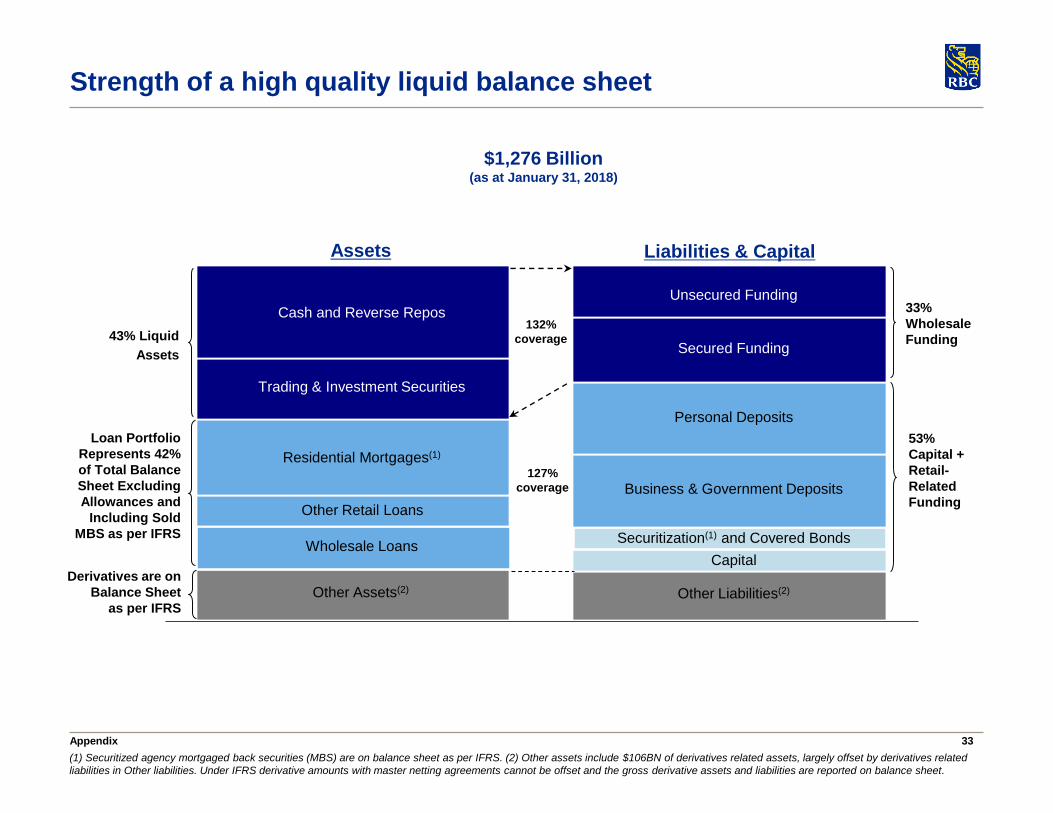
132%
coverage
Assets
43% Liquid
Assets
Loan Portfolio
Represents 42%
of Total Balance
Sheet Excluding
Allowances and
Including Sold
MBS as per IFRS
Liabilities & Capital
53%
Capital +
Retail-
Related
Funding
33%
Wholesale
Funding
127%
coverage
Derivatives are on
Balance Sheet
as per IFRS
Appendix
(1) Securitized agency mortgaged back securities (MBS) are on balance sheet as per IFRS. (2) Other assets include $106BN of derivatives related assets, largely offset by derivatives related
liabilities in Other liabilities. Under IFRS derivative amounts with master netting agreements cannot be offset and the gross derivative assets and liabilities are reported on balance sheet.
Strength of a high quality liquid balance sheet
Business & Government Deposits
Personal Deposits
Capital
Other Liabilities(2)
Securitization(1) and Covered Bonds
Secured Funding
Unsecured Funding
Cash and Reverse Repos
Trading & Investment Securities
Residential Mortgages(1)
Other Retail Loans
Wholesale Loans
Other Assets(2)
$1,276 Billion(as at January 31, 2018)
34
30
50
70
90
110
130
150
170
190
Oct-07 Oct-08 Oct-09 Oct-10 Oct-11 Oct-12 Oct-13 Oct-14 Oct-15 Oct-16 Oct-17
Avera
ge
Bala
nc
es (
$B
CA
D)
4.86% CAGR
9.25% CAGR
Cdn Business Deposits(2)
Cdn Personal Deposits
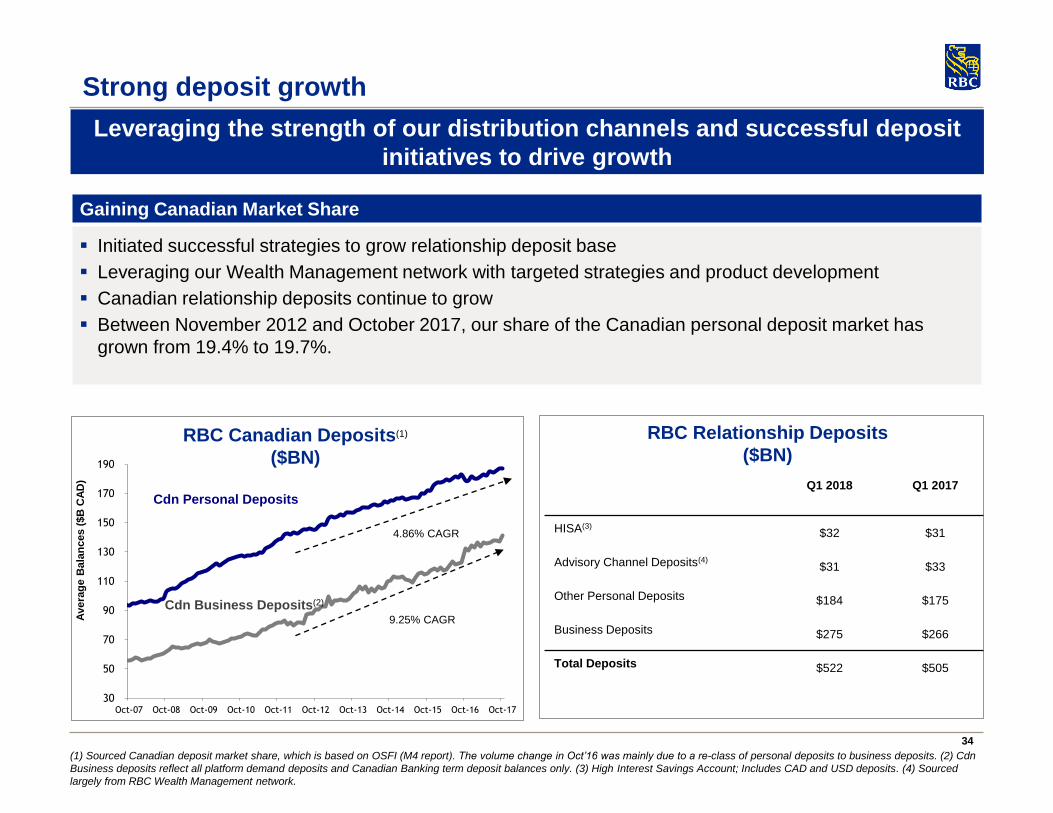
Gaining Canadian Market Share
Initiated successful strategies to grow relationship deposit base
Leveraging our Wealth Management network with targeted strategies and product development
Canadian relationship deposits continue to grow
Between November 2012 and October 2017, our share of the Canadian personal deposit market has
grown from 19.4% to 19.7%.
RBC Relationship Deposits
($BN)
(1) Sourced Canadian deposit market share, which is based on OSFI (M4 report). The volume change in Oct’16 was mainly due to a re-class of personal deposits to business deposits. (2) Cdn
Business deposits reflect all platform demand deposits and Canadian Banking term deposit balances only. (3) High Interest Savings Account; Includes CAD and USD deposits. (4) Sourced
largely from RBC Wealth Management network.
Leveraging the strength of our distribution channels and successful deposit
initiatives to drive growth
Q1 2018 Q1 2017
HISA(3)$32 $31
Advisory Channel Deposits(4)$31 $33
Other Personal Deposits $184 $175
Business Deposits $275 $266
Total Deposits $522 $505
Strong deposit growth
RBC Canadian Deposits(1)
($BN)
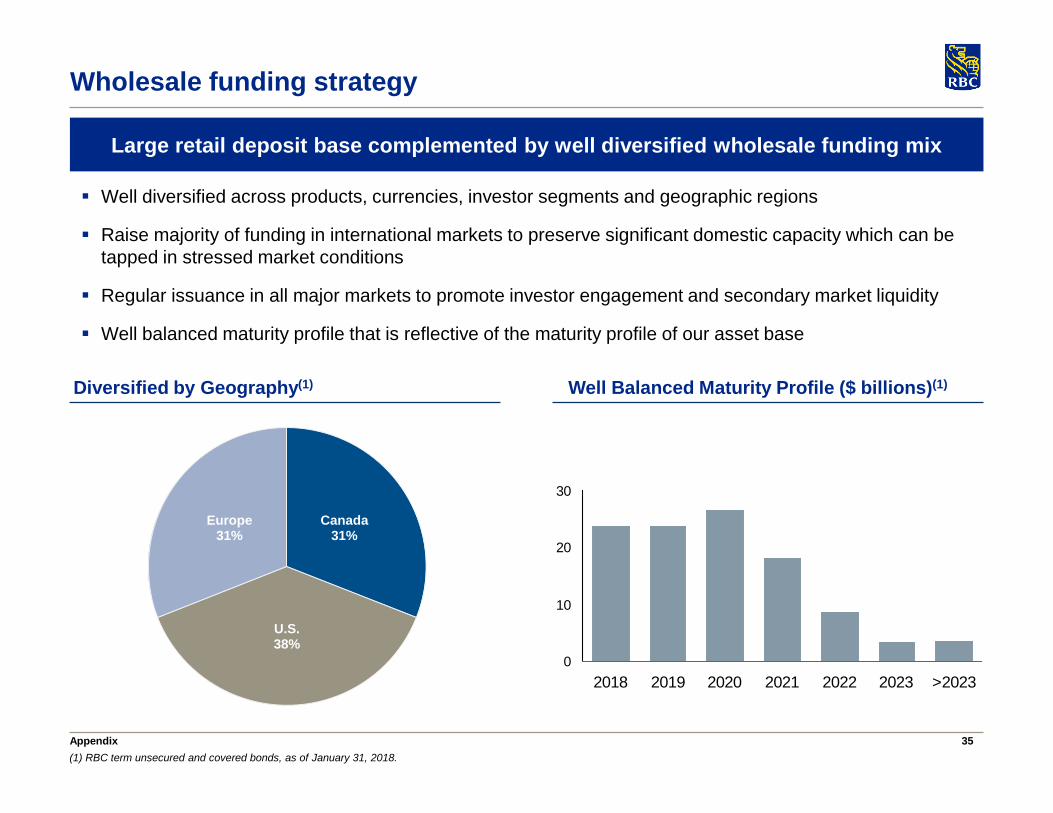
35Appendix
(1) RBC term unsecured and covered bonds, as of January 31, 2018.
Wholesale funding strategy
Diversified by Geography(1) Well Balanced Maturity Profile ($ billions)(1)
Large retail deposit base complemented by well diversified wholesale funding mix
Well diversified across products, currencies, investor segments and geographic regions
Raise majority of funding in international markets to preserve significant domestic capacity which can be
tapped in stressed market conditions
Regular issuance in all major markets to promote investor engagement and secondary market liquidity
Well balanced maturity profile that is reflective of the maturity profile of our asset base
0
10
20
30
2018 2019 2020 2021 2022 2023 >2023
Canada31%
U.S.38%
Europe31%
36
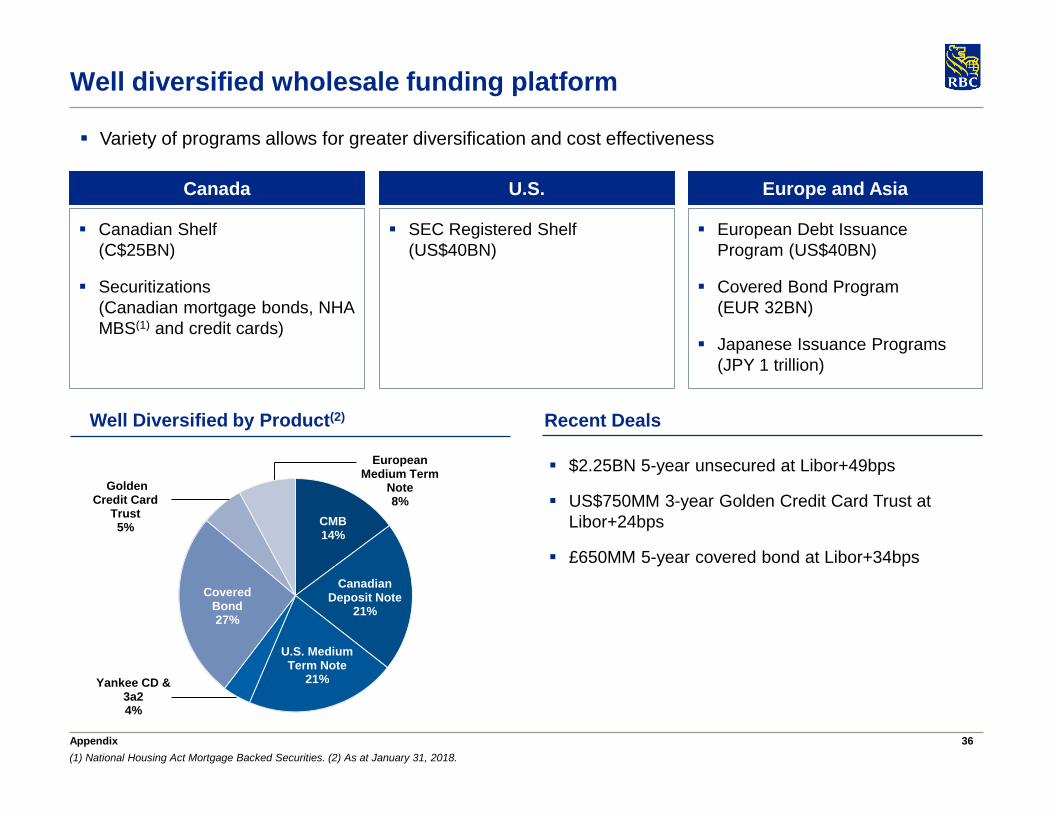
Variety of programs allows for greater diversification and cost effectiveness
Appendix
(1) National Housing Act Mortgage Backed Securities. (2) As at January 31, 2018.
Well diversified wholesale funding platform
Well Diversified by Product(2) Recent Deals
SEC Registered Shelf
(US$40BN)
U.S.
European Debt Issuance
Program (US$40BN)
Covered Bond Program
(EUR 32BN)
Japanese Issuance Programs
(JPY 1 trillion)
Europe and Asia
Canadian Shelf
(C$25BN)
Securitizations
(Canadian mortgage bonds, NHA
MBS(1) and credit cards)
Canada
$2.25BN 5-year unsecured at Libor+49bps
US$750MM 3-year Golden Credit Card Trust at
Libor+24bps
£650MM 5-year covered bond at Libor+34bps
CMB14%
Canadian Deposit Note
21%
U.S. Medium Term Note
21%Yankee CD & 3a24%
Covered Bond27%
Golden Credit Card
Trust5%
European Medium Term
Note8%
37
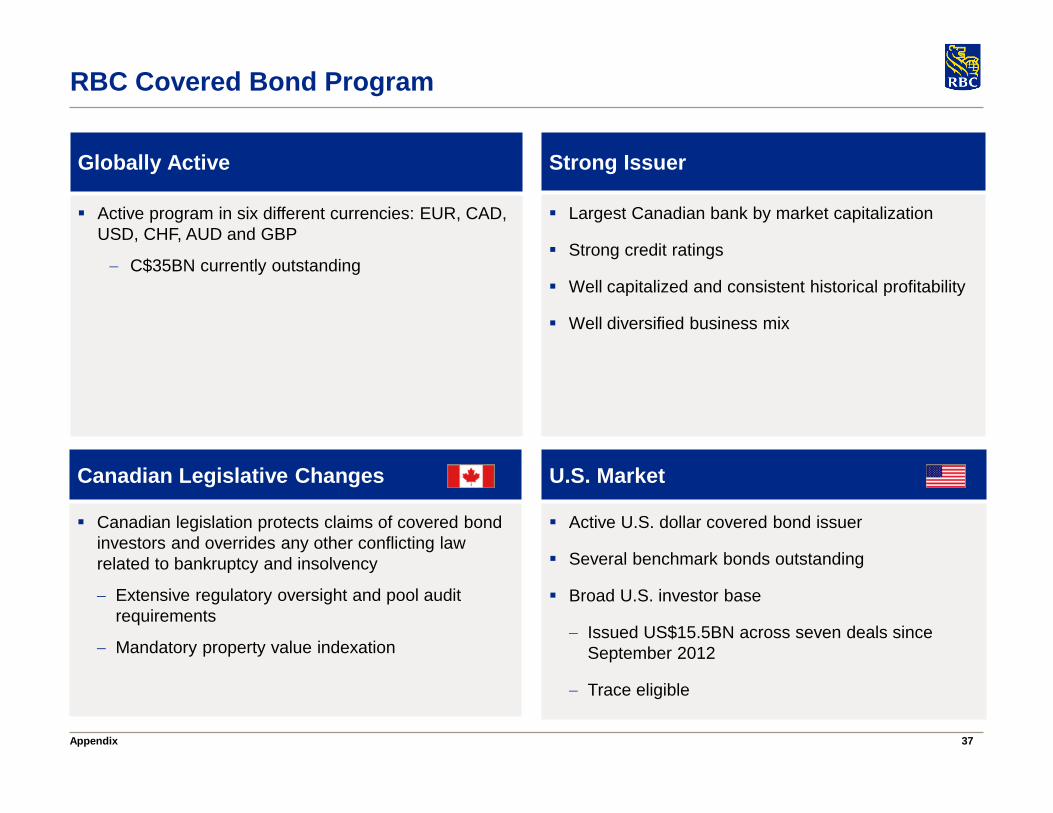
RBC Covered Bond Program
Appendix
U.S. Market
Active U.S. dollar covered bond issuer
Several benchmark bonds outstanding
Broad U.S. investor base
Issued US$15.5BN across seven deals since
September 2012
Trace eligible
Strong Issuer
Largest Canadian bank by market capitalization
Strong credit ratings
Well capitalized and consistent historical profitability
Well diversified business mix
Canadian Legislative Changes
Canadian legislation protects claims of covered bond
investors and overrides any other conflicting law
related to bankruptcy and insolvency
Extensive regulatory oversight and pool audit
requirements
Mandatory property value indexation
Globally Active
Active program in six different currencies: EUR, CAD,
USD, CHF, AUD and GBP
C$35BN currently outstanding
38
Investor Relations Contacts
We use a variety of financial measures to evaluate our performance. In addition to generally accepted
accounting principles (GAAP) prescribed measures, we use certain key performance and non-GAAP
measures we believe provide useful information to investors regarding our financial condition and result of
operations. Readers are cautioned that key performance measures, such as ROE and non-GAAP measures,
including amounts excluding Corporate Support, cash earnings excluding the after-tax effect of amortization
of intangibles; and results excluding our share of a gain related to the sale of the U.S. operations of Moneris
Solutions Corporations do not have any standardized meanings prescribed by GAAP, and therefore are
unlikely to be comparable to similar measures disclosed by other financial institutions.
Additional information about our ROE and non-GAAP measures can be found under the “Key performance
and non-GAAP measures” sections of our Q1 2018 Report to Shareholders.
Definitions can be found under the “Glossary” sections in our Q1 2018 Supplementary Financial Information
and our 2017 Annual Report.
Note to users
Note to users
Dave Mun, SVP & Head (416) 974-4924
Asim Imran, Senior Director (416) 955-7804
Jennifer Nugent, Senior Director (416) 955-7805
www.rbc.com/investorrelations
Recommended