Embed Size (px)
Citation preview

0
Royal Bank of CanadaInvestor PresentationQ2/2015
All amounts are in Canadian dollars and are based on financial statements prepared in compliance with International Accounting Standards 34 Interim Financial Reporting, unless otherwise noted. Our Q2/2015 Report to Shareholders and Supplementary Financial Information are available on our website at rbc.com/investorrelations.

1
Caution regarding forward-looking statements
From time to time, we make written or oral forward-looking statements within the meaning of certain securities laws, including the “safe harbour” provisions of the United States Private Securities Litigation Reform Act of 1995 and any applicable Canadian securities legislation. We may make forward-looking statements in this RBC Investor Presentation, in filings with Canadian regulators or the United States (U.S.) Securities and Exchange Commission (SEC), in reports to shareholders and in other communications. Forward-looking statements in this presentation include, but are not limited to, statements relating to our financial performance objectives, vision and strategic goals. The forward-looking information contained in this RBC Investor Presentation is presented for the purpose of assisting the holders of our securities and financial analysts in understanding our financial position and results of operations as at and for the periods ended on the dates presented, and our financial performance objectives, vision and strategic goals, and may not be appropriate for other purposes. Forward-looking statements are typically identified by words such as “believe”, “expect”, “foresee”, “forecast”, “anticipate”, “intend”, “estimate”, “goal”, “plan” and “project” and similar expressions of future or conditional verbs such as “will”, “may”, “should”, “could” or “would”.
By their very nature, forward-looking statements require us to make assumptions and are subject to inherent risks and uncertainties, which give rise to the possibility that our predictions, forecasts, projections, expectations or conclusions will not prove to be accurate, that our assumptions may not be correct and that our financial performance objectives, vision and strategic goals will not be achieved. We caution readers not to place undue reliance on these statements as a number of risk factors could cause our actual results to differ materially from the expectations expressed in such forward-looking statements. These factors – many of which are beyond our control and the effects of which can be difficult to predict – include: credit, market, liquidity and funding, insurance, regulatory compliance, operational, strategic, reputation, legal and regulatory environment, competitive and systemic risks and other risks discussed in the Risk management and Overview of other risks sections of our 2014 Annual Report and the Risk Management section of our Q2/2015 Report to Shareholders; anti-money laundering; growth in wholesale credit; the high levels of Canadian household debt; cybersecurity; the business and economic conditions in Canada, the U.S. and certain other countries in which we operate; the effects of changes in government fiscal, monetary and other policies; tax risk and transparency; our ability to attract and retain employees; the accuracy and completeness of information concerning our clients and counterparties; the development and integration of our distribution networks; model, information technology, information management, social media, environmental and third party and outsourcing risk.
We caution that the foregoing list of risk factors is not exhaustive and other factors could also adversely affect our results. When relying on our forward-looking statements to make decisions with respect to us, investors and others should carefully consider the foregoing factors and other uncertainties and potential events. Material economic assumptions underlying the forward looking-statements contained in this RBC Investor Presentation are set out in the Overview and outlook section and for each business segment under the heading Outlook and priorities in our 2014 Annual Report, as updated by the Overview and Outlook Section in our Q2/2015 Report to Shareholders. Except as required by law, we do not undertake to update any forward-looking statement, whether written or oral, that may be made from time to time by us or on our behalf.
Additional information about these and other factors can be found in the Risk management and the Overview of other risks sections in our 2014 Annual Report and in the Risk Management section of our Q2/2015 Report to Shareholders.
Information contained in or otherwise accessible through the websites mentioned does not form part of this RBC Investor Presentation. All references in this RBC Investor Presentation to websites are inactive textual references and are for your information only.
2
Canadian EconomySECTION I

3(1) International Monetary Fund. (2) World Economic Forum, 2014. (3) National Statistics Offices, RBC Economics Research. (4) Statistics Canada, RBC Economics Research.
Canada’s strong fiscal position
Strong rating as a result of fiscal prudence, conservative bank lending practices and solid economy
Lowest net debt to GDP ratio among G7 peers(1)
#1 for soundness of banks for the 7th consecutive year(2)
A diversified economy supporting balanced economic growth
11%
11%
11%
4%20%
12%
7%
7%
8%
9%
Finance, Insurance & Real Estate
Manufacturing
Wholesale and Retail Trade
Scientific, Technical & Educational Serv.
Public Administration and Utilities
Mining, Oil & Gas Extractions
Construction
Health Care
Transportation, Warehousing
Other
Canadian GDP by Industry(4)
(February 2015)
1.2
0.2
0.9
1.3
1.9
2.52.2
2.8
2.21.9
Italy
Japa
n
Ger
man
y
Fran
ce
U.K
.
U.S
.
Can
ada
Cda
201
5F
Cda
201
6F
G7 Real GDP Growth (%)(3)
2000-2014

4
62
63
64
65
66
67
68
1990 1992 1994 1996 1998 2000 2002 2004 2006 2008 2010 2012 2014
3
4
5
6
7
8
9
10
11
12
13
1990 1992 1994 1996 1998 2000 2002 2004 2006 2008 2010 2012 2014
-2
-1
0
1
2
3
4
5
2000 2001 2002 2003 2004 2005 2006 2007 2008 2009 2010 2011 2012 2013 2014 2015
Attractive economic fundamentals
Unemployment (%)(2)
Low oil prices expected to continue to weigh on headline inflation for the remainder of 2015; Core inflation likely to remain stable around mid-point of 1-3% target range
Unemployment rates are trending favourablyand are indicative of underlying conditions improving
Labour force participation trend predominantly reflects an aging population rather than workers’ voluntary exit of the labour market
(1) Statistics Canada, RBC Economics Research. (2) Statistics Canada, Bureau of Labor Statistics, RBC Economics Research.
Labour Force Participation Rate (%)(2)
U.S.Canada
CoreHeadline BoC Target
Canadian Inflation (YoY%)(1)
U.S.Canada

5
2015 Economic Outlook
Projected Economic Indicators for 2015(1)
GDP Growth Inflation Unemployment Rate
Interest Rate (3 mth T-bills)
Current Account Balance/GDP(2)
Budget Surplus/GDP(3)
Canada 2.2% 1.1% 6.6% 0.75% -2.8% 0.1%
U.S. 2.6% 0.3% 5.4% 0.5% -2.4% -2.7%
Euro Area 1.5% 0.0% 11.0% NA 3.5% -2.5%
Canada
U.S.
Euro area
Economic growth in Canada is expected to bounce back in H2/15 to an above-potential pace following weak performance in the early stages of 2015 as supportive factors emanating from lower oil prices materialize and temper an energy-price related decline in business investment In H2/15, stronger performance in net oil-consuming provinces will be offset in part by the potential
weakness in oil-producing provinces, such as Alberta Consumer spending is expected to remain firm while housing market activity is anticipated to be
stable supported by highly accommodative borrowing conditions
(1) RBC Economics Research as of May 8, 2015 and reflect forecasts for calendar 2015. (2) European Commission, RBC Economics Research. (3) Department of Finance, Congressional Budget Office, European Commission, RBC Economics Research.
Economic growth in the U.S. is poised to accelerate in 2015 as a transitory slowdown in the first quarter reverses and gives way for improving labour market conditions to support stronger consumer spending and housing market gains The U.S. Federal Reserve is expected to begin to raise the Fed funds rate in September as
ongoing momentum in the labour markets, set against a backdrop of stable inflation, should support continued progress towards achieving full employment
A recovery in the Euro area economy is being supported by a confluence of factors, namely loweroil prices, currency depreciation and less drag from fiscal consolidation in 2015 Significant monetary stimulus by the European Central Bank will curb downside risks to inflation
and a lower exchange rate is expected to support positive economic growth Structural reforms are expected to keep growth subdued in parts of the Euro zone

6
Royal Bank of CanadaSECTION II

7
314287
256 244217 202 185 173 165
107 104 102 96 93 92 83 82 81 81 77
0
50
100
150
200
250
300
350
ICB
C
Wells Fargo
CC
B
JP M
organ
Bank of C
hina
AB
C
HS
BC
Bank of Am
erica
Citigroup
CBA
Mitsubishi U
FJ Financial
Santander
Lloyds TSB
Group
Goldm
an Sachs
RB
C
TD
UB
S
American Express
Westpac B
anking
US
Bancorp
287
244
173 165
93 92 83 81 77 74 62 49 49 46 40 32 30
0
50
100
150
200
250
300
350
Wells Fargo
JP M
organ
Bank of Am
erica
Citigroup
Goldm
an Sachs
RB
C
TD
American Express
US
Bancorp
Morgan Stanley
Scotiabank
PNC
Financial
Bank of N
Y M
ellon
Capital O
neFinancial
BMO
State S
treet
CIB
C
RBC is one of the largest banks globally
Extending our lead in Canada and selectively growing globally
Global ranking(1,2)
(Market capitalization, US$BN)
Canada’s largest bank by market capitalization, with broad leadership in financial services(1)
Offices in Canada, United States and 39 other countries
~78,000 full- and part-time employees who serve more than 16 million clients worldwide
North American ranking(1)
(Market capitalization, US$BN)
#6 #15
(1) Market data from Bloomberg as of May 26, 2015. (2) ICBC: Industrial and Commercial Bank of China; ABC: Agriculture Bank of China; CBA: Commonwealth Bank of Australia; Santander: Banco Santander, S.A; ANZ: The Australia and New Zealand Banking Group; CCB: China Construction Bank

8
24%
6%
8%
11%
51%
RBC’s key strengths
(1) Amounts exclude Corporate Support. These are non-GAAP measures. For further information, see the Business segment results and Results by geographic segment sections of our Q2 2015 Report to Shareholders.
Diversified business mix, with the right balance of retail and wholesale
Almost two-thirds of revenue from Canada
Strategic approach in key businesses in the U.S. and select international markets In January 2015, RBC announced the acquisition of City National Corp (NYSE: CYN), which will expand
our presence in the U.S.; Expected closing in Q4 of calendar 2015 On May 27, 2015, City National shareholders voted in favour of the deal
19%
18%
63%
Earnings by business segment(1)
Latest twelve months ended April 30, 2015
CanadaU.S.
International
Personal & Commercial
Banking
Wealth Management
Insurance
Capital Markets
Investor & Treasury Services
Revenue by geography(1)
Latest twelve months ended April 30, 2015

9
Strong financial profile
7.58.3
9.0
4.34.9
2012 2013 2014 YTD Q2/2014 YTD Q2/2015
19.6% 19.7% 19.0% 18.6% 18.9%
2012 2013 2014 YTD Q2/2014 YTD Q2/2015
Revenue($BN)
Net Income ($BN)
Return on Equity(2) Q2/2015 Basel III Capital and Leverage ratios“All-in” basis(3)
(1) Adjusted for specified items which include a Q2/2015 gain of $108 MM (before- and after-tax) from the wind-up of a U.S.-based funding subsidiary that resulted in the release of foreign currency translation adjustment (CTA) that was previously booked in other components of equity as well as Q1/2014 loss of $60 MM (before- and after-tax) related to the sale of RBC Jamaica and a Q1/2014 provision of $40 MM ($32 MM after-tax) related to post-employment benefits and restructuring charges in the Caribbean. (2) ROE may not have a standardized meaning under GAAP and may not be comparable to similar measures disclosed by other financial institutions. For additional information, see slide 38. (3) Capital calculated to include all regulatory adjustments that will be required by 2019 but retaining the phase-out rules for non-qualifying capital. Refer to the Capital Management section of our 2014 Annual Report and the Capital Management section of our Q2/2015 Report to Shareholders for details on Basel III requirements. (4) Based on long-term senior debt ratings as of May 26, 2015.
Common Equity Tier 1
Tier 1 Capital
Total Capital
Leverage Ratio
Liquidity Coverage Ratio
10.0%
11.6%
13.5%
4.0%
111%
Credit ratings(4)
Moody’s S&P Fitch DBRSAa3 AA- AA AA
Negative Negative Stable Negative
29.1
34.1
18.4
30.7
16.7
2012 2013 2014 YTD Q2/2014 YTD Q2/2015
4.4
19.0%
(1)
19.3%
5.0(1)
(1) (1)
18.5(1)

10
RBC has increased the dividend 6 times since May 2012, for a total increase of 35%
History of delivering value to our shareholders
Our goal is to maximize shareholder returns by achieving TSR above our peer average
Annual dividend history*($ per share)
$1.18
$1.44
$1.82
$2.00 $2.00 $2.00$2.08
$2.28
$2.53
$2.84
2005 2006 2007 2008 2009 2010 2011 2012 2013 2014
Dividend
Current quarterly dividend: $0.77
Q2/2015 payout ratio of 46%, in line with our target of 40-50%
Share buybacks
2015 normal course issuer bid to repurchase up to 12 million common shares
(1) Annualized TSR is calculated based on common share price appreciation plus reinvested dividend income. Source: Bloomberg, as at May 26, 2015. RBC is compared to our global peer group. The peer group average excludes RBC; for the list of peers, please refer to our 2014 Annual Report.
* Dividends declared per common share.
Total shareholder return (TSR)(1)
RBC Peer Avg.3 Year 21% 21%
5 Year 10% 13%
10 Year 12% 9%
Price to Book Value
Compelling price to book valuation of approximately 2.2x

11
131% coverage
Assets
40% LiquidAssets
$1,032BN(as at April 30, 2015)
Loan portfolio represents 43% of total balance
sheet excluding
allowances and including sold
MBS as per IFRS
Liabilities & Capital
53% Capital + Retail-related funding
30% Wholesale funding
122% coverage
Derivatives are on balance
sheet as per IFRS
Strength of a high quality liquid balance sheet
Business & Government Deposits
Personal Deposits
Capital
Other Liabilities(2)
Securitization(1) and Covered Bonds
Secured Funding
Unsecured FundingCash and Repos
Trading & Investment Securities
Residential Mortgages(1)
Other Retail Loans
Wholesale Loans
Other Assets(2)
(1) Securitized agency MBS are on balance sheet as per IFRS. (2) Other assets include $107BN of derivatives related assets, largely offset by derivatives related liabilities in Other liabilities. Under IFRS derivative amounts with master netting agreements cannot be offset and the gross derivative assets and liabilities are reported on balance sheet.

12
Key strategic priorities aligned to our long-term goals
Offering a differentiated experience: value for money, advice, access and service Making it easier to do
business with us and be a low cost producer Converging into an
integrated multi-channel network Enhancing client
experience and improving efficiency in the Caribbean and U.S.
Personal & Commercial Banking
Building a high-performing global asset management business Focusing on high net
worth and ultra-high net worth clients to build global leadership Leveraging RBC and
RBC Wealth Management strengths and capabilities
Wealth Management
Strategic goals
Improving distribution efficiency and deepening client relationships through cross-sell Making it easier for
clients to do business with us Pursuing select
international opportunities to grow our reinsurance business
Insurance
Providing excellence in custody and asset servicing, with an integrated funding and liquidity management business Focusing on organic
growth through client relationships, cross-selling and promoting the RBC brand Leveraging I&TS as a
driver of enterprise growth strategies
Investor & Treasury Services (I&TS)
Maintaining our leadership position in Canada Expanding and
strengthening client relationships in the U.S. Building on core
strengths and capabilities in U.K./Europe and Asia Pacific Optimizing capital use
to earn high risk-adjusted returns on assets and equity
Capital Markets
Strategic priorities
In Canada, to be the undisputed leader in financial services Globally, to be a leading provider of capital markets, investor and wealth management
solutions In targeted markets, to be a leading provider of select financial services complementary
to our core strengths

13
Business SegmentsSECTION III

14
2.9 3.0 3.12.1
2.32.40.8
0.8
3.73.6
6.6 6.9 7.3
1.51.5
1.31.2
0.5
0.9
0.4
7.0
13.7
2.5
4.1 4.4 4.5
2.2
2012 2013 2014 YTD 2014 YTD 2015
PFS BFS CPS Caribbean & U.S. Banking Net Income
13.012.4
6.7
Personal & Commercial Banking
Revenue and Net Income($BN)
Business metrics – Q2/2015
(1) Peers include TD, CIBC, BMO and BNS. (2) Based on average balances. PFS: Personal Financial Services; BFS: Business Financial Services; CPS: Cards and Payment Solutions, and; FTE: Full-time equivalent.
RBC continues to be the undisputed leader in financial services in Canada
Personal & Commercial Banking accounts for over 50% of total RBC earnings
#1 or #2 market share in all product categories
Most branches and largest sales force in Canada while maintaining an industry leading efficiency ratio vs. our peer average(1)
Second largest bank by assets(2) in English Caribbean, with branches in 18 countries and territories
Offering a broad range of financial products and services
In the U.S., our cross-border banking business serves the needs of Canadian clients, through online channels as well as U.S. Wealth Management clients
Canada Caribbean & U.S.
Clients (MM) 12.3 1.2
Branches 1,274 87
ATMs 4,608 305
Employees (FTE) 31,117 4,480
Loans & acceptances(2) ($BN) 354.7 9.1
Deposits(2) ($BN) 277.0 17.4
Overview
Net Income Q2/2014: $1.1BNQ2/2015: $1.2BN
15
Global Retail Bank of the Year (2014, 2015) (Retail Banker International)
Bank of the Year in Canada 2014 (The Banker)
Best Trade Finance Bank in Canada 2015 for the third consecutive year (Global Finance)
Best Private Banking Services Overall in Canada for eight years in a row (Euromoney)
Recognized as #1 most valuable brand in Canada (Brand Finance)
Recognized as one of the Best Workplaces in Canada for 2015 (Great Place to Work® Institute)
Best Private Bank in Canada and the Caribbean 2014 (Professional Wealth Management)
Recent awards
Offering a differentiated experience
Be the undisputed leader in Canada and continue to grow volume at a premium to peers Demonstrate the value for money that sets RBC apart through quality of advice and service, and industry-leading convenience
and access
Converging into an integrated multi-channel network
Leveraging our unparalleled distribution breadth (e.g. most branches and ATMs in Canada), internal capabilities and strategicexternal partnerships to maintain our market leadership and extend our sales power
Adapting our distribution network to ongoing changes in client preferences, including designing applications, processes and products for online and mobile channels
Making it easier to do business with us
Maintain focus on digitizing the bank and simplifying our end-to-end processes Make it simpler and easier for clients to do business with us through self, assisted and full-serve options Invest in skills, accreditation and engagement of our employees to enable us to compete more effectively
Personal & Commercial Banking – Canada
16
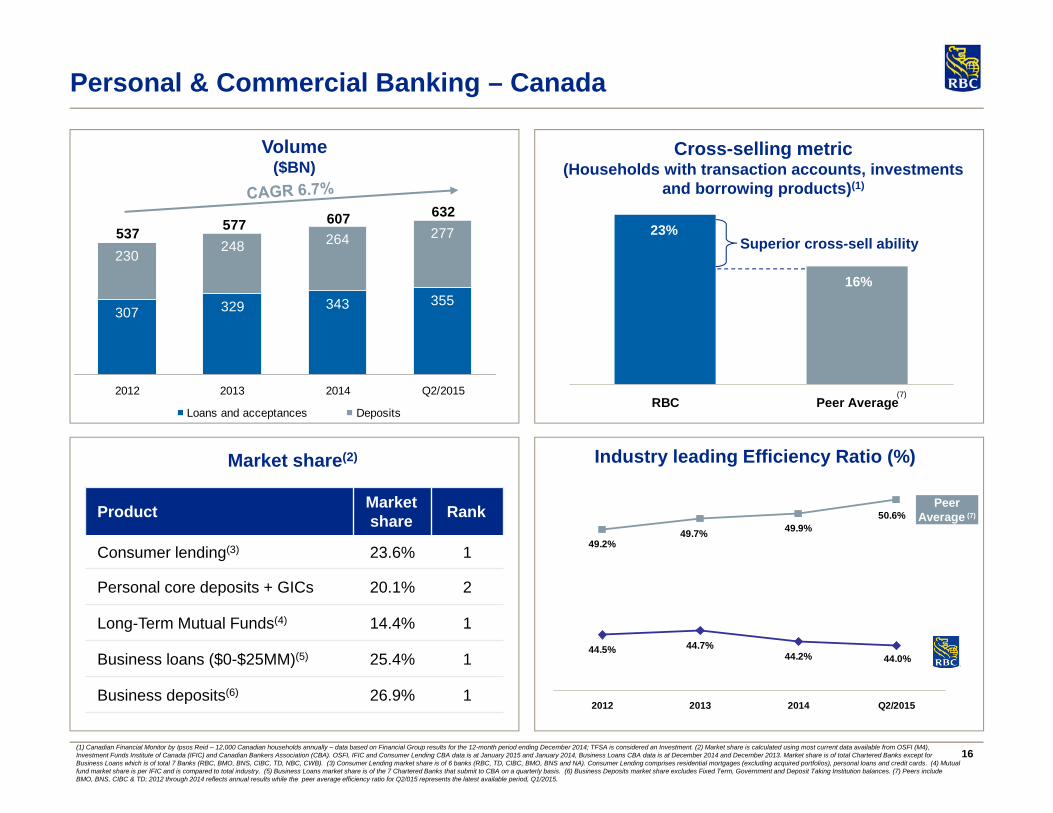
49.2%49.9%
44.5% 44.7%44.2%
50.6%
49.7%
44.0%
2012 2013 2014 Q2/2015
Volume($BN)
Market share(2)
Product Market share Rank
Consumer lending(3) 23.6% 1
Personal core deposits + GICs 20.1% 2
Long-Term Mutual Funds(4) 14.4% 1
Business loans ($0-$25MM)(5) 25.4% 1
Business deposits(6) 26.9% 1
Industry leading Efficiency Ratio (%)
Peer Average (7)
307 329 343 355
230248 264 277
632607577537
2012 2013 2014 Q2/2015
Loans and acceptances Deposits
Cross-selling metric(Households with transaction accounts, investments
and borrowing products)(1)
(7)
Personal & Commercial Banking – Canada
(1) Canadian Financial Monitor by Ipsos Reid – 12,000 Canadian households annually – data based on Financial Group results for the 12-month period ending December 2014; TFSA is considered an Investment. (2) Market share is calculated using most current data available from OSFI (M4), Investment Funds Institute of Canada (IFIC) and Canadian Bankers Association (CBA). OSFI, IFIC and Consumer Lending CBA data is at January 2015 and January 2014, Business Loans CBA data is at December 2014 and December 2013. Market share is of total Chartered Banks except for Business Loans which is of total 7 Banks (RBC, BMO, BNS, CIBC, TD, NBC, CWB). (3) Consumer Lending market share is of 6 banks (RBC, TD, CIBC, BMO, BNS and NA). Consumer Lending comprises residential mortgages (excluding acquired portfolios), personal loans and credit cards. (4) Mutual fund market share is per IFIC and is compared to total industry. (5) Business Loans market share is of the 7 Chartered Banks that submit to CBA on a quarterly basis. (6) Business Deposits market share excludes Fixed Term, Government and Deposit Taking Institution balances. (7) Peers include BMO, BNS, CIBC & TD; 2012 through 2014 reflects annual results while the peer average efficiency ratio for Q2/015 represents the latest available period, Q1/2015.
23%
16%
RBC Peer Average
Superior cross-sell ability

17
Wealth Management
Recent awards / rankings
Building a high performing global asset management business
Focusing on HNW and UHNW client segments to extend our industry-leading share of HNW client assets in Canada and expand share globally
Driving strong advisor productivity as a leader in fee-based assets per advisor(1)
Client assets at $1.2 trillion in Q2/2015, a 10% YoY increase
Grew AUA by 11% and AUM by 15% since 2012 (CAGR)
Currently realigning our International Wealth businesses
Leveraging Canadian strengths to build global leadership
AUA & AUM($BN)
578
718 748
340387
452 481
639
2012 2013 2014 Q2/2015
AUA AUM
Revenue and Net Income($MM)
Cash Earnings($MM)
1,741 1,8892,186
1,9772,225
2,430
1,394
1,1171,373
1,697
1,1031,048
1,191
917850
1,083501513753 886
3,4143,089
6,3135,487
4,835
2012 2013 2014 YTD Q2/2014 YTD Q2/2015
Canadian WM U.S. & International WM GAM Net Income
Net IncomeQ2/2014: $278MMQ2/2015: $271MM
819
1,161 1,151
953
2012 2013 2014 LTM Q2/2015
(1) Investor Economics Report published in April 2015. HNW: High net worth; UHNW: Ultra-high net worth; AUA: Assets under administration; and, AUM: Assets under management.
Top 5 Global Wealth Manager by assets (Scorpio)
Best Private Banking Services Overall – Canada, Caribbean, Cayman Islands, Jersey (Euromoney)
Outstanding Wealth Manager – Customer Relationship Service and Engagement (Private Banker International)
Private Bank of the Year, Caribbean (Citywealth International Financial Centre Awards)
Leading Canadian Private Bank; Best Wealth Structuring Offering (Family Wealth Report Awards)
Wealth Planning Team of the Year (Wealth Briefing European Awards)
Top 25 Most Admired Companies (Private Client Practitioner)
Best Bank-owned Brokerage Firm in Canada (International Executive Brokerage Report Card)

18
Wealth Management – Global Asset Management
Driving top-tier profitability in our largest Wealth Management business Over $375BN in client assets, generating ~60% of RBC Wealth Management earnings on a full year basis Investor asset mix of 45% Individual / 55% Institutional client assets Top 5 global asset manager by assets(1)
Extending our lead in Canada Largest fund company in Canada with 14.6% market share; leader in last twelve months of asset inflows(2)
Top quartile retail mutual fund performance, with 86% of AUM in 1st or 2nd quartile(3)
Third largest institutional pension asset manager in Canada(4)
Expanding our global solutions and capabilities Distribution strength in North America meeting with continued success offering differentiated international capabilities to our
institutional clients Bringing to market capability of global equities team hired in 2014
Building a high-performing global asset management business
Annual AUM Growth: RBC GAM vs. Worldwide AM Industry(5)
29%
9%
(1%)
27% 28%
15% 12%
8%
1%
11% 13%
7%
2009 2010 2011 2012 2013 Jun-14
RBC GAM Industry
(1) 2014 Retail Banker International and Global Finance. (2) Investment Funds Institute of Canada (IFIC) as at March 2015 and RBC reporting. (3) As at April 2015. Based on a blended 1/3/5 year basis, gross of fees, against RBC Global Asset Management peer group. (4) Benefits Canada as at December 31, 2014. (5) Boston Consulting Group, McKinsey. AUM of RBC GAM acquisitions deducted in year of acquisition, and thereafter.
AUM by Client Segment ($BN)(5)
$86
$ 370
Int’l Institutional
CDN RetailCDN InstitutionalU.S. Institutional
13%
22%
46%
20%
2007 Q2/2015

19
$67
$32
RBC Cdn Peer Average
Over 2.1x the peer average
Wealth Management
Extending our #1 position Grew HNW market share by ~400 bps to 19% in the last four years(1) with
momentum and anticipate reaching 20% market share by 2016
Maintaining profitable growth in a challenging market Generating ~30% of RBC Wealth Management earnings with strong pre-
tax margin, highest among North American peers(3)
Driving strong advisor productivity Canadian leader in fee-based assets per advisor(1)
Consistently driving revenue per advisor of over $1.2MM per year, 42% above Canadian industry average(1)
Competitive hires delivering strong new asset growth Leveraging Enterprise linkages to continue to extend market share gains
Canada – Extending our industry leadership
U.S. & International Loans(4) & Deposits United States
Steadily increasing advisor productivity Growing complementary distribution through successfully
recruiting revenue producers and establishing new clearing relationships
Improving operational efficiencies and leveraging RBC’s global capabilities to broaden our product offering
Outside North America Refocusing on UHNW and HNW client acquisitions from select
markets where we have scale Leveraging RBC’s global capabilities (Global Asset Management
and Capital Markets) Optimizing our operating model to drive long-term performance
Strong growth in our credit and deposit taking businesses
Average Balances($BN)
Fee-based assets per advisor(2)
($MM)
17.915.712.1
9.9
2012 2013 2014 Q2/2015Loans Deposits
36.2
29.231.9
40.6
(1) Investor Economics report on RBC’s full wealth and investment offering in Canada, April 2015. (2) Investor Economics report, April 2015. (3) As per BCG Global Wealth Manager Benchmarking 2014, based on 2013 results. (4) Total average loans & acceptances.

20
InsuranceWe provide a wide range of life, health, home, auto, travel and wealth accumulation solutions to individual and group clients
across Canada and offer reinsurance solutions for clients globally
Improving distribution efficiency
Delivering multi-line “insurance advice for your life” through an integrated product portfolio Strengthen profitability in all channels by increasing sales and managing expenses
Deepening client relationships
Providing a comprehensive suite of RBC Insurance products and services through cross-sell strategies to continue to meet our clients’ unique insurance needs
Simplifying the way we do business
Enhancing and streamlining all processes to ensure that clients find it easy to do business with us
Pursuing select international opportunities to grow our reinsurance business
Pursuing niche opportunities, diversifying risks and growing our reinsurance business to generate stable and diversified earnings
Revenue and Net Income($MM)
Premiums and Deposits(1)($MM)
(1) Acquisition Expense Ratio calculated as Total Acquisition Expense/Net Premiums. (2) Adjusted net income excludes a Q4/2013 charge of $160MM ($118MM after-tax) as a result of new tax legislation in Canada. This is a non-GAAP measure. For additional information, see slide 38. (3) YTD Q2/15 revenue included the net impact of the FV change ($475MM) due to the decline in interest rates.
2,992
1,962
2,911
1,905 2,053
1,3941,827
1,966
1,013 871
308713
595
781
311
2012 2013 2014 YTD Q2/2014 YTD Q2/2015
Canada International & Other Net Income
2,362 2,344 2,4191,167 1,278
2,487 2,580 2,745
1,369 1,177
15.3%12.5% 10.1%
02004006008001,0001,2001,4001,6001,8002,0002,2002,4002,6002,8003,0003,2003,4003,6003,8004,0004,2004,4004,6004,8005,0005,2005,4005,6005,8006,0006,2006,4006,6006,8007,0007,2007,4007,6007,8008,000
2012 2013 2014 YTDQ2/2014
YTDQ2/2015
(0)(0)(0)(0)(0)(0)(0)(0)(0)(0)00000000000000000000
Canadian Insurance International Insurance Acquisition Expense Ratio
4,849 4,924
Net IncomeQ2/2014: $154MMQ2/2015: $123MM
4,897
5,164
4,964
3,928
Adjusted Net Income(2)
(3)
713
2,4552,5362,407 2,698

21
Investor & Treasury Services
Key businesses Business objectives
In Canada, to be the #1 provider of domestic custody, asset servicing and cash management services
Compete in offshore domicile markets, as a leading provider of fund services from centers of excellence in Luxembourg and Ireland
Maintain a selective presence in global markets, in support of Investor & Treasury Services’ global offshore strategy
Deliver operational excellence globally; providing best in class solutions with a continued focus on operating efficiency
Specialist provider of asset services, custody, payments and treasury services for financial and other institutional investors worldwide Top 10 global custodian by AUA Awarded Best Custodian Overall, #1 Custodian in
North America(1), #1 Custodian in Europe, and Transfer Agent of the Year(2)
Canadian leader in cash management, correspondent banking and trade finance for financial institutions (processing >50% of all payments into Canada)
Funding and liquidity management for RBC
Assets under administration(4)
($BN)Revenue and Net Income
($MM)Efficiency Ratio
(%)
77% 75%
68%
61%
2012 2013 2014 YTD Q2/2015
905 9281,034
1,804 1,884
301218
441
339102
2012 2013 2014 YTD Q2/2014 YTD Q2/2015
Revenue Net Income Adjusted Net Income
Net IncomeQ2/2015: $159MMQ2/2014: $112MM
2,887
3,209
3,703
2012 2013 2014 Q2/2015
3,847
315 370
(3)
(1) Custody Risk European Awards 2014. (2) Global Investor/ISF magazine’s Global Custody Survey 2014. (3) Adjusted net income excludes a loss of $224MM ($213MM after-tax) related to our acquisition of the remaining 50% stake of RBC Dexia in Q3/2012 and $44 MM ($31MM after-tax) related to the integration of Investor Services in Q2/2013. These are non-GAAP measures. For additional information, see slide 38. (4) Spot balances, as at April 30, 2015.

22
Capital Markets
Full suite of integrated Corporate and Investment Banking and Global Markets services
Strategically positioned in the largest financial centers, covering 90% of global investment banking fee pool(1)
Top talent with expertise and track record of excellence
A premier North American investment bank with select global reach
Revenue by geography(Q2/2015)
Canada United States U.K./Europe Asia Pacific
Full suite of products and services across all sectors
Full service investment bank with equity and fixed
income sales & trading
M&A advisory and origination in key sectors with fixed income, equity
and FX sales & trading
Primarily distribution with select M&A advisory and
origination
(1) Thomson Reuters Global Banking Review 2014. (2) Other Revenue not depicted on the graph, but included in Total Revenue and Net Income.
U.S.U.S.
Canada
27% 57%
13%
3%
U.S.Canada
U.K./Europe
Asia Pacific
Revenue and Net Income(2)
($MM)
3,538 3,3143,896
2,472
3,437
1,991
3,0142,533
1,844
1,700 2,0551,576
1,012 1,219
2012 2013 2014 YTD Q2/2014 YTD Q2/2015
Global Markets Corporate and Investment Banking Net Income
1,626
Net IncomeQ2/2015: $625MMQ2/2014: $507MM
6,188 6,580
7,366
3,6824,280
23
Capital MarketsMaintaining our leadership position in Canada
Focus on long-term client relationships and leverage our strong cross-border capabilities Increase focus on cross-selling products and services, and winning through collaborative efforts
Expanding and strengthening client relationships in the U.S.
Build on our momentum and leverage broader relationships and client investments to expand origination, advisory, and distribution
Increase focus on deepening relationships with existing clients to drive cross-sell
Building on core strengths and capabilities in U.K./Europe and Asia Pacific
Grow prudently by developing strong client relationships and selectively expanding geographic and sector coverage
Optimizing capital use to earn high risk-adjusted returns on assets and equity
Maintain mix between investment banking and lending revenue and trading revenue Maintain disciplined diligence on the risks and costs of our business
11th largest by global investment bank fees (Thomson Reuters, 2014) Global #1 Trusted Investment Bank and #2 for Expertise and Skills (The Economist, 2014) Best Investment Bank in Canada across Equity, Debt and M&A for 7th consecutive year (Euromoney, 2014) Best Global Issuer, Covered Bonds (GlobalCapital – The Cover, 2014) Canadian Fixed Income Sales & Trading Quality Leader, Canadian Fixed Income Market Share Leader (Greenwich Associates, 2014) Leading Canadian Equities platform – ranked #1 in 2014 for Overall Trading Quality and #1 for Sales Quality (Greenwich Associates, 2015) Top Equity Research franchise in Canada – ranked #1 for five consecutive years (Brendan Wood International, 2014) Best Bank for Fixed Income Research and Strategy (Technical Analyst Awards, 2015)
Recent awards / Rankings

24
Capital Markets
(1) Average loans & acceptances, and letters of credit and guarantees for our Capital Markets portfolio, on single name basis. It excludes mortgage investments, securitized mortgages and other non-core items.
Global Markets Revenue($MM)
Corporate and Investment Banking Revenue($MM)
Loans Outstanding by Region(1)
($BN, average)Capital Markets Trading Securities
($BN, average)
1,9831,680
765778
1,760
9911,116
1,118856
790
560757
1,017
440 599
2,4721,991
3,5383,314
3,896
2012 2013 2014 YTD Q2/2014 YTD Q2/2015
FICC Global Equities Repo and secured financing
1,307 1,574 1,736
811 946
1,2261,440
1,701
815898
2,533
3,0143,437
1,6261,844
2012 2013 2014 YTD Q2/2014 YTD Q2/2015
Investment Banking Lending and Other
119
103101101 99106 105
118
Q3/2013 Q4/2013 Q1/2014 Q2/2014 Q3/2014 Q4/2014 Q1/2015 Q2/2015
19 20 21 22 21 21 22 23
24 25 28 30 30 31 34 376 7
78 10 10
1213
4952
5660 61 62
6873
Q3/2013 Q4/2013 Q1/2014 Q2/2014 Q3/2014 Q4/2014 Q1/2015 Q2/2015
Canada U.S. Other International Total

25
Announced Acquisition of City NationalSECTION IV
26
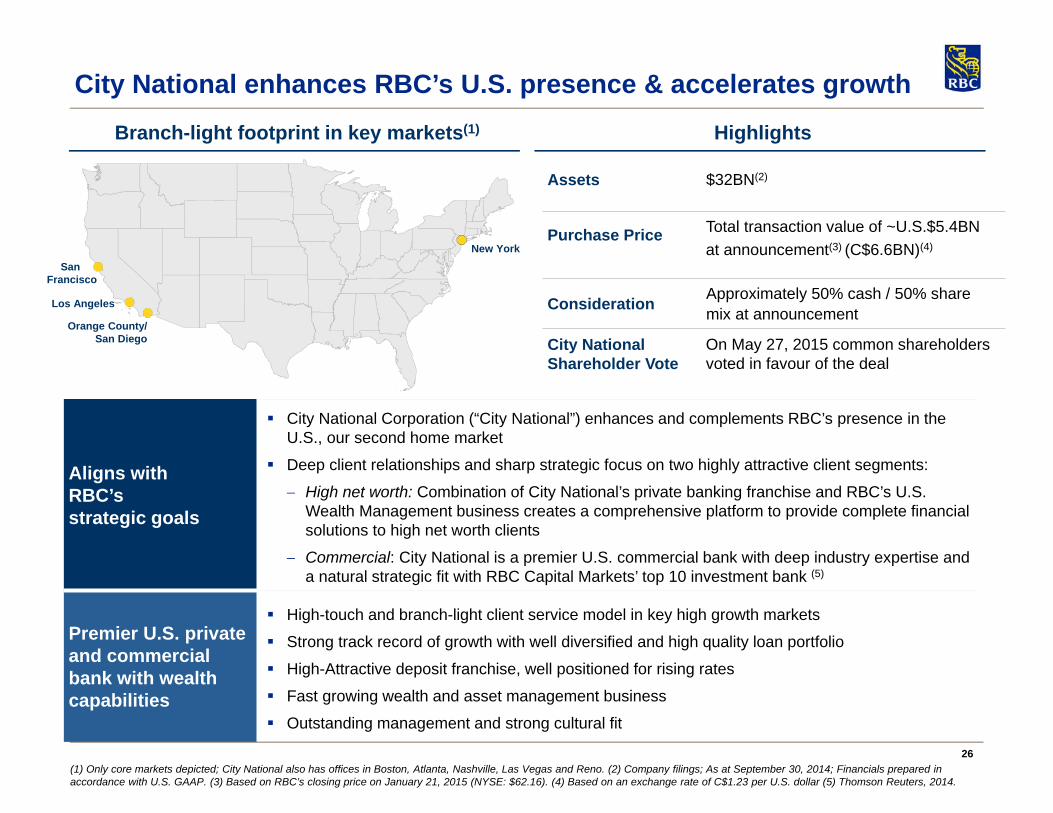
City National enhances RBC’s U.S. presence & accelerates growth
Aligns withRBC’sstrategic goals
City National Corporation (“City National”) enhances and complements RBC’s presence in the U.S., our second home market
Deep client relationships and sharp strategic focus on two highly attractive client segments:
High net worth: Combination of City National’s private banking franchise and RBC’s U.S. Wealth Management business creates a comprehensive platform to provide complete financial solutions to high net worth clients
Commercial: City National is a premier U.S. commercial bank with deep industry expertise and a natural strategic fit with RBC Capital Markets’ top 10 investment bank (5)
Premier U.S. private and commercial bank with wealth capabilities
High-touch and branch-light client service model in key high growth markets
Strong track record of growth with well diversified and high quality loan portfolio
High-Attractive deposit franchise, well positioned for rising rates
Fast growing wealth and asset management business
Outstanding management and strong cultural fit
HighlightsBranch-light footprint in key markets(1)
San Francisco
Los Angeles
New York
Orange County/San Diego
Assets $32BN(2)
Purchase Price Total transaction value of ~U.S.$5.4BN at announcement(3) (C$6.6BN)(4)
Consideration Approximately 50% cash / 50% sharemix at announcement
City National Shareholder Vote
On May 27, 2015 common shareholders voted in favour of the deal
(1) Only core markets depicted; City National also has offices in Boston, Atlanta, Nashville, Las Vegas and Reno. (2) Company filings; As at September 30, 2014; Financials prepared in accordance with U.S. GAAP. (3) Based on RBC’s closing price on January 21, 2015 (NYSE: $62.16). (4) Based on an exchange rate of C$1.23 per U.S. dollar (5) Thomson Reuters, 2014.

27
Expanding into U.S. private & commercial banking
Introducing City National’s full suite of U.S. private and commercial banking products andservices to RBC clients ~340,000 RBC U.S. Wealth Management households ~204,000 RBC Canadian cross-border clients ~88,000 RBC Canadian commercial clients
Enhancing U.S. wealth & asset management platform
Adding scale in wealth and asset management – Combined U.S.-based client assets of ~$350BN Brings RBC’s Wealth Management segment to over $1.2 trillion in client assets globally
Expanding the distribution channels for RBC and City National wealth management products ~2,100 combined advisors
Accessing RBC Capital Markets’ advisory, capital raising and risk management capabilities
Extending full commercial & corporate capabilities
Extending full commercial and corporate capabilities to City National’s key industry verticals (entertainment, real estate, technology and healthcare) Vertical alignment allowing for greater depth
Leveraging RBC Capital Markets’ market-leading platform into additional industry verticals forCity National
Replicate RBC’s successful Canadian referral model between Commercial Banking andCapital Markets with City National and RBC Capital Markets
Expense synergies Consolidation of non-client facing infrastructure across City National, RBC Wealth Management and other RBC businesses
Achieving scale benefits in procurement, technology and other functional areas Improving productivity via cross-sell and referrals
Deposit synergies Ability to attract additional deposits from RBC Wealth Management and Capital Markets clients Utilize low cost sweep balances from RBC U.S. Wealth Management as an additional competitive
funding advantage to support future loan growth
Growth initiatives Introducing City National’s private and commercial banking solutions through RBC’s U.S. Wealth Management advisor and client base
Leveraging RBC’s platform and financial strength to increase City National’s market penetration Accelerating expansion into other new high-growth markets through an expanded network
City National acquisition creates a powerful & scalable engine for growth in the U.S.
Note: The data on this slide, including client assets, number of clients, and number of advisors represents the most currently available data as of April 30, 2015.

28
Global Funding StrategySECTION V

29
Gaining Canadian market share
Initiated successful strategies to grow relationship deposit base
Leveraging our Wealth Management network with targeted strategies and product development
Canadian relationship deposits continue to grow at a faster pace than the market
Between October 2010 and January 2015, our share of the Canadian personal deposit market has grown from 18.7% to 20.1%(1)
RBC Relationship Deposits($BN)
(1) Canadian deposit market is based on Canadian Banking personal deposits and Wealth Management advisory channel deposits. Source: OSFI (M4 report). (2) High Interest Savings Account; Includes CAD and USD deposits. (3) Sourced largely from RBC Wealth Management network.
RBC Canadian Deposits($BN)
Leveraging our international reach
Strong deposit growth in our International Wealth Management and Investor Services platforms
Leveraging the strength of our distribution channels
Oct 2010 Apr 2015
HISA(2) $18 $28
Advisory Channel Deposits(3) $13 $32
Other Personal Deposits $131 $156
Business Deposits $131 $190
Total Deposits $293 $406
Strong deposit growth is a result of successful initiatives & strong distribution network
30
50
70
90
110
130
150
170
Jan-07 Apr-08 Jul-09 Oct-10 Jan-12 Apr-13
Aver
age
Bal
ance
s ($
B C
AD)
6.78% CAGR
8.71% CAGR
Cdn Business Deposits
Cdn Personal Deposits
Nov-14
30
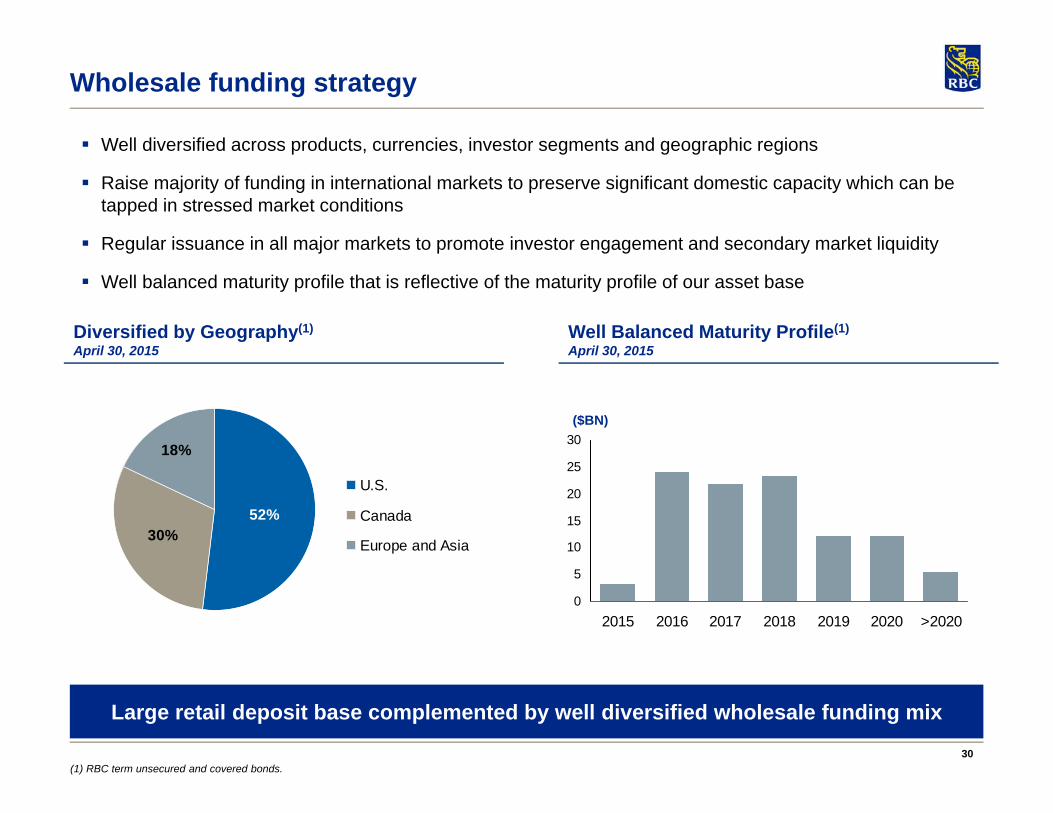
Wholesale funding strategy
52%30%
18%
U.S.
Canada
Europe and Asia
(1) RBC term unsecured and covered bonds.
Well diversified across products, currencies, investor segments and geographic regions
Raise majority of funding in international markets to preserve significant domestic capacity which can be tapped in stressed market conditions
Regular issuance in all major markets to promote investor engagement and secondary market liquidity
Well balanced maturity profile that is reflective of the maturity profile of our asset base
Diversified by Geography(1)
April 30, 2015Well Balanced Maturity Profile(1)
April 30, 2015
0
5
10
15
20
25
30
2015 2016 2017 2018 2019 2020 >2020
Large retail deposit base complemented by well diversified wholesale funding mix
($BN)
31
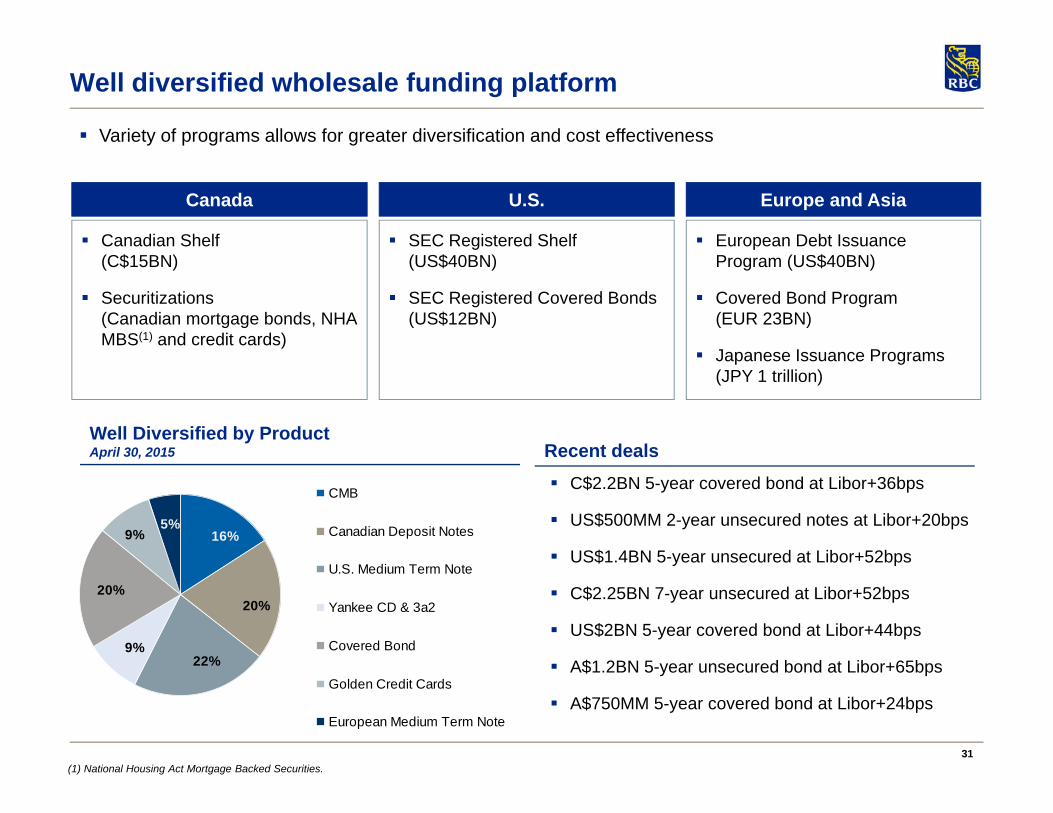
5%9%
20%
9%22%
20%
16%
CMB
Canadian Deposit Notes
U.S. Medium Term Note
Yankee CD & 3a2
Covered Bond
Golden Credit Cards
European Medium Term Note
Variety of programs allows for greater diversification and cost effectiveness
Well diversified wholesale funding platform
(1) National Housing Act Mortgage Backed Securities.
Well Diversified by ProductApril 30, 2015
C$2.2BN 5-year covered bond at Libor+36bps
US$500MM 2-year unsecured notes at Libor+20bps
US$1.4BN 5-year unsecured at Libor+52bps
C$2.25BN 7-year unsecured at Libor+52bps
US$2BN 5-year covered bond at Libor+44bps
A$1.2BN 5-year unsecured bond at Libor+65bps
A$750MM 5-year covered bond at Libor+24bps
Recent deals
SEC Registered Shelf (US$40BN)
SEC Registered Covered Bonds (US$12BN)
U.S.
European Debt Issuance Program (US$40BN)
Covered Bond Program (EUR 23BN)
Japanese Issuance Programs (JPY 1 trillion)
Europe and Asia
Canadian Shelf (C$15BN)
Securitizations (Canadian mortgage bonds, NHA MBS(1) and credit cards)
Canada

32
RBC Covered Bond Program
U.S. Registration
U.S. covered bond program is SEC registered
Issued US$11.5BN across six deals since September 2012
Index eligible and Trace eligible
Strong Issuer
Largest Canadian bank by market capitalization
Strong credit ratings
Well capitalized and consistent historical profitability
Well diversified business mix
Canadian Legislative Changes
New Canadian legislation protects claims of covered bond investors and overrides any other conflicting law related to bankruptcy and insolvency
Extensive regulatory oversight and pool audit requirements
Mandatory property value indexation
Globally Active
Active program in five different currencies: EUR, CAD, USD, CHF and AUD
C$28BN currently outstanding
Six benchmark transactions since January 2014
C$2.2BN 5-year EUR 1.0BN 5-year
US$2.0BN 5-year US$2.0BN 5-year
US$1.75BN 5-year A$750MM 5-year
33
Canadian Housing MarketSECTION VI
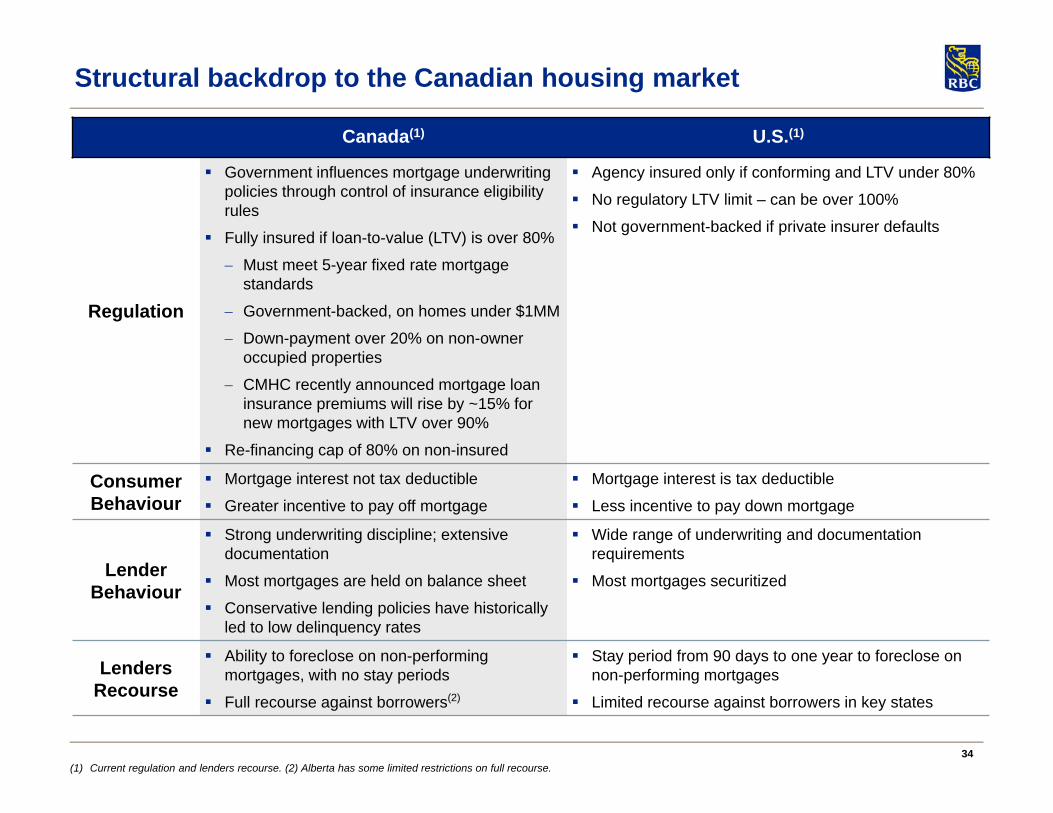
34(1) Current regulation and lenders recourse. (2) Alberta has some limited restrictions on full recourse.
Structural backdrop to the Canadian housing market
Canada(1) U.S.(1)
Regulation
Government influences mortgage underwriting policies through control of insurance eligibility rules
Fully insured if loan-to-value (LTV) is over 80%
Must meet 5-year fixed rate mortgage standards
Government-backed, on homes under $1MM
Down-payment over 20% on non-owner occupied properties
CMHC recently announced mortgage loan insurance premiums will rise by ~15% for new mortgages with LTV over 90%
Re-financing cap of 80% on non-insured
Agency insured only if conforming and LTV under 80%
No regulatory LTV limit – can be over 100%
Not government-backed if private insurer defaults
Consumer Behaviour
Mortgage interest not tax deductible
Greater incentive to pay off mortgage
Mortgage interest is tax deductible
Less incentive to pay down mortgage
Lender Behaviour
Strong underwriting discipline; extensive documentation
Most mortgages are held on balance sheet
Conservative lending policies have historically led to low delinquency rates
Wide range of underwriting and documentation requirements
Most mortgages securitized
Lenders Recourse
Ability to foreclose on non-performing mortgages, with no stay periods
Full recourse against borrowers(2)
Stay period from 90 days to one year to foreclose on non-performing mortgages
Limited recourse against borrowers in key states

35
Undeveloped land around Toronto / Vancouver is limited, causing shift to centralized condo housing
‘Green belt’ surrounding Toronto has limited urban sprawl and increased demand for condos in the core
Vancouver is restricted in its ability for urban sprawl due to land constraints away from the city centre
Canada has one of the highest per capita rates of permanent immigration in the world(1)
20.6% of Canada’s population is foreign born (6.8 million), highest proportion among the G8 nations(1)
60% of all new immigrants to Canada move to Toronto, Vancouver or Montreal(1)
RBC’s exposure to condo development is limited – about 2% of our total commercial loan book(2)
Condo exposure is 9.7% of our Canadian residential mortgage portfolio(3)
The Toronto and Vancouver downtown condo markets
“Green belt” surrounding Greater Toronto area Vancouver limited by mountains, sea, U.S. border
(1) Citizenship and Immigration Canada 2013, Statistics Canada. (2) As at April 30, 2015. (3) Based on $196BN in residential mortgages and $43BN in Canadian Banking HELOC as at April 30, 2015.

36
6
7
8
9
10
11
12
1990 1992 1994 1996 1998 2000 2002 2004 2006 2008 2010 2012 20140.00
0.10
0.20
0.30
0.40
0.50
0.60
0.70
0.80
0.90
1.00
1991 1993 1995 1997 1999 2001 2003 2005 2007 2009 2011 2013 2015
Balanced
Buyer's Market
Seller's Market
Canadian housing market fundamentals remain sound
Balanced demand-supply conditions continue to prevail in the vast majority of markets in Canada
Housing affordability is at reasonable levels across Canada with pressure concentrated in a few local markets
Steady population growth, household income gains and low interest rates are supporting balanced conditions Policy measures promote a healthy housing market
A slowdown in housing market activity in oil-producing provinces (Alberta, Saskatchewan) should be offset by strength in other regions of the country (net oil consumers)
Over the forecast horizon, we remain of the view that an erosion of housing affordability on account of rising interest rates will weigh on overall housing activity, which is expected to gradually ease to lower, more sustainable levels
Household debt service cost ratios remain historically low, with little movement towards higher risk
Lenders maintaining strong underwriting discipline and require extensive documentation Most mortgages being held on balance sheet and conservative lending policies have led to low delinquency rates
Sales-to-New Listings Ratio(1)
(Residential unit sales to new residential listings)
(1) Canadian Real Estate Association, RBC Economics Research. (2) Statistics Canada, RBC Economics Research. PDI: Personal Disposable Income.
Household Debt Service Costs(2)
(Mortgage & non-mortgage interest payments as a % of PDI)

37
0
2
4
6
8
10
12
14
16
18
1990 1992 1994 1996 1998 2000 2002 2004 2006 2008 2010 2012 2014 0
1
2
3
4
5
6
1990 1992 1994 1996 1998 2000 2002 2004 2006 2008 2010 2012 2014
35
40
45
50
55
60
65
70
75
80
1990 1992 1994 1996 1998 2000 2002 2004 2006 2008 2010 2012 2014
Canadians have significant equity ownership in their homes
U.S.Canada
(1) Statistics Canada, Federal Reserve Board, RBC Economics Research. (2) Bank of Canada, RBC Economics Research. (3) Canadian Bankers' Association, Mortgage Bankers’ Association, RBC Economics Research.
Canadians carry a significant and stable amount of equity in their homes
The pace of mortgage accumulation has stabilized to a more sustainable range of growth
Mortgage delinquency rates remain low in Canada and have been stable throughout recent credit cycles
RBC monitors its residential mortgage and broader retail portfolios closely and performs stress tests for dramatic movements in house prices, GDP, interest rates and unemployment rates
U.S.Canada
Equity Ownership(1)(Owners’ equity as a % of total value of residential real estate assets)
Mortgage Delinquencies(3) (Mortgages 90+ days in arrears as a % of total mortgages)
Residential Mortgage Growth(2) (Year-over-year % change)

38
Note to users
Amy Cairncross, VP & Head (416) 955-7803Lynda Gauthier, Director (416) 955-7808Stephanie Phillips, Director (416) 955-7809
www.rbc.com/investorrelations
Investor Relations Contacts
We use a variety of financial measures to evaluate our performance. In addition to generally accepted accounting principles (GAAP) prescribed measures, we use certain key performance and non-GAAP measures we believe provide useful information to investors regarding our financial condition and result of operations. Readers are cautioned that key performance measures, such as ROE and non-GAAP measures such as earnings and revenue excluding Corporate Support, earnings in Q2/2015 excluding a specified item related to the release of foreign currency translation adjustment (CTA) that was previously booked in other components of equity, as well as specified items related to sale of RBC Jamaica as previously announced in Q1/2014, and provisions related to post-employment benefits and restructuring charges in the Caribbean, adjusted net interest margin and Capital Markets trading and geographic revenue excluding specified items do not have any standardized meanings prescribed by GAAP, and therefore are unlikely to be comparable to similar measures disclosed by other financial institutions.
Additional information about our ROE and non-GAAP measures can be found under the “Key performance and non-GAAP measures” section of our Q2/2015 Report to Shareholders and 2014 Annual Report.
Definitions can be found under the “Glossary” sections in our Q2/2015 Supplementary Financial Information and our 2014 Annual Report.