2017 Public quarterly report2nd Quarter 2017
General information
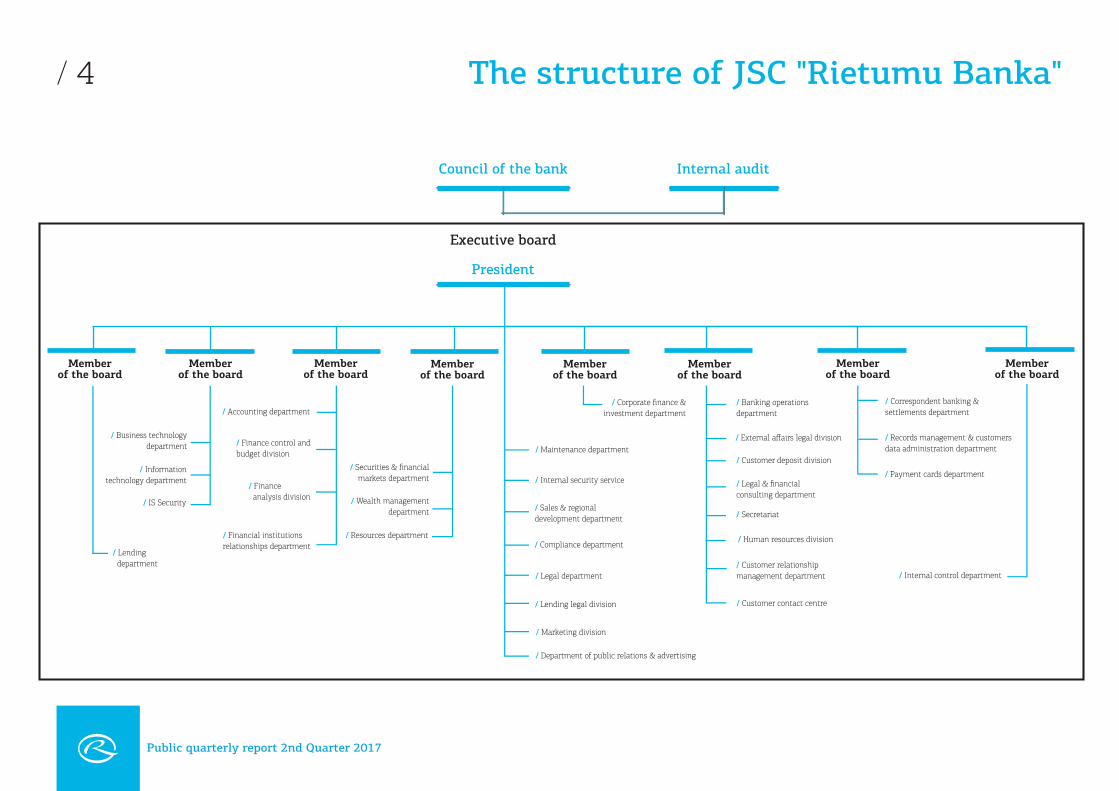
The structure of JSC Rietumu Banka
Shareholders of the BankThe Council of Rietumu BankThe Board of Directors
Consolidation group
Bank's Financial performance
Income statement
Condensed Balance Sheet
Profitability ratios
Regulatory requirements and ratios
Financial ratios
Report of equity and minimum capital requirements
Liquidity ratio calculation
Risk management
Attachments
Contents
/ 3
/ 4
/ 5
/ 6-7
/ 8
/ 8-11
/ 12
/ 13
Public quarterly report 2nd Quarter 2017
/ 3 General information
The Bank offers qualitative and professional financial services for the dynamically growing enterprises and high-net-worth individuals from Latvia, the CIS, Europe and other world regions. The Bank aims at providing premium quality service, our personalised and customer-oriented approach allows to devise and offer tailored finan-cial solutions for every customer meeting his/her business needs and personal requirements.
The Bank endeavors to strengthen its leading positions in wealth management and corporate client service in Latvia and beyond. The Bank aspires to increase its efficiency ratios and strengthen its market position aiming at ensuring stable profitability. The Bank seeks the stable development achieved by means of effective inter-nal technology and administrative infrastructure. The Bank is also planning to foster the improvement of risks and control management systems, staff training and professional growth of all its employees. Rietumu is a socially responsible Latvian bank rendering support for those in need through our Rietumu Bank Charity Fund.
Mission
Vision
Cooperation with customers working on international scale, customers who own production companies, distribution networks, retail chains, transportation and real estate enterprises, import and export oriented companies, as well as customers with cross-border business requirements, etc. Assets and wealth management, brokerage services for stock exchange, investment and corporate finance, provision of loans to corporate entities, interbank lending and investment in securities, attraction of interbank loans, corporate and private deposits attraction.
Constantly raising customer service quality by improving and expanding the existing product range according to the current market situation and the Bank’s technological capabilities.
Continually improving the internal processes and information technologies.
/
/
/
/
For achieving the set goals, the Bank has worked out and has been effectively implementing its corporate strategy focusing on the following areas:
The information about Rietumu Bank Wolrdwide offices can be found: http://www.rietumu.com/bank-offices
Strategy
Bank offices
Public quarterly report 2nd Quarter 2017
/ 4 The structure of JSC "Rietumu Banka"
Public quarterly report 2nd Quarter 2017
President
Council of the bank Internal audit
Executive board
/ Maintenance department
/ Lending department
Member of the board
/ Internal security service
/ Human resources division/ Compliance department
/ Legal department
/ Lending legal division
/ Marketing division
/ Department of public relations & advertising
/ Business technology department
/ Information technology department
/ IS Security
/ Accounting department
/ Finance control and budget division
/ Finance analysis division
/ Securities & financial markets department
/ Wealth management department
/ Resources department
/ Corporate finance & investment department
/ Legal & financial consulting department
/ Sales & regional development department / Secretariat
/ Banking operations department
/ Correspondent banking & settlements department
/ Records management & customers data administration department
/ Payment cards department
/ Customer relationship management department
/ Customer contact centre
Member of the board
Member of the board
Member of the board
Member of the board
Member of the board
Member of the board
/ Internal control department
Member of the board
/ External affairs legal division
/ Customer deposit division
/ Financial institutionsrelationships department
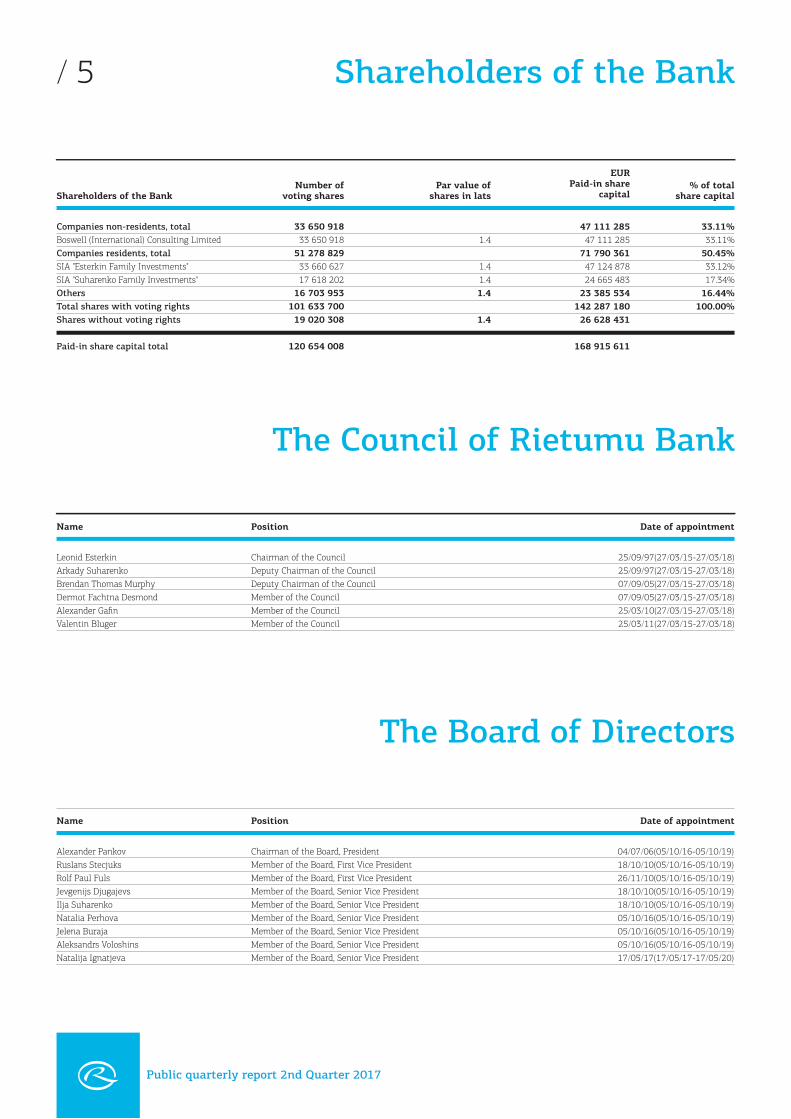
/ 5 Shareholders of the Bank
Number ofvoting sharesShareholders of the Bank
Par value ofshares in lats
% of total share capital
33 650 91833 650 918
51 278 82933 660 62717 618 202
16 703 953101 633 700
19 020 308
120 654 008
Companies non-residents, totalBoswell (International) Consulting LimitedCompanies residents, totalSIA "Esterkin Family Investments"SIA "Suharenko Family Investments"OthersTotal shares with voting rightsShares without voting rights
Paid-in share capital total
1.4
1.41.41.4
1.4
47 111 28547 111 285
71 790 36147 124 87824 665 483
23 385 534142 287 180
26 628 431
168 915 611
33.11%33.11%
50.45%33.12%17.34%
16.44%100.00%
PositionName Date of appointment
Chairman of the CouncilDeputy Chairman of the CouncilDeputy Chairman of the CouncilMember of the CouncilMember of the CouncilMember of the Council
Leonid EsterkinArkady SuharenkoBrendan Thomas MurphyDermot Fachtna DesmondAlexander GafinValentin Bluger
25/09/97(27/03/15-27/03/18)25/09/97(27/03/15-27/03/18)07/09/05(27/03/15-27/03/18)07/09/05(27/03/15-27/03/18)25/03/10(27/03/15-27/03/18)25/03/11(27/03/15-27/03/18)
The Council of Rietumu Bank
The Board of Directors
PositionName Date of appointment
Chairman of the Board, President Member of the Board, First Vice President Member of the Board, First Vice President Member of the Board, Senior Vice President Member of the Board, Senior Vice President Member of the Board, Senior Vice President Member of the Board, Senior Vice President Member of the Board, Senior Vice PresidentMember of the Board, Senior Vice President
Alexander PankovRuslans StecjuksRolf Paul FulsJevgenijs DjugajevsIlja SuharenkoNatalia PerhovaJelena Buraja Aleksandrs VoloshinsNatalija Ignatjeva
04/07/06(05/10/16-05/10/19) 18/10/10(05/10/16-05/10/19) 26/11/10(05/10/16-05/10/19) 18/10/10(05/10/16-05/10/19) 18/10/10(05/10/16-05/10/19) 05/10/16(05/10/16-05/10/19) 05/10/16(05/10/16-05/10/19) 05/10/16(05/10/16-05/10/19)17/05/17(17/05/17-17/05/20)
EURPaid-in share
capital
Public quarterly report 2nd Quarter 2017
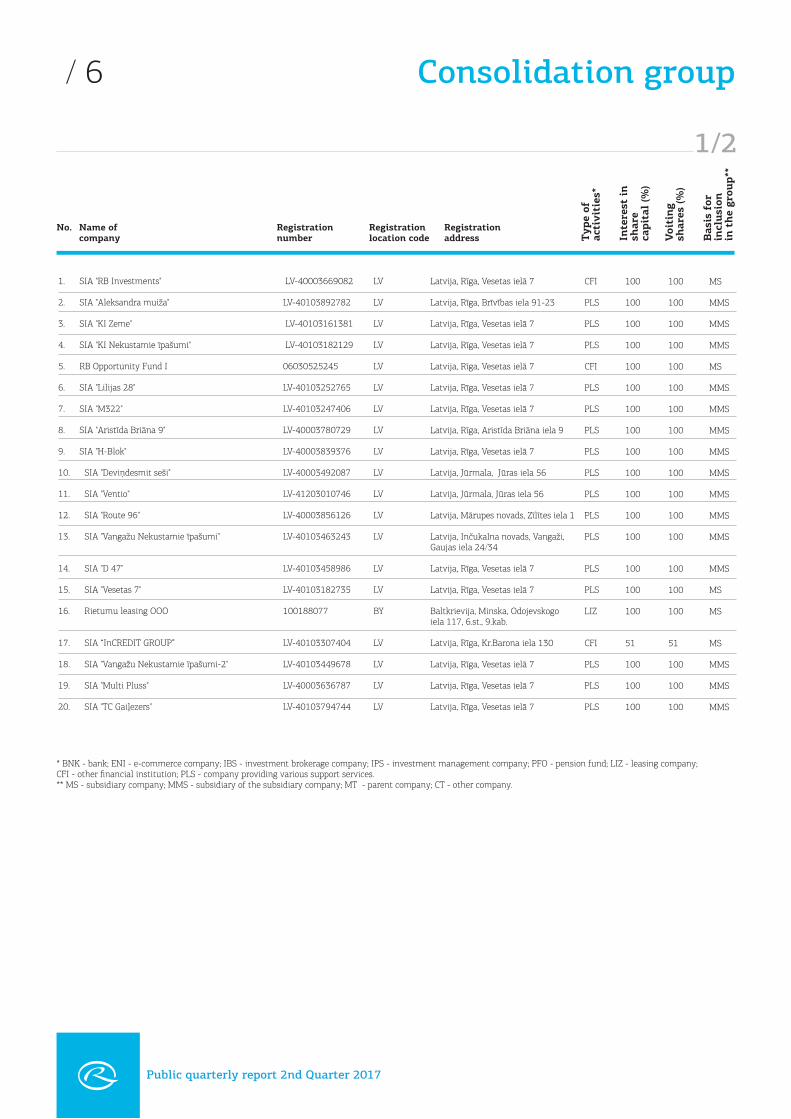
/ 6 Consolidation group
* BNK - bank; ENI - e-commerce company; IBS - investment brokerage company; IPS - investment management company; PFO - pension fund; LIZ - leasing company; CFI - other financial institution; PLS - company providing various support services.** MS - subsidiary company; MMS - subsidiary of the subsidiary company; MT - parent company; CT - other company.
Registration address
Registrationnumber
Name of company
Registration location code T
ype
of
acti
viti
es*
No.
Inte
rest
in
sh
are
capi
tal
(%)
Voi
tin
gsh
ares
(%
)
Bas
is f
or
incl
usi
on
in t
he
grou
p**
Public quarterly report 2nd Quarter 2017
LV-40003669082
LV-40103892782
LV-40103161381
LV-40103182129
06030525245
LV-40103252765
LV-40103247406
LV-40003780729
LV-40003839376
LV-40003492087
LV-41203010746
LV-40003856126
LV-40103463243
LV-40103458986
LV-40103182735
100188077
LV-40103307404
LV-40103449678
LV-40003636787
LV-40103794744
1. SIA "RB Investments"
2. SIA "Aleksandra muiža"
3. SIA "KI Zeme"
4. SIA "KI Nekustamie īpašumi"
5. RB Opportunity Fund I
6. SIA "Lilijas 28"
7. SIA "M322"
8. SIA "Aristīda Briāna 9"
9. SIA "H-Blok"
10. SIA "Deviņdesmit seši"
11. SIA "Ventio"
12. SIA "Route 96"
13. SIA "Vangažu Nekustamie īpašumi"
14. SIA "D 47"
15. SIA "Vesetas 7"
16. Rietumu leasing OOO
17. SIA “InCREDIT GROUP”
18. SIA "Vangažu Nekustamie īpašumi-2"
19. SIA "Multi Pluss"
20. SIA "TC Gaiļezers"
LV
LV
LV
LV
LV
LV
LV
LV
LV
LV
LV
LV
LV
LV
LV
BY
LV
LV
LV
LV
Latvija, Rīga, Vesetas ielā 7
Latvija, Rīga, Brīvības iela 91-23
Latvija, Rīga, Vesetas ielā 7
Latvija, Rīga, Vesetas ielā 7
Latvija, Rīga, Vesetas ielā 7
Latvija, Rīga, Vesetas ielā 7
Latvija, Rīga, Vesetas ielā 7
Latvija, Rīga, Aristīda Briāna iela 9
Latvija, Rīga, Vesetas ielā 7
Latvija, Jūrmala, Jūras iela 56
Latvija, Jūrmala, Jūras iela 56
Latvija, Mārupes novads, Zīlītes iela 1
Latvija, Inčukalna novads, Vangaži, Gaujas iela 24/34
Latvija, Rīga, Vesetas ielā 7
Latvija, Rīga, Vesetas ielā 7
Baltkrievija, Minska, Odojevskogo iela 117, 6.st., 9.kab.
Latvija, Rīga, Kr.Barona iela 130
Latvija, Rīga, Vesetas ielā 7
Latvija, Rīga, Vesetas ielā 7
Latvija, Rīga, Vesetas ielā 7
CFI
PLS
PLS
PLS
CFI
PLS
PLS
PLS
PLS
PLS
PLS
PLS
PLS
PLS
PLS
LIZ
CFI
PLS
PLS
PLS
100
100
100
100
100
100
100
100
100
100
100
100
100
100
100
100
51
100
100
100
100
100
100
100
100
100
100
100
100
100
100
100
100
100
100
100
51
100
100
100
MS
MMS
MMS
MMS
MS
MMS
MMS
MMS
MMS
MMS
MMS
MMS
MMS
MMS
MS
MS
MS
MMS
MMS
MMS
1/2
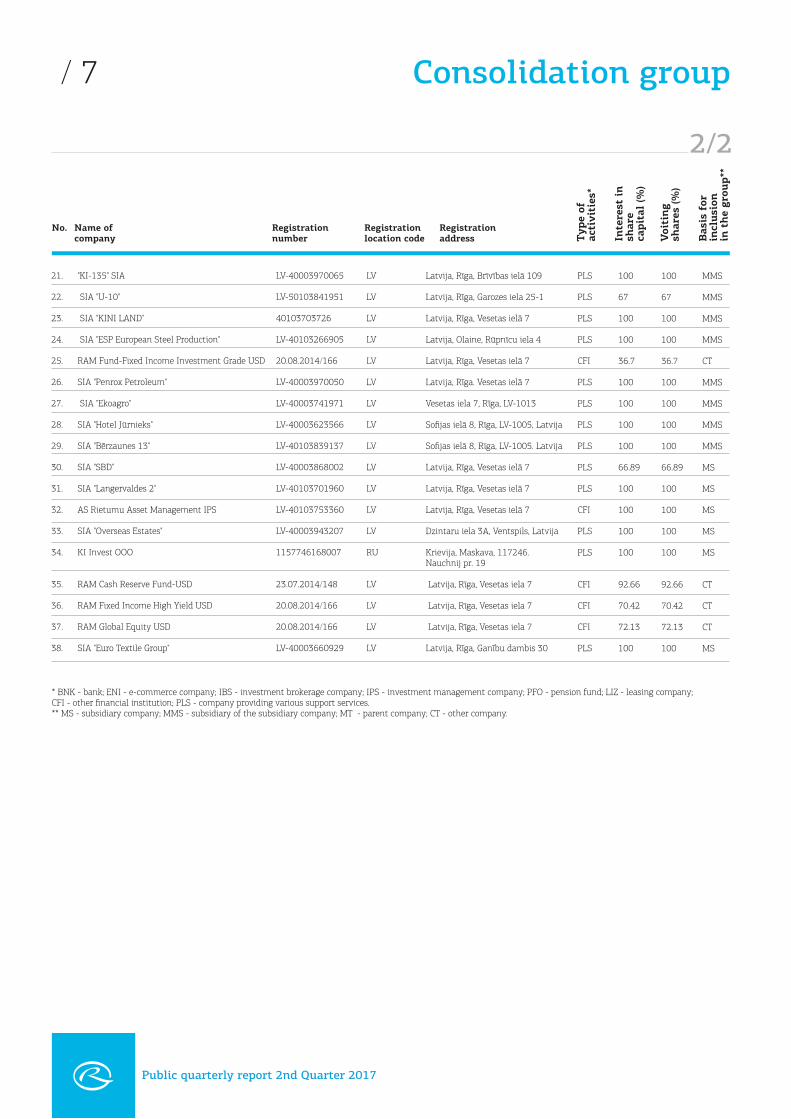
/ 7 Consolidation group
* BNK - bank; ENI - e-commerce company; IBS - investment brokerage company; IPS - investment management company; PFO - pension fund; LIZ - leasing company; CFI - other financial institution; PLS - company providing various support services.** MS - subsidiary company; MMS - subsidiary of the subsidiary company; MT - parent company; CT - other company.
Registration address
Registrationnumber
Name of company
Registration location code T
ype
of
acti
viti
es*
No.
Inte
rest
in
sh
are
capi
tal
(%)
Voi
tin
gsh
ares
(%
)
Bas
is f
or
incl
usi
on
in t
he
grou
p**
Public quarterly report 2nd Quarter 2017
2/2
LV-40003970065
LV-50103841951
40103703726
LV-40103266905
20.08.2014/166 LV-40003970050
LV-40003741971
LV-40003623566
LV-40103839137
LV-40003868002
LV-40103701960
LV-40103753360
LV-40003943207
1157746168007
23.07.2014/148 20.08.2014/166 20.08.2014/166 LV-40003660929
21. "KI-135" SIA
22. SIA "U-10"
23. SIA "KINI LAND"
24. SIA "ESP European Steel Production"
25. RAM Fund-Fixed Income Investment Grade USD
26. SIA "Penrox Petroleum"
27. SIA "Ekoagro"
28. SIA "Hotel Jūrnieks"
29. SIA "Bērzaunes 13"
30. SIA "SBD"
31. SIA "Langervaldes 2"
32. AS Rietumu Asset Management IPS
33. SIA "Overseas Estates"
34. KI Invest OOO
35. RAM Cash Reserve Fund-USD
36. RAM Fixed Income High Yield USD
37. RAM Global Equity USD
38. SIA "Euro Textile Group"
LV
LV
LV
LV
LV
LV
LV
LV
LV
LV
LV
LV
LV
RU
LV
LV
LV
LV
Latvija, Rīga, Brīvības ielā 109
Latvija, Rīga, Garozes iela 25-1 Latvija, Rīga, Vesetas ielā 7
Latvija, Olaine, Rūpnīcu iela 4
Latvija, Rīga, Vesetas ielā 7
Latvija, Rīga. Vesetas ielā 7
Vesetas iela 7, Rīga, LV-1013
Sofijas ielā 8, Rīga, LV-1005, Latvija
Sofijas ielā 8, Rīga, LV-1005. Latvija
Latvija, Rīga, Vesetas ielā 7
Latvija, Rīga, Vesetas ielā 7
Latvija, Rīga, Vesetas ielā 7
Dzintaru iela 3A, Ventspils, Latvija
Krievija, Maskava, 117246. Nauchnij pr. 19
Latvija, Rīga, Vesetas iela 7
Latvija, Rīga, Vesetas iela 7
Latvija, Rīga, Vesetas iela 7
Latvija, Rīga, Ganību dambis 30
PLS
PLS
PLS
PLS
CFI
PLS
PLS
PLS
PLS
PLS
PLS
CFI
PLS
PLS
CFI
CFI
CFI
PLS
100
67
100
100
36.7
100
100
100
100
66.89
100
100
100
100
92.66
70.42
72.13
100
100
67
100
100
36.7
100
100
100
100
66.89
100
100
100
100
92.66
70.42
72.13
100
MMS
MMS
MMS
MMS
CT
MMS
MMS
MMS
MMS
MS
MS
MS
MS
MS
CT
CT
CT
MS
/ 8
* BNK - bank; ENI - e-commerce company; IBS - investment brokerage company; IPS - investment management company; PFO - pension fund; LIZ - leasing company; CFI - other financial institution; PLS - company providing various support services.** MS - subsidiary company; MMS - subsidiary of the subsidiary company; MT - parent company; CT - other company.
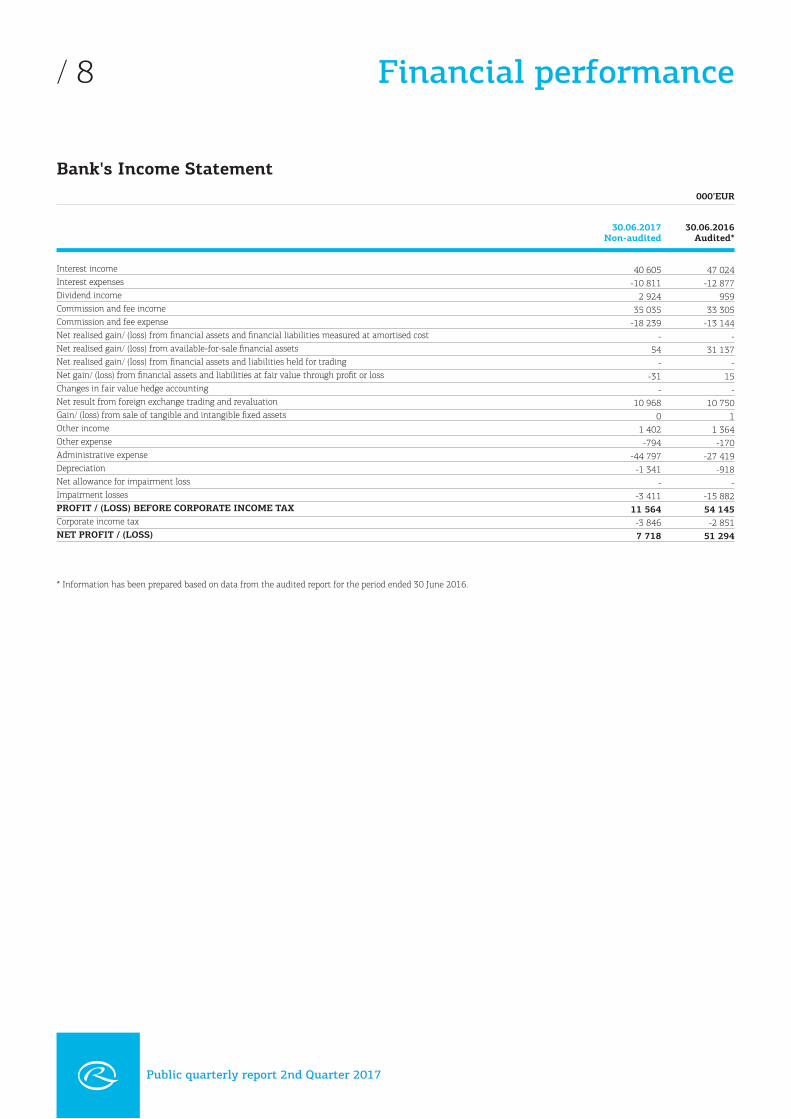
Bank's Income Statement
30.06.2017Non-audited
30.06.2016Audited*
40 605-10 811
2 92435 035
-18 239 -
54 -
-31 -
10 9680
1 402-794
-44 797-1 341
--3 411
11 564-3 8467 718
47 024-12 877
95933 305
-13 144 -
31 137 -
15 -
10 7501
1 364-170
-27 419-918
--15 88254 145-2 851
51 294
000'EUR
Interest incomeInterest expensesDividend incomeCommission and fee incomeCommission and fee expenseNet realised gain/ (loss) from financial assets and financial liabilities measured at amortised costNet realised gain/ (loss) from available-for-sale financial assetsNet realised gain/ (loss) from financial assets and liabilities held for tradingNet gain/ (loss) from financial assets and liabilities at fair value through profit or lossChanges in fair value hedge accountingNet result from foreign exchange trading and revaluation Gain/ (loss) from sale of tangible and intangible fixed assetsOther incomeOther expenseAdministrative expenseDepreciationNet allowance for impairment lossImpairment lossesPROFIT / (LOSS) BEFORE CORPORATE INCOME TAXCorporate income taxNET PROFIT / (LOSS)
Financial performance
Public quarterly report 2nd Quarter 2017
* Information has been prepared based on data from the audited report for the period ended 30 June 2016.
/ 9
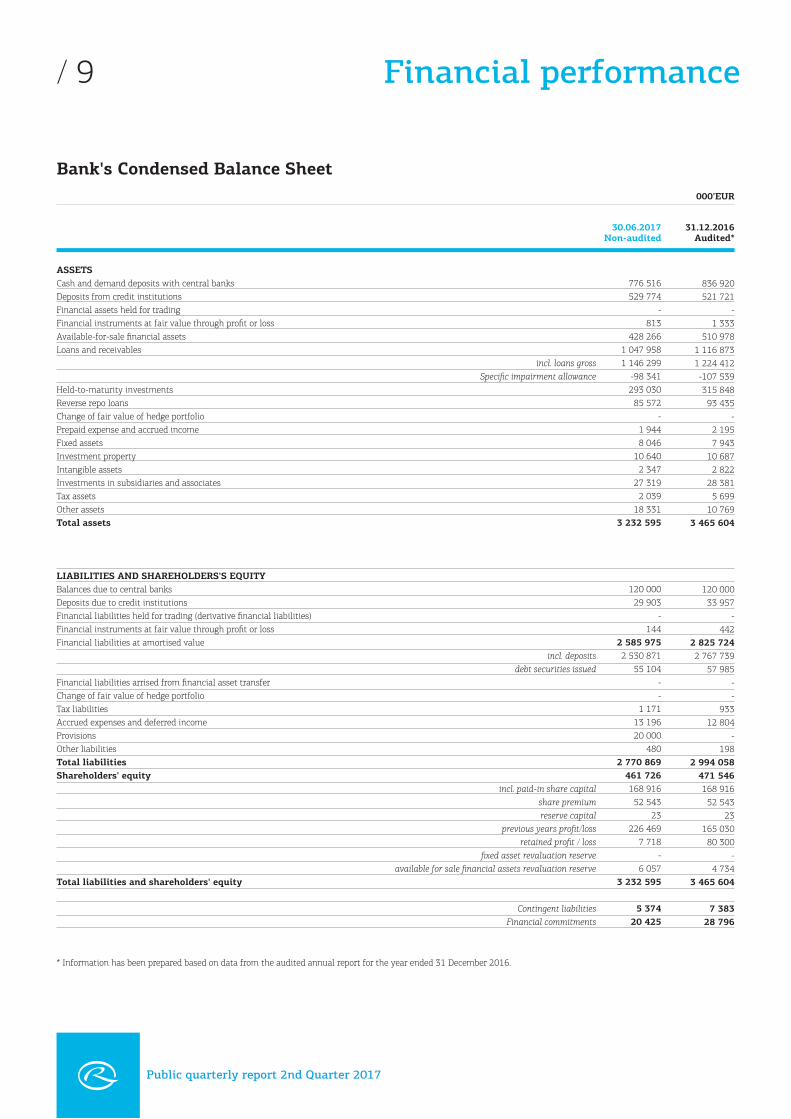
Bank's Condensed Balance Sheet
30.06.2017Non-audited
31.12.2016Audited*
776 516529 774
- 813
428 2661 047 9581 146 299
-98 341293 030
85 572 -
1 9448 046
10 6402 347
27 3192 039
18 3313 232 595
120 00029 903
-144
2 585 9752 530 871
55 104 - -
1 17113 19620 000
4802 770 869
461 726168 916
52 54323
226 4697 718
-6 057
3 232 595
5 37420 425
836 920521 721
- 1 333
510 9781 116 8731 224 412-107 539315 848
93 435 -
2 1957 943
10 6872 822
28 3815 699
10 7693 465 604
120 00033 957
-442
2 825 7242 767 739
57 985 - -
93312 804
- 198
2 994 058471 546168 916
52 54323
165 03080 300
-4 734
3 465 604
7 38328 796
* Information has been prepared based on data from the audited annual report for the year ended 31 December 2016.
000'EUR
ASSETS Cash and demand deposits with central banks Deposits from credit institutions Financial assets held for trading Financial instruments at fair value through profit or loss Available-for-sale financial assets Loans and receivables incl. loans gross Specific impairment allowance Held-to-maturity investments Reverse repo loans Change of fair value of hedge portfolio Prepaid expense and accrued income Fixed assets Investment property Intangible assets Investments in subsidiaries and associates Tax assets Other assets Total assets LIABILITIES AND SHAREHOLDERS'S EQUITY Balances due to central banks Deposits due to credit institutions Financial liabilities held for trading (derivative financial liabilities) Financial instruments at fair value through profit or loss Financial liabilities at amortised value incl. deposits debt securities issuedFinancial liabilities arrised from financial asset transfer Change of fair value of hedge portfolio Tax liabilities Accrued expenses and deferred income Provisions Other liabilities Total liabilities Shareholders' equity incl. paid-in share capital share premium reserve capital previous years profit/loss retained profit / loss fixed asset revaluation reserve available for sale financial assets revaluation reserveTotal liabilities and shareholders' equity Contingent liabilities Financial commitments
Financial performance
Public quarterly report 2nd Quarter 2017
/ 10
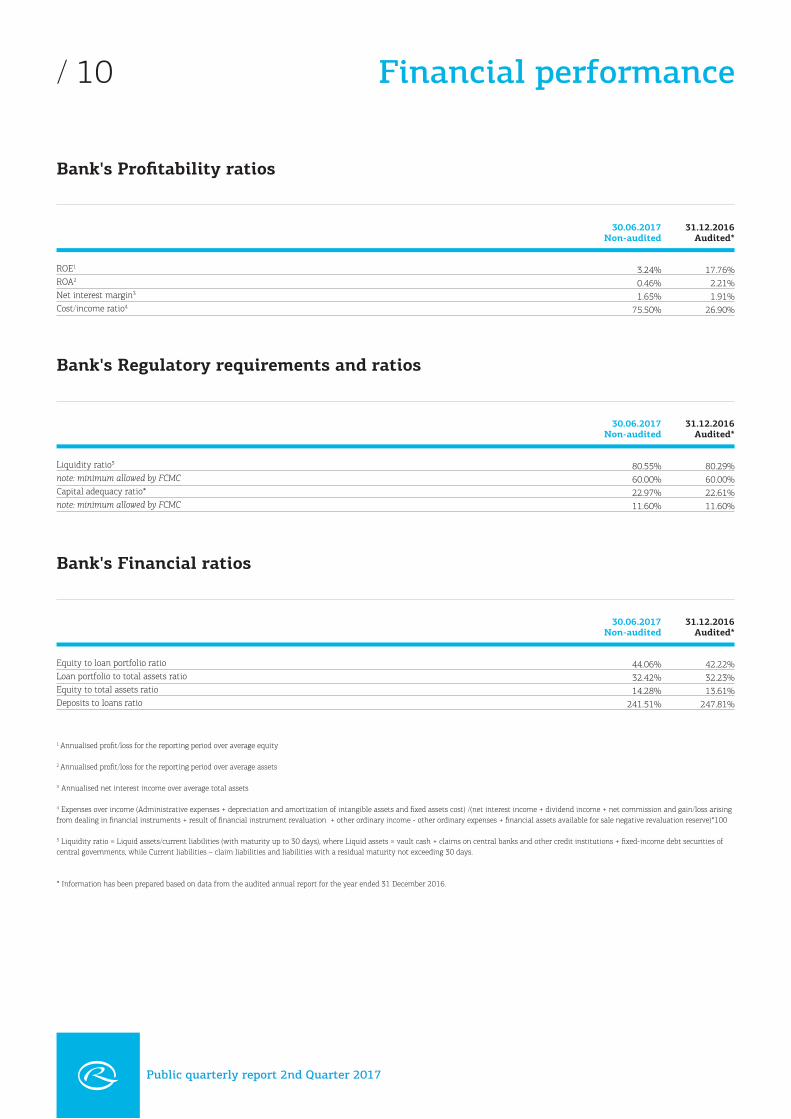
Bank's Profitability ratios
30.06.2017Non-audited
31.12.2016Audited*
3.24%0.46%1.65%
75.50%
17.76%2.21%1.91%
26.90%
Bank's Regulatory requirements and ratios
30.06.2017Non-audited
31.12.2016Audited*
80.55%60.00%22.97%11.60%
80.29%60.00%22.61%11.60%
Bank's Financial ratios
30.06.2017Non-audited
31.12.2016Audited*
44.06%32.42%14.28%
241.51%
42.22%32.23%13.61%
247.81%
Financial performance
ROE1
ROA2
Net interest margin3
Cost/income ratio4
Liquidity ratio5
note: minimum allowed by FCMCCapital adequacy ratio*note: minimum allowed by FCMC
Equity to loan portfolio ratioLoan portfolio to total assets ratioEquity to total assets ratioDeposits to loans ratio
1 Annualised profit/loss for the reporting period over average equity
2 Annualised profit/loss for the reporting period over average assets
3 Annualised net interest income over average total assets
4 Expenses over income (Administrative expenses + depreciation and amortization of intangible assets and fixed assets cost) /(net interest income + dividend income + net commission and gain/loss arising from dealing in financial instruments + result of financial instrument revaluation + other ordinary income - other ordinary expenses + financial assets available for sale negative revaluation reserve)*100
5 Liquidity ratio = Liquid assets/current liabilities (with maturity up to 30 days), where Liquid assets = vault cash + claims on central banks and other credit institutions + fixed-income debt securities of central governments, while Current liabilities – claim liabilities and liabilities with a residual maturity not exceeding 30 days. * Information has been prepared based on data from the audited annual report for the year ended 31 December 2016.
Public quarterly report 2nd Quarter 2017
/ 11
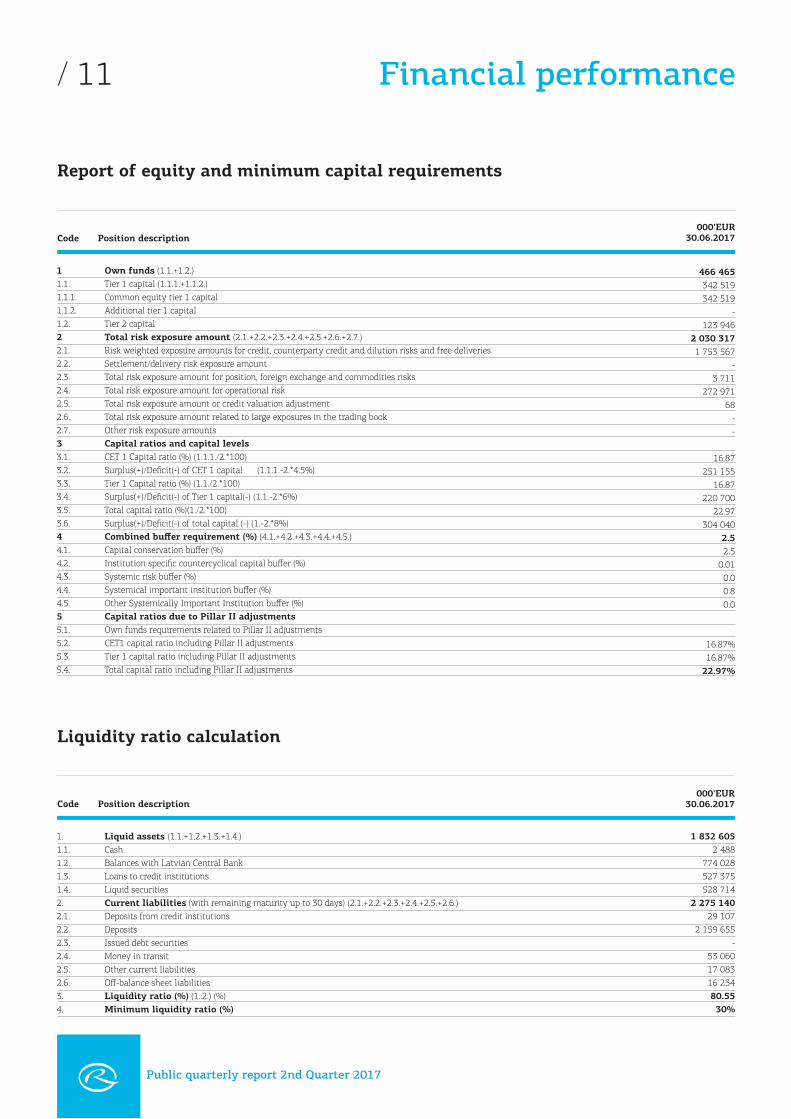
Report of equity and minimum capital requirements
466 465342 519342 519
- 123 946
2 030 3171 753 567
- 3 711
272 97168 - -
16.87251 155
16.87220 700
22.97304 040
2.52.5
0.010.00.80.0
16.87%16.87%
22.97%
1 Own funds (1.1.+1.2.) 1.1. Tier 1 capital (1.1.1.+1.1.2.) 1.1.1. Common equity tier 1 capital 1.1.2. Additional tier 1 capital 1.2. Tier 2 capital 2 Total risk exposure amount (2.1.+2.2.+2.3.+2.4.+2.5.+2.6.+2.7.) 2.1. Risk weighted exposure amounts for credit, counterparty credit and dilution risks and free deliveries 2.2. Settlement/delivery risk exposure amount 2.3. Total risk exposure amount for position, foreign exchange and commodities risks 2.4. Total risk exposure amount for operational risk 2.5. Total risk exposure amount or credit valuation adjustment 2.6. Total risk exposure amount related to large exposures in the trading book 2.7. Other risk exposure amounts 3 Capital ratios and capital levels 3.1. CET 1 Capital ratio (%) (1.1.1./2.*100) 3.2. Surplus(+)/Deficit(-) of CET 1 capital (1.1.1.-2.*4.5%) 3.3. Tier 1 Capital ratio (%) (1.1./2.*100) 3.4. Surplus(+)/Deficit(-) of Tier 1 capital(-) (1.1.-2.*6%) 3.5. Total capital ratio (%)(1./2.*100) 3.6. Surplus(+)/Deficit(-) of total capital (-) (1.-2.*8%) 4 Combined buffer requirement (%) (4.1.+4.2.+4.3.+4.4.+4.5.) 4.1. Capital conservation buffer (%) 4.2. Institution specific countercyclical capital buffer (%) 4.3. Systemic risk buffer (%) 4.4. Systemical important institution buffer (%) 4.5. Other Systemically Important Institution buffer (%) 5 Capital ratios due to Pillar II adjustments 5.1. Own funds requirements related to Pillar II adjustments 5.2. CET1 capital ratio including Pillar II adjustments 5.3. Tier 1 capital ratio including Pillar II adjustments 5.4. Total capital ratio including Pillar II adjustments
Code Position description
Liquidity ratio calculation
1 832 6052 488
774 028527 375528 714
2 275 14029 107
2 159 655 -
53 06017 08316 23480.5530%
1. Liquid assets (1.1.+1.2.+1.3.+1.4.) 1.1. Cash 1.2. Balances with Latvian Central Bank 1.3. Loans to credit institutions 1.4. Liquid securities 2. Current liabilities (with remaining maturity up to 30 days) (2.1.+2.2.+2.3.+2.4.+2.5.+2.6.) 2.1. Deposits from credit institutions 2.2. Deposits 2.3. Issued debt securities 2.4. Money in transit 2.5. Other current liabilities 2.6. Off-balance sheet liabilities 3. Liquidity ratio (%) (1.:2.) (%) 4. Minimum liquidity ratio (%)
Code Position description
Financial performance
Public quarterly report 2nd Quarter 2017
000'EUR30.06.2017
000'EUR30.06.2017
/ 12 Risk management
Risk management can be found in the last annual report:
http://www.rietumu.com/bank-finance-audited
Public quarterly report 2nd Quarter 2017
/ 13
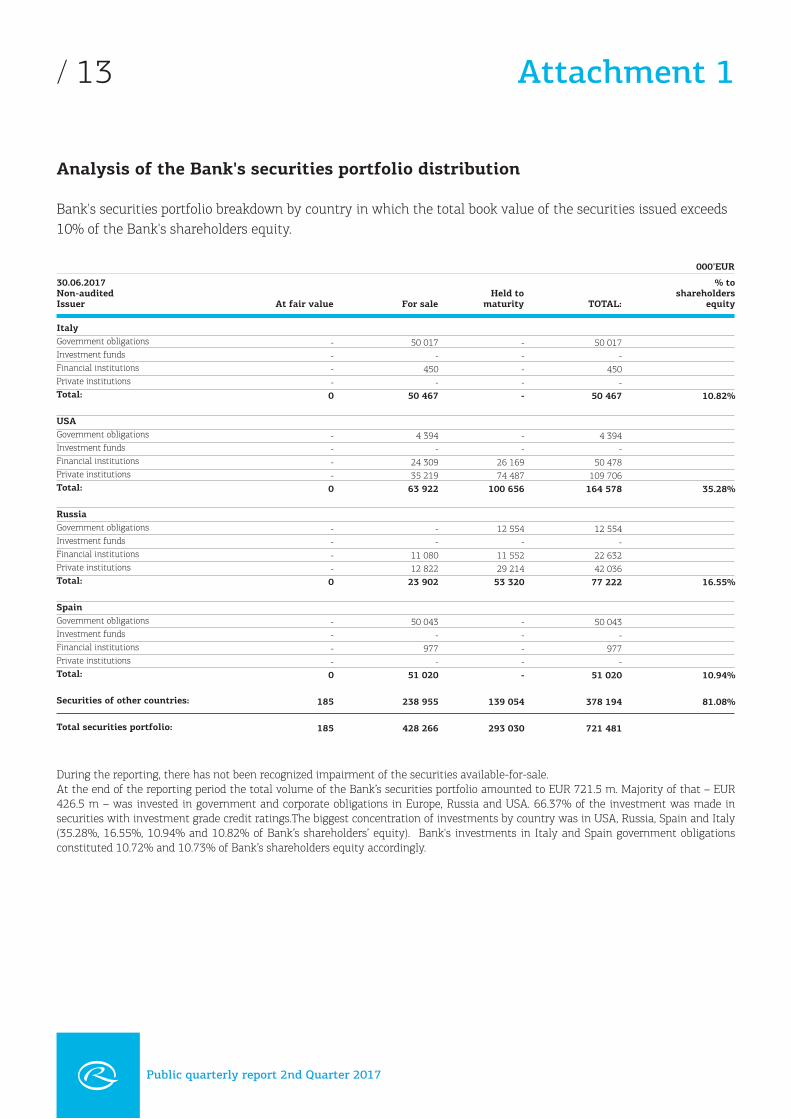
Analysis of the Bank's securities portfolio distribution
Bank's securities portfolio breakdown by country in which the total book value of the securities issued exceeds 10% of the Bank's shareholders equity.
30.06.2017Non-auditedIssuer
000'EUR
During the reporting, there has not been recognized impairment of the securities available-for-sale.At the end of the reporting period the total volume of the Bank’s securities portfolio amounted to EUR 721.5 m. Majority of that – EUR 426.5 m – was invested in government and corporate obligations in Europe, Russia and USA. 66.37% of the investment was made in securities with investment grade credit ratings.The biggest concentration of investments by country was in USA, Russia, Spain and Italy (35.28%, 16.55%, 10.94% and 10.82% of Bank’s shareholders’ equity). Bank's investments in Italy and Spain government obligations constituted 10.72% and 10.73% of Bank’s shareholders equity accordingly.
Attachment 1
At fair value For saleHeld to
maturity TOTAL:
% to shareholders
equity
ItalyGovernment obligationsInvestment fundsFinancial institutionsPrivate institutionsTotal:
USAGovernment obligationsInvestment fundsFinancial institutionsPrivate institutionsTotal:
RussiaGovernment obligationsInvestment fundsFinancial institutionsPrivate institutionsTotal:
SpainGovernment obligationsInvestment fundsFinancial institutionsPrivate institutionsTotal:
Securities of other countries:
Total securities portfolio:
Public quarterly report 2nd Quarter 2017
- - - - 0
- - - - 0
----0
----0
185
185
50 017 -
450 -
50 467
4 394 -
24 309 35 219 63 922
--
11 08012 822
23 902
50 043-
977-
51 020
238 955
428 266
- - - - -
- -
26 169 74 487
100 656
12 554 -
11 55229 214
53 320
- - - - -
139 054
293 030
50 017 -
450 -
50 467
4 394 -
50 478 109 706 164 578
12 554 -
22 632 42 036 77 222
50 043 -
977 -
51 020
378 194
721 481
10.82%
35.28%
16.55%
10.94%
81.08%
Recommended


![[SIA] - goteborg.se](https://img.pdfslide.us/doc/110x75/61921deaf8610c3b19195631/sia-.jpg)