Edirisingh. World Journal of Engineering Research and Technology
www.wjert.org
357
REVIEWING IN THE DENGUE EPIDEMIC IN THE GALLE DISTRICT
FROM A MEDICAL GEOGRAPHICAL PERSPECTIVE
Dr. G. Edirisingh*
Senior Lecturer, Department of Geography, University of Ruhuna, Matara, Sri Lanka.
Article Received on 24/09/2017 Article Revised on 17/10/2017 Article Accepted on 07/11/2017
ABSTRACT
Parasite diseases like dengue is one of the most serious public health
hazards in Sri Lanka. Recently a high prevalence of the disease could
be observed everywhere in the country. Those affected by the disease
are at a high risk as the disease is deadly dangerous. This study is
aimed at analyzing the issue from a medical geography perspective with special reference to
Galle district during the period from 2000-2014. The research was primarily based on both
primary and secondary data collection. Primary data was collected through a questionnaires
survey by in field research observations as well as by interviews and discussions conducted
within the Galle district municipality. Secondary data was collected from MOH divisions and
annual and monthly reports of the ministry of health. Finding of the research indicates that
the disease is on the spread in the rural areas as well as in urban areas. Finding of the study
confirms that the rainfall factor directly influences on spatial and temporal pattern of the
dengue epidemic. When the area is experienced a continues rainfall it shows a dramatic
reduction of the disease. At the same time it shows a high tendency of the distribution pattern
when the area experienced less rainfall. It was concluded that both annual and monthly
spatial and a temporal patterns have a direct impact on the dengue epidemic. Human
activities in the urban areas are also caused severely for the spread of the disease. It was
recorded that the majority of the patients were within age group between 15-25.That means
younger generation have been suffered a lot. Proper management, planning and
implementation of action through evaluation of observation should be administrated in order
to mitigate the issue.
wjert, 2017, Vol. 3, Issue 6, 357-371.
World Journal of Engineering Research and Technology
WJERT
www.wjert.org
ISSN 2454-695X Review Article
SJIF Impact Factor: 4.326
*Corresponding Author
Dr. G. Edirisingh
Senior Lecturer, Department
of Geography, University of
Ruhuna, Matara, Sri Lanka.
Edirisingh. World Journal of Engineering Research and Technology
www.wjert.org
358
KEYWORDS: Dengue epidemic, medical geography, urban areas, rainfall.
INTRODUCTION
Dengue is developing and resurging as an island wide major public health challenge since
1989-2015. Dengue epidemic continues to be a great health hazard and also the leading cause
to hospital admissions in the Galle district. Rapid and large - scale urbanization has increased
the susceptibility to dengue through changes in the social environmental factors as well as
natural environmental factors. Traditional and rural based cultural restraints can be traced as a
major factor leading to major risk behaviors in the urban environment. 1188 critical cases
were reported from the area in 2014 while the number of deaths confirmed was 11. In the past
10 years the incidence distribution and clinical severity of the disease has increased
dramatically. A relatively higher prevalence of the disease can be observed particularly in the
urban areas of the district.
LITERATURE SURVEY
Currently as the disease is on increase almost in the entire district people in the areas are
potentially at a risk from the dengue (Epidemic unit, 2015). In Sri Lanka (Kanakarathna, et
al., 2009). They point out dengue is hyper endemic in Sri Lanka with detected co-circulation
of multiple serotypes. As well as WHO have studies a number of key factors that contribute
in a dengue outbreaks. Further, the point out the (WHO, 2010) high human population
density many people might be exposed even if the mosquito abundance index shows a low
density value low mosquito numbers. Canyon, 1999 said that disease stimulating factors
include climate such as rainfall, humidity and temperature. According to tropical areas are
potential high risk areas for mosquito-borne disease such as dengue and point out that the
locally acquired dengue transmission in Northern Queensland, Australia (John, 2014). They
have contributed the several conditions that favour vector, density, distribution survival and
longevity. Today GIS technology and the remote sensing have provided an alternatives
potential tool for infectious diseases surveillance and the control of many types of vector
borne diseases (Russel 1969). Mapping the spatial and distribution of dengue cases against
the vulnerability towards dengue with these studies mapping tools, the public and health
authorities will be able to identify and locate the source of epidemic outbreak as well as
spatially identify the high risk areas (Edirisinghe, 2016).
Edirisingh. World Journal of Engineering Research and Technology
www.wjert.org
359
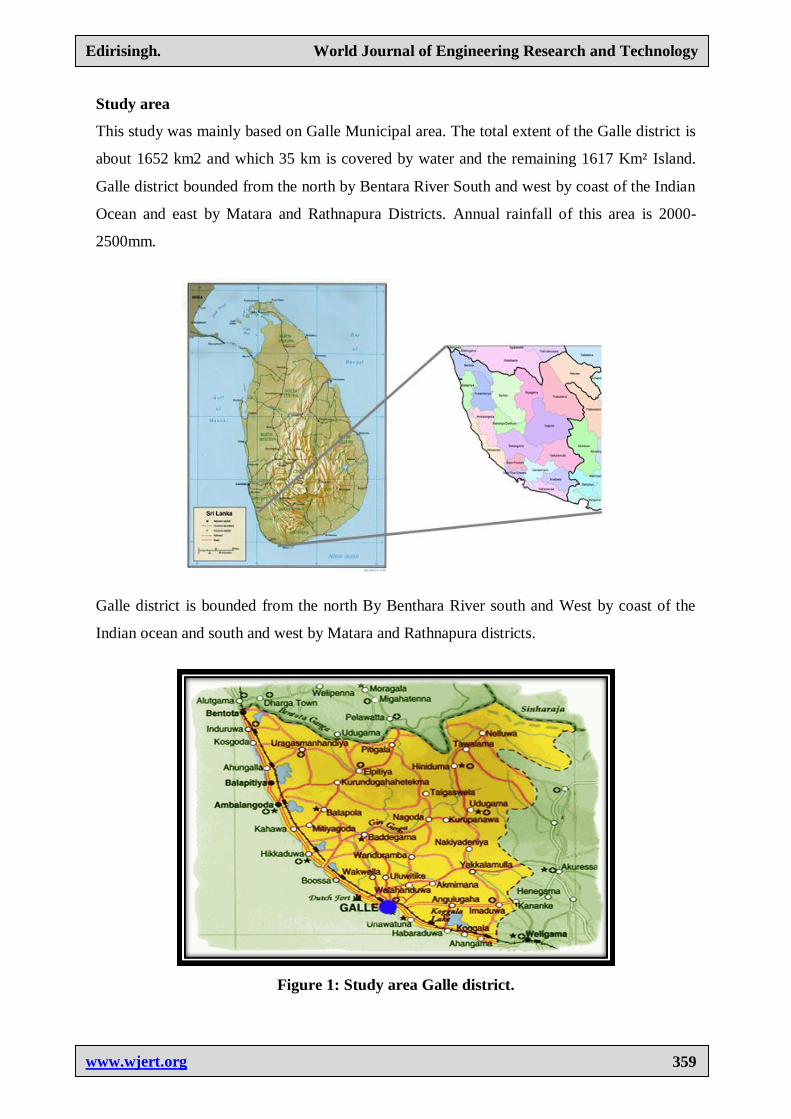
Study area
This study was mainly based on Galle Municipal area. The total extent of the Galle district is
about 1652 km2 and which 35 km is covered by water and the remaining 1617 Km² Island.
Galle district bounded from the north by Bentara River South and west by coast of the Indian
Ocean and east by Matara and Rathnapura Districts. Annual rainfall of this area is 2000-
2500mm.
Galle district is bounded from the north By Benthara River south and West by coast of the
Indian ocean and south and west by Matara and Rathnapura districts.
Figure 1: Study area Galle district.
Edirisingh. World Journal of Engineering Research and Technology
www.wjert.org
360
MATERIALS METHODS
This study was based on the following Health Medical Officers of Galle city Chinakoratuwa,
Galwadugoda, Thapitiya, Magalla, Katugada, Dadalla, Kubalwella, Dangedara,
Minuwangoda, Athligoda, and Madawamulla, Hiburana. Out of the above six divisions eight
families were selected from each division and the total number of families were 48 families.
Forty five families were selected from public health officers divisions called Niyagama,
Pitigala and Matthaka which belong to Niyagama Health officers division. Fifteen families
were selected from each division. Out of 48 families selected from Galle MOH 40 families
were considered as families victimized by the dengue epidemic and eight families were
considered as free of the same. Out of 45 families selected from Niyagama HOH 40 families
were considered as victimized and 5 families were not. The above information was gathered
from the PHI of the relevant area. GIS analysis would be useful evaluations based describing
use making in identification of the dengue risk areas and risk factors (Sumith, et. al 2009).
The two methods of the data collecting consist of both primary and secondary data that have
been gathered from the various sources. Primary data was collected by circulating a detail
questionnaire among the 60 selected sample of families in the areas with a view of studying
their perceptions and attitudes towards the human environmental in which they live. The
secondary data were collected from MOH divisions of the area. Both forms of data were
primarily designed with a view of determining the factors affecting the spread of the
epidemic in the Galle district.
OBJECTIVE OF THE STUDY
The main objective of the study to analyses the reviewing the medical geographical
perspective.
Specific objectives are
To analyses spatial and temporal factors
To identify the spatial and temporal pattern of the dengue epidemic of district, during the
period from 2000 to 2014.
RESULT AND DISCUSSION
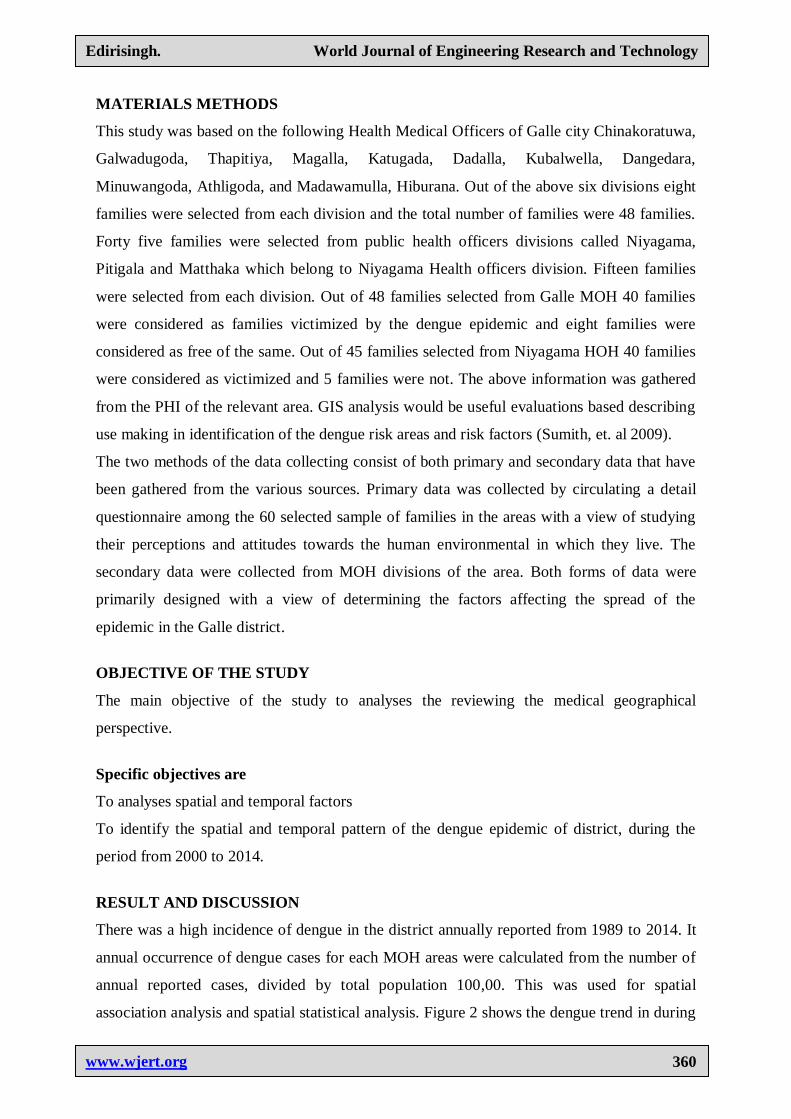
There was a high incidence of dengue in the district annually reported from 1989 to 2014. It
annual occurrence of dengue cases for each MOH areas were calculated from the number of
annual reported cases, divided by total population 100,00. This was used for spatial
association analysis and spatial statistical analysis. Figure 2 shows the dengue trend in during
Edirisingh. World Journal of Engineering Research and Technology
www.wjert.org
361
the period 2000-2014 in the district. Trend line value is Y=84.91x-128.81. There was a high
tendency.
Figure 2: Dengue epidemic in the Galle district 2000-2014.
In this study main attention is paid in relation to the following areas the social economic
status of the official families, age structure of population, gender , number of family
members, and nature of employments. The following table 1 shows the age wise distribution
of the population and the percentage of patients within the MOH divisions of Galle Municipal
Council (GMC).
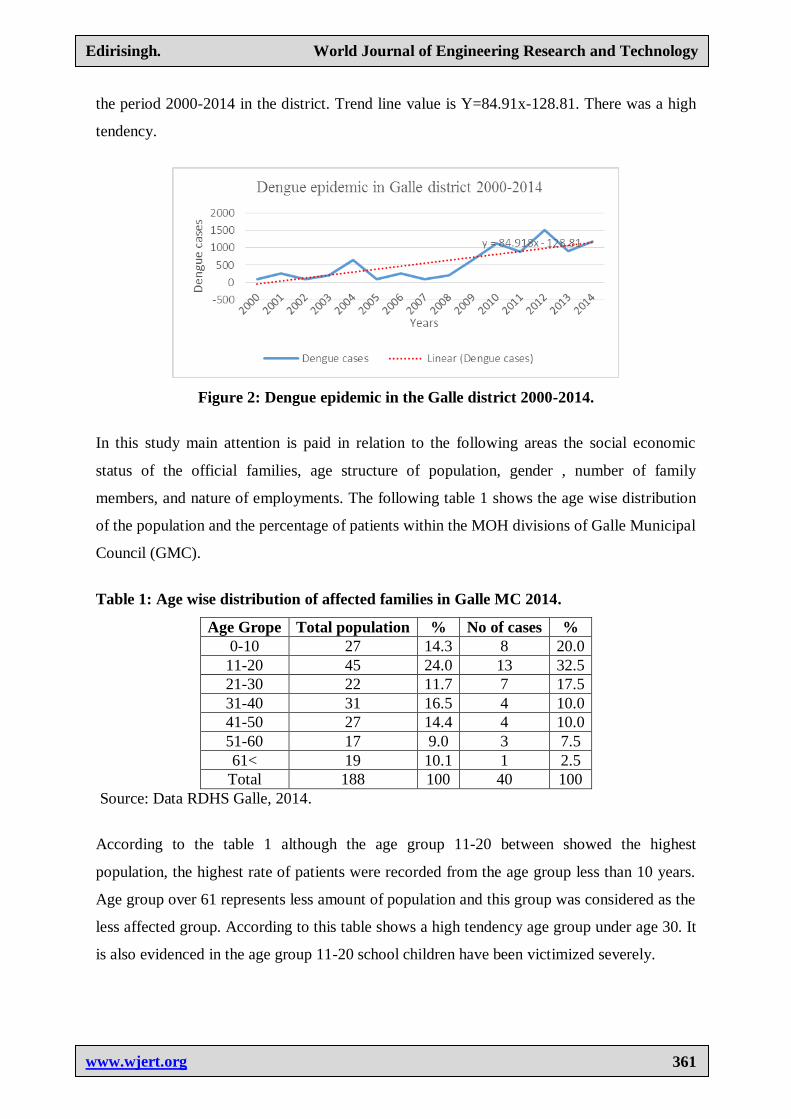
Table 1: Age wise distribution of affected families in Galle MC 2014.
Age Grope Total population % No of cases %
0-10 27 14.3 8 20.0
11-20 45 24.0 13 32.5
21-30 22 11.7 7 17.5
31-40 31 16.5 4 10.0
41-50 27 14.4 4 10.0
51-60 17 9.0 3 7.5
61< 19 10.1 1 2.5
Total 188 100 40 100
Source: Data RDHS Galle, 2014.
According to the table 1 although the age group 11-20 between showed the highest
population, the highest rate of patients were recorded from the age group less than 10 years.
Age group over 61 represents less amount of population and this group was considered as the
less affected group. According to this table shows a high tendency age group under age 30. It
is also evidenced in the age group 11-20 school children have been victimized severely.
Edirisingh. World Journal of Engineering Research and Technology
www.wjert.org
362
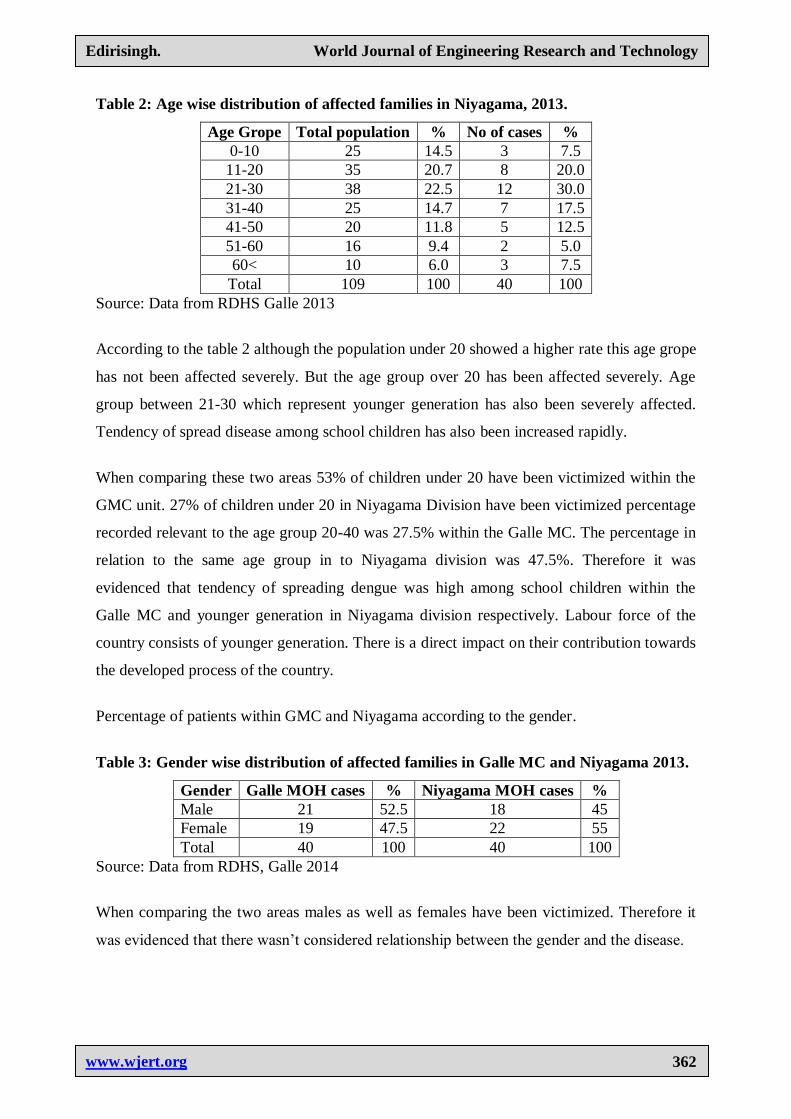
Table 2: Age wise distribution of affected families in Niyagama, 2013.
Age Grope Total population % No of cases %
0-10 25 14.5 3 7.5
11-20 35 20.7 8 20.0
21-30 38 22.5 12 30.0
31-40 25 14.7 7 17.5
41-50 20 11.8 5 12.5
51-60 16 9.4 2 5.0
60< 10 6.0 3 7.5
Total 109 100 40 100
Source: Data from RDHS Galle 2013
According to the table 2 although the population under 20 showed a higher rate this age grope
has not been affected severely. But the age group over 20 has been affected severely. Age
group between 21-30 which represent younger generation has also been severely affected.
Tendency of spread disease among school children has also been increased rapidly.
When comparing these two areas 53% of children under 20 have been victimized within the
GMC unit. 27% of children under 20 in Niyagama Division have been victimized percentage
recorded relevant to the age group 20-40 was 27.5% within the Galle MC. The percentage in
relation to the same age group in to Niyagama division was 47.5%. Therefore it was
evidenced that tendency of spreading dengue was high among school children within the
Galle MC and younger generation in Niyagama division respectively. Labour force of the
country consists of younger generation. There is a direct impact on their contribution towards
the developed process of the country.
Percentage of patients within GMC and Niyagama according to the gender.
Table 3: Gender wise distribution of affected families in Galle MC and Niyagama 2013.
Gender Galle MOH cases % Niyagama MOH cases %
Male 21 52.5 18 45
Female 19 47.5 22 55
Total 40 100 40 100
Source: Data from RDHS, Galle 2014
When comparing the two areas males as well as females have been victimized. Therefore it
was evidenced that there wasn’t considered relationship between the gender and the disease.
Edirisingh. World Journal of Engineering Research and Technology
www.wjert.org
363
Trends caused spreading the Dengue epidemic
Field investigation revealed that the patients who were victimized by the disease stayed
outside their permanent residence. Before one week they were caught by disease. Patient who
employed in another are or students who stayed in another area for their studies fall in to this
category.15% of patients in Galle MC were caught by the residence. Most of the cases were
recorded from Colombo area. People those who employed and engage in their studies more
victimized.
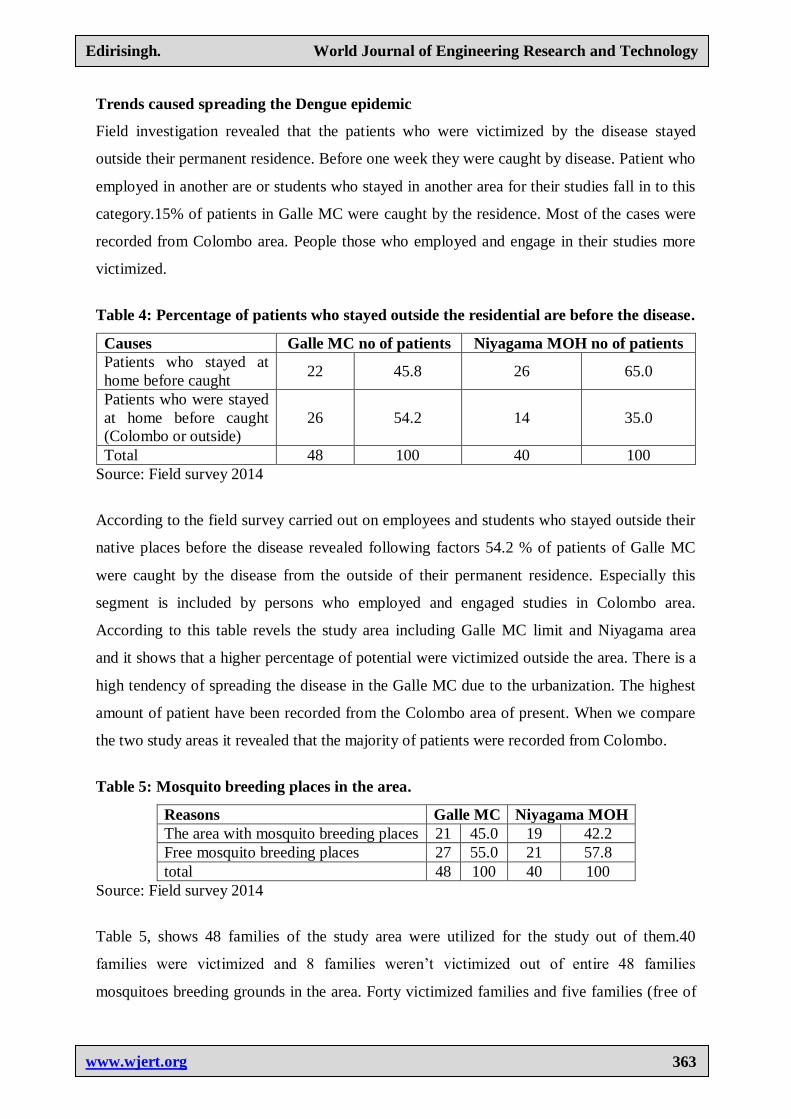
Table 4: Percentage of patients who stayed outside the residential are before the disease.
Causes Galle MC no of patients Niyagama MOH no of patients
Patients who stayed at
home before caught 22 45.8 26 65.0
Patients who were stayed
at home before caught
(Colombo or outside)
26 54.2 14 35.0
Total 48 100 40 100
Source: Field survey 2014
According to the field survey carried out on employees and students who stayed outside their
native places before the disease revealed following factors 54.2 % of patients of Galle MC
were caught by the disease from the outside of their permanent residence. Especially this
segment is included by persons who employed and engaged studies in Colombo area.
According to this table revels the study area including Galle MC limit and Niyagama area
and it shows that a higher percentage of potential were victimized outside the area. There is a
high tendency of spreading the disease in the Galle MC due to the urbanization. The highest
amount of patient have been recorded from the Colombo area of present. When we compare
the two study areas it revealed that the majority of patients were recorded from Colombo.
Table 5: Mosquito breeding places in the area.
Reasons Galle MC Niyagama MOH
The area with mosquito breeding places 21 45.0 19 42.2
Free mosquito breeding places 27 55.0 21 57.8
total 48 100 40 100
Source: Field survey 2014
Table 5, shows 48 families of the study area were utilized for the study out of them.40
families were victimized and 8 families weren’t victimized out of entire 48 families
mosquitoes breeding grounds in the area. Forty victimized families and five families (free of
Edirisingh. World Journal of Engineering Research and Technology
www.wjert.org
364
dengue) were based on the study. Out of 45 families were residential at 19 families were
residential at risk areas which were mosquito breeding grounds.
When considering the two study areas around 45% of mosquito breeding grounds were
identified. These places were identified as within the premises and out of the premises. They
were mainly caused human activities as well as environmental factors (Edirisinghe, 2014).
Indoor and outdoor surveys
According to the above survey which was conducted in house and outdoor revels following
information. Mosquito breeding places analysis according to the survey. Survey conducted by
assist Health officers of Galle DHS the District in 2014 revealed following factor It was
recorded a high tendency of spreading mosquito breeding places in the vessels such as, boats,
tires, artificial places made by people in banner, barrels, water container, tanks, machine
parts, polytheine, plastic items are so on. In addition to that its reveled gathers bamboo parts
banana leaves instrumentals placed to beautify the environment are the places that encourage
mosquito breeding places in outdoor (Edirisinghe, 2014). The survey further reveals that they
mosquito possibility of creating a breeding places outside the houses are comparatively
higher than the in house premise.
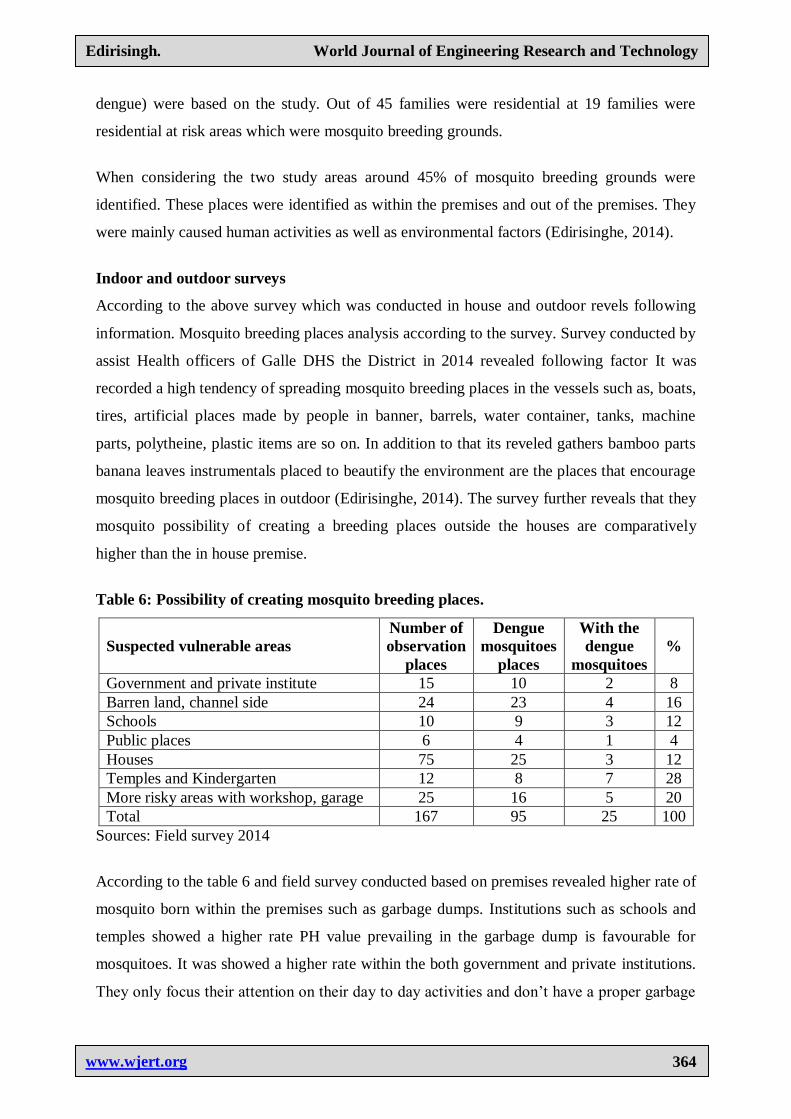
Table 6: Possibility of creating mosquito breeding places.
Suspected vulnerable areas
Number of
observation
places
Dengue
mosquitoes
places
With the
dengue
mosquitoes
%
Government and private institute 15 10 2 8
Barren land, channel side 24 23 4 16
Schools 10 9 3 12
Public places 6 4 1 4
Houses 75 25 3 12
Temples and Kindergarten 12 8 7 28
More risky areas with workshop, garage 25 16 5 20
Total 167 95 25 100
Sources: Field survey 2014
According to the table 6 and field survey conducted based on premises revealed higher rate of
mosquito born within the premises such as garbage dumps. Institutions such as schools and
temples showed a higher rate PH value prevailing in the garbage dump is favourable for
mosquitoes. It was showed a higher rate within the both government and private institutions.
They only focus their attention on their day to day activities and don’t have a proper garbage
Edirisingh. World Journal of Engineering Research and Technology
www.wjert.org
365
disposal system at present schools and religions places are the premises that contributed a
higher rate in creating mosquito breeding places. Although several programme were launched
in school premises, they were not implemented in a fruitful manner. Houses and shops
showed a lower rate comparatively than the other premises. This was mainly due to the
continuous cleaning process in house survey (Edirisinghe, 2017).
According to the housing survey revealed that the houses belong to the upper income
category paid a major role in creating mosquito breeding places in their grounds. This was
mainly vessels such as flower vessels, ponds, water tanks and fridges available in these
houses.
Spot analysis of mosquito breeding places survey
Consequently to the dengue activities and survey which was conducted Galle MC and
Niyagama HO under the guidance of Galle district DHS reveals following factors.
According to the table 7 places inspect such as lands irrigation cannels were the places that
experienced higher rate of mosquito breeding places, schools and religion places also
recorded a higher rate tire shops bus depots government and Non-Government Organization
institutes have been identified as positive places with mosquito breeding sites.
According to the figure 9 Municipal council is treated as an urbanized area and comprised
with Niyagama MOH. Schools in urban area showed a higher rate of distribution than the
rural areas. Although house premises showed a lower rate comparatively, with the
urbanization process that has been changed rapidly (Edirisinghe, 2017). Further the dengue
incidences was also significantly related with the represented of absence of built-up areas
considered to represent urbanization (Sumiko, et al.,2014).Dengue promoting factors include
climate such rainfall, humidity and temperature, changes land cover particularly rapid
unplanned expansion with inadequate housing and infrastructure (Gublar, 2011, Tam, 2013).
Correlation between Number of patients and monthly distribution
In order to find out relationship between number of patients and monthly distribution of the
year 2010 time serious analysis can be utilized see the table(patient based on the monthly
case) First the table is to be prepared with trend values to analysis the expected values
including time series analysis. The following formula is to be applied to get the trend line.
Edirisingh. World Journal of Engineering Research and Technology
www.wjert.org
366
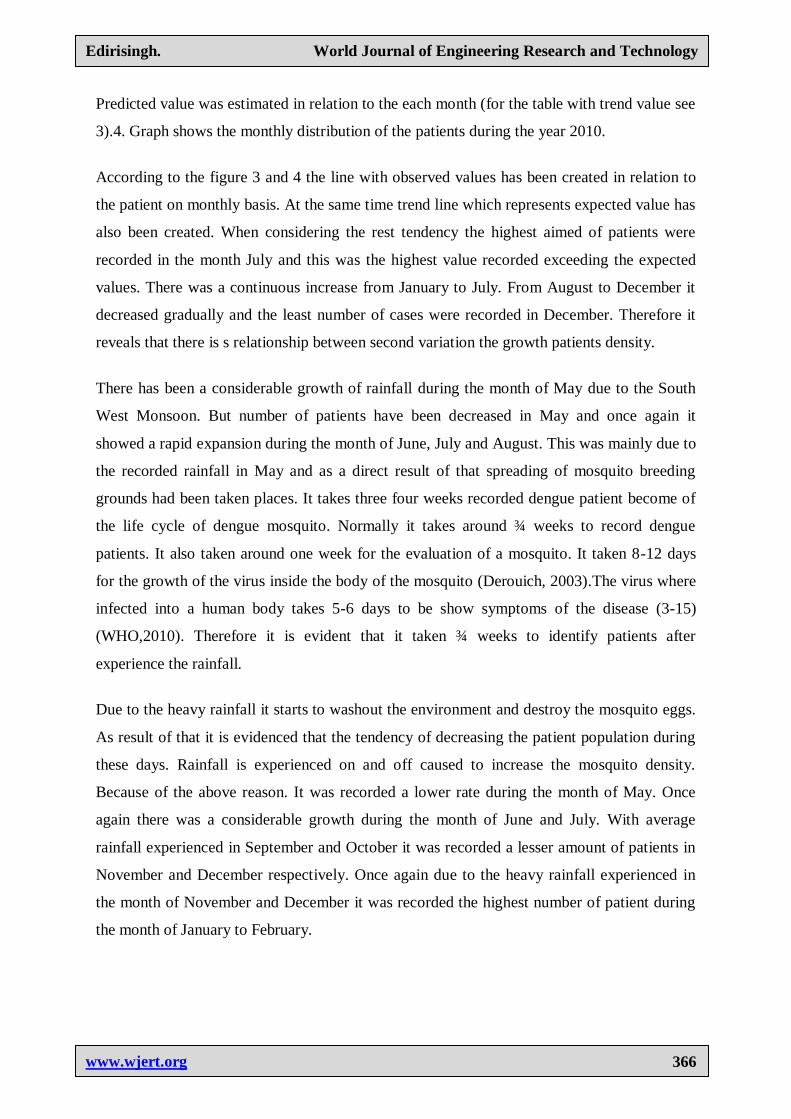
Predicted value was estimated in relation to the each month (for the table with trend value see
3).4. Graph shows the monthly distribution of the patients during the year 2010.
According to the figure 3 and 4 the line with observed values has been created in relation to
the patient on monthly basis. At the same time trend line which represents expected value has
also been created. When considering the rest tendency the highest aimed of patients were
recorded in the month July and this was the highest value recorded exceeding the expected
values. There was a continuous increase from January to July. From August to December it
decreased gradually and the least number of cases were recorded in December. Therefore it
reveals that there is s relationship between second variation the growth patients density.
There has been a considerable growth of rainfall during the month of May due to the South
West Monsoon. But number of patients have been decreased in May and once again it
showed a rapid expansion during the month of June, July and August. This was mainly due to
the recorded rainfall in May and as a direct result of that spreading of mosquito breeding
grounds had been taken places. It takes three four weeks recorded dengue patient become of
the life cycle of dengue mosquito. Normally it takes around ¾ weeks to record dengue
patients. It also taken around one week for the evaluation of a mosquito. It taken 8-12 days
for the growth of the virus inside the body of the mosquito (Derouich, 2003).The virus where
infected into a human body takes 5-6 days to be show symptoms of the disease (3-15)
(WHO,2010). Therefore it is evident that it taken ¾ weeks to identify patients after
experience the rainfall.
Due to the heavy rainfall it starts to washout the environment and destroy the mosquito eggs.
As result of that it is evidenced that the tendency of decreasing the patient population during
these days. Rainfall is experienced on and off caused to increase the mosquito density.
Because of the above reason. It was recorded a lower rate during the month of May. Once
again there was a considerable growth during the month of June and July. With average
rainfall experienced in September and October it was recorded a lesser amount of patients in
November and December respectively. Once again due to the heavy rainfall experienced in
the month of November and December it was recorded the highest number of patient during
the month of January to February.
Edirisingh. World Journal of Engineering Research and Technology
www.wjert.org
367
Figure 3: Relationship between rainfall and dengue in the Galle district.
On and off rainfall experienced in the months of June and July. This type of rain creates
favorable atmosphere for the distribution of dengue mosquitoes. Eggs laid on wet surface
such as walls can be survived more than one 6-12 months even in a dry weather condition
Seasonal Pattern
Galle district has been affected by dengue epidemic for several years in the past. As annual,
seasonal and monthly reoccurrences have been reported in almost every MOH division in the
district. The spatial pattern of dengue can be detected clearly in the divisional secretariat
divisions (DSD). In all MOH areas of the Galle District comparatively. In addition to that, a
higher prevalence of dengue cases have been reported during the SW monsoon season. In
contrast, only a fewer number of dengue cases were reported during the North East monsoon
season. The data exhibits a significant variations of spatial and temporal pattern of dengue
incidence during the period 2004-2014. The high risk areas of dengue are also happened to be
in the urban and suburban areas.
Table 7: Seasonal pattern of dengue in the district 2004-2014.
Year May to Sep SW monsoon % Oct-April NE monsoon % Total
2004 194 72.0 74 26.0 268
2005 53 56.0 41 44.0 94
2006 69 26.0 199 74.0 268
2007 28 28.0 72 72.0 100
2008 46 42.5 62 57.5 108
2009 475 73.0 175 27.0 650
2010 730 65.6 382 34.4 1112
2011 574 71.0 240 29.0 814
2012 856 57.0 656 43.0 1513
2013 464 49.0 476 51.0 940
2014 586 48.0 638 52.0 1224
Edirisingh. World Journal of Engineering Research and Technology
www.wjert.org
368
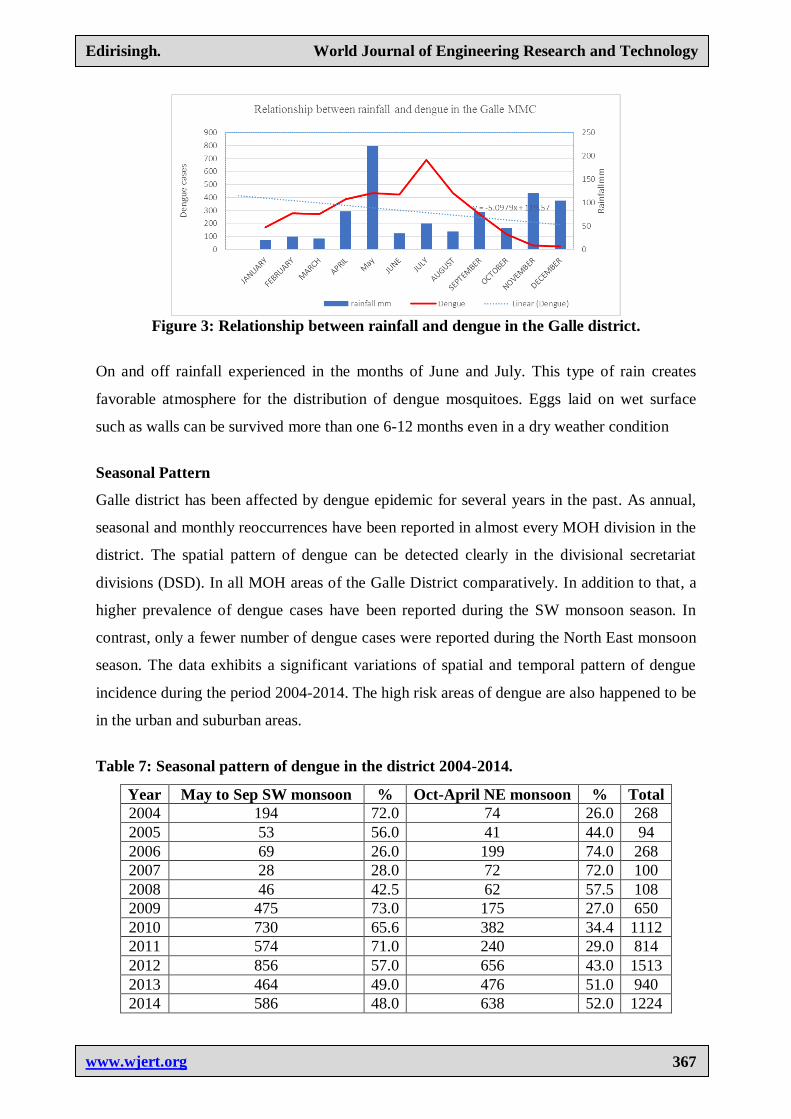
Relationship between number of patients and mean annual rainfall
To observe the factor simple regression analysis can be applied. See the table X is considered
as patients. The aim of the analysis is to observe. How does it influence the changes of
rainfall patterns to create changes in patient population. To find out the correlation between
the above two factors it was drawn a regression line and coefficient spread sample.
Simple regression analysis helps to understand the relationship between the rainfall and the
number of patient
Y=a+bx
Y= 69.72+0.0280X
Figure 4: Relationship between mean annual rainfall and the annual number of patient
in Galle district 2004-2015.
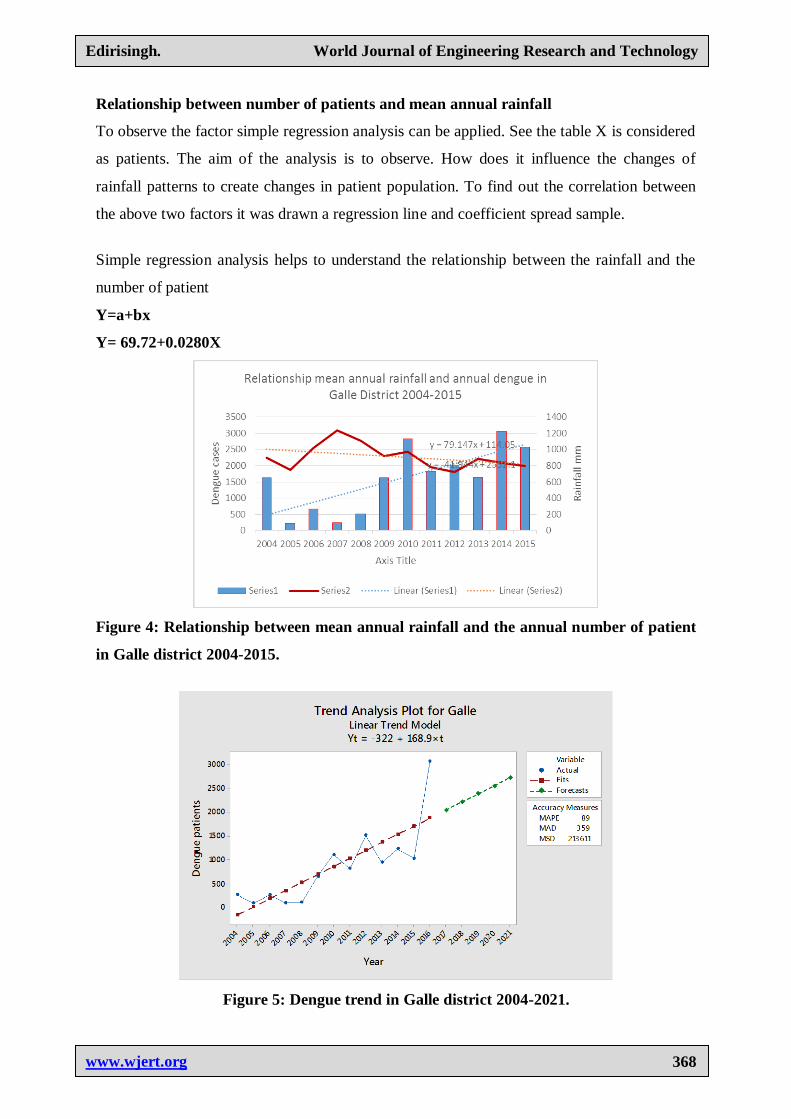
Figure 5: Dengue trend in Galle district 2004-2021.
Edirisingh. World Journal of Engineering Research and Technology
www.wjert.org
369
According to the above figure axis X represent rainfall and Y represent number of patient. In
November and December rainfall was recorded is 431.5 mm and 373.7mm. Consequently
number of patient in have been decreased during the two months. At the same time in the
month of May it was recorded a higher rate of dengue during the month June, July and
August. The rainfall prevailed within the above period was around 200mm.
Spots identified too close to the regression line shows a close relationship between the
rainfall and the patient capacity. Spots away from the regression line shows a negative
relationship on the same. It was recorded high amount of patient after the month of May
which experienced a heavy rain. Therefore obviously it reveals the relationship between the
rainfall and the number of cases.
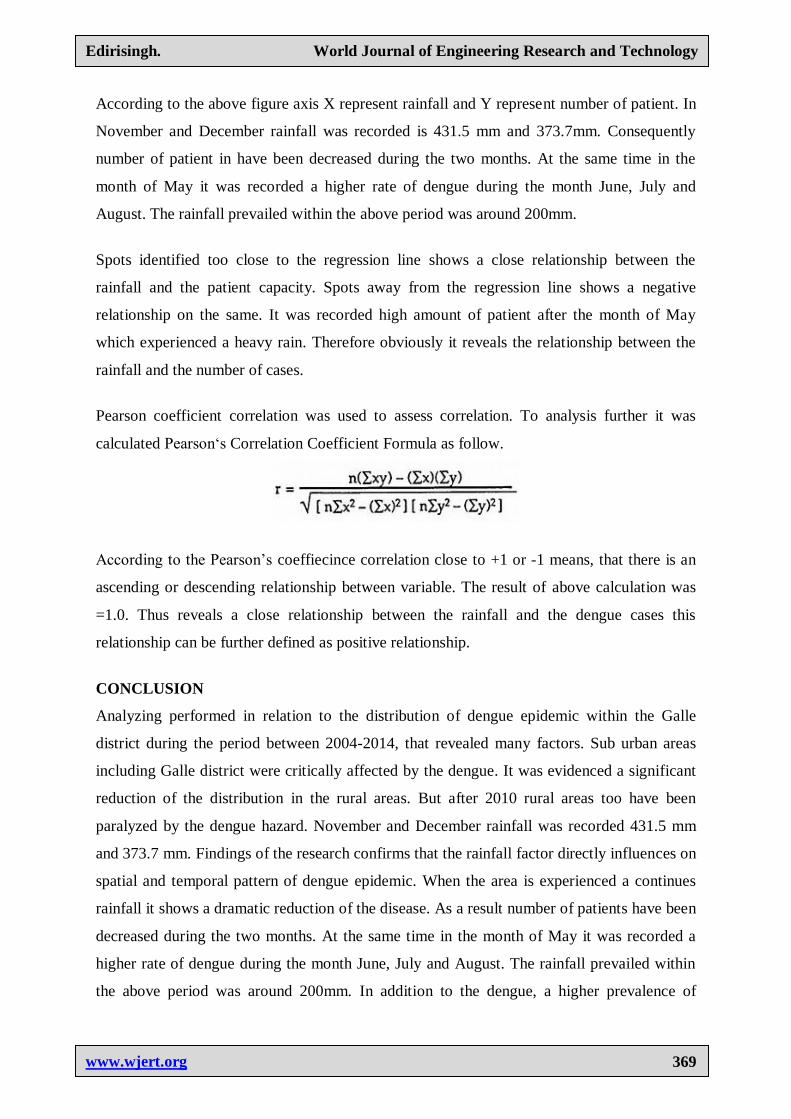
Pearson coefficient correlation was used to assess correlation. To analysis further it was
calculated Pearson‘s Correlation Coefficient Formula as follow.
According to the Pearson’s coeffiecince correlation close to +1 or -1 means, that there is an
ascending or descending relationship between variable. The result of above calculation was
=1.0. Thus reveals a close relationship between the rainfall and the dengue cases this
relationship can be further defined as positive relationship.
CONCLUSION
Analyzing performed in relation to the distribution of dengue epidemic within the Galle
district during the period between 2004-2014, that revealed many factors. Sub urban areas
including Galle district were critically affected by the dengue. It was evidenced a significant
reduction of the distribution in the rural areas. But after 2010 rural areas too have been
paralyzed by the dengue hazard. November and December rainfall was recorded 431.5 mm
and 373.7 mm. Findings of the research confirms that the rainfall factor directly influences on
spatial and temporal pattern of dengue epidemic. When the area is experienced a continues
rainfall it shows a dramatic reduction of the disease. As a result number of patients have been
decreased during the two months. At the same time in the month of May it was recorded a
higher rate of dengue during the month June, July and August. The rainfall prevailed within
the above period was around 200mm. In addition to the dengue, a higher prevalence of
Edirisingh. World Journal of Engineering Research and Technology
www.wjert.org
370
dengue cases has been reported during the SW monsoon season. In contrast, only a fewer
number of dengue cases were reported during the North East monsoon season. Human
activities in the urban areas are also caused severely for the spread of the dengue epidemic.
Dumping garbage blocking gutters are some of the root causes for the same. It was recorded
that the majority of dengue patients were within the age group between 15-25. That means
younger generation have been suffered a more severely.
REFERENCES
1. Canyon, D.V., Hij, J.L., & Muller, R., Adaptation of Aedes egypti oviposition behavior in
response to humidity and diet. Journal of Insect Physiology, 1999; 45.
2. Dengue and Dengue Hemorrhagic Fever; World Health Organization (WHO): Geneva,
Switzerland, 2010.
3. Derouich, M.; Boutayeb, A.; Twizell, E.H. A model of dengue fever. Biomed. Eng.,
2003; 2(4).
4. Social Mobilization and Communication for Dengue Fever Prevention and Control: A
Guide on Achieving and Sustaining Behavioral Results; World Health Organization
(WHO): Geneva, Switzerland, 2002.
5. Edirisinghe, G. Geo-spatial Patterns of Dengue Epidemic in Municipal council Area in
the Matara District in Sri Lanka Unpublished M.SC dissertation, Sri Jayewardenepura
University. Gangodawila. Colombo, 2016.
6. Edirisinghe, G. Dengue epidemic in Sri Lanka, ISBN 978-955-444-52-0-8 Sithmini
Printers Gampola, Sri Lanka, 2014.
7. Edirisinghe G. An investigation into spatial vulnerable factors for dengue epidemics using
GIS in the Matara District in Sri Lanka. online at: www.isca.in, International Research
Journal of Medical Sciences ISSN 2320 – 7353, September 2017; 5(6): 1-8.
8. Gublar, D.J., Dengue Urbanization and Globalization .The unholy Trinity of the 21st
Century. Tropical Medicine and Health, 2011; 39(4): 3-11.
9. Government Report, Current situation & Epidemiology of Dengue in Sri Lanka, 2008;
35(29).
10. John, S. John, M. Kerrie, M. Spatial and Temporal Patterns of Locally –Acquired Dengue
Transmission in Northern Queensland, Australia, 2014; 1993-2012 DCI:
10.1371/Journal. Pone 0092524.
Edirisingh. World Journal of Engineering Research and Technology
www.wjert.org
371
11. Kanakarathne, N.Wahala, W.M Messer, W.B, Tisera, H. A, Shahni, A, Abeysinghe, N. de
Silva, A.M. and Gunasekara, M. Severe Dengue epidemics in Sri Lanka, 201302006
Immerging Infectious Diseases, 2009; 15(2): 192-199, No,10 pp959-964.
12. Russell P.K, Gould D.J, Yuill T.M, Nisalak A, Winter P.E. Recovery of dengue 4 viruses
from mosquito vectors and patients during an epidemic of dengue hemorrhagic fever. Am
J Trop Med Hyg, 1969; 18: 580-3.
13. Sumith Pathirana, Masto Kawabata and Rohitha Goonathilaka, Study of Potential Risk of
Dengue Disease Outbreak in Sri Lanka Using GIS and Statistical Modelling. Journal
Tropical Public Health, 2009; 8: 8-17.
14. Sumiko, A, Keiji. I., Takeo T., Tamostsu, I., Subramaniam, S., Selvam K., Vaithchi, K.,
Sinathamby, N. S., Remote Sensing Applied to the Analysis of spatial and Temporal
Patterns of Dengue Incidence based on Ecological and Socio-economic and Demographic
factors in Sri Lanka, 2014; 1-7.
15. Tam, C.C, Tissera, H, de Silva, A.D, Margolis, H.S and Amarasinghe, A. Estimates of
Dengue Force of Infection in Children in Colombo, Sri Lanka. PLOS Neglected Tropical
Diseases, 2013; 7(6): 1-7.
Recommended