REMOVAL OF AMMONIACAL NITROGEN FROM LANDFILL LEACHATE BY IRRIGATION ONTO VEGETATED TREATMENT PLANES
S.F. TYRREL, P.B. LEEDS-HARRISON, & K.S. HARRISON
Institute of Water and Environment, Cranfield University, Silsoe, Bedford, MK45 4DT, UK
Tel: 44 (0) 1525 863293 Fax: 44 (0) 1525 863344 [email protected]
ABSTRACT
Leachate is a contaminated liquor resulting from the disposal of solid and liquid wastes
at landfill sites that must be treated before discharge. Vegetated leachate treatment
planes have been used at landfill sites in the UK but have received little scientific
attention. This paper describes studies of model leachate treatment planes with a focus
on the removal of ammoniacal nitrogen (NH3-N). Small-scale and field-scale
experimental treatment planes were constructed, filled with clay loam soil and
vegetated with grass (Agrostis stolonifera). Landfill leachate was applied at hydraulic
loading rates ranging from 17-217 l/m2/d. An exponential relationship was used to
characterise the pattern of NH3-N removal. No relationship was observed between the
hydraulic loading rate and the NH3-N removal rate constants (R2 = 0.0039). The daily
specific NH3 -N mass removal rate was found to be linearly related to the NH3 -N
concentration at the start of that day of treatment (R2 = 0.35). Possible causes of
variation in the rate of NH3-N removal between experiments are discussed. A simple
inorganic nitrogen balance indicated that the mass of NH3-N and NO2-N removed was
not accounted for by NO3-N production. Explanations for this apparent nitrogen deficit
are discussed.
Key words – landfill, leachate, ammonia, wastewater treatment
1
INTRODUCTION
Landfilling is the disposal of waste in void spaces created by activities such as gravel or
clay extraction. The practice of landfilling results in a number of potentially damaging
environmental impacts of which the generation of landfill leachate is just one. In
addition to the initial moisture content of the solid waste and any liquid waste inputs,
water may enter landfills as a result of the ingress of precipitation, surface water or
groundwater. Contact between this water and the waste generates a leachate
contaminated with a range of soluble organic and inorganic substances. Generally,
leachate generated from recently-filled domestic waste has a high 5 day biochemical
oxygen demand (BOD5), of about 10 000 mg/l, and a total ammoniacal nitrogen (NH3-
N) concentration in excess of 1000 mg/l. This is a result of the microbiological
degradation of organic substances under anaerobic conditions (Robinson and Maris,
1979; Robinson and Gronow, 1992; Robinson, 1995). In older landfills the readily
biodegradeable compounds contributing to BOD5 are converted by a complex series of
microbiological reactions to methane and carbon dioxide and may be extracted from
the fill as landfill gas. As there is no significant mechanism for NH3 -N transformation
in the landfill, NH3 -N concentrations remain high in aged wastes. Landfilled waste will
continue to produce leachate contaminated with NH3 -N for many years after filling
operations have ceased (Robinson and Gronow, 1992).
Leachate in an untreated form is unsuitable for direct discharge into surface
watercourses as the high BOD and NH3-N concentrations would have a severe impact
on the ecology of the receiving water. Although effective advanced leachate treatment
systems exist, some landfill operators seek alternatives because of their high capital
costs and specialised management requirements. Land-based treatment systems are an
2
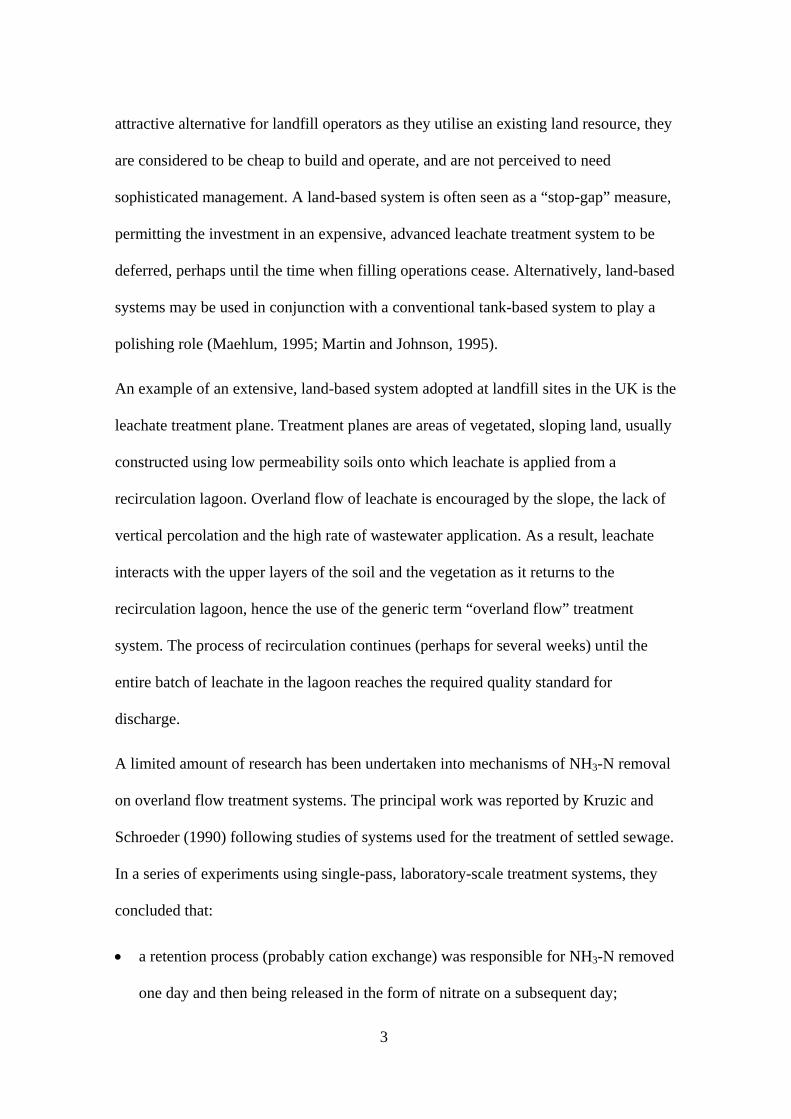
attractive alternative for landfill operators as they utilise an existing land resource, they
are considered to be cheap to build and operate, and are not perceived to need
sophisticated management. A land-based system is often seen as a “stop-gap” measure,
permitting the investment in an expensive, advanced leachate treatment system to be
deferred, perhaps until the time when filling operations cease. Alternatively, land-based
systems may be used in conjunction with a conventional tank-based system to play a
polishing role (Maehlum, 1995; Martin and Johnson, 1995).
An example of an extensive, land-based system adopted at landfill sites in the UK is the
leachate treatment plane. Treatment planes are areas of vegetated, sloping land, usually
constructed using low permeability soils onto which leachate is applied from a
recirculation lagoon. Overland flow of leachate is encouraged by the slope, the lack of
vertical percolation and the high rate of wastewater application. As a result, leachate
interacts with the upper layers of the soil and the vegetation as it returns to the
recirculation lagoon, hence the use of the generic term “overland flow” treatment
system. The process of recirculation continues (perhaps for several weeks) until the
entire batch of leachate in the lagoon reaches the required quality standard for
discharge.
A limited amount of research has been undertaken into mechanisms of NH3-N removal
on overland flow treatment systems. The principal work was reported by Kruzic and
Schroeder (1990) following studies of systems used for the treatment of settled sewage.
In a series of experiments using single-pass, laboratory-scale treatment systems, they
concluded that:
• a retention process (probably cation exchange) was responsible for NH3-N removed
one day and then being released in the form of nitrate on a subsequent day;
3
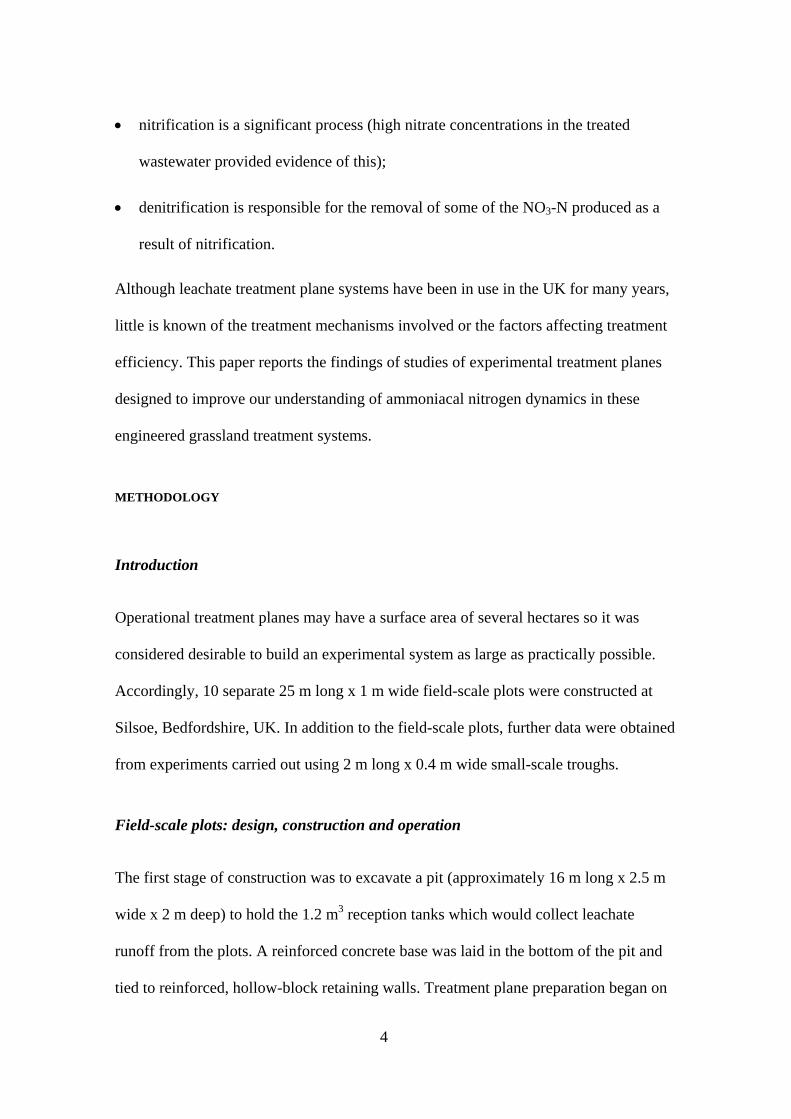
• nitrification is a significant process (high nitrate concentrations in the treated
wastewater provided evidence of this);
• denitrification is responsible for the removal of some of the NO3-N produced as a
result of nitrification.
Although leachate treatment plane systems have been in use in the UK for many years,
little is known of the treatment mechanisms involved or the factors affecting treatment
efficiency. This paper reports the findings of studies of experimental treatment planes
designed to improve our understanding of ammoniacal nitrogen dynamics in these
engineered grassland treatment systems.
METHODOLOGY
Introduction
Operational treatment planes may have a surface area of several hectares so it was
considered desirable to build an experimental system as large as practically possible.
Accordingly, 10 separate 25 m long x 1 m wide field-scale plots were constructed at
Silsoe, Bedfordshire, UK. In addition to the field-scale plots, further data were obtained
from experiments carried out using 2 m long x 0.4 m wide small-scale troughs.
Field-scale plots: design, construction and operation
The first stage of construction was to excavate a pit (approximately 16 m long x 2.5 m
wide x 2 m deep) to hold the 1.2 m3 reception tanks which would collect leachate
runoff from the plots. A reinforced concrete base was laid in the bottom of the pit and
tied to reinforced, hollow-block retaining walls. Treatment plane preparation began on
4
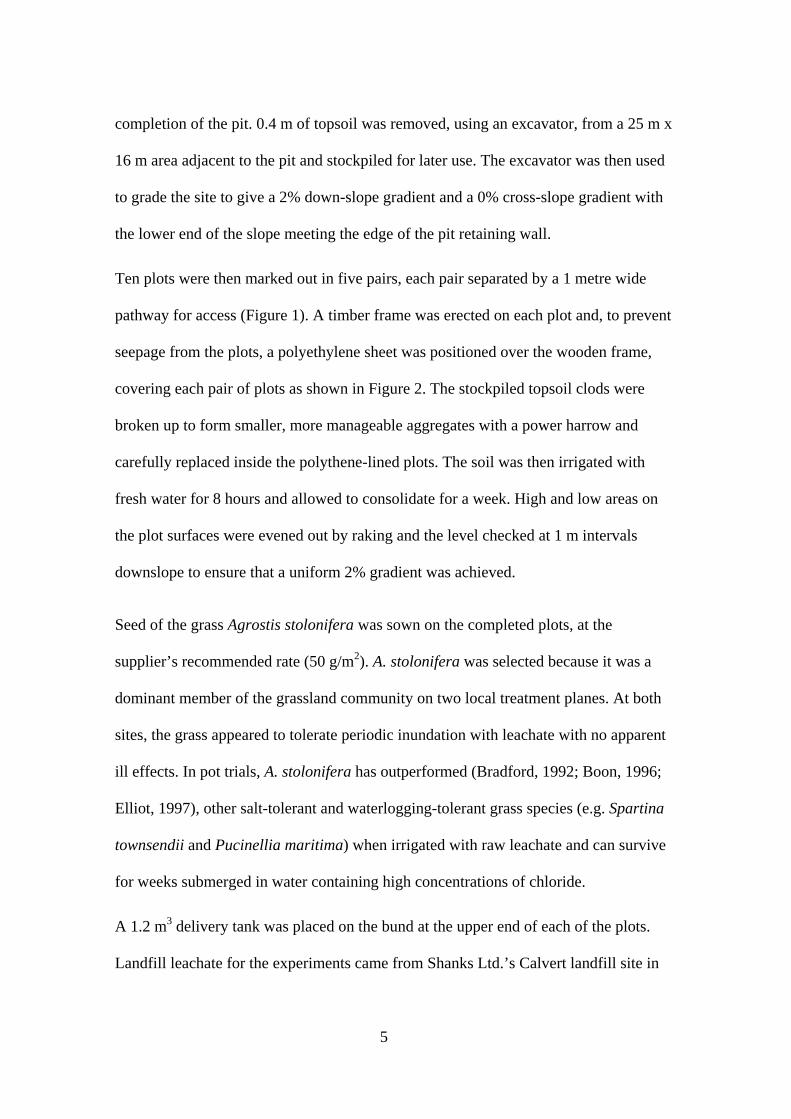
completion of the pit. 0.4 m of topsoil was removed, using an excavator, from a 25 m x
16 m area adjacent to the pit and stockpiled for later use. The excavator was then used
to grade the site to give a 2% down-slope gradient and a 0% cross-slope gradient with
the lower end of the slope meeting the edge of the pit retaining wall.
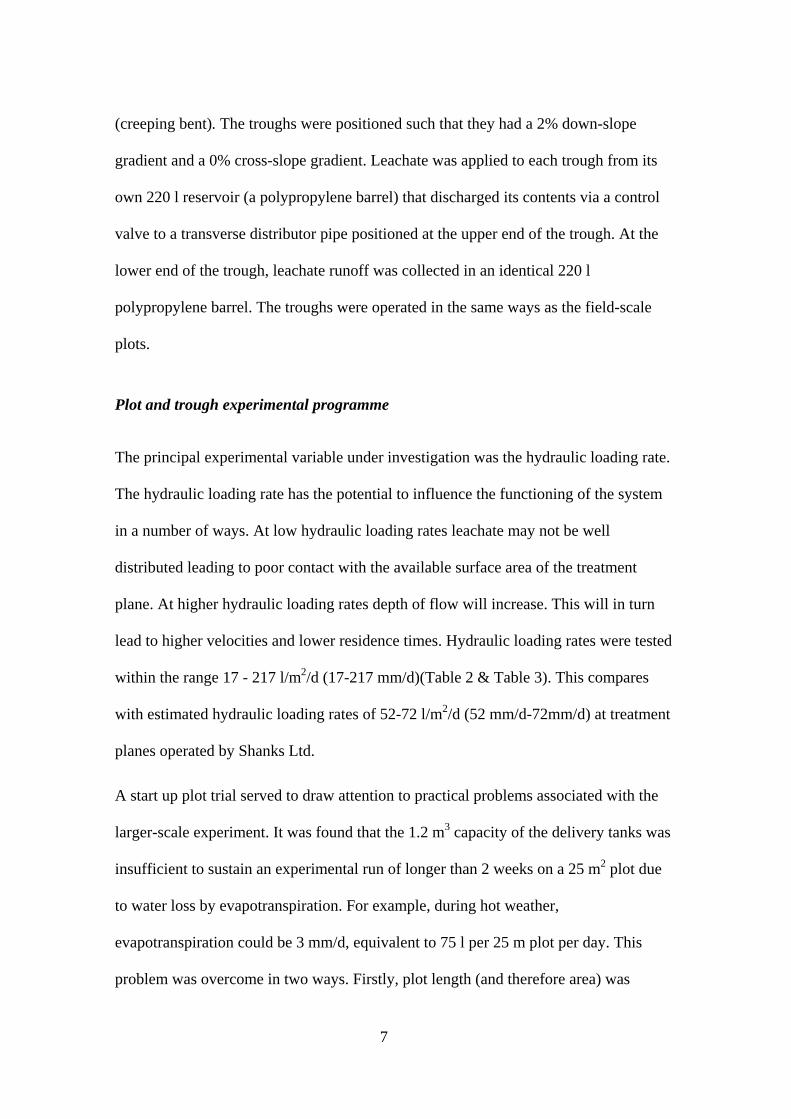
Ten plots were then marked out in five pairs, each pair separated by a 1 metre wide
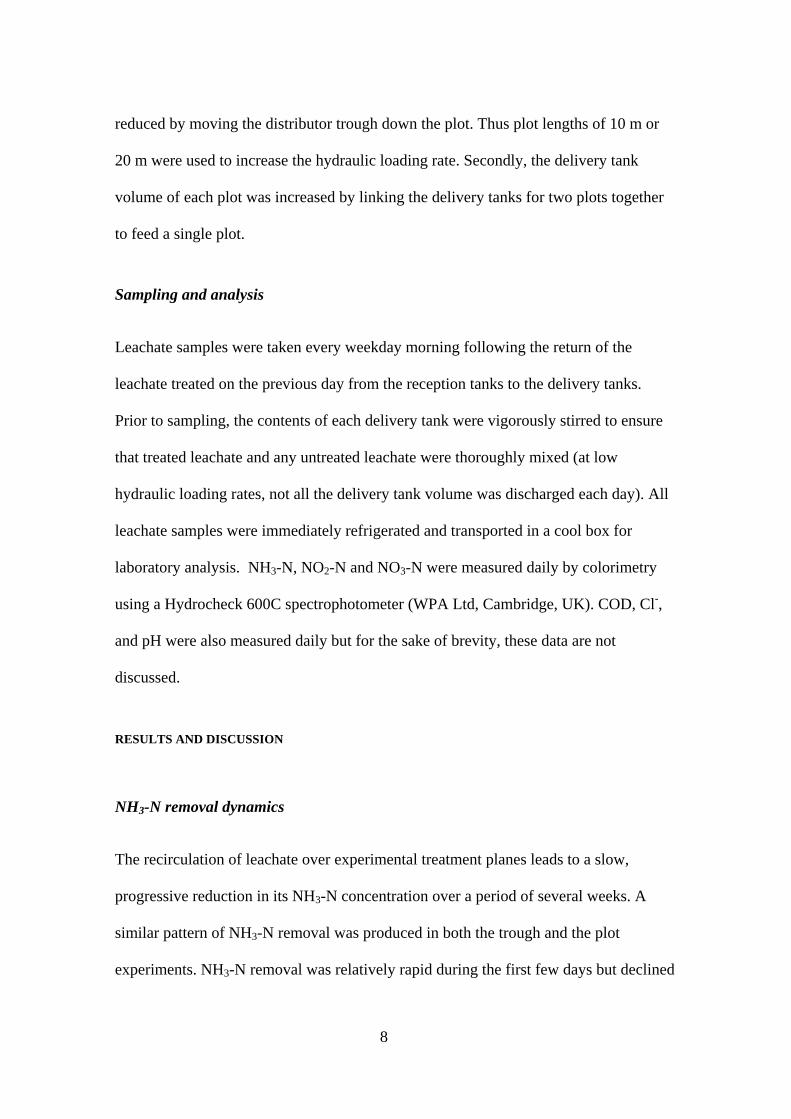
pathway for access (Figure 1). A timber frame was erected on each plot and, to prevent
seepage from the plots, a polyethylene sheet was positioned over the wooden frame,
covering each pair of plots as shown in Figure 2. The stockpiled topsoil clods were
broken up to form smaller, more manageable aggregates with a power harrow and
carefully replaced inside the polythene-lined plots. The soil was then irrigated with
fresh water for 8 hours and allowed to consolidate for a week. High and low areas on
the plot surfaces were evened out by raking and the level checked at 1 m intervals
downslope to ensure that a uniform 2% gradient was achieved.
Seed of the grass Agrostis stolonifera was sown on the completed plots, at the
supplier’s recommended rate (50 g/m2). A. stolonifera was selected because it was a
dominant member of the grassland community on two local treatment planes. At both
sites, the grass appeared to tolerate periodic inundation with leachate with no apparent
ill effects. In pot trials, A. stolonifera has outperformed (Bradford, 1992; Boon, 1996;
Elliot, 1997), other salt-tolerant and waterlogging-tolerant grass species (e.g. Spartina
townsendii and Pucinellia maritima) when irrigated with raw leachate and can survive
for weeks submerged in water containing high concentrations of chloride.
A 1.2 m3 delivery tank was placed on the bund at the upper end of each of the plots.
Landfill leachate for the experiments came from Shanks Ltd.’s Calvert landfill site in
5
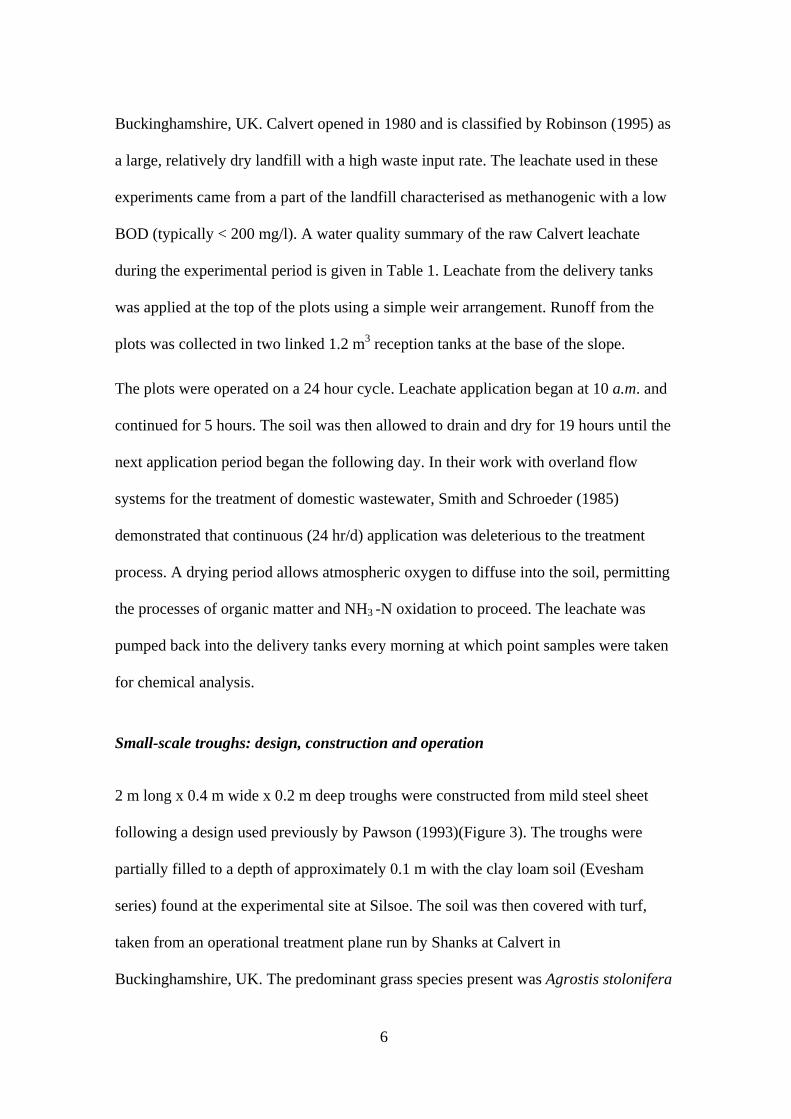
Buckinghamshire, UK. Calvert opened in 1980 and is classified by Robinson (1995) as
a large, relatively dry landfill with a high waste input rate. The leachate used in these
experiments came from a part of the landfill characterised as methanogenic with a low
BOD (typically < 200 mg/l). A water quality summary of the raw Calvert leachate
during the experimental period is given in Table 1. Leachate from the delivery tanks
was applied at the top of the plots using a simple weir arrangement. Runoff from the
plots was collected in two linked 1.2 m3 reception tanks at the base of the slope.
The plots were operated on a 24 hour cycle. Leachate application began at 10 a.m. and
continued for 5 hours. The soil was then allowed to drain and dry for 19 hours until the
next application period began the following day. In their work with overland flow
systems for the treatment of domestic wastewater, Smith and Schroeder (1985)
demonstrated that continuous (24 hr/d) application was deleterious to the treatment
process. A drying period allows atmospheric oxygen to diffuse into the soil, permitting
the processes of organic matter and NH3 -N oxidation to proceed. The leachate was
pumped back into the delivery tanks every morning at which point samples were taken
for chemical analysis.
Small-scale troughs: design, construction and operation
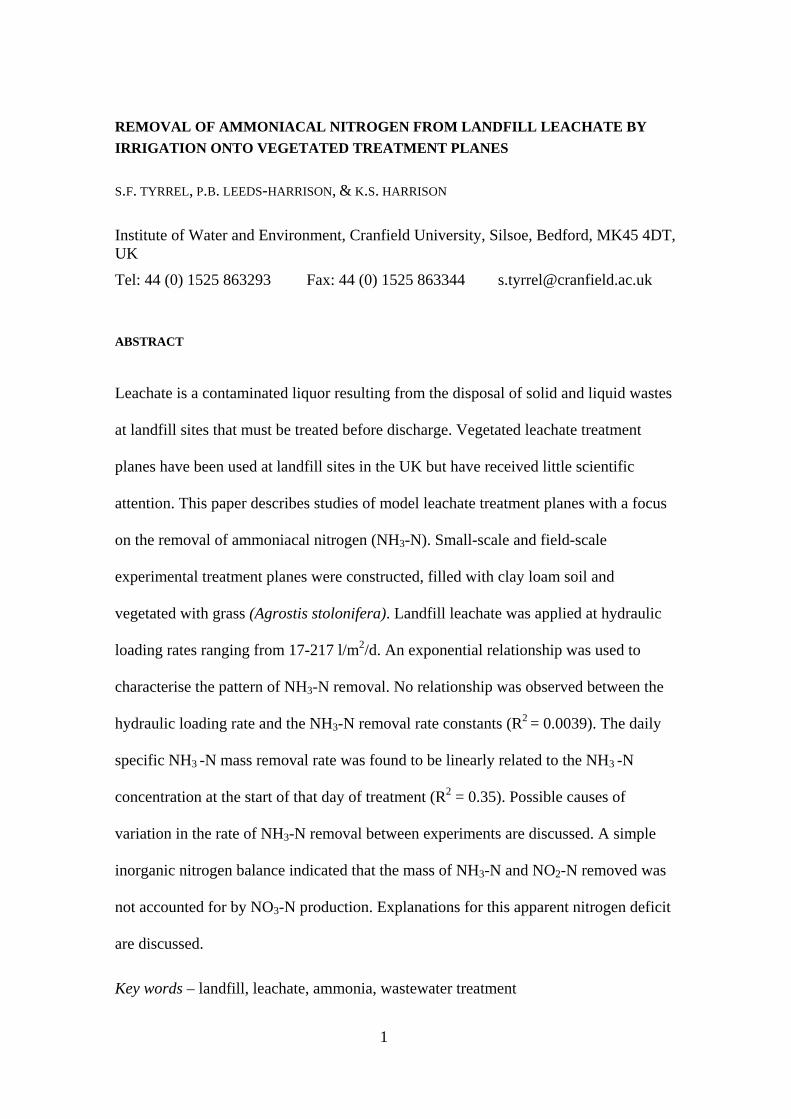
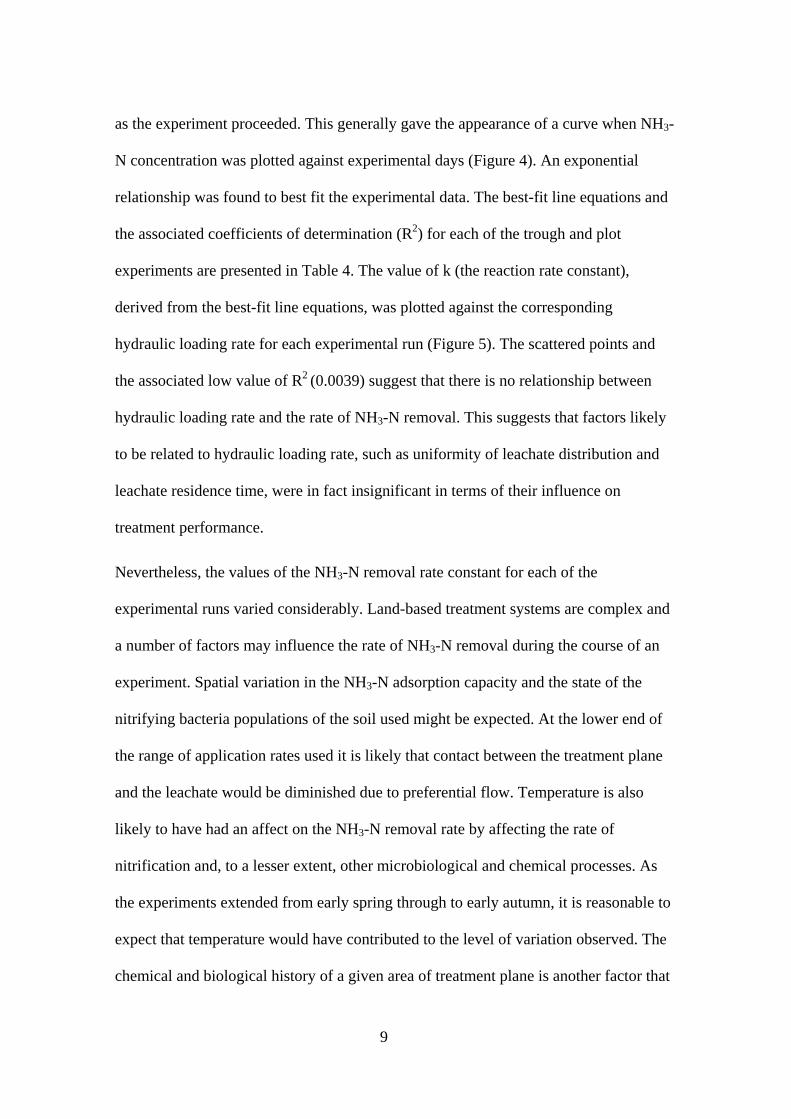
2 m long x 0.4 m wide x 0.2 m deep troughs were constructed from mild steel sheet
following a design used previously by Pawson (1993)(Figure 3). The troughs were
partially filled to a depth of approximately 0.1 m with the clay loam soil (Evesham
series) found at the experimental site at Silsoe. The soil was then covered with turf,
taken from an operational treatment plane run by Shanks at Calvert in
Buckinghamshire, UK. The predominant grass species present was Agrostis stolonifera
6
(creeping bent). The troughs were positioned such that they had a 2% down-slope
gradient and a 0% cross-slope gradient. Leachate was applied to each trough from its
own 220 l reservoir (a polypropylene barrel) that discharged its contents via a control
valve to a transverse distributor pipe positioned at the upper end of the trough. At the
lower end of the trough, leachate runoff was collected in an identical 220 l
polypropylene barrel. The troughs were operated in the same ways as the field-scale
plots.
Plot and trough experimental programme
The principal experimental variable under investigation was the hydraulic loading rate.
The hydraulic loading rate has the potential to influence the functioning of the system
in a number of ways. At low hydraulic loading rates leachate may not be well
distributed leading to poor contact with the available surface area of the treatment
plane. At higher hydraulic loading rates depth of flow will increase. This will in turn
lead to higher velocities and lower residence times. Hydraulic loading rates were tested
within the range 17 - 217 l/m2/d (17-217 mm/d)(Table 2 & Table 3). This compares
with estimated hydraulic loading rates of 52-72 l/m2/d (52 mm/d-72mm/d) at treatment
planes operated by Shanks Ltd.
A start up plot trial served to draw attention to practical problems associated with the
larger-scale experiment. It was found that the 1.2 m3 capacity of the delivery tanks was
insufficient to sustain an experimental run of longer than 2 weeks on a 25 m2 plot due
to water loss by evapotranspiration. For example, during hot weather,
evapotranspiration could be 3 mm/d, equivalent to 75 l per 25 m plot per day. This
problem was overcome in two ways. Firstly, plot length (and therefore area) was
7
reduced by moving the distributor trough down the plot. Thus plot lengths of 10 m or
20 m were used to increase the hydraulic loading rate. Secondly, the delivery tank
volume of each plot was increased by linking the delivery tanks for two plots together
to feed a single plot.
Sampling and analysis
Leachate samples were taken every weekday morning following the return of the
leachate treated on the previous day from the reception tanks to the delivery tanks.
Prior to sampling, the contents of each delivery tank were vigorously stirred to ensure
that treated leachate and any untreated leachate were thoroughly mixed (at low
hydraulic loading rates, not all the delivery tank volume was discharged each day). All
leachate samples were immediately refrigerated and transported in a cool box for
laboratory analysis. NH3-N, NO2-N and NO3-N were measured daily by colorimetry
using a Hydrocheck 600C spectrophotometer (WPA Ltd, Cambridge, UK). COD, Cl-,
and pH were also measured daily but for the sake of brevity, these data are not
discussed.
RESULTS AND DISCUSSION
NH3-N removal dynamics
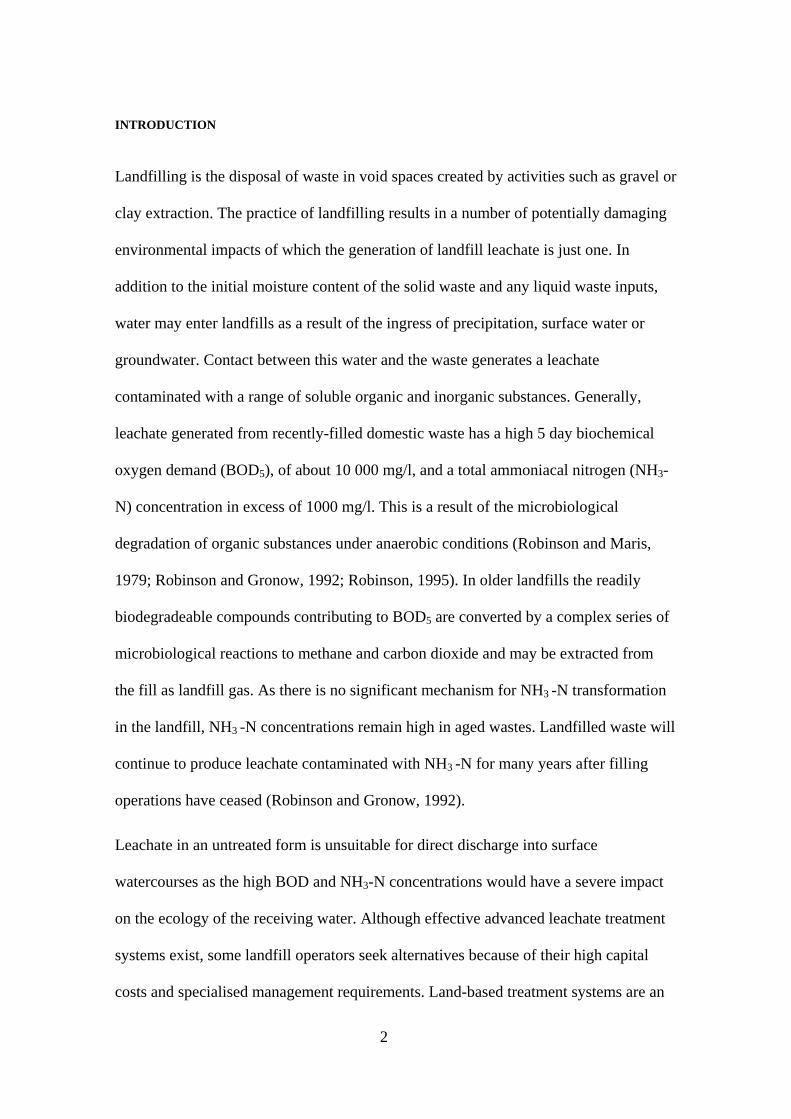
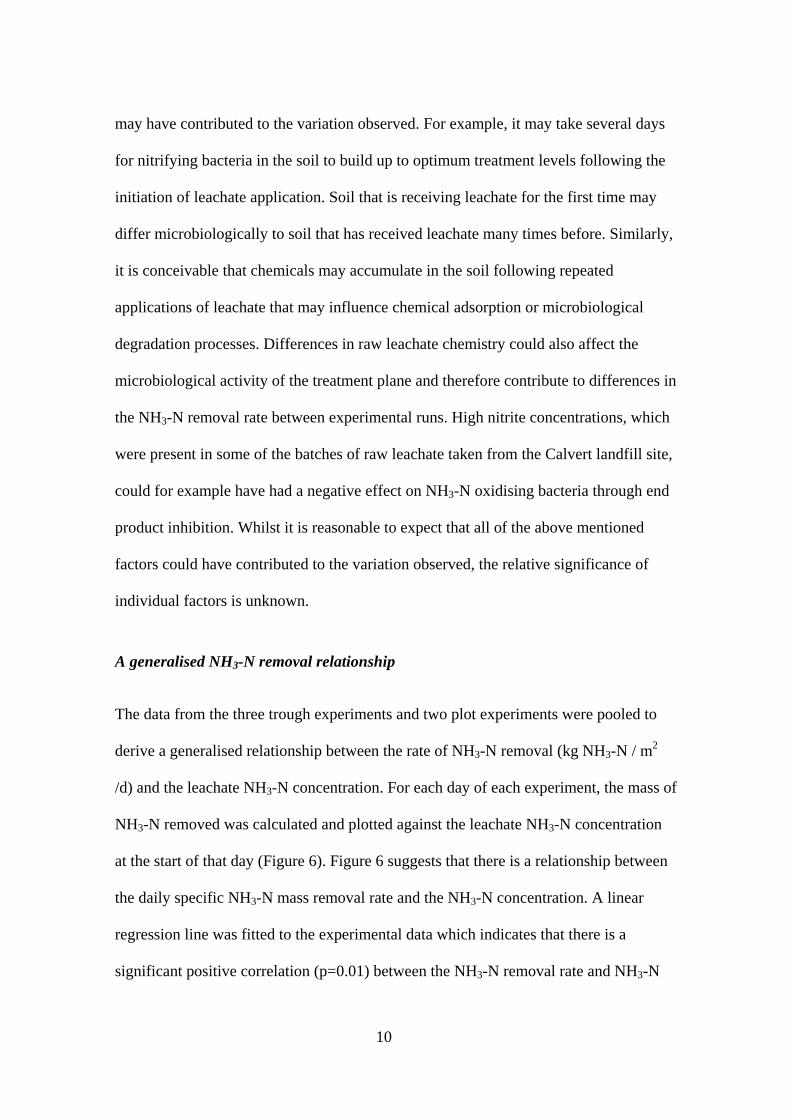
The recirculation of leachate over experimental treatment planes leads to a slow,
progressive reduction in its NH3-N concentration over a period of several weeks. A
similar pattern of NH3-N removal was produced in both the trough and the plot
experiments. NH3-N removal was relatively rapid during the first few days but declined
8
as the experiment proceeded. This generally gave the appearance of a curve when NH3-
N concentration was plotted against experimental days (Figure 4). An exponential
relationship was found to best fit the experimental data. The best-fit line equations and
the associated coefficients of determination (R2) for each of the trough and plot
experiments are presented in Table 4. The value of k (the reaction rate constant),
derived from the best-fit line equations, was plotted against the corresponding
hydraulic loading rate for each experimental run (Figure 5). The scattered points and
the associated low value of R2 (0.0039) suggest that there is no relationship between
hydraulic loading rate and the rate of NH3-N removal. This suggests that factors likely
to be related to hydraulic loading rate, such as uniformity of leachate distribution and
leachate residence time, were in fact insignificant in terms of their influence on
treatment performance.
Nevertheless, the values of the NH3-N removal rate constant for each of the
experimental runs varied considerably. Land-based treatment systems are complex and
a number of factors may influence the rate of NH3-N removal during the course of an
experiment. Spatial variation in the NH3-N adsorption capacity and the state of the
nitrifying bacteria populations of the soil used might be expected. At the lower end of
the range of application rates used it is likely that contact between the treatment plane
and the leachate would be diminished due to preferential flow. Temperature is also
likely to have had an affect on the NH3-N removal rate by affecting the rate of
nitrification and, to a lesser extent, other microbiological and chemical processes. As
the experiments extended from early spring through to early autumn, it is reasonable to
expect that temperature would have contributed to the level of variation observed. The
chemical and biological history of a given area of treatment plane is another factor that
9
may have contributed to the variation observed. For example, it may take several days
for nitrifying bacteria in the soil to build up to optimum treatment levels following the
initiation of leachate application. Soil that is receiving leachate for the first time may
differ microbiologically to soil that has received leachate many times before. Similarly,
it is conceivable that chemicals may accumulate in the soil following repeated
applications of leachate that may influence chemical adsorption or microbiological
degradation processes. Differences in raw leachate chemistry could also affect the
microbiological activity of the treatment plane and therefore contribute to differences in
the NH3-N removal rate between experimental runs. High nitrite concentrations, which
were present in some of the batches of raw leachate taken from the Calvert landfill site,
could for example have had a negative effect on NH3-N oxidising bacteria through end
product inhibition. Whilst it is reasonable to expect that all of the above mentioned
factors could have contributed to the variation observed, the relative significance of
individual factors is unknown.
A generalised NH3-N removal relationship
The data from the three trough experiments and two plot experiments were pooled to
derive a generalised relationship between the rate of NH3-N removal (kg NH3-N / m2
/d) and the leachate NH3-N concentration. For each day of each experiment, the mass of
NH3-N removed was calculated and plotted against the leachate NH3-N concentration
at the start of that day (Figure 6). Figure 6 suggests that there is a relationship between
the daily specific NH3-N mass removal rate and the NH3-N concentration. A linear
regression line was fitted to the experimental data which indicates that there is a
significant positive correlation (p=0.01) between the NH3-N removal rate and NH3-N
10
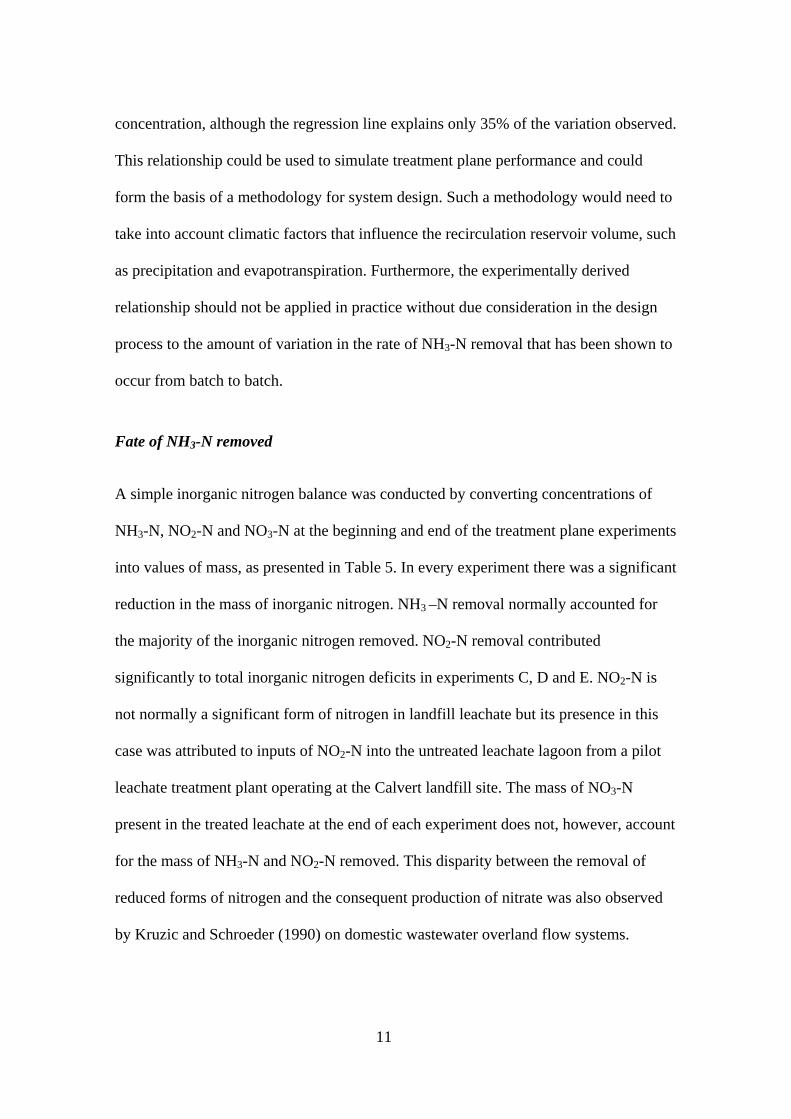
concentration, although the regression line explains only 35% of the variation observed.
This relationship could be used to simulate treatment plane performance and could
form the basis of a methodology for system design. Such a methodology would need to
take into account climatic factors that influence the recirculation reservoir volume, such
as precipitation and evapotranspiration. Furthermore, the experimentally derived
relationship should not be applied in practice without due consideration in the design
process to the amount of variation in the rate of NH3-N removal that has been shown to
occur from batch to batch.
Fate of NH3-N removed
A simple inorganic nitrogen balance was conducted by converting concentrations of
NH3-N, NO2-N and NO3-N at the beginning and end of the treatment plane experiments
into values of mass, as presented in Table 5. In every experiment there was a significant
reduction in the mass of inorganic nitrogen. NH3 –N removal normally accounted for
the majority of the inorganic nitrogen removed. NO2-N removal contributed
significantly to total inorganic nitrogen deficits in experiments C, D and E. NO2-N is
not normally a significant form of nitrogen in landfill leachate but its presence in this
case was attributed to inputs of NO2-N into the untreated leachate lagoon from a pilot
leachate treatment plant operating at the Calvert landfill site. The mass of NO3-N
present in the treated leachate at the end of each experiment does not, however, account
for the mass of NH3-N and NO2-N removed. This disparity between the removal of
reduced forms of nitrogen and the consequent production of nitrate was also observed
by Kruzic and Schroeder (1990) on domestic wastewater overland flow systems.
11

Kruzic and Schroeder (1990) argued that cation exchange of ammonium ions at soil
particle surfaces would lead, in the short term at least, to the net removal of inorganic N
from the water being treated. Regeneration of cation exchange sites would appear to be
vital to the sustainable operation of a treatment plane, although in laboratory
experiments it has been shown that cation exchange can facilitate considerable long-
term NH3-N removal in soils repeatedly challenged with leachate (Tyrrel, 1999).
Gaseous nitrogen losses offer another explanation of the apparent deficit. Nitrate spike
experiments carried out by Kruzic and Schroeder (1990) indicated that denitrification
was probably occurring. Gaseous loss of ammonia to the atmosphere through the
process of volatilisation may also occur. In studies of surface applied sewage sludge,
Ryan and Keeney (1975) found that between 11% - 60% of applied ammoniacal
nitrogen was lost by volatilisation, with the variation being dependent upon soil type.
Soils with a relatively high cation exchange capacity, such as those used in the Silsoe
experiments, would be expected to have relatively low volatilisation losses however. A
further component of the apparent nitrogen deficit could be accounted for by
assimilation of inorganic nitrogen into vegetation biomass. Irrigation of the Silsoe
troughs and plots with leachate led to luxuriant growth of Agrostis stolonifera.
Estimates made during the course of experiment E indicated that between 3-11% of the
total nitrogen deficit for that experiment could be attributed to above ground biomass
production. Laboratory experiments designed to verify the mechanisms responsible for
NH3-N removal and their relative significance have been conducted and will be
reported elsewhere.
12
CONCLUSIONS
1. NH3 -N removal from leachate applied to experimental treatment planes is a slow
process in comparison with conventional wastewater treatment systems. An
exponential relationship was found to best fit the experimental data (R2 in the range
0.83-0.99).
2. The rate of NH3-N removal was found to vary significantly between experimental
runs. Although it is possible to identify possible causes of this variation it is not
known if they could be brought under operational control in order to obtain more
consistent performance. No relationship was observed between the hydraulic
loading rate and the NH3-N removal rate constants (R2 = 0.0039).
3. The mass of NH3 -N removed per square metre on any one day was linearly related
to the NH3 -N concentration at the start of that day of treatment as follows:
NH3 -N removal rate (kg/m2/d) = 2 x 10⁻⁵ x NH3 -N concentration (mg/l). This
relationship could be used as a basis for a simple treatment plane simulation model.
The development of such an application must take into account the considerable
experimental variation observed and the need for the inclusion of climatic data so
that changes in leachate volume may be catered for in the calculation.
4. The mass of NH3-N and NO2-N removed from the leachate applied cannot be
accounted for by NO3-N production in the final effluent. A combination of
chemical and biological processes is likely to govern the fate of nitrogen in this
system.
13

Acknowledgements
The authors wish to acknowledge Martin Lowe of Shanks Ltd. for his help and advice during the course
of this research. The project was funded under contract No. PECD 7/10/252 to the Department of the
Environment’s Wastes Technical Division. The Controlled Waste Management R&D programme of
WTD transferred to the Environment Agency and became the Waste Regulation and Management
Research Programme on the Agency’s creation in April 1996.
14

REFERENCES
Boon, S., (1996) Landfill leachate treatment using vegetated treatment planes.
Unpublished MSc thesis. Cranfield University.
Bradford, P.M. (1992). The identification of species for use on landfill vegetated
treatment planes.. Unpublished MSc thesis. Cranfield University.
Elliott, L. (1997) An investigation of the effect of landfill leachate on the health of
selected grass species. Unpublished MSc thesis. Cranfield University.
Kruzic, A.P. and Schroeder, E.D. (1990) Nitrogen removal in the overland flow
wastewater treatment process - removal mechanisms. Research Journal of the Water
Pollution Control Federation. 62, 7, 867-876.
Maehlum, T. (1995) Treatment of landfill leachate in on-site lagoons and constructed
wetlands. Water Science and Technology. 32, 3, 129-135.
Martin, C.D., and. Johnson K.D (1995) The use of extended aeration and in-series
surface-flow wetlands for landfill leachate treatment. Water Science and Technology.
32, 3, 119-128.
Pawson, R. (1993) The efficiency of overland flow wastewater systems in the treatment
of landfill leachate. Unpublished MSc thesis. Cranfield University.
15
Robinson, H.D. (1995) A review of the composition of leachates from domestic wastes
in landfill sites. Report to the Wastes Technical Division of the Department of the
Environment. Contract No. PECD 7/10/238.
Robinson, H.D. and Gronow J. (1992) Groundwater protection in the UK: assessment
of the landfill leachate source-term. Journal of the Institution of Water and
Environmental Management. 6, 2, 229-235.
Robinson, H.D. and Maris P.J. (1979). Leachate from domestic waste: generation,
composition, and treatment. A review. Water Research Centre Technical Report
TR108.
Ryan, J.A. and Keeney, D.R. (1975) Ammonia volatilisation from surface applied
wastewater sludge. Journal of the Water Pollution Control Federation. 47, 2, 386-393
Smith, R.G. and Schroeder E.D. (1985) Field studies of the overland flow process for
the treatment of raw and primary treated municipal wastewater. Journal of the Water
Pollution Control Federation. 57, 7, 785-794.
Tyrrel, S.F. (1999) The removal of ammoniacal nitrogen from landfill leachate using
vegetated treatment planes. Unpublished PhD thesis. Cranfield University.
16
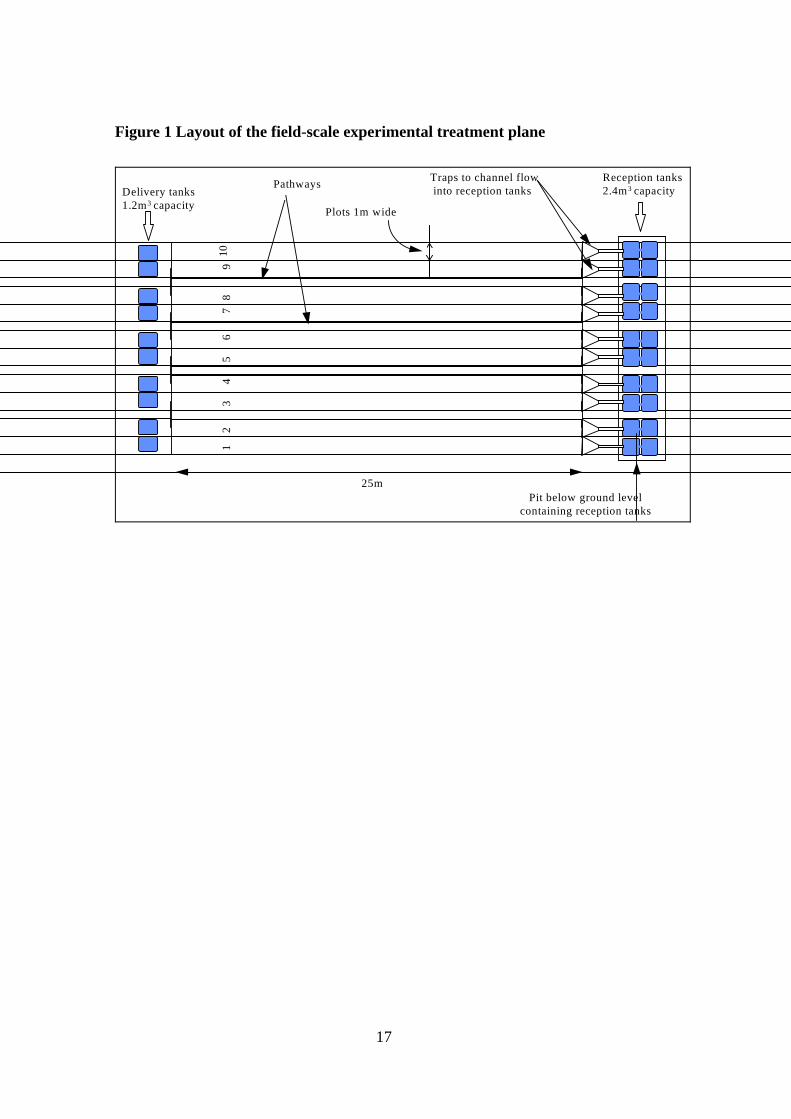
Figure 1 Layout of the field-scale experimental treatment plane
Reception tanks2.4m3 capacity
12
34
56
78
910
25m
Delivery tanks1.2m3 capacity
Pit below ground levelcontaining reception tanks
Pathways
Plots 1m wide
Traps to channel flow into reception tanks
17
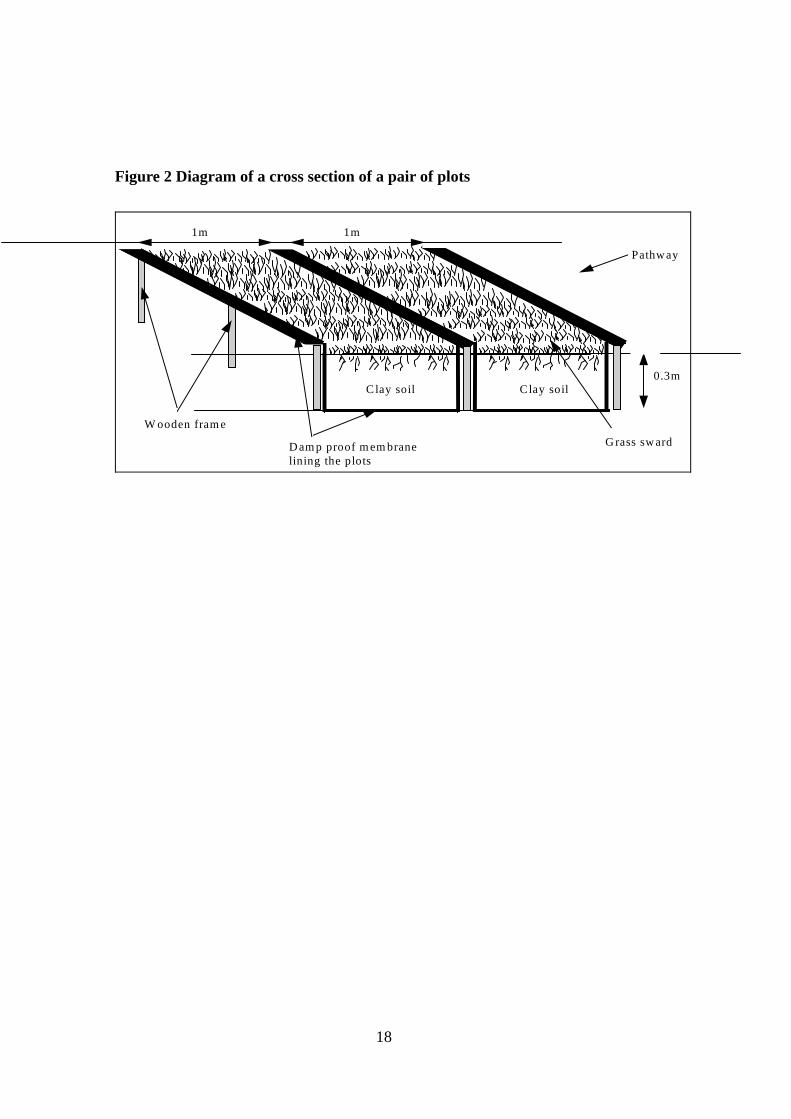
Figure 2 Diagram of a cross section of a pair of plots
0.3m
Pathw ay
1m1m
W ooden fram e
D am p proof m em branelining the plots
C lay soil C lay soil
G rass sw ard
18
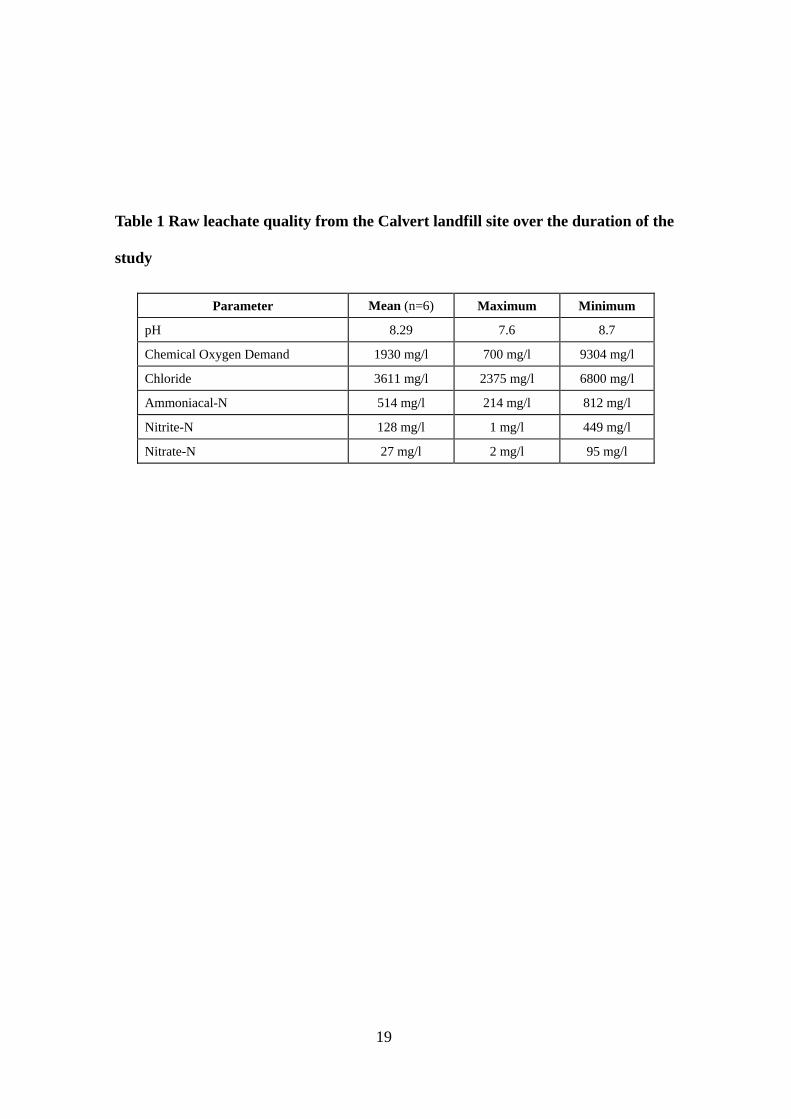
Table 1 Raw leachate quality from the Calvert landfill site over the duration of the
study
Parameter Mean (n=6) Maximum Minimum
pH 8.29 7.6 8.7
Chemical Oxygen Demand 1930 mg/l 700 mg/l 9304 mg/l
Chloride 3611 mg/l 2375 mg/l 6800 mg/l
Ammoniacal-N 514 mg/l 214 mg/l 812 mg/l
Nitrite-N 128 mg/l 1 mg/l 449 mg/l
Nitrate-N 27 mg/l 2 mg/l 95 mg/l
19
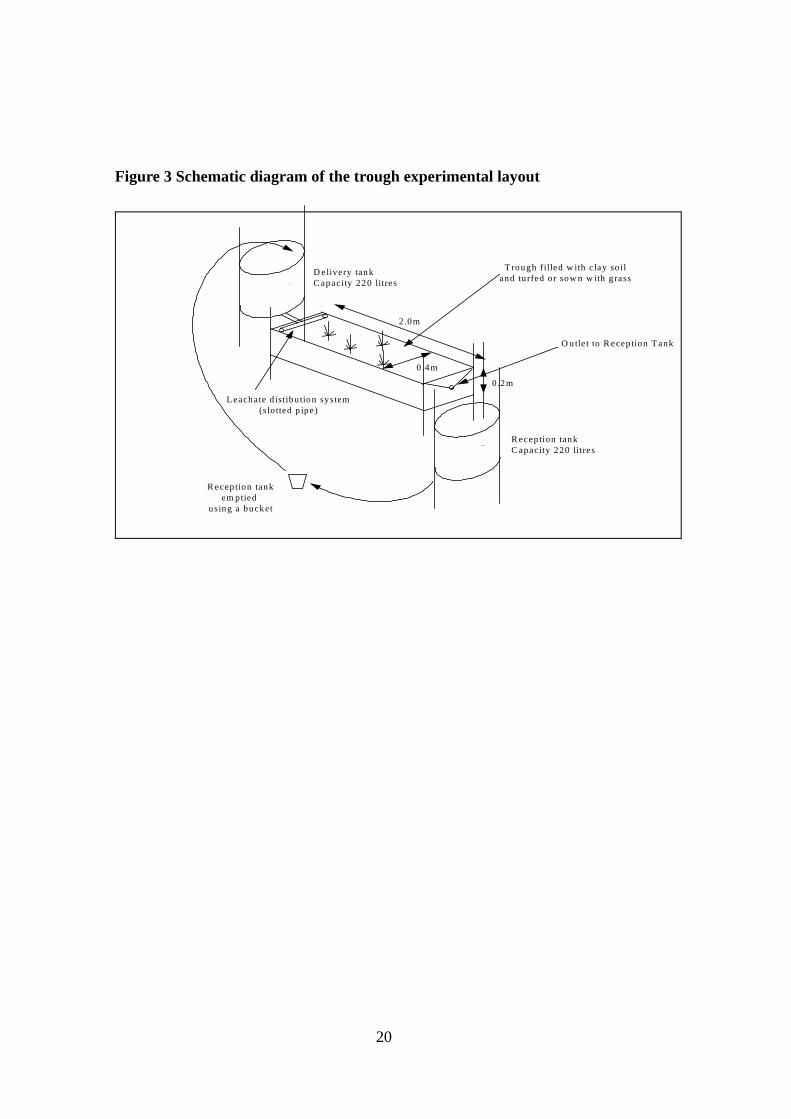
Figure 3 Schematic diagram of the trough experimental layout
2 .0m
0.2m
0.4m
R ecep tion tankC apacity 220 litres
D elivery tankC apacity 220 litres
O utle t to R ecep tion T ank
L eachate d istibu tion system(slo tted p ipe)
R ecep tion tankem ptied
using a bucket
T rough filled w ith c lay so iland tu rfed o r sow n w ith g rass
20

Table 2 Summary of the trough experimental programme
Experiment Duration (days)
Trough number Hydraulic loading rate
(l/m2/d)
A 32 Trough 1
Trough 2
87
217
B 30 Trough 1
Trough 2
Trough 3
Trough 4
90
44
90
44
C 18 Trough 1
Trough 2
Trough 3
78
43
17
NB: The hydraulic loading rate refers to the volume of leachate applied per square metre of treatment plane surface area during the 5 hours in the daily cycle that leachate was being applied.
21

Table 3 Summary of the plot experimental programme
Experiment Duration (days)
Plot number
Plot length
(m)
Hydraulic loading rate
(l/m2/d)
Start-up 13 Plots 1-10 25 Various
D 22 Plot 2
Plot 6
Plot 9
10
20
20
70
24
37
E 35 Plot 2
Plot 4
Plot 6
Plot 9
10
10
10
10
75
45
23
45
NB: The hydraulic loading rate refers to the volume of leachate applied per square metre of treatment plane surface area during the 5 hours in the daily cycle that leachate was being applied.
22
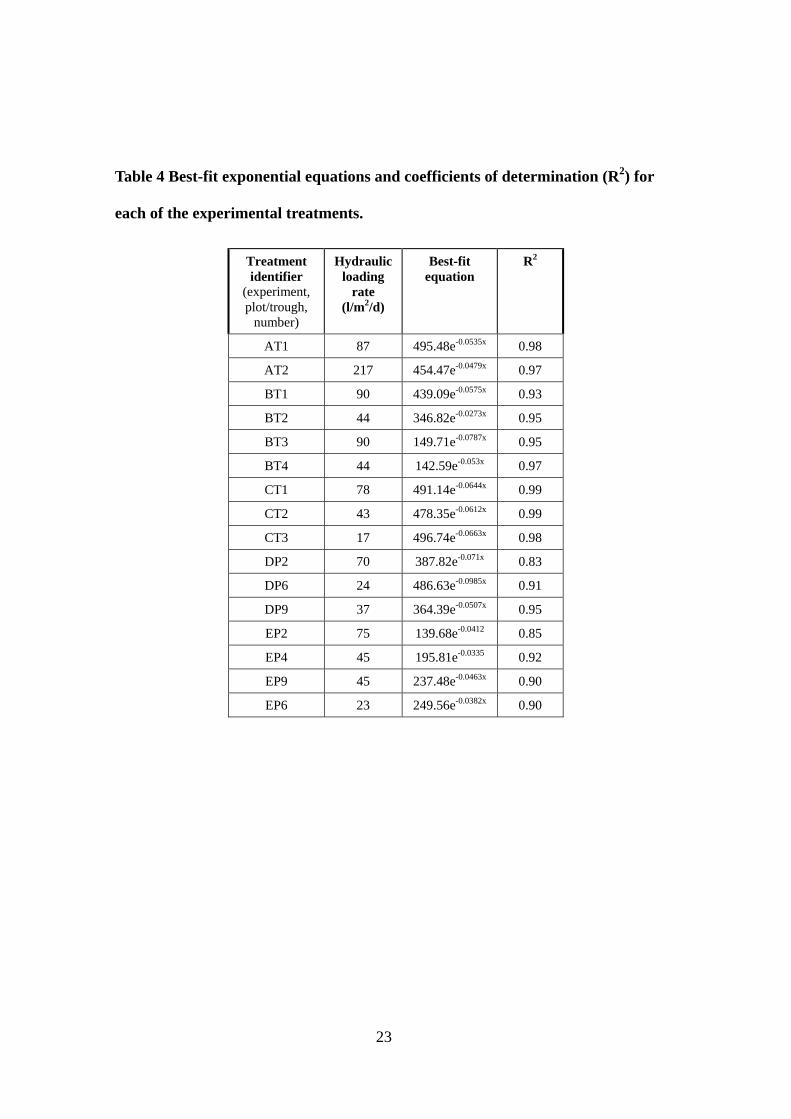
Table 4 Best-fit exponential equations and coefficients of determination (R2) for
each of the experimental treatments.
Treatment identifier
(experiment, plot/trough,
number)
Hydraulic loading
rate (l/m2/d)
Best-fit equation
R2
AT1 87 495.48e-0.0535x 0.98
AT2 217 454.47e-0.0479x 0.97
BT1 90 439.09e-0.0575x 0.93
BT2 44 346.82e-0.0273x 0.95
BT3 90 149.71e-0.0787x 0.95
BT4 44 142.59e-0.053x 0.97
CT1 78 491.14e-0.0644x 0.99
CT2 43 478.35e-0.0612x 0.99
CT3 17 496.74e-0.0663x 0.98
DP2 70 387.82e-0.071x 0.83
DP6 24 486.63e-0.0985x 0.91
DP9 37 364.39e-0.0507x 0.95
EP2 75 139.68e-0.0412 0.85
EP4 45 195.81e-0.0335 0.92
EP9 45 237.48e-0.0463x 0.90
EP6 23 249.56e-0.0382x 0.90
23
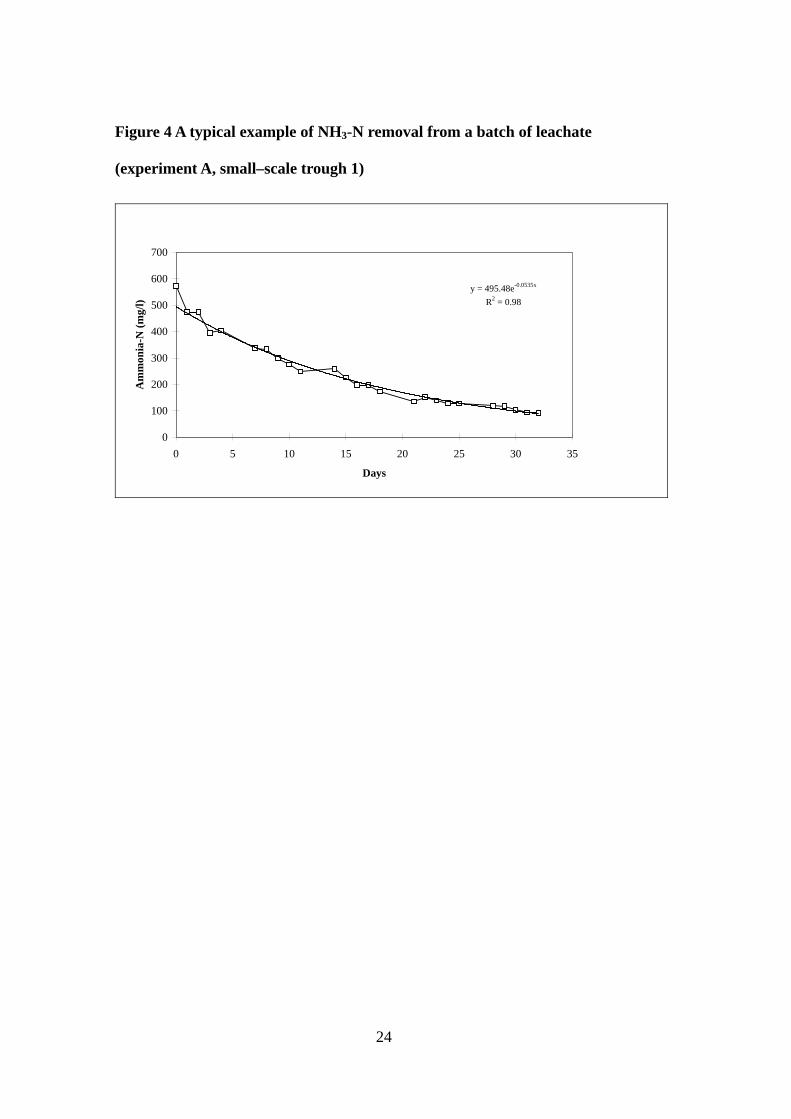
Figure 4 A typical example of NH3-N removal from a batch of leachate
(experiment A, small–scale trough 1)
y = 495.48e-0.0535x
R2 = 0.98
0
100
200
300
400
500
600
700
0 5 10 15 20 25 30 35
Days
Am
mon
ia-N
(mg/
l)
24
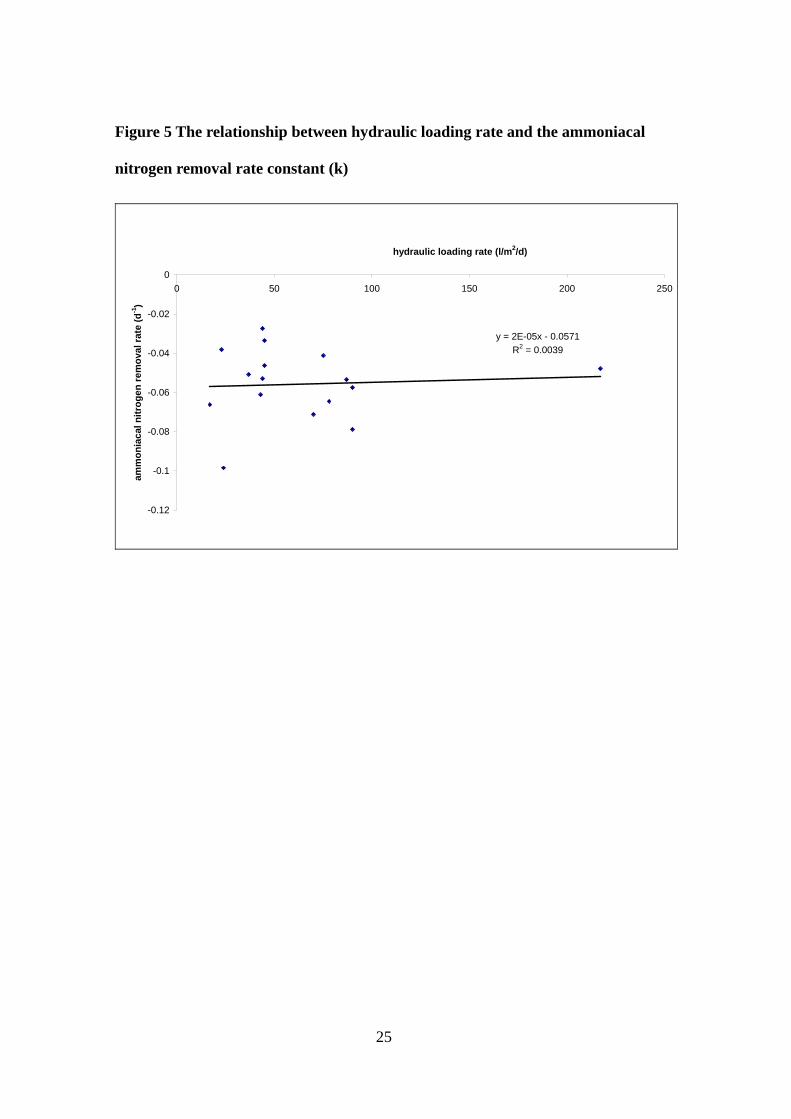
Figure 5 The relationship between hydraulic loading rate and the ammoniacal
nitrogen removal rate constant (k)
y = 2E-05x - 0.0571R2 = 0.0039
-0.12
-0.1
-0.08
-0.06
-0.04
-0.02
00 50 100 150 200 250
hydraulic loading rate (l/m2/d)
amm
onia
cal n
itrog
en re
mov
al ra
te (d
-1)
25
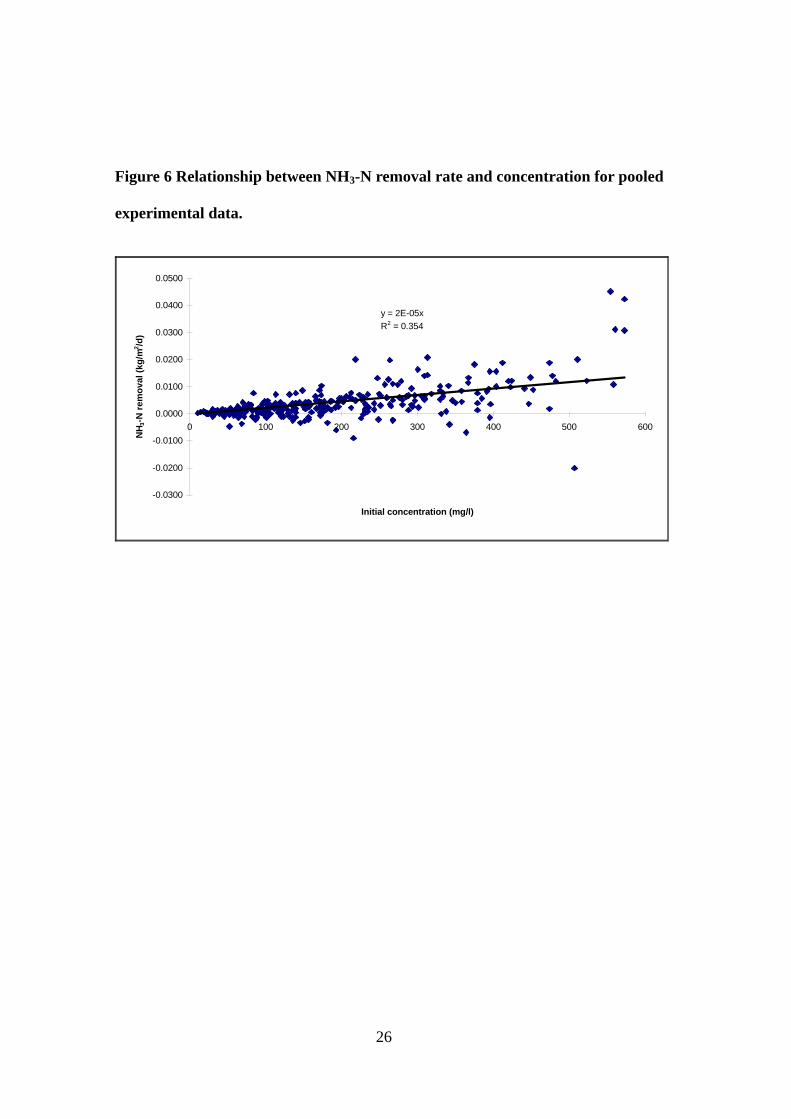
Figure 6 Relationship between NH3-N removal rate and concentration for pooled
experimental data.
y = 2E-05xR2 = 0.354
-0.0300
-0.0200
-0.0100
0.0000
0.0100
0.0200
0.0300
0.0400
0.0500
0 100 200 300 400 500 600
Initial concentration (mg/l)
NH 3
-N re
mov
al (k
g/m
2 /d)
26
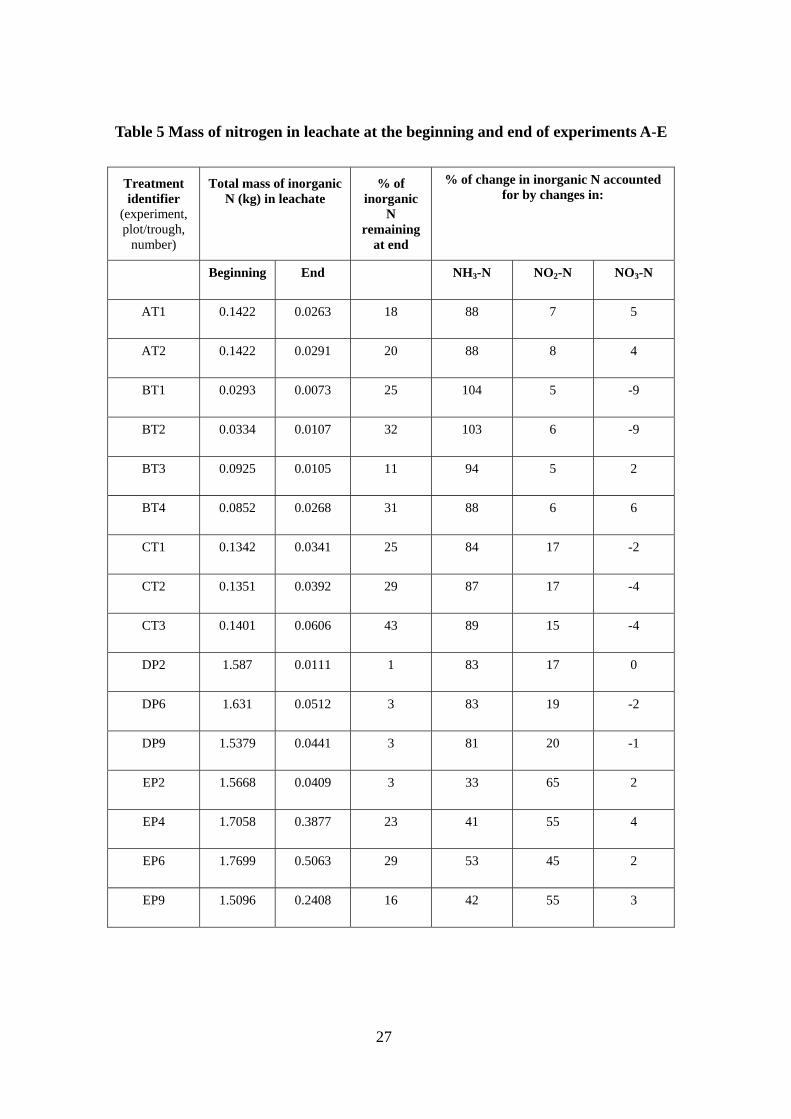
Table 5 Mass of nitrogen in leachate at the beginning and end of experiments A-E
Treatment identifier
(experiment, plot/trough,
number)
Total mass of inorganic N (kg) in leachate
% of inorganic
N remaining
at end
% of change in inorganic N accounted for by changes in:
Beginning End NH3-N NO2-N NO3-N
AT1 0.1422 0.0263 18 88 7 5
AT2 0.1422 0.0291 20 88 8 4
BT1 0.0293 0.0073 25 104 5 -9
BT2 0.0334 0.0107 32 103 6 -9
BT3 0.0925 0.0105 11 94 5 2
BT4 0.0852 0.0268 31 88 6 6
CT1 0.1342 0.0341 25 84 17 -2
CT2 0.1351 0.0392 29 87 17 -4
CT3 0.1401 0.0606 43 89 15 -4
DP2 1.587 0.0111 1 83 17 0
DP6 1.631 0.0512 3 83 19 -2
DP9 1.5379 0.0441 3 81 20 -1
EP2 1.5668 0.0409 3 33 65 2
EP4 1.7058 0.3877 23 41 55 4
EP6 1.7699 0.5063 29 53 45 2
EP9 1.5096 0.2408 16 42 55 3
27
Recommended