East Tennessee State UniversityDigital Commons @ East
Tennessee State University
Electronic Theses and Dissertations Student Works
12-2007
Relationships between Student Attendance andTest Scores on the Virginia Standards of LearningTests.Jeffrey CassellEast Tennessee State University
Follow this and additional works at: https://dc.etsu.edu/etd
Part of the Educational Sociology Commons
This Dissertation - Open Access is brought to you for free and open access by the Student Works at Digital Commons @ East Tennessee StateUniversity. It has been accepted for inclusion in Electronic Theses and Dissertations by an authorized administrator of Digital Commons @ EastTennessee State University. For more information, please contact [email protected].
Recommended CitationCassell, Jeffrey, "Relationships between Student Attendance and Test Scores on the Virginia Standards of Learning Tests." (2007).Electronic Theses and Dissertations. Paper 2152. https://dc.etsu.edu/etd/2152

Relationships Between Student Attendance and Test Scores
on the Virginia Standards of Learning Tests
_____________________
A dissertation
presented to
the faculty of the Department of Educational Leadership and Policy Analysis
East Tennessee State University
In partial fulfillment
of the requirements for the degree
Doctor of Education
_____________________
by
Jeffrey D. Cassell
December 2007
_____________________
Dr. W. Hal Knight, ChairDr. Jim LampleyDr. Eric GloverDr. George Poole
Keywords: No Child Left Behind, Standards of Learning, Criterion-Reference Tests, Student Attendance,
Student Performance, Subgroup Performance

2
ABSTRACT
Relationships Between Student Attendance and Test Scores
on the Virginia Standards of Learning Tests
by
Jeffrey Cassell
This study examines the relationship between student attendance and
student test scores on a criterion-referenced test, using test scores
of all 5th graders in Virginia who participated in the 2005-2006
Standards of Learning tests in reading and mathematics. Data collection
for this study was performed with the cooperation of the Virginia
Department of Education using a state database of student testing
information. Pearson correlation coefficients were determined for the
overall student population and for the subgroups of economically
disadvantaged, students with disabilities, limited English proficient,
white, black, and Hispanic. The results of this study indicate that
there is a significant positive correlation (p<.01) between student
attendance, as measured by the number of days present, and student
performance on the Virginia SOL test, a criterion-referenced test.
Positive correlations were found between student attendance and student
test scores for all subgroups. The correlation between student
attendance and student performance on the SOL mathematics test was
higher than the correlation for the same variables on the English test.
The correlation for the overall student population on the English SOL
test was higher than the correlation for any subgroup on the English
SOL test. Only the LEP and Hispanic subgroups had higher correlations
on the mathematics test than the overall student population. This study
will contribute to a growing body of research resulting from the

3
enactment of the No Child Left Behind legislation and the national
attention that this legislation has focused on student attendance and
student performance on standardized tests.

4
DEDICATION
I dedicate this study to my family:
To my parents, Otho and Anne, from whom I learned the values of
education and hard work,
To my sister, Melanie, who supported my efforts in ways too
numerous to count,
To my daughter, Emily, who has read and studied countless hours
alongside Dad and who has shown patience and understanding beyond her
years during Dad’s academic endeavor.
Most importantly, I dedicate this study to Kathy Johnson, whose
friendship, support and encouragement grew into love, support, and
encouragement that I cherish every day.

5
ACKNOWLEDGEMENTS
I would like to acknowledge and thank:
Dr. Hal Knight for his guidance and wisdom during this process.
Dr. Knight’s feedback, patience, and high expectations provided great
support in keeping me focused on the completion of this study.
Dr. Jim Lampley, Dr. George Poole, and Dr. Eric Glover, members
of my committee, all of whom have provided valuable feedback and
assistance to me for which I am grateful.
Jeff Comer, my colleague, cohort member, and friend, for his many
hours of “commuter conversation”, as well as his support,
encouragement, and commiseration.
Sam Hambrick and David Helms, the best mentors a principal could
have, and the best friends anyone could have.
Dr. Michael Robinson, my current superintendent, and Dr. Marvin
Winters, my former superintendent, for their support and the
opportunities they provided me.

6
CONTENTS
Page
ABSTRACT ............................................................. 2
DEDICATIONS ............................................................ 4
ACKNOWLEDGEMENTS........................................................ 5
LIST OF TABLES ......................................................... 8
Chapter
1. INTRODUCTION ...................................................... 9
Statement of the Problem.......................................... 11
Research Questions................................................ 11
Significance of the Study......................................... 12
Definition of Terms............................................... 12
Delimitations..................................................... 13
Limitations....................................................... 13
Overview of the Study............................................. 13
2. REVIEW OF LITERATURE............................................... 15
Introduction...................................................... 15
Attendance and Student Achievement................................ 15
Attendance and Student Achievement on High-Stakes Assessments .... 19
Criterion-Referenced Assessment ............................... 21
No Child Left Behind Legislation.................................. 24
Determination of Adequate Yearly Progress ..................... 27
Student Achievement of NCLB Subgroups ......................... 30
Summary........................................................... 35
3. METHODS AND PROCEDURES ............................................ 37
Introduction ..................................................... 37
Research Design .................................................. 37
Population ....................................................... 37
Procedures ....................................................... 38
Research Questions ............................................... 38
Data Analysis .................................................... 40
Summary .......................................................... 41

7
4. ANALYSIS OF DATA .................................................. 42
Research Question 1 .............................................. 44
Research Question 2 .............................................. 45
Research Question 3 .............................................. 46
Research Question 4 .............................................. 48
5. FINDINGS, CONCLUSIONS, AND RECOMMENDATIONS........................ 52
Summary of the Study ............................................. 52
Summary of the Findings .......................................... 53
Research Question 1 ........................................... 53
Research Question 2 ........................................... 53
Research Question 3 ........................................... 54
Research Question 4 ........................................... 54
Conclusions ...................................................... 55
Recommendations for Practice...................................... 58
Recommendations for Further Study ................................ 60
REFERENCES ............................................................ 63
VITA .................................................................. 69

8
LIST OF TABLES
Table Page
1. Demographic Profile of the Study.................................. 57
2. Students Scoring Proficient on the SOL Tests ..................... 58
3. Pearson Correlation Coefficients for Student Attendance and Test
Scores on the SOL English Test at the 5th Grade .................. 59
4. Pearson Correlation Coefficients for Student Attendance and Test
Scores on the SOL Mathematics Test at the 5th Grade .............. 60
5. Pearson Correlation Coefficients for Subgroup Attendance and Test
Scores on the SOL English Test at the 5th Grade .................. 63
6. Pearson Correlation Coefficients for Subgroup Attendance and Test
Scores on the SOL Mathematics Test at the 5th Grade .............. 67
9
CHAPTER 1
INTRODUCTION
The No Child Left Behind Act of 2001 (NCLB) has focused attention
on student achievement in reading and mathematics and on student
attendance and graduation rates (Lehr, Johnson, Bremer, Cosio, &
Thompson, 2004; Railsback, 2004). One issue of great concern for many
public school administrators in this country is meeting the Adequate
Yearly Progress (AYP) requirements of the No Child Left Behind Act
which requires the identification of states, schools, and school
divisions making and not making AYP (Greene-Wilkinson, 2006;
Schwartzbeck, 2005; Virginia Department of Education [VDOE], 2006). AYP
measures school progress in reading, mathematics, graduation rates, and
attendance rates, with participation rates of at least 95% required for
all students and all subgroups for each assessment (United States
Department of Education [USED], 2006; VDOE). A participation rate of
less than 95% for the overall student population or for any of the
subgroups will result in a school or school division not making AYP,
regardless of the percent of students who achieve proficient scores on
the standardized tests (VDOE). All benchmarks must be met by all
subgroups of students – students with disabilities (SWD), economically
disadvantaged students (ED), limited English proficient students (LEP),
and major racial or ethnic groups (USED; VDOE). The performance of
these subgroups is an area of ongoing concern for many schools and
districts; many schools have significantly lower test scores for the
subgroups than for the overall student population and these lower
subgroup scores will prevent these schools from achieving or
maintaining their “making AYP” status (Farmer et al., 2006; Greene-
Wilkinson; Neill, 2003; Novak & Fuller, 2004). In Virginia, “for a

10
school, school division, or the Commonwealth to make AYP, it must meet
or exceed 29 benchmarks for participation in statewide testing,
achievement in reading and mathematics, and attendance or science
(elementary and middle schools) or graduation (high schools)” (VDOE,
p.3). Maintaining an individual school’s AYP status and the school
division’s AYP status are areas of increasing focus as the benchmarks
for achieving AYP rise each year (Shaul, 2006). As Shaul explains,
making AYP is based on students’ performance for one year, generally
without consideration of improvements or regressions from previous
years. Thus, a school could make significant improvement in student
achievement but fail to make AYP because too few students, or even a
single subgroup of students, fail to meet a predetermined level of
proficiency (Kane & Staiger, 2001; Novak & Fuller). “Missing a single
benchmark may result in a school or school division not making AYP”
(VDOE, p.3). The success of schools and school divisions is measured by
making AYP, regardless of the implementation of new strategies,
improved teaching methods, increased engagement of students and parents
toward higher student achievement, or other evidence of educational
reforms designed to help schools meet the needs of every student
(Ferrandino & Tirozzi, 2004; Greene-Wilkinson).
The No Child Left Behind legislation specifies attendance as an
“other academic indicator” for elementary and middle schools (USED,
2006). Attendance has long been regarded as one of the key factors
affecting student achievement, but its inclusion as an indicator of AYP
has focused renewed attention on student attendance (Atkinson, 2005;
Epstein & Shelton, 2002; Railsback, 2004). Several studies have shown a
correlation between student attendance and academic performance in the
classroom (Klem & Connell, 2004; Moore, 2005; Truby, 2001). In order to
meet the requirements of No Child Left Behind, criterion-referenced

11
tests are used by most states to determine student achievement in
reading and mathematics (Education Week, 2007, January 3; National
Center for Education Statistics [NCES], 2007b). Virginia uses
criterion-referenced tests, specifically the Virginia Standards of
Learning tests, to meet the student assessment requirements of No Child
Left Behind (VDOE, 2006).
Statement of the Problem
This study will examine the relationship between individual
student attendance and individual student performance on the Virginia
Standards of Learning tests in English and mathematics at the fifth
grade level (VDOE, 2006). Additionally, this study will examine the
relationship between individual student attendance and individual
student performance on the Virginia Standards of Learning tests in
English and mathematics at the fifth grade level for the six subgroups
of NCLB that are identified in Virginia (VDOE).
Research Questions
Question 1
Is there a correlation between student attendance and student
test scores on the SOL English test at the 5th grade level?
Question 2
Is there a correlation between student attendance and student
test scores on the SOL mathematics test at the 5th grade level?
Question 3
Does the correlation between student attendance and student test
scores differ among the six subgroups of NCLB on the SOL English test
at the 5th grade level?

12
Question 4
Does the correlation between student attendance and student test
scores differ among the six subgroups of NCLB on the SOL math test at
the 5th grade level?
Significance of the Study
This study will be of significance to policy makers who are
interested in the results and implications of No Child Left Behind and
who consider attendance and student performance on standardized
assessments to be appropriate indicators of Adequate Yearly Progress.
Educational practitioners will be interested in the results of this
study because attendance is a factor more within their realm of
influence than many other factors, such as socioeconomic status. The
performance of the subgroups is of interest to many practitioners;
therefore, any factor that may affect the performance of any of these
groups will be of significance.
Definition of Terms
Subgroups of No Child Left Behind – The No Child Left Behind
legislation requires that states report results for subgroups of
students -- students with disabilities, economically disadvantaged
students, limited English proficient students, and major racial or
ethnic groups (USED, 2006). In Virginia, three racial or ethnic groups
–- white, black, and Hispanic -- were determined to each comprise more
than 5% of the student population and, therefore, were identified as a
subgroup whose results are required to be reported (VDOE, 2003).
Standards of Learning – “Standards of Learning for Virginia
Public Schools (SOL) describe the Commonwealth’s expectations for
student learning and achievement in grades K-12 in English,
mathematics, science, history and social science, technology, the fine
13
arts, foreign language, health and physical education, and driver
education” (VDOE, 2006, p. 11).
Student Attendance – The Virginia Department of Education
requires that schools report aggregate days present, aggregate days
absent, and aggregate days of membership for every student (VDOE,
2005b). “The aggregate days present represents the cumulative number of
days the student had been present in the school from the beginning of
the current school year to the time of the report (VDOE, 2007a, p. 31).
Delimitations
This study is delimited to the Commonwealth of Virginia public
school system which has 132 school divisions. The results of this study
may be generalized to states with similar demographic characteristics.
Limitations
Some students who meet the criteria for economically
disadvantaged may not be identified because they have not applied for
services due to reasons such as parents’ unwillingness to apply or
difficulty completing the application process. Students identified as
economically disadvantaged are determined based on their eligibility
for free or reduced lunch, Temporary Assistance for Needy Families
(TANF), or Medicaid. Participation in any of these programs is
determined through an application process.
Students are required to make a selection from the choices for
the data field of race or ethnicity, but one of the choices is
“unspecified”. Therefore, a student who is white, African-American, or
Hispanic could have chosen “unspecified” and is not counted in any of
the three reported racial or ethnic subgroups.
Overview of the Study
This study is organized and presented in five chapters. Chapter 1
contains an introduction, the statement of the problem including

14
research questions, and the significance of the study. Additionally,
Chapter 1 presents limitations and delimitations of the study along
with the definitions of terms used in the study. Chapter 2 contains a
review of the literature related to student attendance and student
achievement on high-stakes assessments. Chapter 2 consists of a section
pertaining to attendance and student achievement and a section
pertaining to attendance and student achievement on high-stakes
assessments, with a concluding section that relates the first two
sections to the No Child Left Behind legislation. Chapter 3 provides a
discussion of the methodology and data collection procedures for the
study. Chapter 4 presents the data and describes the data analysis used
for the study. Chapter 5 presents a summary of the study, a summary of
the findings, conclusions, recommendations for practice, and
recommendations for further research.

15
CHAPTER 2
REVIEW OF LITERATURE
Introduction
Chapter 2 contains a review of the literature relevant to student
attendance, student achievement, and the No Child Left Behind
legislation. This literature review is composed of three main sections
beginning with the examination of the relevance of attendance to
student achievement. The second section concentrates on attendance and
high-stakes assessments with a focus on criterion-referenced tests. The
third section relates attendance and high-stakes assessment to the
goals of No Child Left Behind with an emphasis on the determination of
Adequate Yearly Progress and achievement of students in the NCLB
subgroups. Chapter 2 concludes with a summary of the literature
reviewed in the three sections.
Attendance and Student Achievement
Attendance has long been considered a key component of a
successful school experience for all students, although there has been
surprisingly little research conducted on this topic (Atkinson, 2005;
Epstein & Shelton, 2002). Epstein and Shelton noted that reducing the
rates of student truancy and excessive absenteeism continued to be a
goal of many schools and school divisions. Corville-Smith (1995)
asserted that the issue of student attendance has received relatively
little attention from educational researchers despite a history of
concern. Atkinson commented on the lack of national truancy data, even
though some metropolitan areas report thousands of unexcused absences
each day. She suggested that truancy is a much more profound problem
than might at first be obvious. Atkinson agreed with Garry (1996) that
there is a clear and powerful link between truancy and numerous risk
factors and risk behaviors among young people. Garry referred to
16
truancy as “the first step in a lifetime of problems” (p. 1), noting
that truancy in this country had become a major problem creating
negative influences on the future of our youth and resulting in huge
social costs.
Sanderson, Dugoni, Rasinski, and Taylor (1996) prepared a
descriptive summary report of The National Education Longitudinal Study
of 1988 in which they discussed the six risk factors that were
identified in order to define at-risk students for the original study
and were subsequently used as the standard for a follow up study
conducted in 1994, as well as used as the standard for other studies.
The six risk factors identified were: “lowest socioeconomic quartile,
single-parent family, older sibling dropped out of school, changed
school two or more times from first to eighth grade, lower than average
grades (C or lower), and repeating an earlier grade from first to
eighth grade” (Horn & Chen, 1998, p.3). Noticeably absent from the
report of Sanderson et al. was any discussion of student attendance as
a risk factor. Horn and Chen offered an explanation for this lack of
focus on student attendance as having “to do with the correlation
between attendance behavior and achievement. Higher achieving students
are more likely to report higher levels of attendance. Thus, once
achievement is controlled for, there is little variation for
attendance” (p.26). Railsback (2004) maintained that it is well known
and widely accepted that having children attend school on a regular
basis is a key component of their academic success.
The research on the topic of student attendance has increased in
recent years, due at least in part to the NCLB legislation (Atkinson,
2005; Klem & Connell, 2004). Truby (2001) cited
a study by the Minneapolis public school district that suggested
that attendance has a dramatic effect on achievement scores.

17
According to the study, students who attended class 95% of the
time were twice as likely to pass state language arts tests as
students with attendance rates of 85% (p. 8).
Moore (2005) also found that high rates of attendance correlate
strongly with high grades and that low rates of attendance correlate
strongly with low grades.
Several researchers have established a positive relationship
between attendance rates and graduation rates (Beem, 2002; Burley &
Harding, 1998; Epstein & Shelton, 2002; Garry, 1996; McNeely,
Nonnemaker, & Blum, 2002). Epstein and Shelton cite cross-sectional and
longitudinal studies that indicate students who are absent more often
beginning as early as first grade are those students who eventually
drop out of school. The findings of several studies suggest that the
pattern of absenteeism increases throughout a student’s school
experience and that truancy in elementary schools is a strong predictor
of truancy in high school (Burley & Harding; Epstein & Shelton; Garry).
McNeely et al., through a national adolescent health survey of more
than 90,000 7th to 12th grade students in 134 schools, found that
frequent problems with school work is a common trait among truant
youth. Beem reported results from a study conducted in a school
district in Kentucky that showed graduation rates could be radically
improved by addressing truancy effectively. This small school district
achieved a 100% graduation rate three concurrent years, attributing the
success to a truancy reduction program that started in elementary
school.
Dougherty (1999) presented a particularly interesting point in
discussing the effect of cultural values on attendance. He noted that
punctuality and good attendance are generally regarded as common values
in American society. However, not all cultures place such importance on

18
punctuality and consistent attendance. Dougherty suggested that as the
American culture becomes more diverse, the need to communicate the high
regard of such values becomes increasingly important. Such
acculturation by parents and educators helps young people cross
cultural boundaries in order to adopt values that lead to success in a
given culture.
Atkinson (2005) proposed that there is a critical link between
effective educational strategies and student attendance rates. She also
noted that NCLB requires the development and implementation of a
uniform information and reporting system in every state, as attendance
rates are a key performance indicator required to be reported at the
state level and on a school-by-school basis. The National Research
Council (2003) acknowledged that
although assessing proximal goals such as increasing attendance
and reducing dropout rates can mark progress that reassures us
that we are moving in the right direction, ultimately we need to
achieve the more ambitious goal of promoting deep cognitive
engagement that results in learning (p. 32).
Tretter and Jones (2003) examined relationships between inquiry-based
teaching and standardized test scores. One aspect of this study focused
on three measures of student participation in physical science classes.
The three measures were attendance, likelihood of “giving up” (not
completing all course requirements), and taking the End of Course (EOC)
standardized test. They indicated that a positive relationship does
exist between higher attendance, less likely to give up, and more
likely to take the EOC standardized test (Tretter & Jones).
Klem and Connell (2004) studied the link between teacher support
and student engagement and achievement. All of the factors they used to
define levels of student engagement were dependent upon the students

19
being present at school; students who were not present simply could not
be engaged. Klem and Connell used factors previously used by Marks
(2000) to determine levels of student engagement. Marks “conceptualizes
engagement as a psychological process, specifically, the attention,
interest, investment, and effort students expend in the work of
learning” (p. 154). She asserts that this definition of engagement
implies both affective and behavioral participation in the learning
experience.
Klem and Connell (2004) determined that attendance and test
scores were strongly associated with a high level of engagement. They
asserted that even with factors other than attendance and test scores
used for defining student engagement, higher levels of engagement were
linked with improved performance. They further argued that student
engagement was a robust predictor of student achievement in school
regardless of socioeconomic status. Students engaged in school were
more likely to have higher grades and test scores and lower dropout
rates, while students with low levels of engagement were more likely to
suffer adverse consequences such as chronic absenteeism and dropping
out of school. Klem and Connell suggested that creating more
personalized educational environments resulted in more student
engagement, higher test scores, and better attendance. The National
Research Council (2003) reported similar findings from several studies
that support the importance of promoting engagement because it is a
strong motivator for students to attend school regularly and to stay in
school until graduation.
Attendance and Student Achievement on High-Stakes Assessments
Tretter and Jones (2003) noted that educational accountability
has become a very high profile issue in recent years in the United
States. They maintained that this attention led to the increased

20
emphasis on standardized testing as a means to improve public schooling
and to hold accountable the various parties involved. Mitchell (2006)
asserted that assessment is the essential ingredient of accountability
and accountability is the key word in education today. He noted that
NCLB requires accountability for academic progress, using statewide
assessments to monitor student progress toward the goal of 100%
proficiency for all students by 2014.
Statewide assessments gauge student progress toward the annual
goals set by the state and measure Adequate Yearly Progress in an
effort to meet the requirements of NCLB (USED, 2006; VDOE, 2006). These
achievement tests are generally standardized within a given state, but
across different states they may vary in the knowledge they test,
whether they measure minimum competency or a degree of achievement, the
style of their questions, and whether they are referenced to a pre-
defined standard or to the relative performance of other students
(NCES, 2007b). “A standardized test is any assessment that is
administered and scored in a predetermined, standard manner” (Popham,
1999, p.8). Students take the same test at the same time under the same
testing conditions, if possible, so that the results can be attributed
to actual student performance and not to differences in the testing
conditions, the administration of the test, or the form of the test
(USED, 2003; Wilde, 2004). Because of the standardized nature of these
tests, results can be shared across schools, districts, and states
(Mitchell, 2006).
State testing to document AYP in accordance with NCLB is
considered “high-stakes” testing because of the consequences to schools
and students that fail to reach certain benchmarks or to make
improvements in achievements for the subgroups of the schools
(Mitchell, 2006). Consequences to students in Virginia who fail to meet

21
the proficient benchmark on a test include mandatory remediation in the
subject area at all grade levels (VDOE, 2006). High school students in
Virginia must meet the proficient benchmark on six End of Course SOL
tests in order to receive the verified credits necessary for a standard
diploma (VDOE, 2004). Consequences for schools that do not make AYP
become increasingly severe each year, ranging from implementing a
school improvement plan to a complete reorganization of the school.
Other consequences could include providing school choices for students
with transportation provided, providing supplemental educational
services, replacing school staff, or implementing a new curriculum
(VDOE, 2005a).
Criterion-Referenced Assessment
The term ‘criterion-referenced measurement’ appears to have been
used first in 1962 by Glaser and Klaus, although the use of criterion-
referenced scales can be found in studies dating to the late 19th and
early 20th centuries (Hambleton & Jurgensen, 1990). Glaser (1963/1994)
defined the differences in norm-referenced and criterion-referenced
assessments of achievement and established criterion-referenced tests
as legitimate alternatives to norm-referenced tests. Glaser maintained
that the primary difference between the two types of assessments could
be found in the standard used as a reference; criterion-referenced
tests depended upon an absolute standard, whereas norm-referenced tests
depended upon a relative standard. Hambleton and Jurgenson maintained
that Glaser’s description of the differences between norm-referenced
and criterion-referenced tests generated considerable debate over the
merits of the two types of tests, as well as how criterion-referenced
tests should be defined and even what they should be called.
Norm-referenced tests are designed to compare individual
students’ achievements to a representative sample of his or her peers,

22
referred to as the “norm group”. The design of all norm-referenced
tests is driven by the goal of spreading out the results on the normal
or bell-shaped curve (Mitchell, 2006; NASBE, 2001; Zucker, 2003).
Mitchell explained that the curve-based design of norm-referenced tests
means that these tests do not compare students’ achievement to what
they should know or be able to do; rather, they compare students to
other students in the same “norm group”. Because these tests are
designed to spread students’ scores across the bell-shaped curve, the
test questions do not necessarily represent the knowledge and skills
that students have been expected to learn (Mitchell). During the test
development process, test items answered correctly by 80% or more of
the test takers typically do not make it into the final version of the
test (Popham, 1999).
Criterion-referenced tests are designed to measure a level of
mastery according to a clearly defined set of standards (Zucker, 2003).
Since the enactment of NCLB in 2001, these standards are usually state
standards (Mitchell, 2006; NASBE, 2001; Wilde, 2004; Zucker). Collins
and Cheek (1993) defined criterion-referenced tests as “tests based on
objectives that contain the specific conditions, outcomes, and criteria
that are expected for satisfactory completion of the task” (p. 446).
Unlike norm-referenced tests, all students could possibly reach a very
high standard on a criterion-referenced test, because the students are
not being compared to a reference group, only to their knowledge of the
content (NASBE; Zucker). Mitchell pointed out that it is theoretically
possible for all students to achieve the same score (possibility the
highest score or the lowest score) on a criterion-referenced test
because the test items are not chosen to rank students but to determine
if they have learned the knowledge and skills of the standards on which
the test is based. Assessment results are typically reported according
23
to a level of performance, such as the not proficient, proficient, and
advanced ratings used on the Virginia SOL tests (NASBE; VDOE, 2006).
According to Darling-Hammond (2004) criterion-referenced tests often
use an underlying norm-referenced logic in selecting items and setting
cut scores, although in theory, the target could at least remain fixed
on these tests.
Mitchell (2006) noted that the implementation of No Child Left
Behind in 2001 caused a dramatic increase in the number of criterion-
referenced tests used at the state level because these tests measure
the achievement of knowledge and skills required by state standards.
Currently, 44 states use criterion-referenced tests as a part of their
state assessment program, with 24 states including Virginia using only
criterion-referenced tests for their state assessment program
(Education Week, January 3, 2007; NCES, 2007b). NCES reported that in
addition to the 24 states using only criterion-referenced tests, 17
states use both criterion-referenced tests and norm-referenced tests,
10 states use hybrid tests, and one state uses only a norm-referenced
test. A hybrid test is a single test for which results are reported
both as norm-referenced (in percentiles or stanines) and as criterion-
referenced (in basic, proficient, and advanced levels) (Mitchell). Iowa
is the only state to use only a norm-referenced test; Iowa is home to
the Iowa Test of Basic Skills (a norm-referenced test) and is the only
state in the country that does not have state standards, although Iowa
does have state-developed standards that may be voluntarily adopted by
school districts (Education Week).
No Child Left Behind Legislation

24
The No Child Left Behind Act of 2001, approved by Congress in
December 2001 and signed into law by President George W. Bush on
January 8, 2002, is the reauthorization of the Elementary and Secondary
Education Act of 1965, although its official subtitle is the No Child
Left Behind Act of 2001 (Hess & Petrilli, 2006; USED, 2005). This
legislation was the most significant and controversial change in
federal education policy since the federal government assumed a major
role in American education 4 decades ago with the enactment of the
Elementary and Secondary Education Act (Sunderman & Kim, 2004).
Unquestionably the most comprehensive educational reform effort
undertaken by the federal government in American history, it was a
dramatic departure from the traditional federal educational policy of
this country (Hess & Petrilli; Sunderman & Kim; USED). McGuinn (2006)
stated that “the passage of the No Child Left Behind Act in 2002
signaled the beginning of a new era of federal education policy and a
significantly transformed and expanded national role in our country’s
schools” (p. 196). Beyond widespread agreement on the unprecedented,
comprehensive nature of this federal involvement in public education,
there was little agreement about any other aspect of the No Child Left
Behind Act (Popham, 2004).
Viewpoints about the NCLB legislation varied greatly. Supporters
described NCLB as a path to educational transformations; critics
denounced it as a plot to undermine public education (Sunderman & Kim,
2004).
Some proponents viewed it as perhaps the grandest achievement of
the U.S. Department of Education in its 29-year history (because)
it signified a clear shift from the department’s early role as
data keeper and dispenser of student-aid funds to its emergent

25
role as leading education policy maker and reformer (Dodge,
Putallaz, & Malone, 2002, p.674).
Detractors with an opposing view described the legislation as “a
historic, even breathtaking, intrusion by the federal government into
the rights of states to control the education enterprise within their
borders” (Owens, 2004, p.24).
Regardless of one’s opinion about NCLB, the extraordinary
attention that was given to the implementation of the law by school
officials, parents, politicians, and the media at the local, state, and
federal levels signified the comprehensive nature of the new law, both
in terms of the extensive scope of its goals and the federal
expectations for states and school divisions to meet these goals
(McGuinn, 2006). As Sunderman and Kim pointed out, the issues
associated with NCLB were not only educational but also political and
ideological; therefore, this law deserved the most careful attention
and should have been scrutinized in terms of facts and not assumptions.
The No Child Left Behind Act is an extensive document totaling
1,184 pages, with the phrase “scientifically based research” occurring
111 times within the text of this law according to Susan B. Neuman,
Assistant Secretary of Elementary and Secondary Education. She
proclaimed that legislators and educators are no longer debating
whether scientifically based research and scientifically based evidence
is important; they know it is important and they know it is critical
(Neuman, 2002).
No Child Left Behind required that decisions made and results
reported about education at all levels (school, division, and state) be
research-based and justifiable by scientifically accepted methods of
data collection (Reyna, 2002; USED, 2006). Within this context, the
Virginia Department of Education defined scientifically based research

26
as “research that involves the application of rigorous, systemic, and
objective procedures to obtain reliable and valid knowledge regarding
the effectiveness of educational activities and programs” (VDOE, 2006,
p.11). The implications of these requirements foretold a new era for
educational leaders in the making of decisions and the formulating of
policies (Feuer & Towne, 2002). Owens (2004) asserted that the quality
of research in education has been and continues to be imbalanced and is
hindered by the fact that education is not recognized as a bone fide
scholarly discipline. “By definition, a scholarly discipline includes a
well-defined body of knowledge that arises from recognized theory and
the use of research methods accepted as being appropriate to study the
questions under investigation” (Owens, p.26).
The purpose of the No Child Left Behind Act was to close the
achievement gap between student subgroups with accountability,
flexibility, and choice (USED, 2006; VDOE, 2006). The achievement gap
referred to the differences in academic performance among low-income
and minority children compared to their non-low income, non-minority
peers as measured by their achievement on standardized tests (USED,
2003; VDOE). For many years, low income and minority children have
lagged behind their white peers in terms of academic achievement
(Sheldon & Epstein, 2005; USED, 2003).
The five performance goals that No Child Left Behind set for
states could be summarized as:
All students will reach high standards, at a minimum
attaining proficiency or better in language arts/reading
and mathematics by 2013-2014.
All limited English proficient students will become
proficient in English and reach high academic standards, at

27
a minimum attaining proficiency or better in
reading/language arts and mathematics.
All students will be taught by highly qualified teachers by
2005-2006.
All students will learn in schools that are safe and drug
free.
All students will graduate from high school. (VDOE, 2005a,
Welcome section, ¶ 1)
These goals for student achievement, teacher performance, and school
performance must be met by all states. However, most of the
responsibility for achieving these goals fell to the local school
divisions, referred to in the No Child Left Behind Act as the local
educational agency (USED, 2006).
As previously stated, Railsback (2004) maintained that it is well
known and widely accepted that having children attend school on a
regular basis is a key component of their academic success. She
concluded the federal government included attendance as an “additional
indicator” for elementary and middle schools in the No Child Left
Behind legislation in order to emphasize the importance of attendance
to a child’s educational experience.
Determination of Adequate Yearly Progress
The USED (2004) explained that Adequate Yearly Progress, most
often referred to as AYP, is an individual state's measure of yearly
progress toward achieving state academic standards. AYP is the minimum
level of improvement that states, school districts, and schools must
achieve each year. Erpenpach, Forte-Fast, and Potts (2003) described
how AYP status is determined through a series of mathematical
calculations used to evaluate schools based on standardized test

28
scores. Under NCLB, all schools receiving federal funds are required to
reach 100% passing rates on state standardized tests for all students
in all student groups by the end of the 2013-14 school year (Erpenpach
et al., 2003; Popham, 2004; VDOE, 2006). The goal of this benchmark was
to demonstrate that all students have met the standards of NCLB and
eliminated academic achievement gaps (Karp, 2004; VDOE). Even though
the law mandated that states must close achievement gaps, it did not
specify annual targets to measure progress toward this goal. Therefore,
states had flexibility in the rate at which they closed these gaps
(Shaul, 2006).
Beginning with the passage of NCLB in 2002, most states
established starting points, annual measurable objectives (AMO), and
intermediate goals that applied at the state, district, and school
level. “Annual measurable objectives are the minimum required
percentages of students determined to be proficient in each content
area” (VDOE, 2006, p.10). Virginia submitted a proposal to establish
separate starting points and intermediate goals for the different
subgroups of NCLB, but the USED rejected this proposal (Erpenpach et
al., 2003) In many cases, the AMO and intermediate goals were set quite
high in an effort to achieve 100% passing rates by 2014 (Darling-
Hammond, 2004).
Many educational practitioners, as well as other informed and
interested parties, argued that the progression rate of the standard is
unrealistic (Darling-Hammond, 2004). Using a definition of proficiency
developed by the National Assessment of Educational Progress (NAEP),
Linn (2003) calculated that it would take some schools more than 50
years to reach 100% proficiency in all content areas even if they
continued the fairly rapid rate of progress they were making prior to,
and during, the initial implementation of NCLB.

29
Sizer (2004) noted that NCLB centralizes, through the federal
approval of state plans, the definition of standards and the acceptable
means of assessing these standards. The determination of standards and
their assessment has historically been a key element of local and state
school operation.
The range of options available to states in the selection of
indicators for AYP calculations is limited. States are required to use
five kinds of indicators for AYP:
Separate summary indicators for proficiency in reading or
language arts;
Separate summary indicators for proficiency in
mathematics;
Separate indicators of participation in reading or language
arts assessments;
Separate indicators of participation in mathematics
assessments; and
At least one other academic indicator at the elementary and
middle school levels and at least graduation rate at the
high school level (Erpenpach et al., 2003, p.14).
According to the VDOE (2006), in Virginia the “other academic
indicator” for elementary and middle schools could be attendance rate
or science assessment. So for AYP calculations, in addition to having
met AMO in reading and mathematics, elementary and middle schools must
have met AMO for attendance or science and high schools must have met
AMO for graduation, or have shown improvement. As Railsback (2004)
pointed out, even though high schools used graduation rate as the AYP
indicator, attendance is just as important for high school students as
it is for younger students. In fact, a student’s attendance history is

30
one of the best predictors of whether a student will graduate from high
school (Baker, Sigmon, & Nugent, 2001; Garry, 1996).
Most states chose to use attendance rate as the other academic
indicator at the elementary and middle school levels, although a few
states chose instead to use results from other assessments, such as
writing or science (Erpenpach et al., 2003). Schools in Virginia must
decide prior to the beginning of the school year whether to use
attendance or science as the AMO for elementary and middle schools
(VDOE, 2006). Even though Virginia allows schools to choose between
attendance rates or science test scores, a majority of schools (65% in
2006) chose to use attendance rate as the other academic indicator
(VDOE, 2007b).
Student Achievement of NCLB Subgroups
With the enactment of the NCLB legislation in 2001, states were
required to accept greater responsibility for a wide range of student
populations (Zucker, 2003). Sunderman and Kim (2004) described how the
new law specified the amount of progress schools must make annually for
every subgroup of student and mandated goals that have rarely been
achieved on any scale in high poverty school districts. In addition to
economically disadvantaged students, NCLB required that students with
limited English proficiency and special education students perform at
these same high levels (Sunderman & Kim). Schools, school divisions,
and states initially were concerned with overall student achievement,
attendance, and graduation rates (Farmer et al.; Linn, 2003). Many
schools found that they were performing adequately in these areas and
many other schools quickly made significant progress in these areas
(Farmer et al., 2006; Neill, 2003; Novak & Fuller, 2004). However,
states must also report student achievement disaggregated by gender,
ethnicity, disability, economic disadvantage, English proficiency, and

31
migrant status (Zucker). These subgroups were expected to make progress
each year as was the general student population (Neill; Novak &
Fuller). Many, if not most, schools found that the student achievement
of these subgroups did not progress at the rate of the general student
population and continued to lag far behind in many schools (Farmer et
al.; Neill; Novak & Fuller; Sheldon & Epstein, 2005). Sheldon and
Epstein cited several studies that showed in the United States minority
students had lower achievement in mathematics than white students and
that the achievement gap between racial subgroups was not narrowing.
Novak and Fuller (2004) found that most schools labeled as “failing
schools” were designated as such not because tests had shown their
overall achievement levels to be low, but because a single student
group -- disabled learners or Hispanic students, for example -- had
fallen short of a targeted goal. Consequently, the chances that a
school failed to make AYP increased in proportion to the diversity of
the demographic groups served by the school (Batt, Kim, & Sunderman,
2005; Kane & Staiger, 2001).
Neill (2003) argued that many states and communities have failed
to provide adequate educational resources and high quality learning
opportunities for their students, often creating unequal education
systems based on class, race, language, and ability (or disability) and
he supported a means of verifying that schools are providing a high-
quality education for all students. However, he expressed concern that
few schools serving large numbers of children who were identified with
a subgroup would meet the arbitrary benchmarks of AYP. He explained
that even high-quality schools serving diverse populations would have
trouble meeting the AYP requirements of NCLB because their programs
were not designed to focus on improving standardized test scores.
Musher, Musher, Graviss, and Strudler (2005) supported the idea that

32
tests can be used to document educational success, citing the results
of their study that showed providing a quality educational experience
for a diverse group of students can lead to significant improvement in
standardized test scores.
The lack of achievement for the subgroups is of great concern to
educators not only because of AYP requirements but, more importantly,
because research into the impact of schools on their pupils has
demonstrated the schools’ value in providing support and sanctuary to
children, especially of diverse backgrounds (Payne, 2005). Rutter
(1989) concluded that good school experiences are probably socially
helpful to all children, but they are critically important to subgroups
under stress and with a lack of other positive experiences. While there
are clearly many factors that affect the performance of students within
the subgroups, as there are with all students, educators must emphasize
the indicators that define what is valued. Schmoker (2001) pointed out
that once these indicators are determined, they help educators know
where to aim limited amounts of time and resources. Daily school
attendance is one performance factor that meets these criteria and may
be more easily influenced by educators than other factors.
Osterman (2000) studied students’ need for belonging in the
school community. She noted that the nationwide emphasis on
standardized achievement tests had led to academic accomplishment
becoming the main priority of schools, to the detriment of the
affective needs of students. She subscribed to the idea that
achievement and mastery are more important than a sense of belonging
and that belonging is not a precondition for engagement but a reward
for compliance and achievement. She cited several studies supporting
her assertion that peers tend to associate with those they define as
“friends” and these friends tend to be like themselves in terms of
33
race, class, gender, and most interestingly, in terms of perceived
academic ability. This association with a certain group is often a
determining factor in a student’s level of engagement and commitment in
school. Osterman concluded that there is strong and consistent evidence
that students who experience acceptance are more motivated and engaged
in learning and more committed to school. She also concluded that
commitment and engagement in school is closely linked to student
performance and to the quality of student learning.
Batt et al. (2005) suggested that the LEP subgroup deserved
special attention for two reasons. First, LEP students comprised the
fastest growing subgroup in the country. Second, these students were at
a huge disadvantage to all other students because by definition they
are considered to have limited proficiency in English, the language of
nearly all standardized tests. According to Menken (2000) these tests
designed for English speaking students tend to measure LEP students’
language proficiency rather than accurately assessing their content
knowledge of the subject being assessed. However, as Batt et al.
pointed out, NCLB requires that the test scores of LEP students be used
for accountability purposes regardless of their level of language
proficiency. For this reason, schools with large numbers of LEP
students will face significant challenges in achieving AYP under the
current regulations of NCLB.
Burley and Harding (1998) cited a study of student attendance at
high schools in the Minneapolis and St. Paul area that found the two
strongest variables impacting attendance were the percent of minority
students in school and the percent of students who go on to attend a 4-
year college. As the percent of minority students increased, attendance
decreased in all high school grades; as the percent of students
planning to attend 4-year colleges increased, attendance increased

34
(Burley & Harding). Numerous studies have noted findings that indicate
that economically disadvantaged students have lower attendance rates,
are less likely to graduate from high school, and are less likely to
attend college (Horn & Chen, 1998; Lehr, Johnson, Bremer, Cosio, &
Thompson, 2004; Payne, 2005).
Engec (2006) maintained that poverty alone does not lead to
failure in school or failure as an individual. He listed several
environmental characteristics of poor children (lack of parental
involvement, inadequate housing, health problems, lack of educational
stimulation in early years, lack of academic support, and high student
mobility) that are contributing factors to low academic achievement.
Student attendance was not mentioned as a factor affecting student
achievement; Engec focused on the relationship between student mobility
and student performance but did not explore any relationship between
mobility and student attendance.
Differences in attendance rates for subgroups have been
documented by the NCES (2007a). NCES reported attendance for 4th and 8th
grade students by race or ethnicity, disability status, and school-wide
school lunch eligibility, with the latest data being from 2005. Black
and Hispanic students were more likely to have missed 3 or more days of
school in the last month than white students (21%, 21%, and 18%
respectively in 4th grade and 24%, 23% and 19% respectively in 8th grade)
(NCES). Students classified as having a disability were more likely
than students without a disability to have missed 3 or more days of
school in the past month (24% versus 19% in 4th grade and 29% versus 20%
in 8th grade) (NCES). Students attending schools where more than 75% of
the students were classified as economically disadvantaged were more
likely to have missed 3 or more days of school in the past month than
students attending schools where 10% or less of the students are

35
classified as economically disadvantaged (22% versus 16% for 4th graders
and 25% versus 17% for 8th graders) (NCES). English language learners,
previously reported as limited English proficient, were more likely to
have missed 3 or more days of school in the past month than English
proficient students (21% versus 19% for 4th graders and 23% versus 20%
for 8th graders) (NCES). Railsback (2004) concluded that NCLB has
resulted in particular attention being focused on increasing attendance
and lowering the dropout rate of culturally and linguistically diverse
students and students from low-income homes, who historically have had
higher dropout rates than middle class white students.
Summary
The No Child Left Behind legislation has resulted in significant
changes to the American education system since its passage in 2002
(Greene-Wilkinson, 2006; Schwartzbeck, 2005; Shaul, 2006). Schools,
school divisions, and states are now identified as making AYP or not
making AYP based on student achievement in reading, mathematics, and
another academic indicator that can be attendance rates or science
achievement for elementary and middle schools (USED, 2006; VDOE, 2006).
Not only must the overall student population achieve a certain level of
proficiency, but all subgroups of students must meet the same standards
(USED; VDOE). Virginia, like many other states, uses criterion-
referenced tests to meet the student assessment requirements of NCLB;
many schools in Virginia choose to use attendance as the other academic
indicator (VDOE). The use of attendance as the other academic
indicator is indicative of Virginia’s efforts to emphasize student
attendance as an important facet of a school’s overall improvement plan
(Atkinson, 2006; VDOE). The federal and state attention given to
attendance demands that schools and school divisions focus on student
attendance, as well as the core academic areas of reading and

36
mathematics, as the primary components of an effective program designed
to ensure a successful educational experience for all students.

37
CHAPTER 3
METHODS AND PROCEDURES
Introduction
This quantitative study was designed to determine if a
relationship existed between student attendance and student achievement
on the Virginia Standards of Learning tests in English and mathematics
at the 5th grade level. The study further examined if this relationship
differed among the six subgroups of No Child Left Behind as identified
by the Commonwealth of Virginia.
Chapter 3 describes the methodology and procedures used in this
study. This chapter contains sections that address the areas of
research design, population, procedures, research questions, data
analysis, and a summary.
Research Design
Attendance is generally considered to be a key component of
student success in general classroom achievement. This quantitative
study compared individual student attendance with individual student
test scores on the Virginia SOL tests for English and mathematics to
determine if a relationship existed between these variables. Analysis
of this relationship was conducted for the overall student population
as well as for each of the six subgroups identified in Virginia in
order to determine if the relationship differed among these groups.
Population
The population for this study consisted of all fifth grade
students who participated in the Standards of Learning state testing
program in the state of Virginia for the 2005-2006 school year. There
were 97,929 individual students involved in the study. Of these
students, 32,279 were identified as economically disadvantaged, 9,187
were identified as Limited English Proficient, and 13,168 were

38
identified as students with disabilities. In the racial and ethnic
subgroups, 58,208 were identified as white, 23,454 were identified as
black, and 8,892 were identified as Hispanic. The remaining 7,375
students were identified with other racial or ethnic subgroups or did
not identify their race or ethnicity.
Procedures
Data collection for this study was performed with the cooperation
of the Virginia Department of Education using a state database of
student testing information. Individual students were never identified
in any way or at any time in this study. Data sets for fifth graders in
Virginia were generated using a database query of the state’s student
records. This query generated a data set for each student that contains
aggregate days present, aggregate days absent, SOL score for English,
SOL score for math, and indicates membership in any of the subgroups.
This database query and the subsequent production of the data set were
performed by an employee of the Virginia Department of Education at the
direction of the Director of Educational Information Management who
approved the request for these data.
Data were analyzed using the Statistical Package for the Social
Sciences (SPSS) Version 15.0 software package. Data summaries and
results of the data analysis are presented in Chapter 4.
Research Questions
Question 1
Is there a correlation between student attendance and student
test scores on the SOL English test at the 5th grade level?
H01: There is no correlation between student attendance and
student test scores on the SOL English test at the 5th grade level.
Question 2

39
Is there a correlation between student attendance and student
test scores on the SOL mathematics test at the 5th grade level?
H02: There is no correlation between student attendance and
student test scores on the SOL mathematics test at the 5th grade level.
Question 3
Does the correlation between student attendance and student test
scores differ among the subgroups of NCLB on the SOL English test at
the 5th grade level?
H031: There is no correlation between student attendance and
student test scores on the SOL English test at the 5th grade level for
economically disadvantaged students.
H032: There is no correlation between student attendance and
student test scores on the SOL English test at the 5th grade level for
students with disabilities.
H033: There is no correlation between student attendance and
student test scores on the SOL English test at the 5th grade level for
Limited English Proficient students.
H034: There is no correlation between student attendance and
student test scores on the SOL English test at the 5th grade level for
white students.
H035: There is no correlation between student attendance and
student test scores on the SOL English test at the 5th grade level for
African-American students.
H036: There is no correlation between student attendance and
student test scores on the SOL English test at the 5th grade level for
Hispanic students.
Question 4

40
Does the correlation between student attendance and student test
scores differ among the subgroups of NCLB on the SOL mathematics test
at the 5th grade level?
H041: There is no correlation between student attendance and
student test scores on the SOL mathematics test at the 5th grade level
for economically disadvantaged students.
H042: There is no correlation between student attendance and
student test scores on the SOL mathematics test at the 5th grade level
for students with disabilities.
H043: There is no correlation between student attendance and
student test scores on the SOL mathematics test at the 5th grade level
for Limited English Proficient students.
H044: There is no correlation between student attendance and
student test scores on the SOL mathematics test at the 5th grade level
for white students.
H045: There is no correlation between student attendance and
student test scores on the SOL mathematics test at the 5th grade level
for African-American students.
H046: There is no correlation between student attendance and
student test scores on the SOL mathematics test at the 5th grade level
for Hispanic students.
Data Analysis
The Statistical Program for the Social Sciences (SPSS) was used
to analyze these data, using descriptive and inferential statistics.
Statistical tests were performed to determine Pearson correlation
coefficients.
Question 1: The null hypothesis was analyzed using descriptive
statistics and tested using a Pearson correlation coefficient.

41
Question 2: The null hypothesis was analyzed using descriptive
statistics was tested using a Pearson correlation coefficient.
Question 3: The null hypotheses were analyzed using descriptive
statistics and were tested using Pearson correlation coefficients.
Question 4: The null hypotheses were analyzed using descriptive
statistics and were tested using Pearson correlation coefficients.
Summary
Chapter 3 presents the research design of the study, the
population studied, the procedure used for data collection, and the
research questions and null hypotheses and describes the statistical
procedures used to test the data. The study used quantitative
procedures to determine if a correlation existed between student
attendance and student test scores on criterion-referenced tests. The
population used for this study was 97,929 fifth graders in Virginia.
The study consists of four research questions with 14 null hypotheses.
An analysis of the data will be provided in Chapter 4. Chapter 5 will
present a summary of the study, a summary of the findings, conclusions,
recommendations for practice, and recommendations for further research.

42
CHAPTER 4
ANALYSIS OF DATA
After the passage of the No Child Left Behind legislation in 2002
many states began using criterion-referenced tests to meet the student
assessment requirements of this law (Education Week, 2007, January 3;
NCES, 2007b). In Virginia, these tests are known as the Standards of
Learning tests (VDOE, 2006). Student attendance at the elementary level
was the “other academic indicator” chosen by many schools in Virginia
to meet the requirements of NCLB (VDOE, 2007b). The increased level of
accountability and subsequent focus on standardized test scores in
reading and mathematics and on student attendance was the impetus for
this study.
The purpose of this study was to examine the relationship between
SOL test scores and student attendance. This study uses test scores
from the reading and mathematics SOL tests given to fifth graders in
the spring of 2006, as well as the student attendance data for these
fifth graders for the 2005-2006 school year. The relationship between
SOL test scores and student attendance for the overall student
population and for the six subgroups of students in Virginia was also
examined.
The four research questions presented in Chapter 1 were used to
guide the study. The 14 hypotheses presented in Chapter 3 were used to
test the data.
The 97,929 students who participated in the SOL testing program
were comprised of three major ethnic or racial groups and three service
groups. The largest ethnic or racial group was white students
comprising 59.4% of the participating population followed by black
students and Hispanic students, comprising 24.0% and 9.1% of the
population respectively. Students of other ethnic or racial groups,

43
including students who did not identify their race or ethnicity,
comprised 7.5% of the participating population. Economically
disadvantaged students comprised the largest service group of students
representing 33.0% of the participating population. Students with
disabilities accounted for 13.4% of the participants, while limited
English proficient students represented 9.4% of the participating
population. Table 1 provides a summarization of this demographic
information.
Table 1
Demographic Profile of the Study
Service Group N %
Economically Disadvantaged 32,279 33.0
Students With Disabilities 13,168 13.4
Limited English Proficient 9,187 9.4
Racial or Ethnic Group N %
White 58,208 59.4
Black 23,454 24.0
Hispanic 8,892 9.1
Other or Unspecified 7,375 7.5
A total of 97,929 students participated in the mathematics test
and 94,526 students participated in the reading test. The explanation
for the difference of 3,403 participating students is that Virginia
allowed testing exemptions or alternative assessment procedures for
students with disabilities and limited English proficient students who
met certain criterion (VDOE, 2005a; VDOE, 2006). Students who did not
participate in either the reading or the mathematics SOL test were not
44
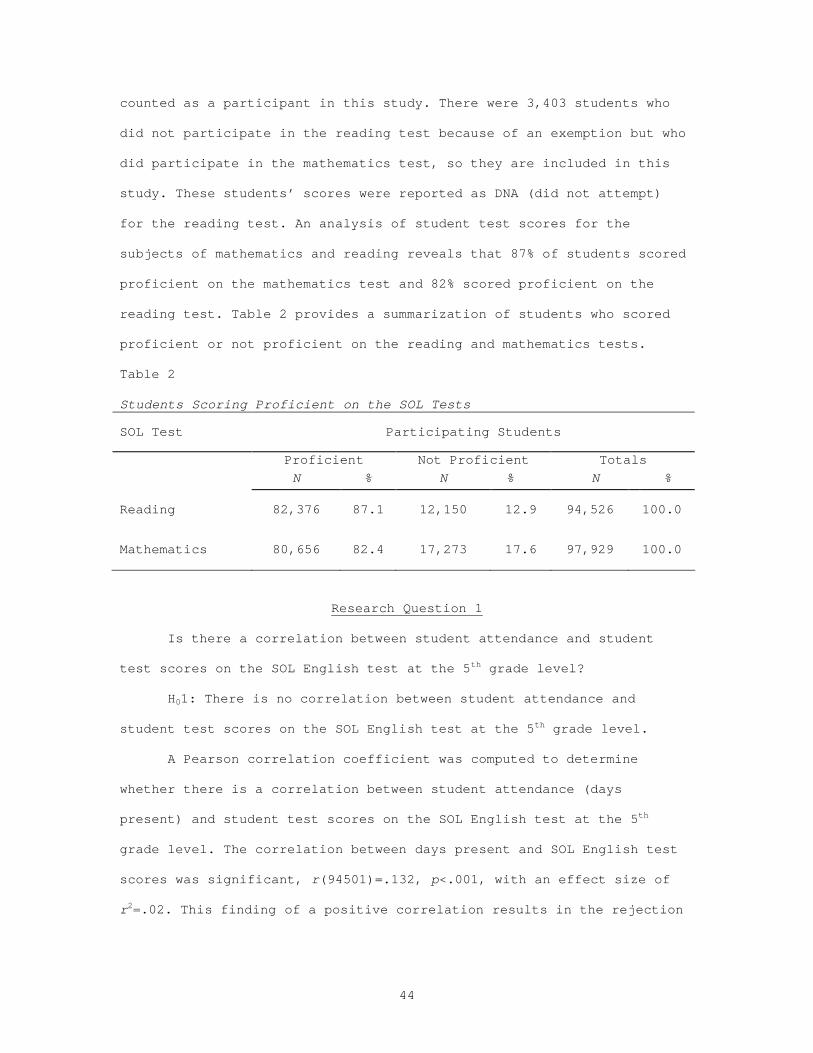
counted as a participant in this study. There were 3,403 students who
did not participate in the reading test because of an exemption but who
did participate in the mathematics test, so they are included in this
study. These students’ scores were reported as DNA (did not attempt)
for the reading test. An analysis of student test scores for the
subjects of mathematics and reading reveals that 87% of students scored
proficient on the mathematics test and 82% scored proficient on the
reading test. Table 2 provides a summarization of students who scored
proficient or not proficient on the reading and mathematics tests.
Table 2
Students Scoring Proficient on the SOL Tests
SOL Test Participating Students
Proficient Not Proficient TotalsN % N % N %
Reading 82,376 87.1 12,150 12.9 94,526 100.0
Mathematics 80,656 82.4 17,273 17.6 97,929 100.0
Research Question 1
Is there a correlation between student attendance and student
test scores on the SOL English test at the 5th grade level?
H01: There is no correlation between student attendance and
student test scores on the SOL English test at the 5th grade level.
A Pearson correlation coefficient was computed to determine
whether there is a correlation between student attendance (days
present) and student test scores on the SOL English test at the 5th
grade level. The correlation between days present and SOL English test
scores was significant, r(94501)=.132, p<.001, with an effect size of
r2=.02. This finding of a positive correlation results in the rejection

45
of the null hypothesis. Table 3 provides a summarization of data
related to this research question.
Table 3
Pearson Correlation Coefficients for Student Attendance and Test Scores on the SOL English Test at the 5th Grade
Group English Scores Days Present Correlation
M SD N M SD N r
All Students
480.48 69.81 94,526 163.13 33.16 97,905 .132**
** Correlation is significant at the .01 level (2-tailed).
Research Question 2
Is there a correlation between student attendance and student
test scores on the SOL mathematics test at the 5th grade level?
H02: There is no correlation between student attendance and
student test scores on the SOL mathematics test at the 5th grade level.
A Pearson correlation coefficient was computed to determine
whether there is a correlation between student attendance (days
present) and student test scores on the SOL mathematics test at the 5th
grade level. The correlation between days present and SOL mathematics
test scores was significant, r(97905)=.182, p<.001, with an effect size
of r2=.03. This finding of a positive correlation results in the
rejection of the null hypothesis. Table 4 provides a summarization of
data related to this research question.
Table 4
Pearson Correlation Coefficients for Student Attendance and Test Scores on the SOL Mathematics Test at the 5th Grade
Group Math Scores Days Present Correlation
M SD N M SD N r
All Students
480.97 87.55 97,929 163.13 33.16 97,905 .182**
** Correlation is significant at the .01 level (2-tailed).
46
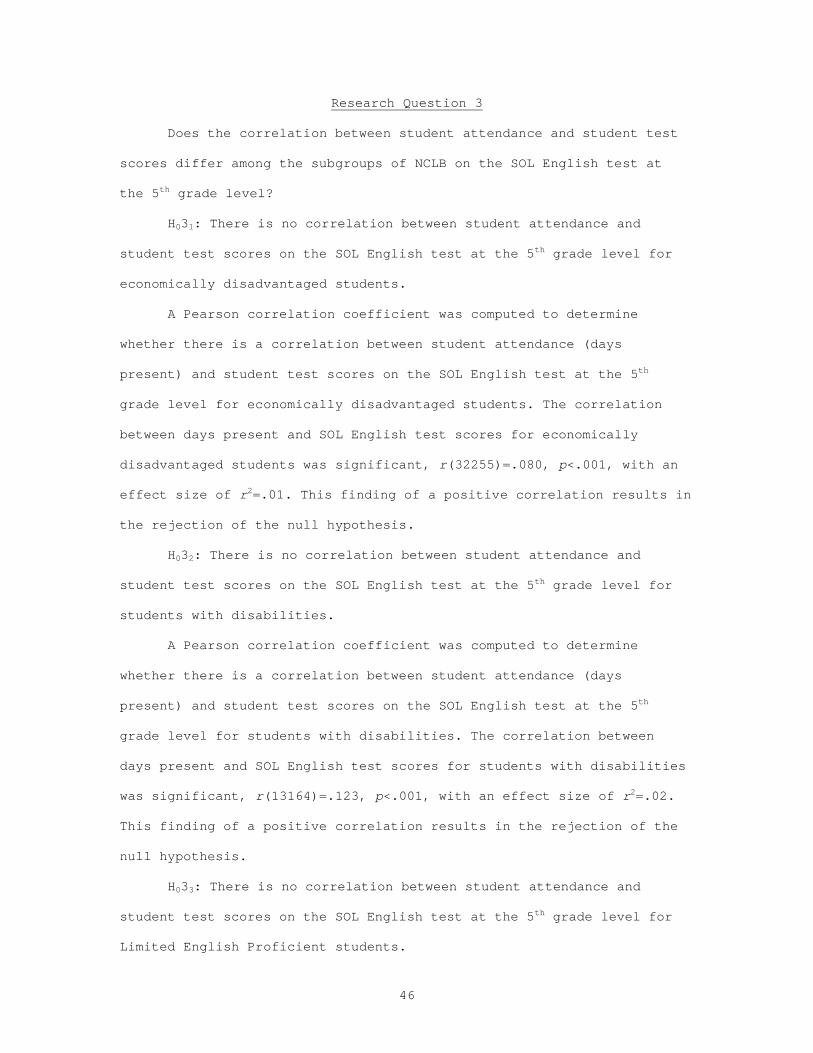
Research Question 3
Does the correlation between student attendance and student test
scores differ among the subgroups of NCLB on the SOL English test at
the 5th grade level?
H031: There is no correlation between student attendance and
student test scores on the SOL English test at the 5th grade level for
economically disadvantaged students.
A Pearson correlation coefficient was computed to determine
whether there is a correlation between student attendance (days
present) and student test scores on the SOL English test at the 5th
grade level for economically disadvantaged students. The correlation
between days present and SOL English test scores for economically
disadvantaged students was significant, r(32255)=.080, p<.001, with an
effect size of r2=.01. This finding of a positive correlation results in
the rejection of the null hypothesis.
H032: There is no correlation between student attendance and
student test scores on the SOL English test at the 5th grade level for
students with disabilities.
A Pearson correlation coefficient was computed to determine
whether there is a correlation between student attendance (days
present) and student test scores on the SOL English test at the 5th
grade level for students with disabilities. The correlation between
days present and SOL English test scores for students with disabilities
was significant, r(13164)=.123, p<.001, with an effect size of r2=.02.
This finding of a positive correlation results in the rejection of the
null hypothesis.
H033: There is no correlation between student attendance and
student test scores on the SOL English test at the 5th grade level for
Limited English Proficient students.

47
A Pearson correlation coefficient was computed to determine
whether there is a correlation between student attendance (days
present) and student test scores on the SOL English test at the 5th
grade level for Limited English Proficient students. The correlation
between days present and SOL English test scores was significant for
Limited English Proficient students, r(8187)=.098, p<.001, with an
effect size of r2=.01. This finding of a positive correlation results in
the rejection of the null hypothesis.
H034: There is no correlation between student attendance and
student test scores on the SOL English test at the 5th grade level for
white students.
A Pearson correlation coefficient was computed to determine
whether there is a correlation between student attendance (days
present) and student test scores on the SOL English test at the 5th
grade level for white students. The correlation between days present
and SOL English test scores for white students was significant,
r(58198)=.117, p<.001, with an effect size of r2=.01. This finding of a
positive correlation results in the rejection of the null hypothesis.
H035: There is no correlation between student attendance and
student test scores on the SOL English test at the 5th grade level for
black students.
A Pearson correlation coefficient was computed to determine
whether there is a correlation between student attendance (days
present) and student test scores on the SOL English test at the 5th
grade level for black students. The correlation between days present
and SOL English test scores for black students was significant,
r(23441)=.112, p<.001, with an effect size of r2=.01. This finding of a
positive correlation results in the rejection of the null hypothesis.

48
H036: There is no correlation between student attendance and
student test scores on the SOL English test at the 5th grade level for
Hispanic students.
A Pearson correlation coefficient was computed to determine
whether there is a correlation between student attendance (days
present) and student test scores on the SOL English test at the 5th
grade level for Hispanic students. The correlation between days present
and SOL English test scores for Hispanic students was significant,
r(8892)=.092, p<.001, with an effect size of r2=.01. This finding of a
positive correlation results in the rejection of the null hypothesis.
Table 5 provides a summarization of data related to this research
question.
Table 5
Pearson Correlation Coefficients for Subgroup Attendance and Test Scores on the SOL English Test at the 5th Grade
Subgroup English Scores Days Present Correlation
M SD N M SD N r
ED 452.38 66.92 30,046 156.11 40.25 32,255 .080**
SWD 437.38 69.22 12,206 160.88 35.03 13,164 .123**
LEP 460.39 62.34 6,359 156.57 41.62 9,187 .098**
White 493.60 67.88 57,709 165.93 28.23 58,198 .117**
Black 449.21 66.37 23,021 159.18 39.36 23,441 .112**
Hispanic 463.70 65.33 6,993 155.12 42.06 8,892 .092**
** Correlation is significant at the .01 level (2-tailed).
Research Question 4
Does the correlation between student attendance and student test
scores differ among the subgroups of NCLB on the SOL mathematics test
at the 5th grade level?

49
H041: There is no correlation between student attendance and
student test scores on the SOL mathematics test at the 5th grade level
for economically disadvantaged students.
A Pearson correlation coefficient was computed to determine
whether there is a correlation between student attendance (days
present) and student test scores on the SOL mathematics test at the 5th
grade level for economically disadvantaged students. The correlation
between days present and SOL mathematics test scores for economically
disadvantaged students, r(32255)=.145, p<.001, with an effect size of
r2=.02. This finding of a positive correlation results in the rejection
of the null hypothesis.
H042: There is no correlation between student attendance and
student test scores on the SOL mathematics test at the 5th grade level
for students with disabilities.
A Pearson correlation coefficient was computed to determine
whether there is a correlation between student attendance (days
present) and student test scores on the SOL mathematics test at the 5th
grade level for students with disabilities. The correlation between
days present and SOL mathematics test scores for students with
disabilities was significant, r(13164)=.156, p<.001, with an effect
size of r2=.02. This finding of a positive correlation results in the
rejection of the null hypothesis.
H043: There is no correlation between student attendance and
student test scores on the SOL mathematics test at the 5th grade level
for Limited English Proficient students.
A Pearson correlation coefficient was computed to determine
whether there is a correlation between student attendance (days
present) and student test scores on the SOL mathematics test at the 5th
grade level for Limited English Proficient students. The correlation

50
between days present and SOL mathematics test scores for Limited
English Proficient students was significant, r(9187)=.197, p<.001, with
an effect size of r2=.04. This finding of a positive correlation results
in the rejection of the null hypothesis.
H044: There is no correlation between student attendance and
student test scores on the SOL mathematics test at the 5th grade level
for white students.
A Pearson correlation coefficient was computed to determine
whether there is a correlation between student attendance (days
present) and student test scores on the SOL mathematics test at the 5th
grade level for white students. The correlation between days present
and SOL mathematics test scores for white students was significant,
r(58198)=.171, p<.001, with an effect size of r2=.03. This finding of a
positive correlation results in the rejection of the null hypothesis.
H045: There is no correlation between student attendance and
student test scores on the SOL mathematics test at the 5th grade level
for black students.
A Pearson correlation coefficient was computed to determine
whether there is a correlation between student attendance (days
present) and student test scores on the SOL mathematics test at the 5th
grade level for black students. The correlation between days present
and SOL mathematics test scores for black students was significant,
r(23441)=.141, p<.001, with an effect size of r2=.02. This finding of a
positive correlation results in the rejection of the null hypothesis.
H046: There is no correlation between student attendance and
student test scores on the SOL mathematics test at the 5th grade level
for Hispanic students.
A Pearson correlation coefficient was computed to determine
whether there is a correlation between student attendance (days
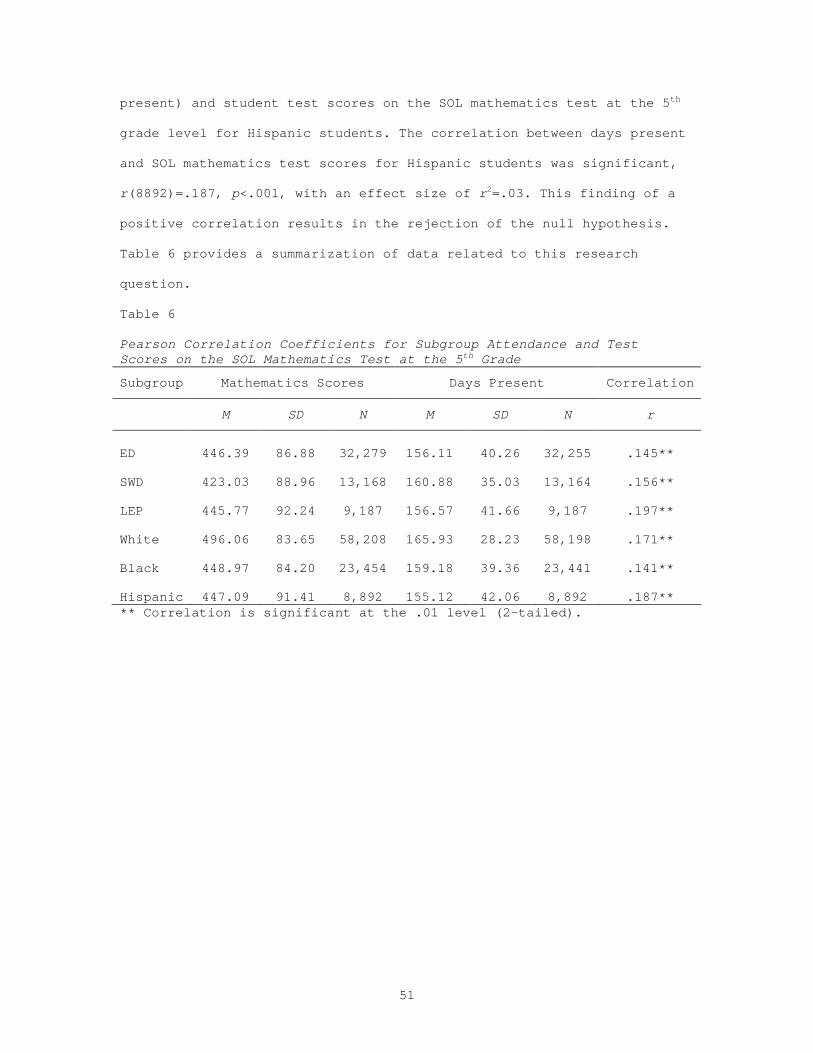
51
present) and student test scores on the SOL mathematics test at the 5th
grade level for Hispanic students. The correlation between days present
and SOL mathematics test scores for Hispanic students was significant,
r(8892)=.187, p<.001, with an effect size of r2=.03. This finding of a
positive correlation results in the rejection of the null hypothesis.
Table 6 provides a summarization of data related to this research
question.
Table 6
Pearson Correlation Coefficients for Subgroup Attendance and Test Scores on the SOL Mathematics Test at the 5th Grade
Subgroup Mathematics Scores Days Present Correlation
M SD N M SD N r
ED 446.39 86.88 32,279 156.11 40.26 32,255 .145**
SWD 423.03 88.96 13,168 160.88 35.03 13,164 .156**
LEP 445.77 92.24 9,187 156.57 41.66 9,187 .197**
White 496.06 83.65 58,208 165.93 28.23 58,198 .171**
Black 448.97 84.20 23,454 159.18 39.36 23,441 .141**
Hispanic 447.09 91.41 8,892 155.12 42.06 8,892 .187**** Correlation is significant at the .01 level (2-tailed).
52
CHAPTER 5
FINDINGS, CONCLUSIONS, AND RECOMMENDATIONS
The purpose of this study was to determine if a correlation
existed between student attendance and student performance on the 5th
grade SOL scores in English and mathematics in Virginia. The
correlation between student attendance and student performance was also
examined for each of the six subgroups of NCLB identified in Virginia.
Statistical procedures were used to determine correlations between the
variables of student attendance and student test scores. Chapter 5
contains a summary of the study, a summary of the findings,
conclusions, recommendations for practice, and recommendations for
further research.
Summary of the Study
This quantitative study examined the English scores and
mathematics scores of 5th grade students on the Virginia Standards of
Learning tests and the attendance of these students to determine if
there was a correlation between individual student attendance and
individual student scores on these criterion-referenced tests. This
study further examined the same data for the six subgroups of No Child
Left Behind as identified by state of Virginia to determine if a
correlation existed for each of the subgroups. The population for this
study consisted of 97,929 fifth grade students who participated in the
Standards of Learning state testing program in the state of Virginia
for the 2005-2006 school year. Pearson correlation coefficients were
calculated to determine the correlation between variables. The results
showed a statistically significant correlation between student
attendance and student test scores for both English and mathematics SOL
tests at the 5th grade level. The results also indicated a statistically
significant correlation between student attendance and student test

53
scores for all subgroups on both the English and the mathematics test.
The strength of the correlation varied among subgroups on both the
English and the mathematics test.
Summary of Findings
The statistical analyses for this study focused on four research
questions. Each question examined the correlation between student
attendance and student performance on the Virginia SOL tests. The
differences among the questions resulted from the examination of test
scores on the English SOL test and the mathematics SOL test, as well as
the examination of the overall student performance and the performance
of the six subgroups. Each research question is reiterated and summary
of the related results are presented in this section.
Question 1
Is there a correlation between student attendance and student
test scores on the SOL English test at the 5th grade level?
The Pearson correlation coefficient of .132 indicated that there
was a significant positive correlation between student attendance and
student test scores on the SOL English test at the 5th grade level. The
effect size indicated that 2% of the variance in test scores could be
accounted for by student attendance. The null hypothesis was rejected.
Question 2
Is there a correlation between student attendance and student
test scores on the SOL mathematics test at the 5th grade level?
The Pearson correlation coefficient of .182 indicated that there
was a significant positive correlation between student attendance and
student test scores on the SOL English test at the 5th grade level. The
effect size indicated that 3% of the variance in test scores could be
accounted for by student attendance. The null hypothesis was rejected.

54
Question 3
Does the correlation between student attendance and student test
scores differ among the six subgroups of NCLB on the SOL English test
at the 5th grade level?
The Pearson correlation coefficients indicated that a significant
positive correlation existed between student attendance and student
test scores for all six subgroups on the SOL English test at the 5th
grade level, although this correlation differed in relative strength
among the subgroups. All null hypotheses related to this question were
rejected. The subgroup of students with disabilities had the highest
correlation with a Pearson correlation coefficient of .123. The next
four subgroups in order of correlation strength were: white students
with a Pearson correlation coefficient of .117, black students with a
Pearson correlation coefficient of .122, LEP students with a Pearson
correlation coefficient of .098, and Hispanic students with a Pearson
correlation coefficient of .092. The subgroup of economically
disadvantaged students had the lowest correlation with a Pearson
correlation coefficient of .080. The effect sizes for these subgroups
indicated that less than 2% of the variance in test scores could be
accounted for by student attendance. The correlations for all subgroups
of students on the SOL English test were lower than the correlations
for the subgroups on the SOL mathematics test.
Question 4
Does the correlation between student attendance and student test
scores differ among the six subgroups of NCLB on the SOL mathematics
test at the 5th grade level?
The Pearson correlation coefficients indicated that a significant
positive correlation existed between student attendance and student
test scores on the SOL mathematics test for all six subgroups, although
55
this correlation differed in relative strength among the subgroups. All
null hypotheses related to this question were rejected. The subgroup of
Limited English Proficient students had the highest correlation with a
Pearson correlation coefficient of .197. The next four subgroups in
order of correlation strength were: Hispanic students with a Pearson
correlation coefficient of .187, white students with a Pearson
correlation coefficient of .171, students with disabilities with a
Pearson correlation coefficient of .156, and economically disadvantaged
students with a Pearson correlation coefficient of .145. The subgroup
of black students had the lowest correlation with a Pearson correlation
coefficient of .141. The effect sizes for these subgroups indicated
that at most 4% of the variance in test scores could be accounted for
by student attendance. The correlations for all subgroups on the SOL
mathematics test were higher than the correlations for the subgroups on
the SOL English test.
Conclusions
The results of this study indicated that there was a significant
positive correlation between student attendance, as measured by the
number of days present, and student performance on the Virginia SOL
test, a criterion-referenced test. These results may not be
particularly surprising to anyone because as Railsback (2004)
acknowledged, it is well known and widely accepted that having children
attend school on a regular basis is a key component of their academic
success. However, Corville-Smith (1995) noted that the issue of student
attendance has received relatively little attention from educational
researchers despite a history of concern. Several researchers
(Atkinson, 2005; Klem & Connell, 2004, Truby, 2001) documented that
research on the topic of student attendance has increased in recent
years due, at least in part, to the NCLB legislation. However, this

56
researcher found that a void still exists in research examining the
relationships between attendance and student performance on criterion-
referenced tests. The use of criterion-referenced tests has increased
dramatically since the enactment of NCLB, with these tests being used
by a large majority of states as a part of their state assessment
program (Mitchell, 2006; NCES, 2007b). Therefore, the findings of this
study will contribute to a growing body of research resulting from the
enactment of the No Child Left Behind legislation and the national
attention that this legislation has focused on student attendance and
student performance on standardized tests. Possibly the most important
implication of the results of this study was the research based support
that is provided to the widespread belief that student attendance is
directly related to student achievement.
The correlation between student attendance and student
performance on the SOL mathematics test was higher than the correlation
for the same variables on the English test. These higher correlations
were true for all subgroups as well as the overall student population.
Correlations for the subgroups on the mathematics test ranged from a
high of r=.197 to a low of r=.141, while the correlations for the
subgroups on the English test ranged from a high of r=.123 to a low of
r=.080. Of particular noteworthiness were the correlations of the LEP
and the Hispanic groups (r=.197 and r=.187, respectively) which were
the highest correlations on the mathematics test. These results are
interesting when considered within the context of other research
findings discussed in the literature review of Chapter 2. Several
studies have found that economically disadvantaged and minority
children fall behind their white peers in academic achievement (Farmer
et al., 2006; Neill, 2003; Novak & Fuller, 2004; Payne, 2005; Sheldon &
Epstein, 2005; USED, 2003). Likewise, numerous studies have reported
57
lower attendance rates from economically disadvantaged and minority
children (Horn & Chen, 1998; Lehr et al., 2004; NCES, 2007a; Payne).
While a causal relationship cannot be established between attendance
and achievement, the results of this study indicate that improving
student attendance for these subgroups could result in improved student
performance on the SOL tests. The effect sizes found in this study are
low, ranging from 1% to 4%. However, Witte and Witte (2004) noted that
large values of r2 are not generally expected in behavioral and
educational research. Therefore, they suggest that values of r2 close to
zero merit attention in many studies.
The correlation for the overall student population on the English
SOL test was higher than the correlation for any subgroup on the
English SOL test. Only the LEP and Hispanic subgroups had higher
correlations on the mathematics test than the overall student
population. This particularly interesting finding can possibly be
explained by the factor common to the two groups -- their level of
language proficiency. The study of mathematics does not require the
level of language proficiency that the study of reading requires for
Hispanic students and many LEP students because the Arabic number
system used in American schools is the same system used in their native
cultures. These students do not have to overcome a language barrier
during their daily instruction in mathematics; therefore, they are able
to focus on learning the mathematics material during the time they are
present. Perhaps this opportunity to focus on the material presented
rather than focusing on crossing the language barrier results in the
higher correlations between student attendance and student achievement
on the mathematics test.

58
Recommendations for Practice
Mitchell (2006) asserted that assessment is the essential
ingredient of accountability and accountability is the key word in
education today. Student test scores and student attendance are used as
measures of accountability and are specified as measures of
accountability for NCLB (Lehr et al., 2004; Railsback, 2004; USED,
2006). Because of the level of accountability in public education
today, all educators are concerned with student performance on
statewide standardized tests. The results of this study suggest that
improving student attendance could result in improved student
achievement on standardized tests. Educational practitioners can
potentially double the positive effects of their efforts toward
improved accountability results by focusing their efforts on student
attendance. Educators should develop and implement programs that
encourage, support, and recognize improved and sustained student
attendance. In addition to incentive programs that reward good
attendance, schools may implement deterrent programs with consequences
for poor attendance. Improved student attendance resulting in improved
student achievement provides improved accountability results in two
major categories as the result of a single effort directed at improving
student attendance.
Atkinson (2005) proposed that there is a critical link between
effective educational strategies and student attendance rates. Klem and
Connell (2004) documented the link the between teacher support and
student engagement and achievement. Educators must recognize the
importance of teacher efficacy in improving student attendance and
student achievement. Rutter (1989) concluded that good school
experiences are probably socially helpful to all children, but they are
critically important to subgroups under stress and with a lack of other

59
positive experiences. Administrators and teachers must ensure that all
students, but especially those students with the greatest educational
needs, have a positive school experience. The classroom teacher is the
critical component of a positive classroom experience, especially at
the elementary level where a student usually has the same teacher all
day. Teachers must embrace educational strategies and employ best
practices that assure positive learning environments and differentiated
instruction for all students. Students who experience success in the
classroom and feel that they are an important part of the school
community want to attend school. Only when students are present at
school can teachers effectively address their educational needs.
Improving student attendance is an area of educational
accountability that may be more easily influenced by educators than
many other factors. However, educators cannot adequately address this
topic without support from parents and community members. Educators
should develop public education campaigns that emphasize the importance
of good student attendance. Research based information that supports
the importance of good attendance should be disseminated to students,
parents, and the community as part of a community wide campaign to
improve student attendance. When parents, community groups, businesses,
and industries supplement the limited time and resources of educators
in encouraging improved student attendance, progress can be made at an
improved rate. Comprehensive attendance improvement programs supported
by educators, parents, community groups, and businesses have the
potential to impact student attendance at an unprecedented level.
Railsback (2004) maintained that it is well known and widely accepted
that having children attend school on a regular basis is a key
component of their academic success. Improved attendance may be the

60
first step to improved educational opportunities and personal
achievement for many students.
Recommendations for Further Study
No Child Left Behind required that decisions made and results
reported about education at all levels (school, division, and state) be
research-based and justifiable by scientifically accepted methods of
data collection (Reyna, 2002; USED, 2006). Feuer and Towne (2002)
predicted that the implications of these requirements foretold a new
era for educational leaders in the making of decisions and the
formulating of policies. Many of these policies, such as state testing
requirements, have increased the availability of data available for
educational research (Mitchell, 2006). Further research using both
quantitative and qualitative methods should be conducted as an
extension of this study, as the possibilities for both are extensive.
Mitchell (2006) noted that the implementation of No Child Left
Behind in 2001 caused a dramatic increase in the number of criterion-
referenced tests used at the state level because these tests measure
the achievement of knowledge and skills required by state standards.
This study focused on the Standards of Learning tests in Virginia but
could be replicated in other states using a different assessment
instrument. The possibilities for replicating the study in Virginia are
extensive just by changing variables such as grade level or subject
area.
Additional research could be conducted by examining the
relationships among groups of students who are grouped by test scores
or attendance. Individual student test scores on the SOL tests are
reported as advanced, proficient, or not proficient, so the attendance
of these groups could be examined. Students could be grouped by
attendance (i.e., good attendance, average attendance, and poor
61
attendance) and the test scores of each group analyzed in relation to
the attendance of the group.
One of the findings of this study was that the correlations of
the LEP and the Hispanic groups (r=.197 and r=.187, respectively) were
the highest correlations on the mathematics test. Batt et al. (2005)
verified that LEP students, the majority of which were Hispanic,
comprised the fastest growing subgroup in the country. Research should
be conducted to further validate these results and to determine the
reasons for these high correlations.
The correlation between student attendance and student
performance on the SOL mathematics test was higher than the correlation
for the same variables on the English test. These higher correlations
are true for all subgroups as well as the overall student population.
Additional research to examine these findings and present an
explanation or reasons for these differences is needed.
With the notable exceptions of the correlations of the LEP and
the Hispanic groups on the mathematics test, the correlations of all
subgroups were lower than the correlations for the overall student
groups on both the English and the mathematics tests. These results may
not be surprising because they are consistent with a large body of
research that documents the lack of achievement for subgroup
populations (Farmer et al., 2006; Neill, 2003; Novak & Fuller, 2004;
Payne; Sheldon & Epstein, 2005). However, these results should be of
great concern to all educators because research into the impact of
schools on their pupils has demonstrated the schools’ value in
providing support and sanctuary to children, especially of diverse
backgrounds (Payne, 2005). Extensive research is justified to determine
the possible causes of these achievement deficits. Researchers should
not assume that there are common factors among subgroups. Research

62
should be conducted to identify unique subgroup characteristics that
may contribute to the differences in achievement or attendance among
the subgroups.
Osterman (2000) studied students’ need for belonging in the
school community and concluded there is strong and consistent evidence
that students who experience acceptance are more motivated and engaged
in learning and more committed to school. She also concluded that
commitment and engagement in school is closely linked to students’
performance and to the quality of student learning. Additional research
conducted among students, teachers, and school administrators on the
topic of student engagement with the goal of improving student
engagement and teacher efficacy is paramount to improving the
educational experiences of all students.

63
REFERENCES
Atkinson, A. J. (Ed.). (2005). Improving school attendance: A resource guide for Virginia schools. Richmond, VA.: Virginia Department of Education.
Baker, M. L., Sigmon, J.N., & Nugent, M.E. (2001). Truancy reduction: Keeping students in school. Washington, DC: Office of Juvenile Justice and Delinquency Prevention.
Batt, L., Kim, J., & Sunderman, G. L. (2005). Limited English proficient students: Increased accountability under NCLB. Boston: The Civil Rights Project at Harvard University.
Beem, K. (2002). Eliminating dropouts with persistence and shoe leather: This small school district took on its truancy problem head-on. Its result: No dropouts. District Administration, 38(6),18-19.
Burley, M., & Harding, E. (1998). Truant students: Evaluating the impact of the “Becca Bill” truancy petition requirements.Olympia, WA: Washington State Institute for Public Policy.
Collins, M. D., & Cheek, E. H. (1993). Diagnostic-prescriptive reading instruction. Dubuque, IA: Wm. C. Brown.
Corville-Smith, J. (1995). Truancy, family processes, and intervention. In B. Ryan, G. Adams, T. Gullotta, R. Weissbeg, & R. Hampton, (Ed.), The family school connection: Theory, research and practice (pp. 270-287). Thousand Oaks, CA: Sage.
Darling-Hammond, L. (2004). From “Separate But Equal” to “No Child Left Behind”: The collision of new standards and old inequalities. In D. Meier and G. Wood (Ed.), Many children left behind (pp. 3-32). Boston: Beacon Press.
Dodge, K.A., Putallaz, M., & Malone, D. (2002). Coming of age: The department of education. Phi Delta Kappan, 83, 674-676.
Dougherty, J.W. (1999). Attending to attendance. Bloomington, IN: Phi Delta Kappa Educational Foundation.
Education Week. (2007, January 3). Quality counts 2007: From cradle to career. Education Week, 26(17), 7-94.
Engec, N. (2006). Relationship between mobility and student performance
and behavior. The Journal of Educational Research, 99, 167-178.
Epstein, J.L., & Sheldon, S.B. (2002). Present and accounted for: Improving student attendance through family and community involvement. The Journal of Educational Research, 95, 308-318.
Erpenpach, W.J., Forte-Fast, E., & Potts, A. (2003). Statewide educational accountability under NCLB. Washington, DC: Council for Chief State School Officers.

64
Farmer, T.W., Leung, M., Banks, J., Schaefer, V., Andrews, B., & Murray, R.A. (2006). Adequate yearly progress in small rural schools and rural low-income schools. The Rural Educator, (27), 1-7.
Ferrandino, V.L., & Tirozzi, G.N. (2004, March 15). Improving NCLB: Principal’s perspective. Education Week, 23, 5.
Feuer, M., & Towne, L. (2002, February 6). The logic and the basic principles of scientific based research. U.S. Department of Education Seminar on Scientifically Based Research. Retrieved January 27, 2007, from http://www.ed.gov/nclb/methods/whatworks/research/page_pg4.html
Garry, E.M. (1996). Truancy: First step to a lifetime of problems. Washington, DC: Office of Juvenile Justice and Delinquency Prevention.
Glaser, R. (1994). Instructional technology and the measurement of learning outcomes: Some questions. Educational Measurement: Issues and Practice, 13(4), 6-8. (Reprinted from American Psychologist, 18, 519-521.)
Greene-Wilkinson, D. (2006, September 25). Improving NCLB: Success, concerns, and solutions. [Testimony of Denise Greene-Wilkinson].Aspen Institute Commission on No Child Left Behind Hearings. Retrieved April 6, 2007, from http://www.aspeninstitute.org/atf/cf/%7BDEB6F227-659B-4EC8-8F84-8DF23CA704F5%7D/Denise%20Greene-Wilkinson%20Testimony.pdf
Hess, F.M., & Petrilli, M.J. (2006). No Child Left Behind primer. New York: Peter Lang.
Hambleton, R.K., & Jurgensen, C. (1990). Criterion-referenced assessment of school achievement. In Reynolds, C.R. and Kamphaus, R. W., (Ed.), Handbook of psychological & educational assessment of children: Intelligence & achievement (pp.456-476). New York: Guilford Press.
Horn, L.J., & Chen, X. (1998). Toward resiliency: At-risk students who make it to college. Washington, DC: United States Department of Education, Office of Educational Research and Improvement.
Kane, T.J., & Staiger, D.O. (2001). Improving school accountabilitymeasures. Cambridge, MA: National Bureau of Economic Research.
Karp, S. (2004). NCLB selective vision of equality: Some gaps count more than others. In D. Meier and G. Wood (Ed.), Many children left behind (pp. 53-65). Boston: Beacon Press.
Klem, A.M., & Connell, J.P. (2004). Relationships matter: Linking teacher support to student engagement and achievement. Journal of School Health, 74, 262-273.
Lehr, C.A., Johnson, D.R., Bremer, C.D., Cosio, A., & Thompson, M. (2004). Essential tools: Increasing rates of school completion:

65
Moving from policy and research to practice. Minneapolis, MN: University of Minnesota.
Linn, R.L. (2003). Accountability: Responsibility and reasonable expectations. Educational Researcher, 32, 3-13.
Marks, H.M. (2000). Student engagement in instructional activity: Patterns in the elementary, middle, and high school years. American Educational Research Journal, 37, 153-184.
Menken, K. (2000). What are critical issues in wide-scale assessment of English language learners? Washington, DC: National Clearinghouse for Bilingual Education.
McGuinn, P.J. (2006). No Child Left Behind and the transformation of federal education policy, 1965-2005. Lawrence, KS: University Press of Kansas.
McNeely, C.A., Nonnemaker, J.M., & Blum, R.W. (2002). Promoting school connectedness: Evidence from the national longitudinal study of adolescent health. Journal of School Health, 72, 138-146.
Mitchell, R. (2006). The nature of assessment: A guide to standardized testing. Center for Public Education. Retrieved January 29, 2007, from http://www.centerforpubliceducation.org/site/c.kjJXJ5MPIwE/b.1460713/apps/s/content.asp?ct=2040961
Moore, R. (2005). Attendance: Are penalties more effective than rewards? Journal of Developmental Education, 29 (2), 26-32.
Musher, K.K., Musher, D.M., Graviss, E.A., & Strudler, R.M. (2005). Can an intense educational experience improve performance on objective tests? Results from one charter school. The Educational Forum, 69, 352-366.
National Association of State Boards of Education. (2001). A primer on state accountability and large-scale assessments. Alexandria, VA: Author.
National Center for Education Statistics. (2007a). The condition of education: Student absenteeism. Retrieved February 10, 2007, from http://nces.ed.gov/programs/statereform
National Center for Education Statistics. (2007b). State education reforms: Standards, assessment, and accountability. Retrieved February 4, 2007, from http://nces.ed.gov/programs/statereform
National Research Council. (2003). Engaging schools: Fostering high school students’ motivation to learn. Washington, DC: The National Academies Press.
Neill, M. (2003). Leaving children behind: How No Child Left Behind will fail our children. Phi Delta Kappan, 85, 225-228.
Neuman, S. B. (2002, February 6). Welcome and introduction. U.S. Department of Education Seminar on Scientifically Based Research.

66
Retrieved June 18, 2005, from http://www.ed.gov/nclb/methods/whatworks/research/page_pg2.html
Novak, J.R., & Fuller, B. (2004). Penalizing diverse schools? Similar test scores but different students bring federal sanctions.Berkley: Policy Analysis for California Education.
Osterman, K.F. (2000). Students’ need for belonging in the school community. Review of Educational Research, 70, 323-367.
Owens, R.G. (2004). Organizational behavior in education: Adaptive leadership and school reform. Boston: Pearson Education.
Payne, R.K. (2005). A framework for understanding poverty. Highlands, TX: aha! Process.
Popham, W.J. (1999). Why standardized tests don’t measure educational quality. Educational Leadership, 56, 8-15.
Popham, W.J. (2004). America’s failing schools: How parents and teachers can cope with No Child Left Behind. London: Routledge.
Railsback, J. (2004). Increasing student attendance: Strategies from research and practice. Portland, OR: Northwest Regional Educational Laboratory.
Reyna, V. (2002, February 6). What is scientifically based evidence? What is its logic? U.S. Department of Education Seminar on Scientifically Based Research. Retrieved November 25, 2006, from http://www.ed.gov/nclb/methods/whatworks/research/page_pg3.html
Rutter, M. (1989). Pathways from childhood to adult life. Journal of Child Psychology and Psychiatry and Allied Disciplines, 30, 23-51.
Sanderson, A., Dugoni, B., Rasinsky, K., & Taylor, J. (1996). National education longitudinal study 1988-1994: Descriptive summary report. Washington, DC: National Center for Education Statistics.
Schmoker, M. (2001). The results fieldbook. Alexandria, VA: Association for Supervision and Curriculum Development.
Schwartzbeck, T.D. (2005). Will the winds of change bring a growth model? The School Administrator, 62, 47-48.
Shaul, M.S. (2006). No Child Left Behind act: States face challenges measuring academic growth. Testimony before the house committee on education and the workforce. Washington, DC: United States Government Accountability Office.
Sheldon, S. B., & Epstein, J.L. (2005). Involvement counts: Family and community partnerships and mathematics achievement. The Journal of Educational Research, 98(4), 196-206.
Sizer, T. R. (2004). Preamble: A reminder for Americans. In D. Meier and G. Wood (Ed.), Many children left behind (pp. xvii-xxii). Boston: Beacon Press.

67
Sunderman, G.L., & Kim, J.S. (2004). Inspiring visions, disappointing results: Four studies on implementing the No Child Left Behind act. Cambridge, MA: Harvard Civil Rights Project.
Tretter, T.R., & Jones, M. G. (2003). Relationships between inquiry-based teaching and physical science standardized test scores. School Science and Mathematics, 103, 345-350.
The National Academy of Sciences. (2003). Engaging schools: Fostering high school students motivation to learn. Washington, DC: Author.
Truby, D. (2001). Education news: Attendance makes the difference. Instructor, 101, 8.
United States Department of Education. (2003). No Child Left Behind: A toolkit for teachers. Washington, DC: Author.
United States Department of Education. (2004). Glossary of terms. Retrieved January 13, 2007, from http://www.ed.gov/nclb/index/az/glossary.html?src=az#3
United States Department of Education. (2005). No Child Left Behind.Retrieved June 18, 2005, from http://www.ed.gov/No Child Left Behind/landing.jhtml
United States Department of Education. (2006). No Child Left Behind.Retrieved January 13, 2007, from http://www.ed.gov/nclb/landing.jhtml
Virginia Department of Education. (2003, February 25). Minutes: Committee to implement the No Child Left Behind act. Retrieved April 7, 2007, from http://pen6.pen.k12.va.us/VDOE/meetings/2003/2-25NCLB.pdf
Virginia Department of Education. (2004). Virginia graduation requirements: Standard diploma. Retrieved January 21, 2006, from http://www.pen.k12.va.us/2plus4in2004/dip-standard.shtml
Virginia Department of Education. (2005a). Virginia implements No Child Left Behind. Retrieved June 20, 2005, from http://www.pen.k12.va.us/VDOE/nclb/
Virginia Department of Education. (2005b). Data definitions. Retrieved January 20, 2007, from http://www.pen.k12.va.us/VDOE/Publications/student-coll/data_definitions.html
Virginia Department of Education. (2006). Accountability and Virginia public schools. Richmond, VA: Author.
Virginia Department of Education. (2007a). Specifications for completing the student records data collection. Richmond, VA: Author.
Virginia Department of Education. (2007b). Other academic indicator information. [Data file]. Richmond, VA: Author.

68
Wilde, J. (2004). Definitions for the No Child Left Behind act of 2001: Assessment. Washington, DC: National Clearinghouse for English Language Acquisition.
Witte, J.S. & Witte, R.S. (2004). Statistics (7th Ed.). Hoboken, NJ: John Wiley & Sons.
Zucker, S. (2003). Fundamentals of standardized testing. San Antonio, TX: Harcourt Assessment.

69
VITA
JEFFREY D. CASSELL
Personal Data: Date of Birth: April 23, 1964Place of Birth: Ceres, Virginia
Education: Emory & Henry College, Emory, VirginiaBachelors of Arts, 1986Mathematics, Computer Science, Education
Virginia Tech, Blacksburg, VirginiaMasters of Education, 1989Curriculum and Instruction
University of Virginia, Charlottesville, VirginiaCertification, 1991Administration and Supervision
East Tennessee State University, Johnson City, TennesseeDoctorate of Education, 2007Educational Leadership and Policy Analysis
Professional Experience: Mathematics Teacher, Rich Valley High School,
Saltville, Virginia, 1986-1987
Mathematics Teacher, Northwood Middle School,Saltville, Virginia, 1987-1999
Principal, Rich Valley Elementary School,Saltville, Virginia, 1999-2007
Director of Operations & Finance, Smyth County SchoolsMarion, Virginia, 2007-Present
Recommended