Journal of Constructional Steel Research 89 (2013) 185–197
Contents lists available at ScienceDirect
Journal of Constructional Steel Research
Rehabilitation and condition assessment of a centenary steeltruss bridge
Bruno J.A. Costa a,⁎, J.A. Figueiras b
a LABEST, Faculdade de Engenharia, Universidade da Beira Interior, Edifício II das Engenharias, Calçada Fonte do Lameiro, 6200-001 Covilhã, Portugalb LABEST, Faculdade de Engenharia, Universidade do Porto, Rua Dr. Roberto Frias s/n, 4200-465 Porto, Portugal
⁎ Corresponding author. Tel.: +351 275329722; fax:E-mail addresses: [email protected] (B.J.A. Costa), jafig@fe
0143-974X/$ – see front matter © 2013 Elsevier Ltd. Alhttp://dx.doi.org/10.1016/j.jcsr.2013.06.013
a b s t r a c t
a r t i c l e i n f oArticle history:Received 9 July 2012Accepted 29 June 2013Available online 30 July 2013
Keywords:Centenary steel bridgeRehabilitation designField testingNumerical analysisSafety assessment
The maintenance and rehabilitation of old steel bridges are fields of growing relevance in terms of economicimpact. In this context, the state-of-the-art and state-of-the-practice in non-destructive testing and evalua-tion are crucial for an accurate condition assessment of the bridges, which in turn provides reliable data toassist the decision making process in their management, to identify the actual impact of the modifications in-troduced in the bridge behaviour as a result of rehabilitation programmes, as well as to improve these pro-jects at the design stage.This paper presents the experimental and numerical study of a centenary steel bridge, the Pinhão Bridge,which underwent an extensive rehabilitation and strengthening process. The scope and objectives of the pro-ject are outlined. The field tests carried out before and after the construction works are described and the col-lected measurements are analysed. In order to discuss the test results and to perform the safety assessment ofthe new bridge condition, 3D numerical models were developed and duly validated.The results show a significant increase of the flexural stiffness of the bridge spans due to the strengthening ofthe deck floor system. In addition, the effectiveness of the adopted solutions was, in general, evidenced. How-ever, the structural analysis revealed that the strengthening design of the girders' chords was unbalanced,which has led to an inadequate safety level for the upper members. On the contrary, the strengthening ofthe steel members pertaining to the floor system was overdesigned, thus resulting in a costly outcome.
© 2013 Elsevier Ltd. All rights reserved.
1. Introduction
Although many old iron and steel bridges constitute inseparablesymbols of the landscape and milestones of the industrial heritage,for some of them, particularly the ones from the early days, the resto-ration or rehabilitation may be unfeasible. Technical reasons relatedto the poor condition, non-compliance with the contemporary struc-tural safety codes or inability to meet the present traffic demands, be-sides obvious economic issues, may dictate the decommissioning,scrapping or replacement of these structures. Nevertheless, the num-ber of rehabilitation and strengthening projects performed in steeland iron bridges has rapidly increased in the last decades, mainlydriven by changes in the social, economic and technical environments[1–4].
State-of-the-art methodologies for structural condition assess-ment have been applied to assist the decision-making process in themanagement of old iron and steel bridges. In all of them, the adoptionof suitable experimental and numerical tools is crucial. Within a stan-dard framework, non-destructive testing techniques supply valuabledata for the calibration of models, ultimately leading to a complete
+351 275329969..up.pt (J.A. Figueiras).
l rights reserved.
structural identification. Only through a combined and rational ap-proach of these arts it is possible to detect, characterize and quantifyuseful reserves in the load carrying capacity or to identify the weakestlinks in the structural resistance. Several projects can be pointed asreferences in the condition assessment of old iron and steel bridges.Chajes et al. [5] have performed the load rating of a posted 3-spansteel-girder-and-slab bridge by conducting a diagnostic load testthat supplied the necessary data for the finite element (FE) analysessimulating different scenarios. Chakraborty and DeWolf [6] have car-ried out load tests on a 3-span slab-on-steel-girder bridge to validatea finite element model used to assist the determination of live loaddistribution factors for comparison with the values stipulated by theAASHTO specifications. Bancila and Cristescu [7] have reported thesuccessful assessment of a combined railway and highway truss gird-er bridge, in which field test data was used to validate the modelsadopted in the structural analyses performed in accordance withmodern codes. O'Connell and Dexter [8] have measured the strain re-sponses of several members of two different steel truss bridges undercontrolled truck loads, whose readings were compared to estimatesprovided by 2D and 3D finite element models. Allen and Rens [9]have presented the results of a strain gauge study performed on aslab-on-girder bridge that afterwards the completion of the rehabili-tation works experienced significant structural distress in most of the
186 B.J.A. Costa, J.A. Figueiras / Journal of Constructional Steel Research 89 (2013) 185–197
ending piers, which required urgent corrective measures. Fu et al.[10] planned an extensive performance evaluation of a rehabilitatedtruss bridge, with the purpose of investigating the structural roleplayed by the new fibre-reinforced polymer deck, the live load distri-bution factors and the bridge load rating (see Fig. 1). Short-termstrain monitoring campaigns were carried out by Rodrigues et al.[11] on a double-deck steel truss bridge using fibre Bragg gratingstrain sensors, in order to appraise key issues concerning the behav-iour and safety of the structure at the beginning, during and afterthe strengthening works.
In this paper the experimental and numerical study of a centenarysteel bridge, the Pinhão Bridge, which underwent an extensive reha-bilitation and strengthening process, is reported. The main objectivesto achieve through the implementation of the research project were:a) to allow an easy interpretation of the changes produced in thebridge response as a result of the performed construction works; b) toevaluate the effectiveness of the adopted strengthening schemes; c) tosupply field data for the validation of the numerical models developedto simulate the behaviour of the bridge during different phases; d) tocarry out an accurate safety assessment of the bridge for the new load-ing conditions; and e) to draw conclusions regarding the balance of thestrengthening design, both in terms of safety and costs, and the ade-quacy of some applied procedures. With the purpose of meetingthese requirements specific procedures were devised for the fieldtests related both to the loading process and to the instrumentation.Moreover, a modelling strategy was implemented to enable a propervalidation of the numerical models and their easy use in the struc-tural analysis.
2. Background
2.1. Geographic, economic and historical context
The Pinhão Bridge establishes a key roadway link over the DouroRiver between the districts of Viseu and Vila Real, near the villagewith the same name in the north of Portugal. The structure wasbuilt between 1903 and 1906, and was opened to the traffic in 1907after carrying out a field test [12]. Nowadays, the bridge stands as asignificant heritage of the industrial history and still plays a majorrole in the roadway infrastructure of the Alto Douro vineyard region,being the only river crossing available in a 25 km radius.
The tragic failure in March of 2001 of the Hintze Ribeiro Bridgelocated downstream in the same river, worldwide reported by themedia at the time, brought to light weaknesses in the maintenanceand management systems of the country's infrastructures. This unfor-tunate event caused a great concern in the responsible authoritiesand alarm among the general population. In response, the National
Fig. 1. (a) Placement of a new FRP composite deck on a truss bridge [10]; and (b) doub
Roadway Institute (E.P. — Estradas de Portugal) engaged a nationalcampaign of inspections to assess the condition of several bridgesand viaducts, particularly the structures crossing the same riverspanned by the collapsed bridge. One of such surveys was conductedon the Pinhão Bridge by means of a step-by-step procedure, between2003 and 2004, and led to traffic restrictions in terms of vehicles'gross weight and speed [12]. Then, the condition assessment of thebridge was carried out, which included an in-depth experimentalcampaign for the complete characterization of the structural behav-iour. The results enabled to conclude that it was viable to repair andstrengthen the bridge to withstand the current operation needs.
2.2. Description of the bridge
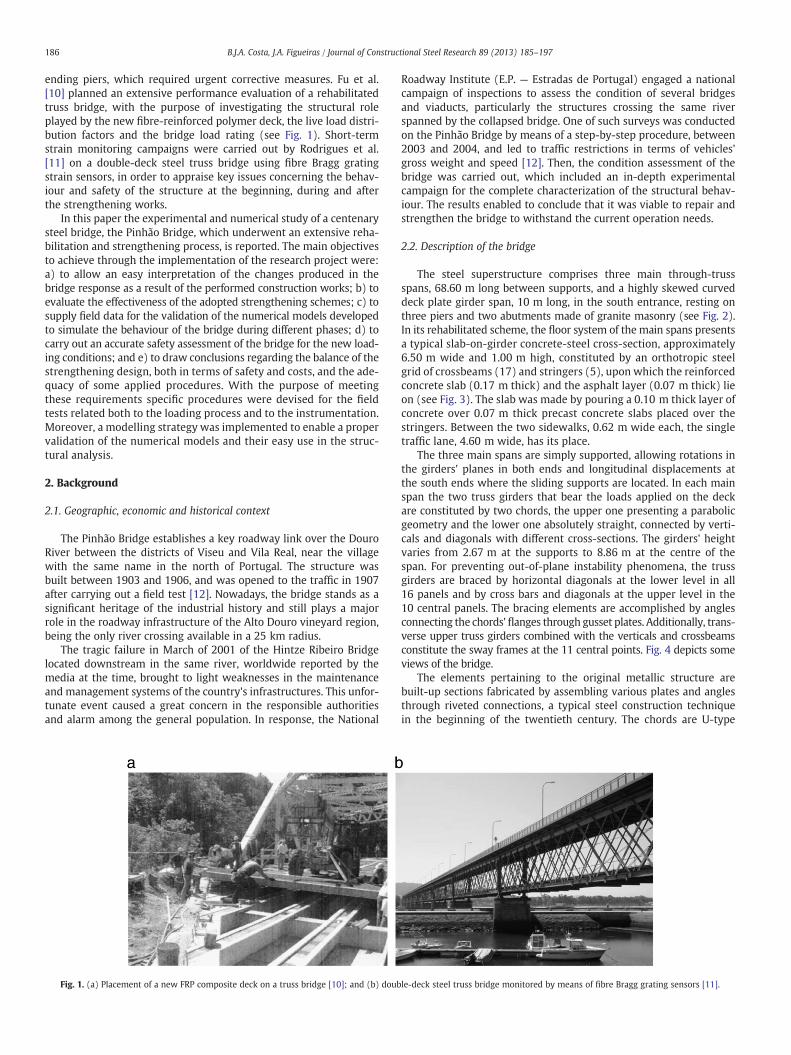
The steel superstructure comprises three main through-trussspans, 68.60 m long between supports, and a highly skewed curveddeck plate girder span, 10 m long, in the south entrance, resting onthree piers and two abutments made of granite masonry (see Fig. 2).In its rehabilitated scheme, the floor system of the main spans presentsa typical slab-on-girder concrete-steel cross-section, approximately6.50 m wide and 1.00 m high, constituted by an orthotropic steelgrid of crossbeams (17) and stringers (5), upon which the reinforcedconcrete slab (0.17 m thick) and the asphalt layer (0.07 m thick) lieon (see Fig. 3). The slab was made by pouring a 0.10 m thick layer ofconcrete over 0.07 m thick precast concrete slabs placed over thestringers. Between the two sidewalks, 0.62 m wide each, the singletraffic lane, 4.60 m wide, has its place.
The three main spans are simply supported, allowing rotations inthe girders' planes in both ends and longitudinal displacements atthe south ends where the sliding supports are located. In each mainspan the two truss girders that bear the loads applied on the deckare constituted by two chords, the upper one presenting a parabolicgeometry and the lower one absolutely straight, connected by verti-cals and diagonals with different cross-sections. The girders' heightvaries from 2.67 m at the supports to 8.86 m at the centre of thespan. For preventing out-of-plane instability phenomena, the trussgirders are braced by horizontal diagonals at the lower level in all16 panels and by cross bars and diagonals at the upper level in the10 central panels. The bracing elements are accomplished by anglesconnecting the chords' flanges through gusset plates. Additionally, trans-verse upper truss girders combined with the verticals and crossbeamsconstitute the sway frames at the 11 central points. Fig. 4 depicts someviews of the bridge.
The elements pertaining to the original metallic structure arebuilt-up sections fabricated by assembling various plates and anglesthrough riveted connections, a typical steel construction techniquein the beginning of the twentieth century. The chords are U-type
le-deck steel truss bridge monitored by means of fibre Bragg grating sensors [11].
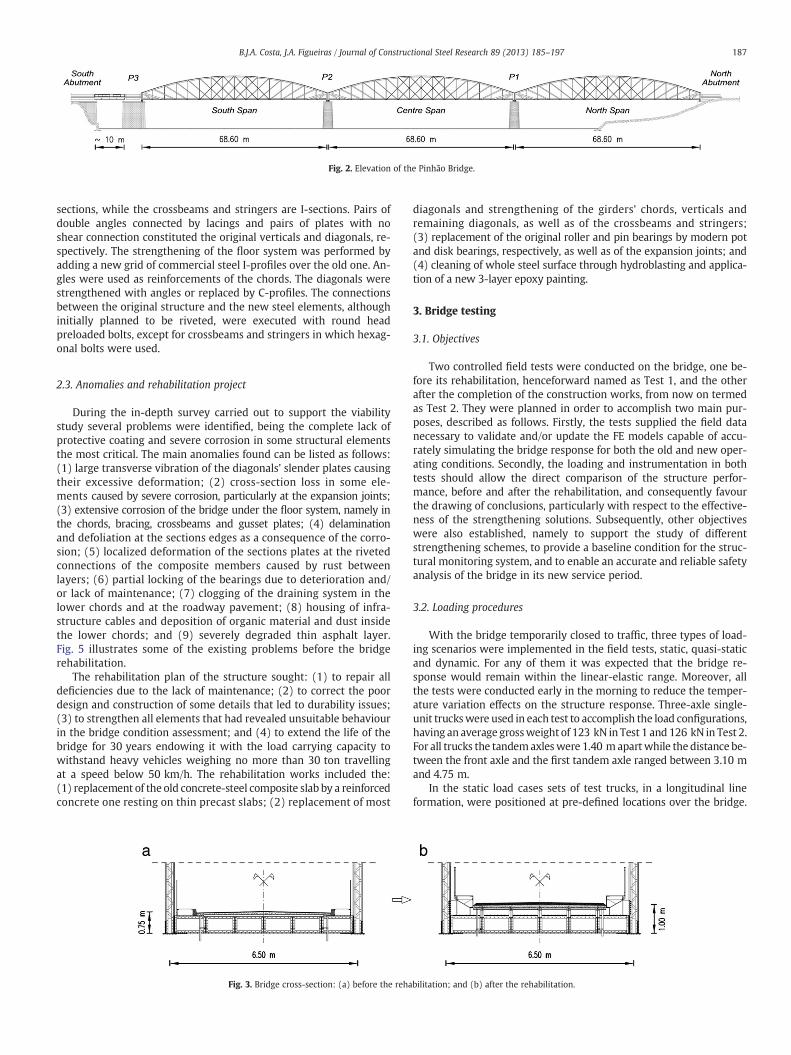
Fig. 2. Elevation of the Pinhão Bridge.
187B.J.A. Costa, J.A. Figueiras / Journal of Constructional Steel Research 89 (2013) 185–197
sections, while the crossbeams and stringers are I-sections. Pairs ofdouble angles connected by lacings and pairs of plates with noshear connection constituted the original verticals and diagonals, re-spectively. The strengthening of the floor system was performed byadding a new grid of commercial steel I-profiles over the old one. An-gles were used as reinforcements of the chords. The diagonals werestrengthened with angles or replaced by C-profiles. The connectionsbetween the original structure and the new steel elements, althoughinitially planned to be riveted, were executed with round headpreloaded bolts, except for crossbeams and stringers in which hexag-onal bolts were used.
2.3. Anomalies and rehabilitation project
During the in-depth survey carried out to support the viabilitystudy several problems were identified, being the complete lack ofprotective coating and severe corrosion in some structural elementsthe most critical. The main anomalies found can be listed as follows:(1) large transverse vibration of the diagonals' slender plates causingtheir excessive deformation; (2) cross-section loss in some ele-ments caused by severe corrosion, particularly at the expansion joints;(3) extensive corrosion of the bridge under the floor system, namely inthe chords, bracing, crossbeams and gusset plates; (4) delaminationand defoliation at the sections edges as a consequence of the corro-sion; (5) localized deformation of the sections plates at the rivetedconnections of the composite members caused by rust betweenlayers; (6) partial locking of the bearings due to deterioration and/or lack of maintenance; (7) clogging of the draining system in thelower chords and at the roadway pavement; (8) housing of infra-structure cables and deposition of organic material and dust insidethe lower chords; and (9) severely degraded thin asphalt layer.Fig. 5 illustrates some of the existing problems before the bridgerehabilitation.
The rehabilitation plan of the structure sought: (1) to repair alldeficiencies due to the lack of maintenance; (2) to correct the poordesign and construction of some details that led to durability issues;(3) to strengthen all elements that had revealed unsuitable behaviourin the bridge condition assessment; and (4) to extend the life of thebridge for 30 years endowing it with the load carrying capacity towithstand heavy vehicles weighing no more than 30 ton travellingat a speed below 50 km/h. The rehabilitation works included the:(1) replacement of the old concrete-steel composite slab by a reinforcedconcrete one resting on thin precast slabs; (2) replacement of most
Fig. 3. Bridge cross-section: (a) before the reha
diagonals and strengthening of the girders' chords, verticals andremaining diagonals, as well as of the crossbeams and stringers;(3) replacement of the original roller and pin bearings by modern potand disk bearings, respectively, as well as of the expansion joints; and(4) cleaning of whole steel surface through hydroblasting and applica-tion of a new 3-layer epoxy painting.
3. Bridge testing
3.1. Objectives
Two controlled field tests were conducted on the bridge, one be-fore its rehabilitation, henceforward named as Test 1, and the otherafter the completion of the construction works, from now on termedas Test 2. They were planned in order to accomplish two main pur-poses, described as follows. Firstly, the tests supplied the field datanecessary to validate and/or update the FE models capable of accu-rately simulating the bridge response for both the old and new oper-ating conditions. Secondly, the loading and instrumentation in bothtests should allow the direct comparison of the structure perfor-mance, before and after the rehabilitation, and consequently favourthe drawing of conclusions, particularly with respect to the effective-ness of the strengthening solutions. Subsequently, other objectiveswere also established, namely to support the study of differentstrengthening schemes, to provide a baseline condition for the struc-tural monitoring system, and to enable an accurate and reliable safetyanalysis of the bridge in its new service period.
3.2. Loading procedures
With the bridge temporarily closed to traffic, three types of load-ing scenarios were implemented in the field tests, static, quasi-staticand dynamic. For any of them it was expected that the bridge re-sponse would remain within the linear-elastic range. Moreover, allthe tests were conducted early in the morning to reduce the temper-ature variation effects on the structure response. Three-axle single-unit truckswere used in each test to accomplish the load configurations,having an average grossweight of 123 kN in Test 1 and 126 kN in Test 2.For all trucks the tandemaxleswere 1.40 mapartwhile the distance be-tween the front axle and the first tandem axle ranged between 3.10 mand 4.75 m.
In the static load cases sets of test trucks, in a longitudinal lineformation, were positioned at pre-defined locations over the bridge.
bilitation; and (b) after the rehabilitation.
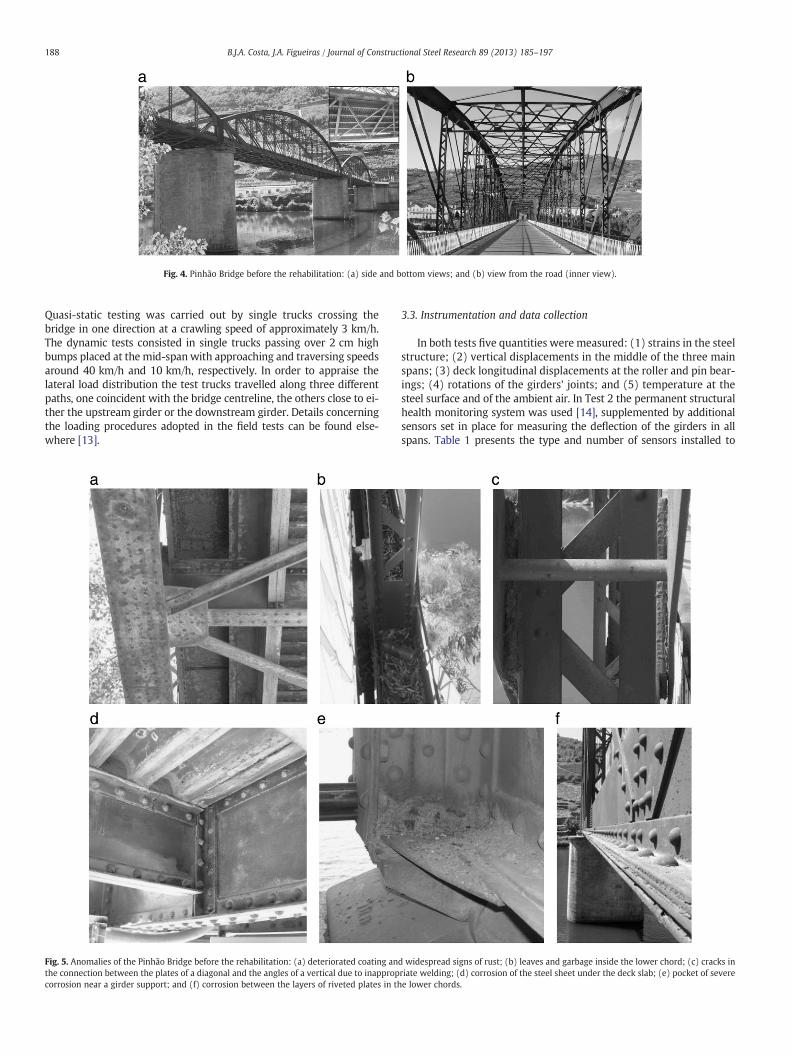
Fig. 4. Pinhão Bridge before the rehabilitation: (a) side and bottom views; and (b) view from the road (inner view).
188 B.J.A. Costa, J.A. Figueiras / Journal of Constructional Steel Research 89 (2013) 185–197
Quasi-static testing was carried out by single trucks crossing thebridge in one direction at a crawling speed of approximately 3 km/h.The dynamic tests consisted in single trucks passing over 2 cm highbumps placed at the mid-span with approaching and traversing speedsaround 40 km/h and 10 km/h, respectively. In order to appraise thelateral load distribution the test trucks travelled along three differentpaths, one coincident with the bridge centreline, the others close to ei-ther the upstream girder or the downstream girder. Details concerningthe loading procedures adopted in the field tests can be found else-where [13].
Fig. 5. Anomalies of the Pinhão Bridge before the rehabilitation: (a) deteriorated coating anthe connection between the plates of a diagonal and the angles of a vertical due to inappropcorrosion near a girder support; and (f) corrosion between the layers of riveted plates in th
3.3. Instrumentation and data collection
In both tests five quantities were measured: (1) strains in the steelstructure; (2) vertical displacements in the middle of the three mainspans; (3) deck longitudinal displacements at the roller and pin bear-ings; (4) rotations of the girders' joints; and (5) temperature at thesteel surface and of the ambient air. In Test 2 the permanent structuralhealth monitoring system was used [14], supplemented by additionalsensors set in place for measuring the deflection of the girders in allspans. Table 1 presents the type and number of sensors installed to
d widespread signs of rust; (b) leaves and garbage inside the lower chord; (c) cracks inriate welding; (d) corrosion of the steel sheet under the deck slab; (e) pocket of severee lower chords.
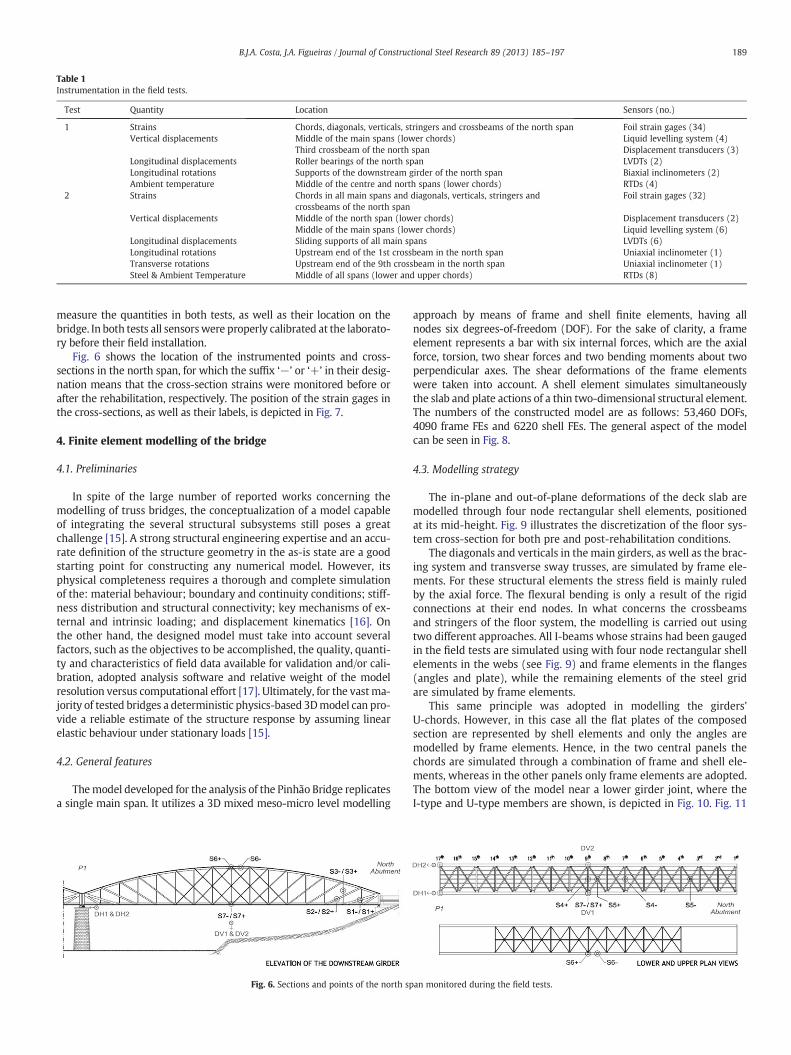
Table 1Instrumentation in the field tests.
Test Quantity Location Sensors (no.)
1 Strains Chords, diagonals, verticals, stringers and crossbeams of the north span Foil strain gages (34)Vertical displacements Middle of the main spans (lower chords) Liquid levelling system (4)
Third crossbeam of the north span Displacement transducers (3)Longitudinal displacements Roller bearings of the north span LVDTs (2)Longitudinal rotations Supports of the downstream girder of the north span Biaxial inclinometers (2)Ambient temperature Middle of the centre and north spans (lower chords) RTDs (4)
2 Strains Chords in all main spans and diagonals, verticals, stringers andcrossbeams of the north span
Foil strain gages (32)
Vertical displacements Middle of the north span (lower chords) Displacement transducers (2)Middle of the main spans (lower chords) Liquid levelling system (6)
Longitudinal displacements Sliding supports of all main spans LVDTs (6)Longitudinal rotations Upstream end of the 1st crossbeam in the north span Uniaxial inclinometer (1)Transverse rotations Upstream end of the 9th crossbeam in the north span Uniaxial inclinometer (1)Steel & Ambient Temperature Middle of all spans (lower and upper chords) RTDs (8)
189B.J.A. Costa, J.A. Figueiras / Journal of Constructional Steel Research 89 (2013) 185–197
measure the quantities in both tests, as well as their location on thebridge. In both tests all sensorswere properly calibrated at the laborato-ry before their field installation.
Fig. 6 shows the location of the instrumented points and cross-sections in the north span, for which the suffix ‘−’ or ‘+’ in their desig-nation means that the cross-section strains were monitored before orafter the rehabilitation, respectively. The position of the strain gages inthe cross-sections, as well as their labels, is depicted in Fig. 7.
4. Finite element modelling of the bridge
4.1. Preliminaries
In spite of the large number of reported works concerning themodelling of truss bridges, the conceptualization of a model capableof integrating the several structural subsystems still poses a greatchallenge [15]. A strong structural engineering expertise and an accu-rate definition of the structure geometry in the as-is state are a goodstarting point for constructing any numerical model. However, itsphysical completeness requires a thorough and complete simulationof the: material behaviour; boundary and continuity conditions; stiff-ness distribution and structural connectivity; key mechanisms of ex-ternal and intrinsic loading; and displacement kinematics [16]. Onthe other hand, the designed model must take into account severalfactors, such as the objectives to be accomplished, the quality, quanti-ty and characteristics of field data available for validation and/or cali-bration, adopted analysis software and relative weight of the modelresolution versus computational effort [17]. Ultimately, for the vastma-jority of tested bridges a deterministic physics-based 3Dmodel can pro-vide a reliable estimate of the structure response by assuming linearelastic behaviour under stationary loads [15].
4.2. General features
Themodel developed for the analysis of the Pinhão Bridge replicatesa single main span. It utilizes a 3D mixed meso-micro level modelling
Fig. 6. Sections and points of the north sp
approach by means of frame and shell finite elements, having allnodes six degrees-of-freedom (DOF). For the sake of clarity, a frameelement represents a bar with six internal forces, which are the axialforce, torsion, two shear forces and two bending moments about twoperpendicular axes. The shear deformations of the frame elementswere taken into account. A shell element simulates simultaneouslythe slab and plate actions of a thin two-dimensional structural element.The numbers of the constructed model are as follows: 53,460 DOFs,4090 frame FEs and 6220 shell FEs. The general aspect of the modelcan be seen in Fig. 8.
4.3. Modelling strategy
The in-plane and out-of-plane deformations of the deck slab aremodelled through four node rectangular shell elements, positionedat its mid-height. Fig. 9 illustrates the discretization of the floor sys-tem cross-section for both pre and post-rehabilitation conditions.
The diagonals and verticals in the main girders, as well as the brac-ing system and transverse sway trusses, are simulated by frame ele-ments. For these structural elements the stress field is mainly ruledby the axial force. The flexural bending is only a result of the rigidconnections at their end nodes. In what concerns the crossbeamsand stringers of the floor system, the modelling is carried out usingtwo different approaches. All I-beams whose strains had been gaugedin the field tests are simulated using with four node rectangular shellelements in the webs (see Fig. 9) and frame elements in the flanges(angles and plate), while the remaining elements of the steel gridare simulated by frame elements.
This same principle was adopted in modelling the girders'U-chords. However, in this case all the flat plates of the composedsection are represented by shell elements and only the angles aremodelled by frame elements. Hence, in the two central panels thechords are simulated through a combination of frame and shell ele-ments, whereas in the other panels only frame elements are adopted.The bottom view of the model near a lower girder joint, where theI-type and U-type members are shown, is depicted in Fig. 10. Fig. 11
an monitored during the field tests.
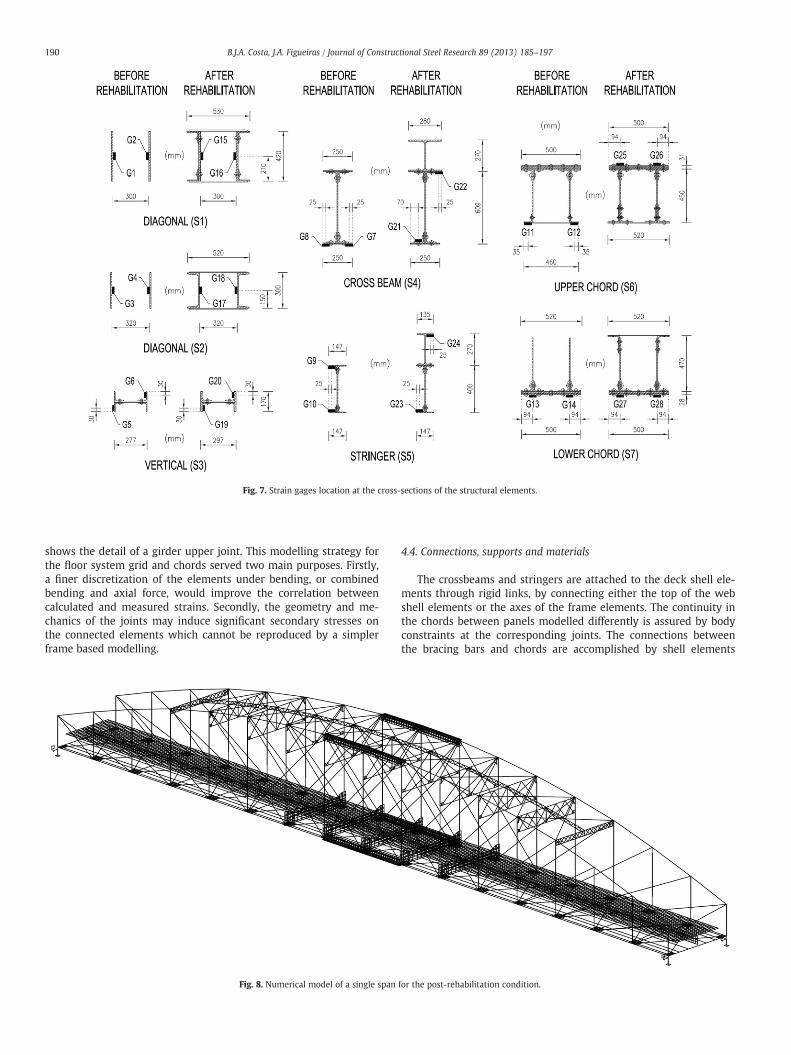
Fig. 7. Strain gages location at the cross-sections of the structural elements.
190 B.J.A. Costa, J.A. Figueiras / Journal of Constructional Steel Research 89 (2013) 185–197
shows the detail of a girder upper joint. This modelling strategy forthe floor system grid and chords served two main purposes. Firstly,a finer discretization of the elements under bending, or combinedbending and axial force, would improve the correlation betweencalculated and measured strains. Secondly, the geometry and me-chanics of the joints may induce significant secondary stresses onthe connected elements which cannot be reproduced by a simplerframe based modelling.
Fig. 8. Numerical model of a single span
4.4. Connections, supports and materials
The crossbeams and stringers are attached to the deck shell ele-ments through rigid links, by connecting either the top of the webshell elements or the axes of the frame elements. The continuity inthe chords between panels modelled differently is assured by bodyconstraints at the corresponding joints. The connections betweenthe bracing bars and chords are accomplished by shell elements
for the post-rehabilitation condition.
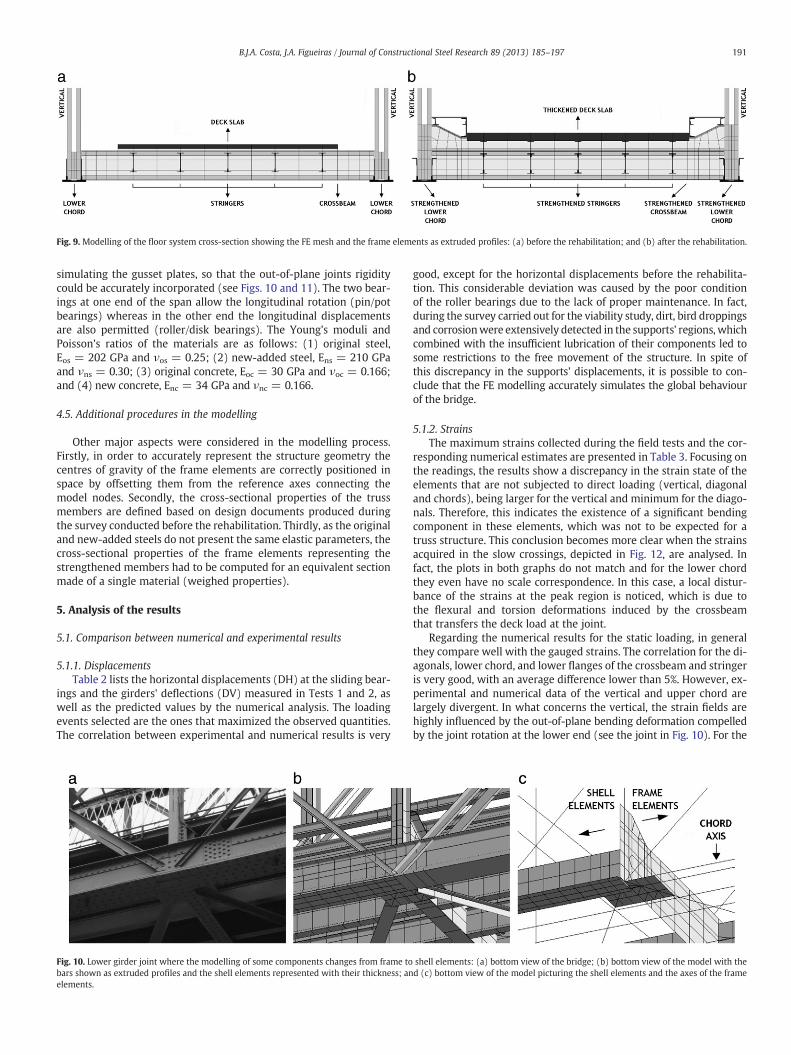
Fig. 9. Modelling of the floor system cross-section showing the FE mesh and the frame elements as extruded profiles: (a) before the rehabilitation; and (b) after the rehabilitation.
191B.J.A. Costa, J.A. Figueiras / Journal of Constructional Steel Research 89 (2013) 185–197
simulating the gusset plates, so that the out-of-plane joints rigiditycould be accurately incorporated (see Figs. 10 and 11). The two bear-ings at one end of the span allow the longitudinal rotation (pin/potbearings) whereas in the other end the longitudinal displacementsare also permitted (roller/disk bearings). The Young's moduli andPoisson's ratios of the materials are as follows: (1) original steel,Eos = 202 GPa and νos = 0.25; (2) new-added steel, Ens = 210 GPaand νns = 0.30; (3) original concrete, Eoc = 30 GPa and νoc = 0.166;and (4) new concrete, Enc = 34 GPa and νnc = 0.166.
4.5. Additional procedures in the modelling
Other major aspects were considered in the modelling process.Firstly, in order to accurately represent the structure geometry thecentres of gravity of the frame elements are correctly positioned inspace by offsetting them from the reference axes connecting themodel nodes. Secondly, the cross-sectional properties of the trussmembers are defined based on design documents produced duringthe survey conducted before the rehabilitation. Thirdly, as the originaland new-added steels do not present the same elastic parameters, thecross-sectional properties of the frame elements representing thestrengthened members had to be computed for an equivalent sectionmade of a single material (weighed properties).
5. Analysis of the results
5.1. Comparison between numerical and experimental results
5.1.1. DisplacementsTable 2 lists the horizontal displacements (DH) at the sliding bear-
ings and the girders' deflections (DV) measured in Tests 1 and 2, aswell as the predicted values by the numerical analysis. The loadingevents selected are the ones that maximized the observed quantities.The correlation between experimental and numerical results is very
Fig. 10. Lower girder joint where the modelling of some components changes from frame tobars shown as extruded profiles and the shell elements represented with their thickness; anelements.
good, except for the horizontal displacements before the rehabilita-tion. This considerable deviation was caused by the poor conditionof the roller bearings due to the lack of proper maintenance. In fact,during the survey carried out for the viability study, dirt, bird droppingsand corrosionwere extensively detected in the supports' regions, whichcombined with the insufficient lubrication of their components led tosome restrictions to the free movement of the structure. In spite ofthis discrepancy in the supports' displacements, it is possible to con-clude that the FE modelling accurately simulates the global behaviourof the bridge.
5.1.2. StrainsThe maximum strains collected during the field tests and the cor-
responding numerical estimates are presented in Table 3. Focusing onthe readings, the results show a discrepancy in the strain state of theelements that are not subjected to direct loading (vertical, diagonaland chords), being larger for the vertical and minimum for the diago-nals. Therefore, this indicates the existence of a significant bendingcomponent in these elements, which was not to be expected for atruss structure. This conclusion becomes more clear when the strainsacquired in the slow crossings, depicted in Fig. 12, are analysed. Infact, the plots in both graphs do not match and for the lower chordthey even have no scale correspondence. In this case, a local distur-bance of the strains at the peak region is noticed, which is due tothe flexural and torsion deformations induced by the crossbeamthat transfers the deck load at the joint.
Regarding the numerical results for the static loading, in generalthey compare well with the gauged strains. The correlation for the di-agonals, lower chord, and lower flanges of the crossbeam and stringeris very good, with an average difference lower than 5%. However, ex-perimental and numerical data of the vertical and upper chord arelargely divergent. In what concerns the vertical, the strain fields arehighly influenced by the out-of-plane bending deformation compelledby the joint rotation at the lower end (see the joint in Fig. 10). For the
shell elements: (a) bottom view of the bridge; (b) bottom view of the model with thed (c) bottom view of the model picturing the shell elements and the axes of the frame
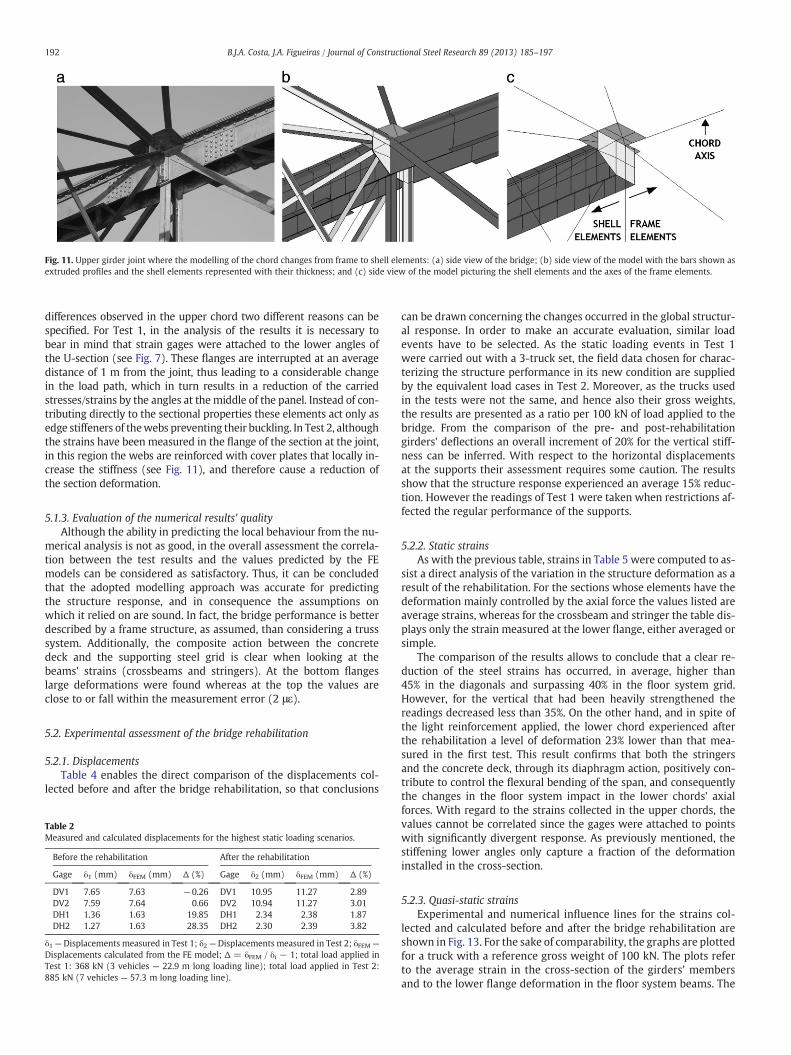
Fig. 11. Upper girder joint where the modelling of the chord changes from frame to shell elements: (a) side view of the bridge; (b) side view of the model with the bars shown asextruded profiles and the shell elements represented with their thickness; and (c) side view of the model picturing the shell elements and the axes of the frame elements.
192 B.J.A. Costa, J.A. Figueiras / Journal of Constructional Steel Research 89 (2013) 185–197
differences observed in the upper chord two different reasons can bespecified. For Test 1, in the analysis of the results it is necessary tobear in mind that strain gages were attached to the lower angles ofthe U-section (see Fig. 7). These flanges are interrupted at an averagedistance of 1 m from the joint, thus leading to a considerable changein the load path, which in turn results in a reduction of the carriedstresses/strains by the angles at themiddle of the panel. Instead of con-tributing directly to the sectional properties these elements act only asedge stiffeners of thewebs preventing their buckling. In Test 2, althoughthe strains have been measured in the flange of the section at the joint,in this region the webs are reinforced with cover plates that locally in-crease the stiffness (see Fig. 11), and therefore cause a reduction ofthe section deformation.
5.1.3. Evaluation of the numerical results' qualityAlthough the ability in predicting the local behaviour from the nu-
merical analysis is not as good, in the overall assessment the correla-tion between the test results and the values predicted by the FEmodels can be considered as satisfactory. Thus, it can be concludedthat the adopted modelling approach was accurate for predictingthe structure response, and in consequence the assumptions onwhich it relied on are sound. In fact, the bridge performance is betterdescribed by a frame structure, as assumed, than considering a trusssystem. Additionally, the composite action between the concretedeck and the supporting steel grid is clear when looking at thebeams' strains (crossbeams and stringers). At the bottom flangeslarge deformations were found whereas at the top the values areclose to or fall within the measurement error (2 με).
5.2. Experimental assessment of the bridge rehabilitation
5.2.1. DisplacementsTable 4 enables the direct comparison of the displacements col-
lected before and after the bridge rehabilitation, so that conclusions
Table 2Measured and calculated displacements for the highest static loading scenarios.
Before the rehabilitation After the rehabilitation
Gage δ1 (mm) δFEM (mm) Δ (%) Gage δ2 (mm) δFEM (mm) Δ (%)
DV1 7.65 7.63 −0.26 DV1 10.95 11.27 2.89DV2 7.59 7.64 0.66 DV2 10.94 11.27 3.01DH1 1.36 1.63 19.85 DH1 2.34 2.38 1.87DH2 1.27 1.63 28.35 DH2 2.30 2.39 3.82
δ1 — Displacements measured in Test 1; δ2 — Displacements measured in Test 2; δFEM —
Displacements calculated from the FE model; Δ = δFEM / δi − 1; total load applied inTest 1: 368 kN (3 vehicles — 22.9 m long loading line); total load applied in Test 2:885 kN (7 vehicles — 57.3 m long loading line).
can be drawn concerning the changes occurred in the global structur-al response. In order to make an accurate evaluation, similar loadevents have to be selected. As the static loading events in Test 1were carried out with a 3-truck set, the field data chosen for charac-terizing the structure performance in its new condition are suppliedby the equivalent load cases in Test 2. Moreover, as the trucks usedin the tests were not the same, and hence also their gross weights,the results are presented as a ratio per 100 kN of load applied to thebridge. From the comparison of the pre- and post-rehabilitationgirders' deflections an overall increment of 20% for the vertical stiff-ness can be inferred. With respect to the horizontal displacementsat the supports their assessment requires some caution. The resultsshow that the structure response experienced an average 15% reduc-tion. However the readings of Test 1 were taken when restrictions af-fected the regular performance of the supports.
5.2.2. Static strainsAs with the previous table, strains in Table 5 were computed to as-
sist a direct analysis of the variation in the structure deformation as aresult of the rehabilitation. For the sections whose elements have thedeformation mainly controlled by the axial force the values listed areaverage strains, whereas for the crossbeam and stringer the table dis-plays only the strain measured at the lower flange, either averaged orsimple.
The comparison of the results allows to conclude that a clear re-duction of the steel strains has occurred, in average, higher than45% in the diagonals and surpassing 40% in the floor system grid.However, for the vertical that had been heavily strengthened thereadings decreased less than 35%. On the other hand, and in spite ofthe light reinforcement applied, the lower chord experienced afterthe rehabilitation a level of deformation 23% lower than that mea-sured in the first test. This result confirms that both the stringersand the concrete deck, through its diaphragm action, positively con-tribute to control the flexural bending of the span, and consequentlythe changes in the floor system impact in the lower chords' axialforces. With regard to the strains collected in the upper chords, thevalues cannot be correlated since the gages were attached to pointswith significantly divergent response. As previously mentioned, thestiffening lower angles only capture a fraction of the deformationinstalled in the cross-section.
5.2.3. Quasi-static strainsExperimental and numerical influence lines for the strains col-
lected and calculated before and after the bridge rehabilitation areshown in Fig. 13. For the sake of comparability, the graphs are plottedfor a truck with a reference gross weight of 100 kN. The plots referto the average strain in the cross-section of the girders' membersand to the lower flange deformation in the floor system beams. The
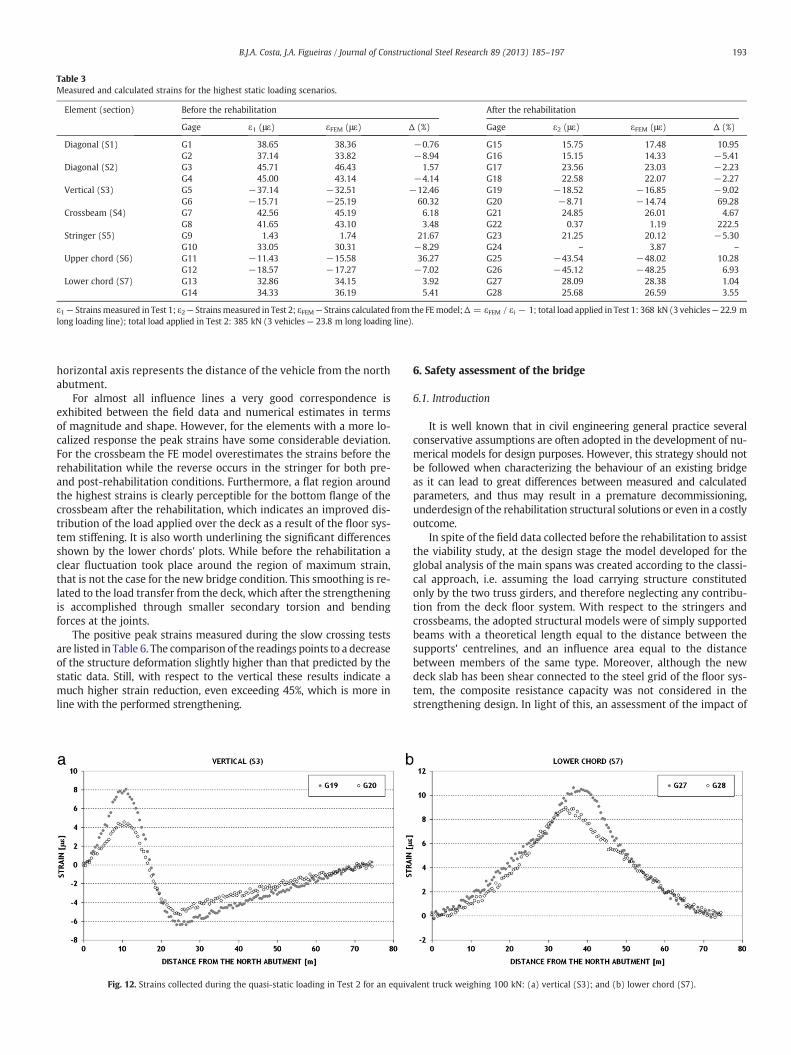
Table 3Measured and calculated strains for the highest static loading scenarios.
Element (section) Before the rehabilitation After the rehabilitation
Gage ε1 (με) εFEM (με) Δ (%) Gage ε2 (με) εFEM (με) Δ (%)
Diagonal (S1) G1 38.65 38.36 −0.76 G15 15.75 17.48 10.95G2 37.14 33.82 −8.94 G16 15.15 14.33 −5.41
Diagonal (S2) G3 45.71 46.43 1.57 G17 23.56 23.03 −2.23G4 45.00 43.14 −4.14 G18 22.58 22.07 −2.27
Vertical (S3) G5 −37.14 −32.51 −12.46 G19 −18.52 −16.85 −9.02G6 −15.71 −25.19 60.32 G20 −8.71 −14.74 69.28
Crossbeam (S4) G7 42.56 45.19 6.18 G21 24.85 26.01 4.67G8 41.65 43.10 3.48 G22 0.37 1.19 222.5
Stringer (S5) G9 1.43 1.74 21.67 G23 21.25 20.12 −5.30G10 33.05 30.31 −8.29 G24 – 3.87 –
Upper chord (S6) G11 −11.43 −15.58 36.27 G25 −43.54 −48.02 10.28G12 −18.57 −17.27 −7.02 G26 −45.12 −48.25 6.93
Lower chord (S7) G13 32.86 34.15 3.92 G27 28.09 28.38 1.04G14 34.33 36.19 5.41 G28 25.68 26.59 3.55
ε1 — Strainsmeasured in Test 1; ε2— Strainsmeasured in Test 2; εFEM— Strains calculated from the FEmodel;Δ = εFEM / εi − 1; total load applied in Test 1: 368 kN (3 vehicles— 22.9 mlong loading line); total load applied in Test 2: 385 kN (3 vehicles— 23.8 m long loading line).
193B.J.A. Costa, J.A. Figueiras / Journal of Constructional Steel Research 89 (2013) 185–197
horizontal axis represents the distance of the vehicle from the northabutment.
For almost all influence lines a very good correspondence isexhibited between the field data and numerical estimates in termsof magnitude and shape. However, for the elements with a more lo-calized response the peak strains have some considerable deviation.For the crossbeam the FE model overestimates the strains before therehabilitation while the reverse occurs in the stringer for both pre-and post-rehabilitation conditions. Furthermore, a flat region aroundthe highest strains is clearly perceptible for the bottom flange of thecrossbeam after the rehabilitation, which indicates an improved dis-tribution of the load applied over the deck as a result of the floor sys-tem stiffening. It is also worth underlining the significant differencesshown by the lower chords' plots. While before the rehabilitation aclear fluctuation took place around the region of maximum strain,that is not the case for the new bridge condition. This smoothing is re-lated to the load transfer from the deck, which after the strengtheningis accomplished through smaller secondary torsion and bendingforces at the joints.
The positive peak strains measured during the slow crossing testsare listed in Table 6. The comparison of the readings points to a decreaseof the structure deformation slightly higher than that predicted by thestatic data. Still, with respect to the vertical these results indicate amuch higher strain reduction, even exceeding 45%, which is more inline with the performed strengthening.
Fig. 12. Strains collected during the quasi-static loading in Test 2 for an equiv
6. Safety assessment of the bridge
6.1. Introduction
It is well known that in civil engineering general practice severalconservative assumptions are often adopted in the development of nu-merical models for design purposes. However, this strategy should notbe followed when characterizing the behaviour of an existing bridgeas it can lead to great differences between measured and calculatedparameters, and thus may result in a premature decommissioning,underdesign of the rehabilitation structural solutions or even in a costlyoutcome.
In spite of the field data collected before the rehabilitation to assistthe viability study, at the design stage the model developed for theglobal analysis of the main spans was created according to the classi-cal approach, i.e. assuming the load carrying structure constitutedonly by the two truss girders, and therefore neglecting any contribu-tion from the deck floor system. With respect to the stringers andcrossbeams, the adopted structural models were of simply supportedbeams with a theoretical length equal to the distance between thesupports' centrelines, and an influence area equal to the distancebetween members of the same type. Moreover, although the newdeck slab has been shear connected to the steel grid of the floor sys-tem, the composite resistance capacity was not considered in thestrengthening design. In light of this, an assessment of the impact of
alent truck weighing 100 kN: (a) vertical (S3); and (b) lower chord (S7).
Table 4Displacements measured for comparable static loading scenarios.
Sensor Before the rehabilitation After the rehabilitation
δ1 (mm) δ2 (mm) Δ (%)
DV1 2.08 1.64 −21.28DV2 2.06 1.65 −19.78DH1 0.37 0.30 −18.13DH2 0.34 0.30 −12.81
δ1 — Displacements in Test 1 per 100 kN of applied load; δ2 — Displacements in Test 2per 100 kN of applied load; Δ = δ2 / δ1 − 1; total load applied in Test 1: 368 kN(3 vehicles — 22.9 m long loading line); total load applied in Test 2: 385 kN (3 vehicles —23.8 m long loading line).
194 B.J.A. Costa, J.A. Figueiras / Journal of Constructional Steel Research 89 (2013) 185–197
such decisions on the adequacy and balance of the implementedstrengthening schemes becomes mandatory.
6.2. Ultimate and serviceability limit states
The design value of steel tensile strength, σrd, was experimentallyobtained with coupons extracted from the bridge. The design value ofsteel compressive strength took into account the buckling phenome-non on each structural element. Except for crossbeams and stringers,the bridge members are subjected to predominant axial forces andminor bending moments. Therefore, the compressive strength wasestimated by multiplying the tensile strength by a reduction factor,which translates the ratio between the buckling resistance of themember and its tensile capacity, both calculated as established bythe specifications in EN 1993 [18].
The design value of the applied normal stress, σEd, was computedthrough the following expression
σEd ¼ γg· σdl1 þ σdl2 þ σdl3 þ σdl4ð Þ þ γq·σ ll ð1Þ
where γg (1.35) and γq (1.5) are the partial factors for permanent andvariable actions, respectively, adopted according to EN 1990 [19], σdli
is the normal stress generated by the dead load in the i-th construc-tion stage, estimated with a suitable numerical model; and σll is thenormal stress caused by the live load. For checking the ultimatelimit state two base models representative of the bridge in its pre-and post-rehabilitation conditions, designated respectively as ModelA and Model B, were considered, whose characteristics have beenpresented in Section 4. In order to account for the progress of therehabilitation works in the permanent stress fields, four additionalmodels were idealized, which will be referred to as Model 1, 2, 3and 4, described as follows: Model 1 — Model A with the concretedeck removed and the self-weight of the steel structure as the onlyacting load; Model 2 – is the Model 1 holding just the dead loadof the floor system strengthening; Model 3 — includes all the
Table 5Strains measured for comparable static loading scenarios.
Element (section) Before the rehabilitation After the rehabilitation
ε1 (με) ε2 (με) Δ (%)
Diagonal (S1) 7.79 4.02 −48.42Diagonal (S2) 10.34 6.00 −41.99Vertical (S3) −5.30 −3.54 −33.24Crossbeam (S4) 11.44 6.46 −43.50Stringer (S5) 8.98 5.53 −38.45Lower chord (S7) 9.12 6.99 −23.34
ε1 — Strains in Test 1 per 100 kN of applied load; ε2 — Strains in Test 2 per 100 kN ofapplied load; Δ = ε2 / ε1 − 1; total load applied in Test 1: 368 kN (3 vehicles — 22.9 mlong loading line); total load applied in Test 2: 385 kN (3 vehicles — 23.8 m longloading line).
contributions of the strengthening and replaced bars to the stiffnessupgrade and the applied load is the self-weight of the new concretedeck and steel sidewalks; and Model 4 — the stiffness of the concretedeck is added to Model 3 and the dead load of the asphalt layer andparapets is accounted for. The estimate of the permanent stresses isobtained by adding the contributions of Models 1 to 4. Althoughthis strategy is not the most accurate, it constitutes, however, agood approach since the construction method used to build thebridge is not completely known. The normal stresses caused by thelive load are estimated by Model B. Given that the rehabilitation pro-ject was developed assuming the actions for a class II bridgeestablished by the Portuguese national code [20], the analysis wascarried out with two traffic load models: (i) a lane uniformly distrib-uted load of 3 kN/m2 combined with a single transverse linear load of30 kN/m located at the most unfavourable position; and (ii) a stan-dard vehicle with 3 axles equally spaced (1.5 m) holding each one a100 kN load.
Table 7 shows the maximum normal stresses produced by theaxial forces and bending moments acting in the most strained bridgeelements of each type, as well as the tensile and compressive strengthof steel considered in the calculation of the safety factors. These fac-tors were calculated as the ratio of the steel strength to the maximumstress in the critical section, either tensile or compressive. The esti-mated values are listed in the two right-hand columns of the table,the first concerning the safety factors predicted with the field validat-ed model and the second listing the values obtained from the rehabil-itation design. The results allow to draw important conclusions.Firstly, and the most important, the critical elements are the upperchords, for which the ultimate limit state is not verified by a largeamount. The problem is further compounded by the fact that these el-ements are prone to buckling and/or control the overall stability ofthe structure. Secondly, except for the upper chords and the diagonalsin compression, all the remaining elements have an increase of thesafety factors in relation to the estimates at the design stage, particu-larly the floor system grid for which the values more than doubledand had been considered critical in the viability study. Thirdly, it is in-teresting to note the large discrepancy between the safety factors ofthe upper and lower chords computed with the validated model. Atthe design stage these values had been predicted close to one,which indicates an overestimation of the stresses for the lower chordscoupled with an underestimation in the upper chords by the designmodel.
These results were mainly caused by the use of simplified modelsin the design stage. The increase of the upper chords' stresses is dueto the fact that the arm of the compression forces in relation to thedeck cross-section centroid is much longer in the 3D validatedmodel than in the design model (close to half-height of the bridgedeck), which largely surpasses the increment of the deck bendingstiffness. On the contrary, the shorter arm of the tension forcesleads to smaller stresses in the lower chords. As regards the crossbeamsand stringers, the composite action provided by the concrete slabin the validated model induces a large reduction of the live loadstresses.
With respect to the serviceability limit states the maximum bridgedeflection was checked for the characteristic combination of actions.The maximum vertical displacement was calculated with the validatedmodel as being 67.80 mm, corresponding to a span to displacementratio of 1020, significantly larger than the standard limit of 800, andabove the design value of 910 [12].
6.3. Fatigue limit state
A fatigue assessment was also accomplished based on the dataprovided by the field validated numerical model and laboratory fa-tigue testing. Test results on coupons sampled from the bridge re-vealed that the S–N curves corresponding to the detail category D of
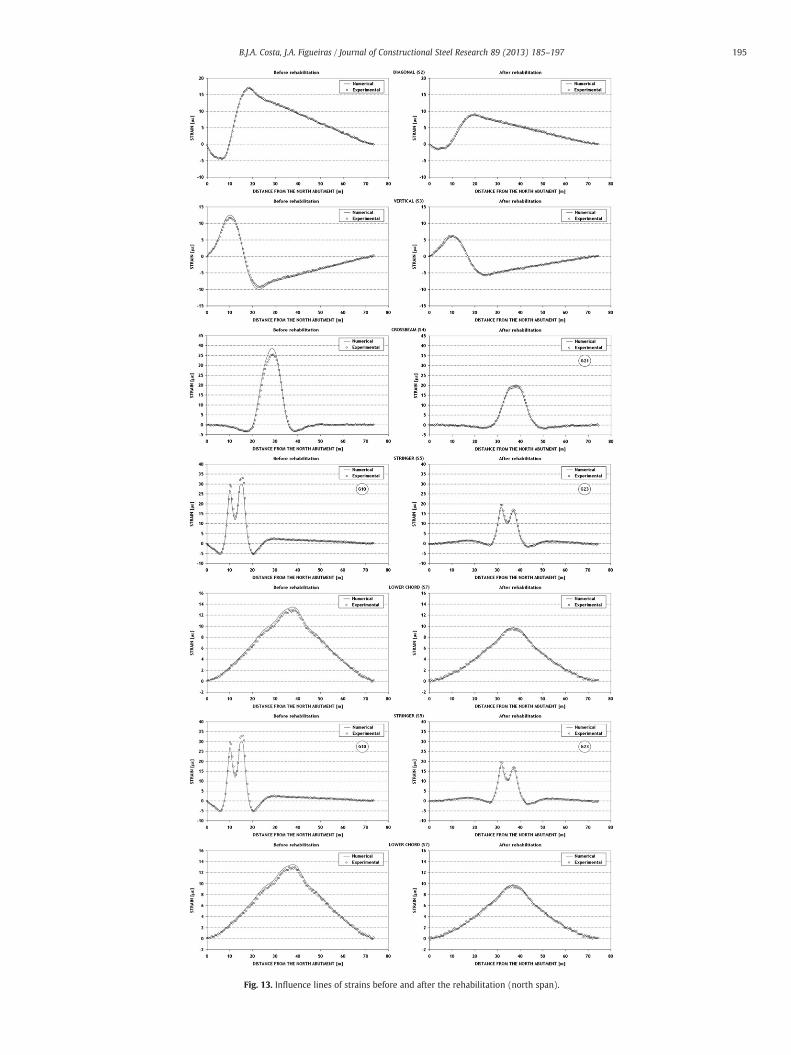
Fig. 13. Influence lines of strains before and after the rehabilitation (north span).
195B.J.A. Costa, J.A. Figueiras / Journal of Constructional Steel Research 89 (2013) 185–197
Table 6Peak strains for the measured influence lines.
Element (section) Before the rehabilitation After the rehabilitation
ε1 (με) ε2 (με) Δ (%)
Diagonal (S1) 13.27 6.64 −50.00Diagonal (S2) 17.13 9.16 −46.52Vertical (S3) 11.70 6.21 −46.97Crossbeam (S4) 35.43 19.87 −43.93Stringer (S5) 32.96 19.50 −40.84Lower chord (S7) 13.00 9.73 −25.14
ε1 — Strains in Test 1 per 100 kN of applied load; ε2 — Strains in Test 2 per 100 kN ofapplied load; Δ = ε2 / ε1 − 1.
Table 8Numerical maximum stress ranges.
Element Δσ1 (MPa) Δσ2 (MPa) R
Diagonals 34.27 52.1 1.52Verticals 33.70 64.7 1.92Stringers 22.48 53 2.36Crossbeams 20.92 66.6 3.18Lower chords 25.57 51 1.99Upper chords 44.14 52.6 1.19
Δσ1 — Data from the validated model; Δσ2 — Data from the designmodel; R = Δσ2/Δσ1.
196 B.J.A. Costa, J.A. Figueiras / Journal of Constructional Steel Research 89 (2013) 185–197
the AASHTO specifications [21] and to the detail category 71 of the EN1993 [18] could be conservatively adopted [22]. As the rehabilitationdesign aimed at extending the bridge service life for at least 30 years,traffic data made available by the bridge owner was used to estimatethe number of heavy vehicles that would cross the bridge in that pe-riod, which was found to be approximately 1 million. Therefore, thefatigue resistance of 1 million cycles at a constant stress range couldbe taken as 89.67 MPa [22]. However, to account for a likely traffic in-crease the fatigue resistance was considered to be 71.17 MPa for2 million cycles. The fatigue limit state was checked by comparingthis limiting stress range with the maximum variation predicted foreach critical element from the numerical analysis carried out withthe traffic loads of the Portuguese national code [20]. The results,Δσ1, are shown in Table 8, as well as the values reported in the design,Δσ2. All the stress ranges are far below the safety threshold and conse-quently fatigue related problems are not expected. In addition, thedesign stress ranges were overestimated between 19% for theupper chord and 218% for the crossbeams. Once more, the steelmembers that constitute the floor system are the ones presenting thehighest safety levels, for reasons that have already been pointed out.
6.4. Load rating
For the newoperation stage the traffic over the bridgewas restrictedto vehiclesweighing less than 30 ton, in direct correspondencewith thestandard vehicle stipulated by the Portuguese national code for bridgesof class II [20]. Therefore, load rating appears as the right tool to assessthe usefulness and validity of that decision. The rating factor (R.F.) ofeach element was computed based on the equation
R:F: ¼ σrd−γg·σdl
� �= γq·σSV
� �ð2Þ
where σdl+ is the stress induced by the dead load, σSV is the stress gen-erated by the standard vehicle, accounted the dynamic effects, andσrd is
Table 7Maximum normal stresses for the ultimate limit state.
Element σdl
(MPa)σll
(MPa)σEd
(MPa)σrd
(MPa)S. F.(1)
S. F.(2)
Diagonals (C) 24.50 6.89 43.42 67.78 1.56 2.13Diagonals (T) 81.31 22.55 143.60 172.50 1.20 1.02Verticals (C) 60.57 15.42 104.90 137.67 1.31 1.10Verticals (T) 35.34 17.13 73.41 172.50 2.35 1.34Stringers 27.80 16.99 63.01 172.50 2.74 1.38Crossbeams 19.07 15.45 48.92 172.50 3.53 1.28Lower chords (T) 70.10 25.06 132.22 172.50 1.30 1.02Upper chords (C) 101.89 42.40 201.15 167.82 0.83 0.99
(C)—Member in compression; (T)—Member in tension; (1)— Validated model; (2)—Design model.σdl = σdl1 + σdl2 + σdl3 + σdl4; S. F. = σrd/σsd.
either the tensile or compressive strength of steel. The rating factors aresummarized in Table 9. These results indicate that the bridge load carry-ing capacity is conditioned by the upper chords, confirming once againthese elements as critical. The rating is dangerously close to 1, thusmaking the posting limit compulsory. It is alsoworth noting that exceptfor the upper chords the bridge could carry more than twice the pre-scribed load limit.
7. Summary and conclusions
This paper presents a comprehensive study on a centenarythrough-truss deck steel bridge subjected to an extensive rehabilita-tion process. It included the execution of field testing before andafter the rehabilitation works were carried out. The bridge responsewas monitored under three different loading scenarios, namely static,dynamic and quasi-static (vehicles' slow crossings). The installed in-strumentation allowed the measurement of global quantities suchas deflections and horizontal displacements at the supports, as wellas the local deformation of several critical elements. Field data wereused to assess the actual pre-rehabilitation condition of the structure,to detect the changes introduced in the structure performance due tothe construction works and to determine the effectiveness of theapplied strengthening. Numerical analyses, based on 3D FE modelsdeveloped through a mixed element and detailed level modellingstrategy, helped to understand the force and deformation mecha-nisms controlling the bridge behaviour. The results have permittedto conclude the following: (1) given that the numerical estimatescompared well with the experimental results, presenting errors below5% for global quantities and less than 15% for local ones, it was verifiedthat the bridge response is well simulated as a 3D frame system; (2) thefloor system, both the steel grid and the concrete deck, undoubtedlycontributes for the global performance and impacts on the forces in-duced in the main truss girders; and (3) strengthening may be consid-ered effective in that the rehabilitation led to an increase of the globalvertical stiffness of the spans close to 20%, and to an average decreaseof the strains in the elements higher than 40%, yet only reaching 25%in the lower chords.
A safety and serviceability assessment was performed for the newoperation phase of the bridge. The findings brought some light re-garding the balance and adequacy of the strengthening. Firstly,according to the design loads the ultimate limit state for normal
Table 9Computed rating factors.
Element σdl (MPa) σSV (MPa) σrd (MPa) R. F.
Diagonals (C) 17.43 10.55 67.78 2.79Diagonals (T) 81.31 11.87 172.50 3.52Verticals (C) 60.57 7.03 137.67 5.30Verticals (T) 23.41 20.58 172.50 4.56Stringers 27.80 20.79 172.50 4.33Crossbeams 19.07 19.92 172.50 4.91Lower chords (T) 70.10 12.54 172.50 4.14Upper chords (C) 101.89 20.67 170.36 1.06
(C) — Member in compression; (T) — Member in tension.
197B.J.A. Costa, J.A. Figueiras / Journal of Constructional Steel Research 89 (2013) 185–197
stresses cannot be verified for the upper chords, consequentlypointing these members as the weak points of the structure. Thisproblem is evenmore serious in view of the fact that the upper chordscontrol the global stability of the bridge spans. Secondly, all theremaining bridge members were found to have a large safety margin,particularly the ones pertaining to the floor system, for which thesafety factors more than doubled in this study. Thirdly, by neglectingthe contribution of the floor system in the global model of the bridgeadopted at the design stage the stresses in the upper chords wereunderestimated in opposition to their overestimation in the lowerchords, which has translated in an unbalanced rehabilitation design.The lower stiffness of the design model together with almost equalarms of the bending couple forces has produced estimates of inferiorquality for the design stresses in the girders' chords. With respect tothe design models used to predict the stresses in the members ofthe floor system, the non-accounting of the composite effect providedby the deck slab led to an overestimation of the stresses. Fourthly, thebridge live load carrying capacity is very close to the current postedlevel. However, if a judicious strengthening of the upper chordswould be accomplished in the future the traffic loads could be signif-icantly enlarged. Fifthly, fatigue poses no problem in the 30 years ofextended life span and the bridge deflection, another parameterthat was not specifically accounted for by the bridge designers atthe beginning of the 20th century, is well below the limit for contem-porary loadings. Sixthly, the strengthening schemes implemented inthe Pinhão Bridge have resulted in an underdesign for the upperchords coupled with an overdesign for the floor system grid. If inthe first case the outcome can be classified as unsafe, with respectto the second the result is not cost-efficient for the time span initiallyset in the rehabilitation project. However, provided that the upperchords are adequately restrengthened, either the lifespan of thebridge can be largely extended or the traffic loads significantly in-creased, which in turn may positively influence the economic impactof the project in the long-term.
Acknowledgements
The authors gratefully acknowledge the financial support provid-ed by the Portuguese Scientific Foundation (FCT-MCES) to the firstauthor through the grant with the reference SFRH/BD/13138/2003.The authors would also like to thank the bridge owner EP — Estradasde Portugal, E.P.E. for their assistance and cooperation. Finally, thewriters are grateful for the information provided by the designer ofthe rehabilitation project GEG — Gabinete de Estruturas e Geotecnia.
References
[1] Ghosh U, Ghoshal A. Experiences in rehabilitation of steel bridges. Struct Eng Int2002;4:269–72.
[2] Kääriäinen J, Pulkkinen P. Rehabilitation of Tornionjoki steel truss bridge, Finland.Struct Eng Int 2002;4:273–5.
[3] Holzinger H, Jeschko A, Robra J, Ramberger G. Strengthening of an old arch trussbridge, Austria. Struct Eng Int 2002;4:273–80.
[4] Lopes NT, Ribeiro D, Reis A. Upgrading of the LUIZ I Bridge in Porto: design forfatigue resistance under new traffic demands. Proceedings of the Seventh In-ternational Conference on Steel Bridges, Guimarães, Portugal; July 4-6, 2008.p. II469–78.
[5] Chajes MJ, Mertz DR, Commander B. Experimental load rating of a posted bridge.J Bridge Eng 1997;2(1):1–10.
[6] Chakraborty S, DeWolf JT. Development and implementation of a continuousstrain monitoring system on a multi-girder composite steel bridge. J Bridge Eng2006;11(6):753–62.
[7] Bancila R, Cristescu C. Rehabilitation of steel bridges in Romania. J Constr Steel Res1998;46(1):73–5.
[8] O'Connell HM, Dexter RJ. Response and analysis of steel trusses for fatigue truckloading. J Bridge Eng 2001;6(6):628–38.
[9] Allen BJ, Rens KL. Condition assessment of the eastbound 6th Avenue viaductusing strain gauges. J Perform Constr Facil 2004;18(4):205–12.
[10] Fu CC, AlAyed H, Amde AM, Robert J. Field performance of the fiber-reinforcedpolymer deck of a truss bridge. J Perform Constr Facil 2006;21(1):53–60.
[11] Rodrigues C, Cavadas F, Félix C, Figueiras JA. Assessment of the structural behaviourof a centenary double-deck steel bridge via a FBGmonitoring system. Proceedings ofthe Fourth European Workshop on Structural Health Monitoring, Cracow, Poland;July 2-4, 2008.
[12] Pinto JV. Metallic bridge of Pinhão — inspection and execution of the rehabilita-tion study. Structural Design - Descriptive Document. Porto, Portugal: GEG —
Gabinete de Estruturas e Geotecnia; 2005 [in Portuguese].[13] Costa BJA. Structural identification of old steel bridges: monitoring and rehabilita-
tion assessment. [PhD Thesis] , Porto, Portugal: Faculty of Engineering of the Uni-versity of Porto; 2012.
[14] Costa BJA, Félix C, Figueiras JA. Design and installation of an electric based moni-toring system applied to a centenary metallic bridge. Proceedings of the IVECCOMAS Thematic Conference on Smart Structures and Materials, Porto, Portu-gal; July 13-15, 2009.
[15] Catbas FN, Ciloglu SK, Hasancebi O, Grimmelsman K, Aktan AE. Limitations instructural identification of large constructed structures. J Struct Eng 2007;133(8):1051–66.
[16] Zhou YE. Assessment of bridge remaining fatigue life through field strain mea-surement. J Bridge Eng 2006;11(6):737–44.
[17] AktanE, CatbasN, Türer A, ZhangZ. Structural identification: analytical aspects. J StructEng 1998;124(7):817–29.
[18] Eurocode 3. Design of steel structures, Part 1-1. General rules and rules for buildings,EN 1993-1-1. Brussels, Belgium: European Committee of Standardization; 2005.
[19] Eurocode 0. Basis of structural design — prAnnex A2, EN 1990. Brussels, Belgium:European Committee of Standardization; 2003.
[20] RSAEEP. Code of safety and actions for buildings and bridges; 1983 [Dec.-Lein.º 235/83; 1983 in Portuguese].
[21] AASHTO. Guide specifications for fatigue evaluation of existing steel bridges,American Association of State Highway and Transportation Officials. Washington,D.C.: AASHTO; 1992.
[22] FigueiredoM, Jesus A, Pereira H, Ribeiro A, Natal R, Moreira P, et al. Structural integrityevaluation of the Pinhão Bridge. Technical report. Porto, Portugal: DEMEGI-FEUP; 2004[in Portuguese].
Recommended