Royal Dutch Shell plc June 7, 2016
Capital markets day 2016 Re-shaping Shell, to create a world-class investment case
“Let’s make the future”
Royal Dutch Shell | June 7, 2016
Royal Dutch Shell | June 7, 2016
Ben van Beurden Chief Executive Officer Royal Dutch Shell plc
Royal Dutch Shell | June 7, 2016 3
Definitions & cautionary note
Reserves: Our use of the term “reserves” in this presentation means SEC proved oil and gas reserves.
Resources: Our use of the term “resources” in this presentation includes quantities of oil and gas not yet classified as SEC proved oil and gas reserves. Resources are consistent with the Society of Petroleum Engineers (SPE) 2P + 2C definitions.
Resources and potential: Our use of the term “resources and potential” are consistent with SPE 2P + 2C + 2U definitions.
Organic: Our use of the term Organic includes SEC proved oil and gas reserves excluding changes resulting from acquisitions, divestments and year-average pricing impact.
Shales: Our use of the term ‘shales’ refers to tight, shale and coal bed methane oil and gas acreage.
The companies in which Royal Dutch Shell plc directly and indirectly owns investments are separate legal entities. In this release “Shell”, “Shell group” and “Royal Dutch Shell” are sometimes used for convenience where references are made to Royal Dutch Shell plc and its subsidiaries in general. Likewise, the words “we”, “us” and “our” are also used to refer to subsidiaries in general or to those who work for them. These expressions are also used where no useful purpose is served by identifying the particular company or companies. ‘‘Subsidiaries’’, “Shell subsidiaries” and “Shell companies” as used in this release refer to companies over which Royal Dutch Shell plc either directly or indirectly has control. Entities and unincorporated arrangements over which Shell has joint control are generally referred to as “joint ventures” and “joint operations” respectively. Entities over which Shell has significant influence but neither control nor joint control are referred to as “associates”. The term “Shell interest” is used for convenience to indicate the direct and/or indirect ownership interest held by Shell in a venture, partnership or company, after exclusion of all third-party interest.
This release contains forward-looking statements concerning the financial condition, results of operations and businesses of Royal Dutch Shell. All statements other than statements of historical fact are, or may be deemed to be, forward-looking statements. Forward-looking statements are statements of future expectations that are based on management’s current expectations and assumptions and involve known and unknown risks and uncertainties that could cause actual results, performance or events to differ materially from those expressed or implied in these statements. Forward-looking statements include, among other things, statements concerning the potential exposure of Royal Dutch Shell to market risks and statements expressing management’s expectations, beliefs, estimates, forecasts, projections and assumptions. These forward-looking statements are identified by their use of terms and phrases such as ‘‘anticipate’’, ‘‘believe’’, ‘‘could’’, ‘‘estimate’’, ‘‘expect’’, ‘‘goals’’, ‘‘intend’’, ‘‘may’’, ‘‘objectives’’, ‘‘outlook’’, ‘‘plan’’, ‘‘probably’’, ‘‘project’’, ‘‘risks’’, “schedule”, ‘‘seek’’, ‘‘should’’, ‘‘target’’, ‘‘will’’ and similar terms and phrases. There are a number of factors that could affect the future operations of Royal Dutch Shell and could cause those results to differ materially from those expressed in the forward-looking statements included in this release, including (without limitation): (a) price fluctuations in crude oil and natural gas; (b) changes in demand for Shell’s products; (c) currency fluctuations; (d) drilling and production results; (e) reserves estimates; (f) loss of market share and industry competition; (g) environmental and physical risks; (h) risks associated with the identification of suitable potential acquisition properties and targets, and successful negotiation and completion of such transactions; (i) the risk of doing business in developing countries and countries subject to international sanctions; (j) legislative, fiscal and regulatory developments including regulatory measures addressing climate change; (k) economic and financial market conditions in various countries and regions; (l) political risks, including the risks of expropriation and renegotiation of the terms of contracts with governmental entities, delays or advancements in the approval of projects and delays in the reimbursement for shared costs; and (m) changes in trading conditions. There can be no assurance that future dividend payments will match or exceed previous dividend payments. All forward-looking statements contained in this release are expressly qualified in their entirety by the cautionary statements contained or referred to in this section. Readers should not place undue reliance on forward-looking statements. Additional risk factors that may affect future results are contained in Royal Dutch Shell’s 20-F for the year ended December 31, 2015 (available at www.shell.com/investor and www.sec.gov ). These risk factors also expressly qualify all forward looking statements contained in this release and should be considered by the reader. Each forward-looking statement speaks only as of the date of this release, June 7, 2016. Neither Royal Dutch Shell plc nor any of its subsidiaries undertake any obligation to publicly update or revise any forward-looking statement as a result of new information, future events or other information. In light of these risks, results could differ materially from those stated, implied or inferred from the forward-looking statements contained in this release.
With respect to operating costs synergies indicated, such savings and efficiencies in procurement spend include economies of scale, specification standardisation and operating efficiencies across operating, capital and raw material cost areas.
We may have used certain terms, such as resources, in this release that United States Securities and Exchange Commission (SEC) strictly prohibits us from including in our filings with the SEC. U.S. Investors are urged to consider closely the disclosure in our Form 20-F, File No 1-32575, available on the SEC website www.sec.gov.
Royal Dutch Shell | June 7, 2016 4
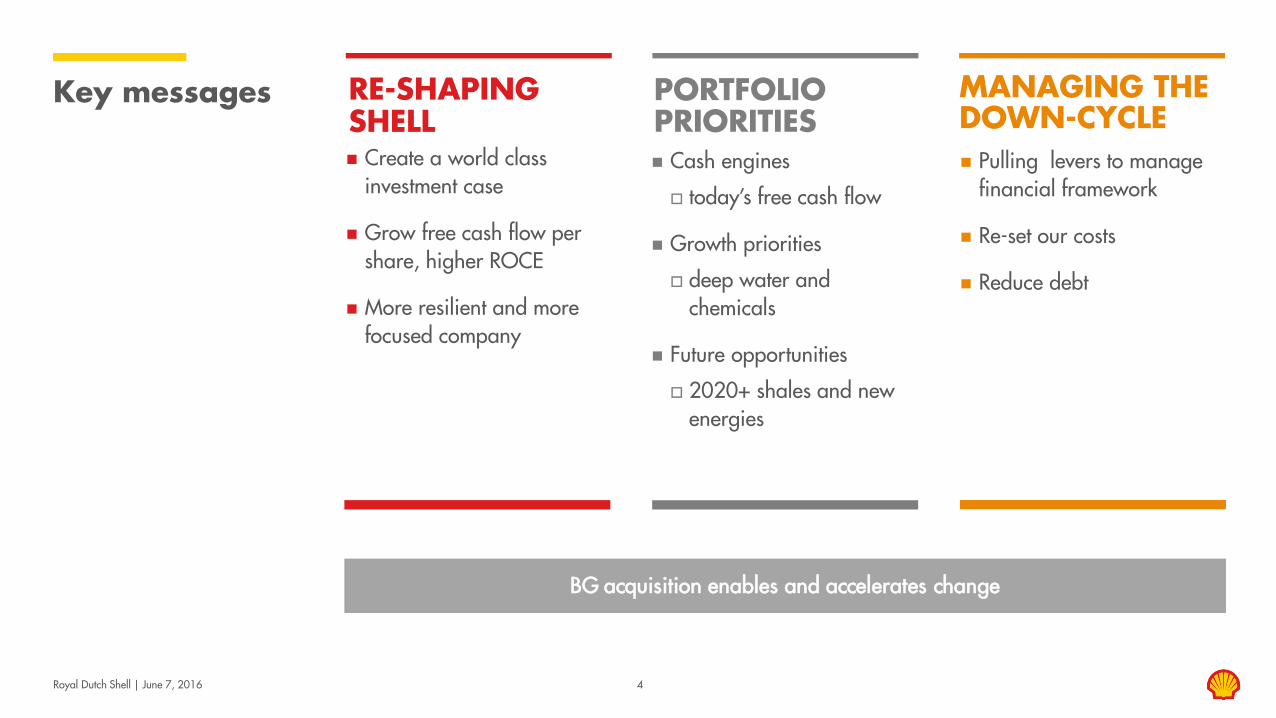
Key messages
Cash engines
today’s free cash flow
Growth priorities
deep water and chemicals
Future opportunities
2020+ shales and new energies
Create a world class investment case
Grow free cash flow per share, higher ROCE
More resilient and more focused company
RE-SHAPING SHELL
MANAGING THE DOWN-CYCLE
PORTFOLIO PRIORITIES
Pulling levers to manage financial framework
Re-set our costs
Reduce debt
BG acquisition enables and accelerates change
Royal Dutch Shell | June 7, 2016 5
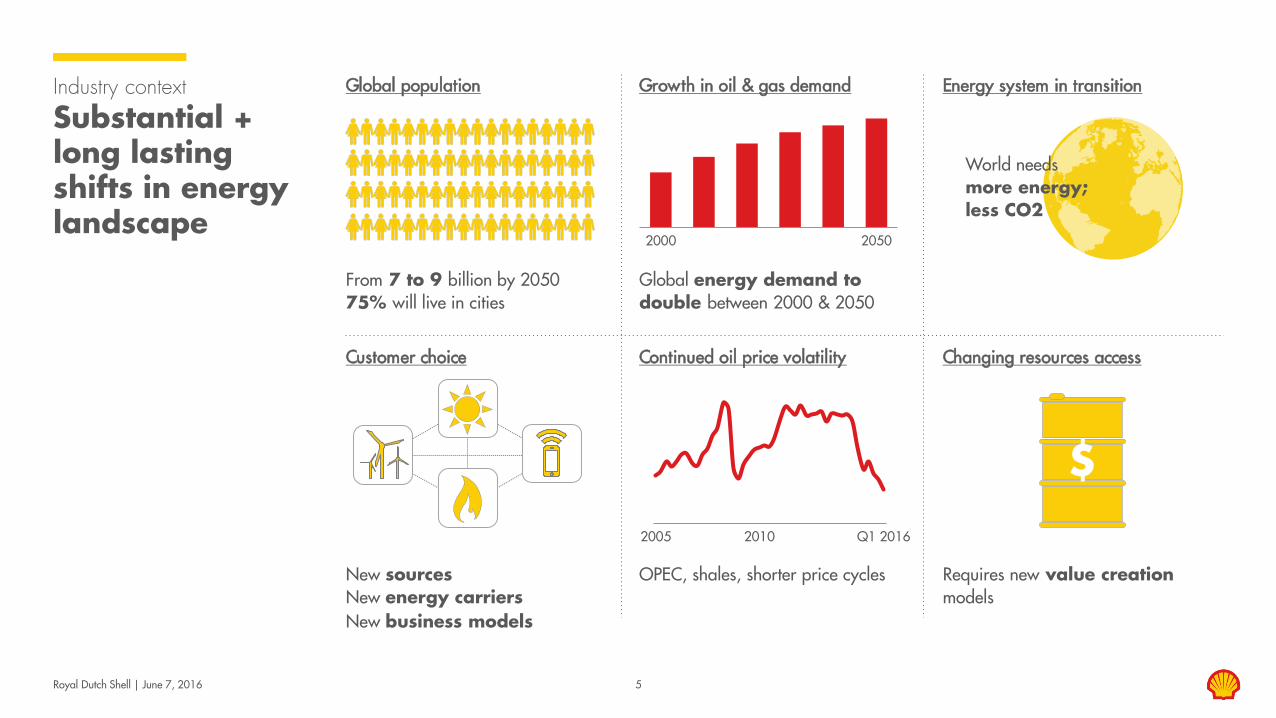
Industry context
Substantial + long lasting shifts in energy landscape
2005 2010 Q1 2016
2000 2050
$
From 7 to 9 billion by 2050 75% will live in cities
Global energy demand to double between 2000 & 2050
World needs more energy; less CO2
New sources New energy carriers New business models
OPEC, shales, shorter price cycles Requires new value creation models
Global population Growth in oil & gas demand Energy system in transition
Customer choice Continued oil price volatility Changing resources access
Royal Dutch Shell | June 7, 2016 6
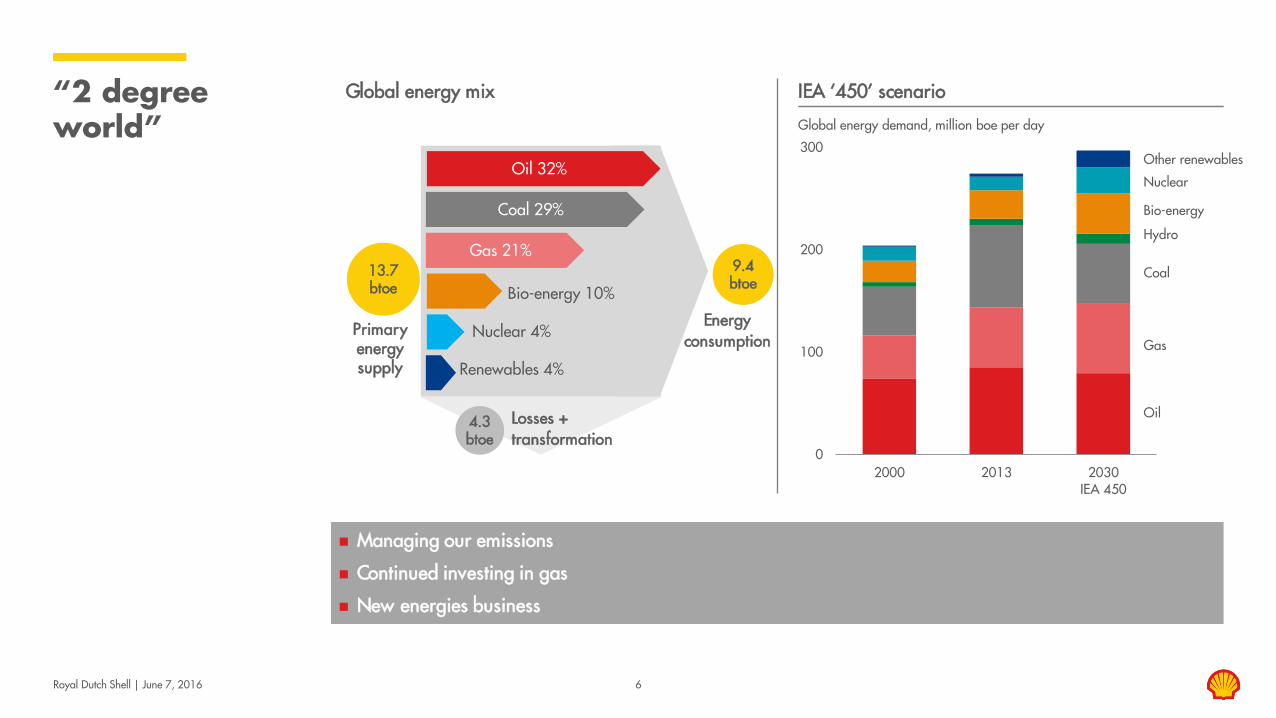
“2 degree world” Global energy demand, million boe per day
0
100
200
300
2000 2013 2030IEA 450
Global energy mix IEA ‘450’ scenario
Primary energy supply
Oil 32%
Coal 29%
Gas 21%
Renewables 4%
Nuclear 4%
13.7 btoe
Energy consumption
9.4 btoe
4.3 btoe
Losses + transformation
Bio-energy 10%
Managing our emissions
Continued investing in gas
New energies business
Gas
Oil
Nuclear
Coal
Bio-energy
Hydro
Other renewables
Royal Dutch Shell | June 7, 2016
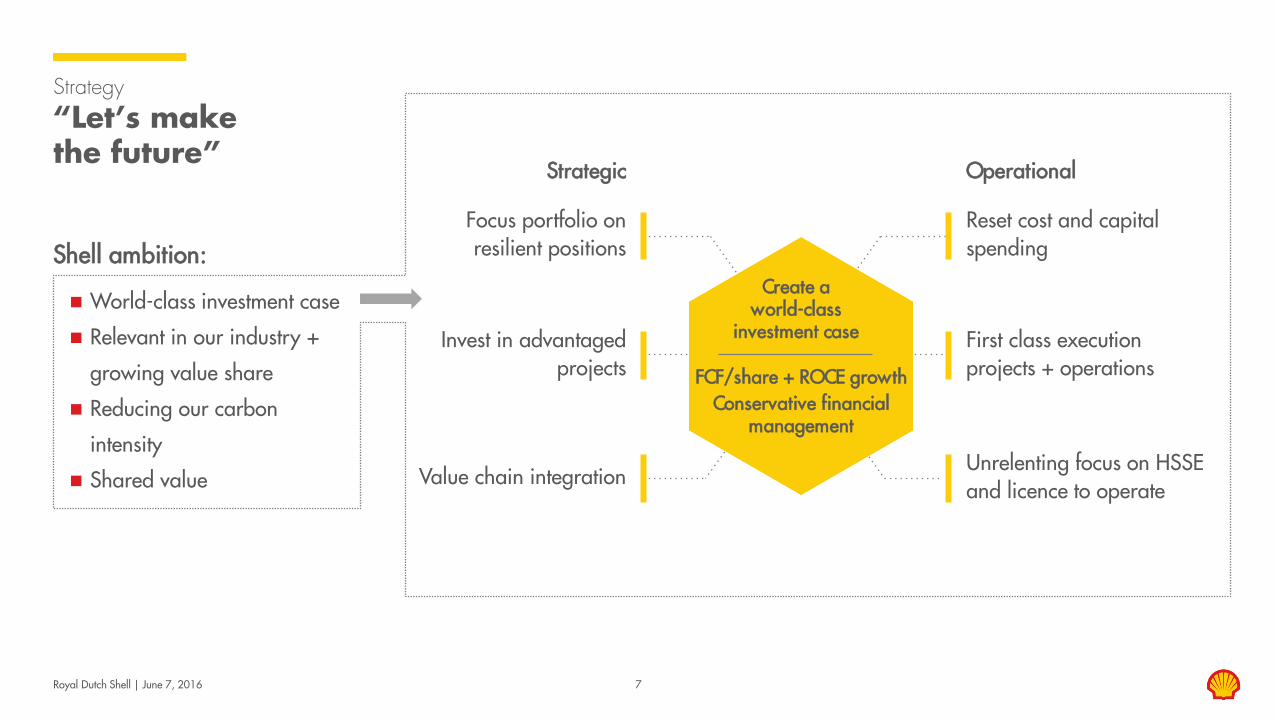
Strategy “Let’s make the future”
Focus portfolio on resilient positions
Invest in advantaged projects
Unrelenting focus on HSSE and licence to operate
Value chain integration
First class execution projects + operations
Reset cost and capital spending
Strategic Operational
FCF/share + ROCE growth Conservative financial
management
Create a world-class
investment case
7
Shell ambition:
World-class investment case
Relevant in our industry +
growing value share
Reducing our carbon
intensity
Shared value
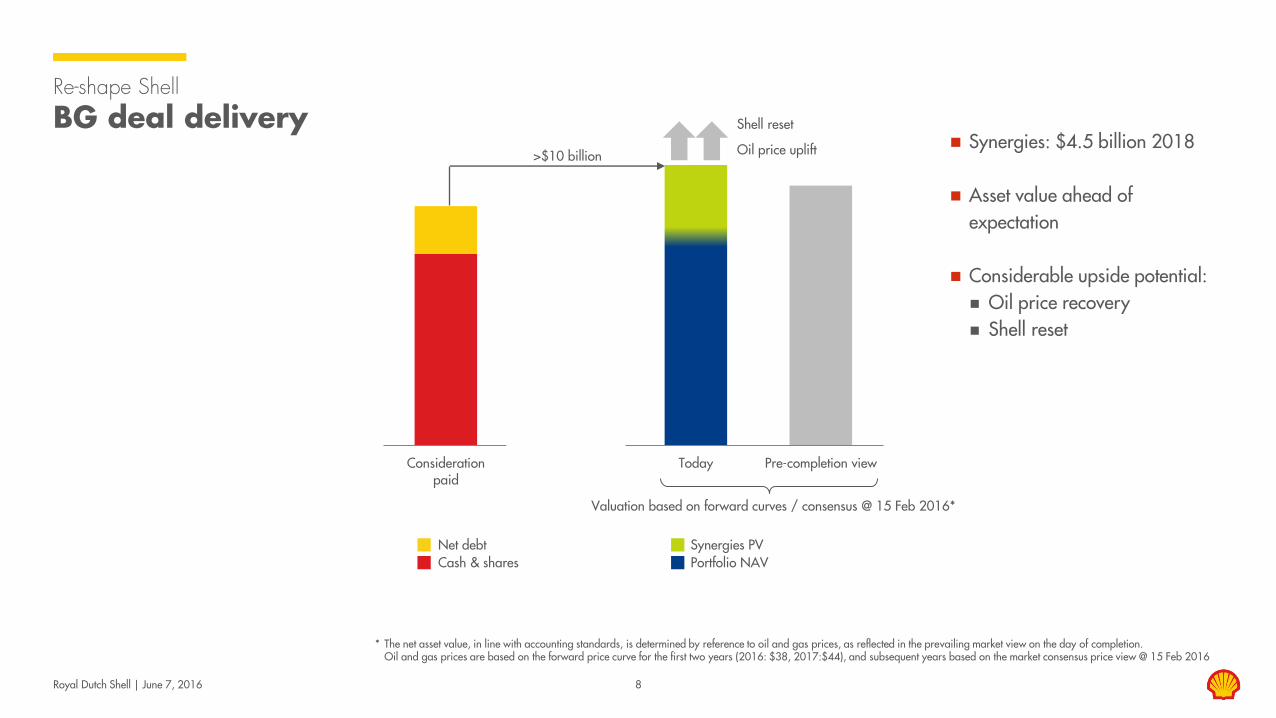
Considerationpaid
Today Pre-completion view
Royal Dutch Shell | June 7, 2016 8
Re-shape Shell BG deal delivery
* The net asset value, in line with accounting standards, is determined by reference to oil and gas prices, as reflected in the prevailing market view on the day of completion. Oil and gas prices are based on the forward price curve for the first two years (2016: $38, 2017:$44), and subsequent years based on the market consensus price view @ 15 Feb 2016
Synergies: $4.5 billion 2018 Asset value ahead of
expectation Considerable upside potential: Oil price recovery Shell reset
Cash & shares Net debt
Portfolio NAV Synergies PV
Valuation based on forward curves / consensus @ 15 Feb 2016*
Shell reset
Oil price uplift >$10 billion
Royal Dutch Shell | June 7, 2016 9
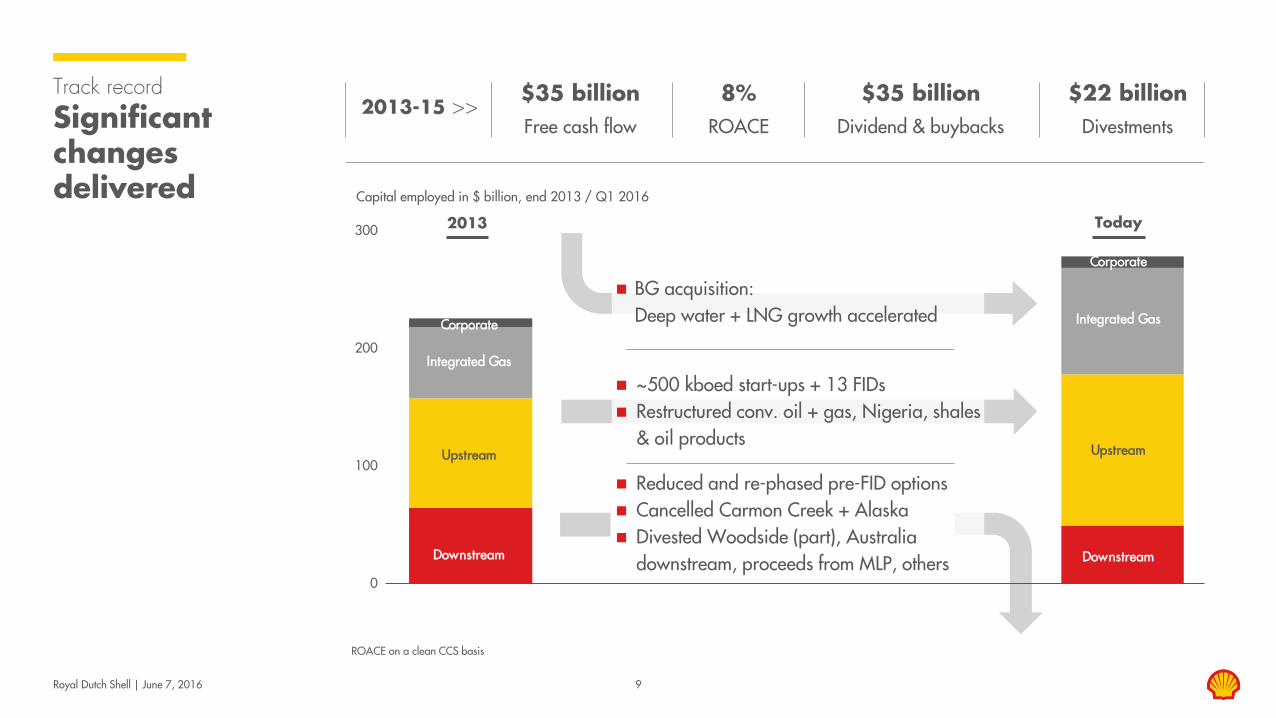
Track record
Significant changes delivered
ROACE on a clean CCS basis
0
100
200
300
Downstream
Upstream
Integrated Gas
Corporate
Downstream
Upstream
Integrated Gas
Corporate
$35 billion Free cash flow
8% ROACE
$35 billion Dividend & buybacks
$22 billion Divestments
2013-15 >>
2013 Today
Capital employed in $ billion, end 2013 / Q1 2016
BG acquisition: Deep water + LNG growth accelerated
Reduced and re-phased pre-FID options Cancelled Carmon Creek + Alaska Divested Woodside (part), Australia
downstream, proceeds from MLP, others
~500 kboed start-ups + 13 FIDs Restructured conv. oil + gas, Nigeria, shales
& oil products
Strong free cash flow and returns
Royal Dutch Shell | June 7, 2016
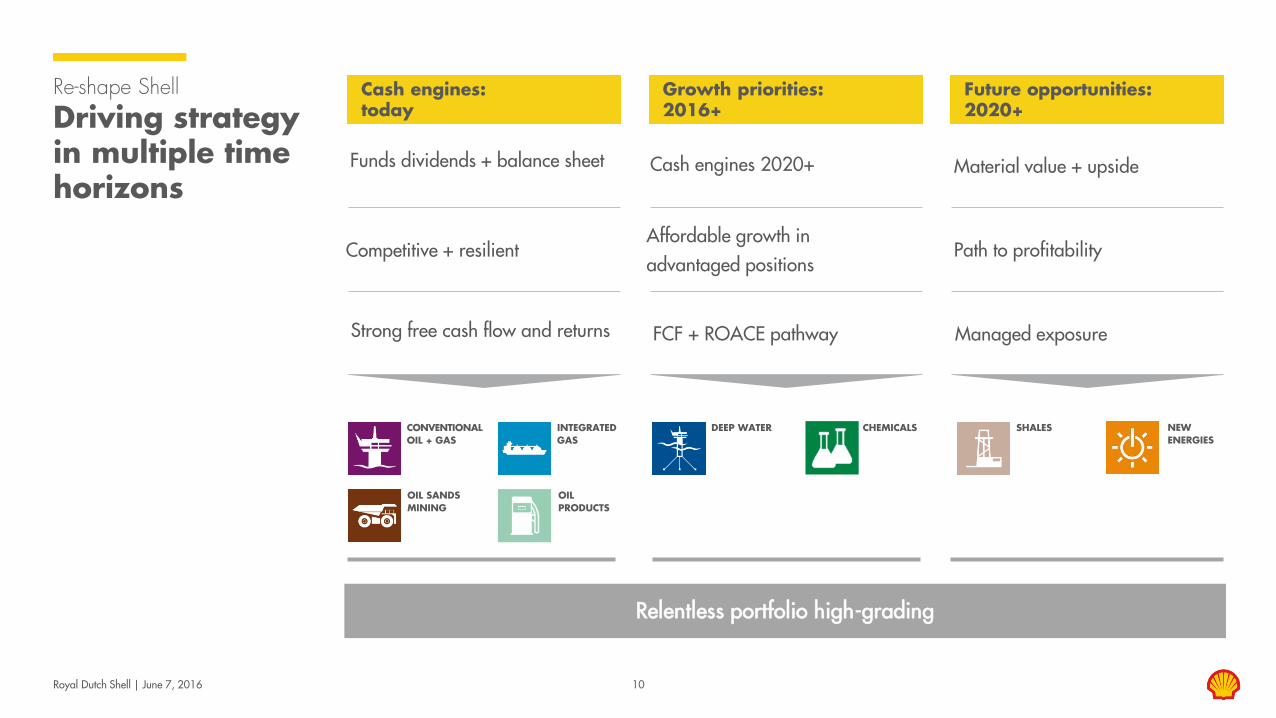
Re-shape Shell Driving strategy in multiple time horizons
CONVENTIONAL OIL + GAS
CHEMICALS
OIL PRODUCTS
DEEP WATER INTEGRATED GAS
OIL SANDS MINING
SHALES NEW ENERGIES
10
Cash engines: today
Growth priorities: 2016+
Future opportunities: 2020+
Competitive + resilient
Funds dividends + balance sheet
FCF + ROACE pathway
Affordable growth in advantaged positions
Material value + upside
Managed exposure
Path to profitability
Cash engines 2020+
Relentless portfolio high-grading
Royal Dutch Shell | June 7, 2016
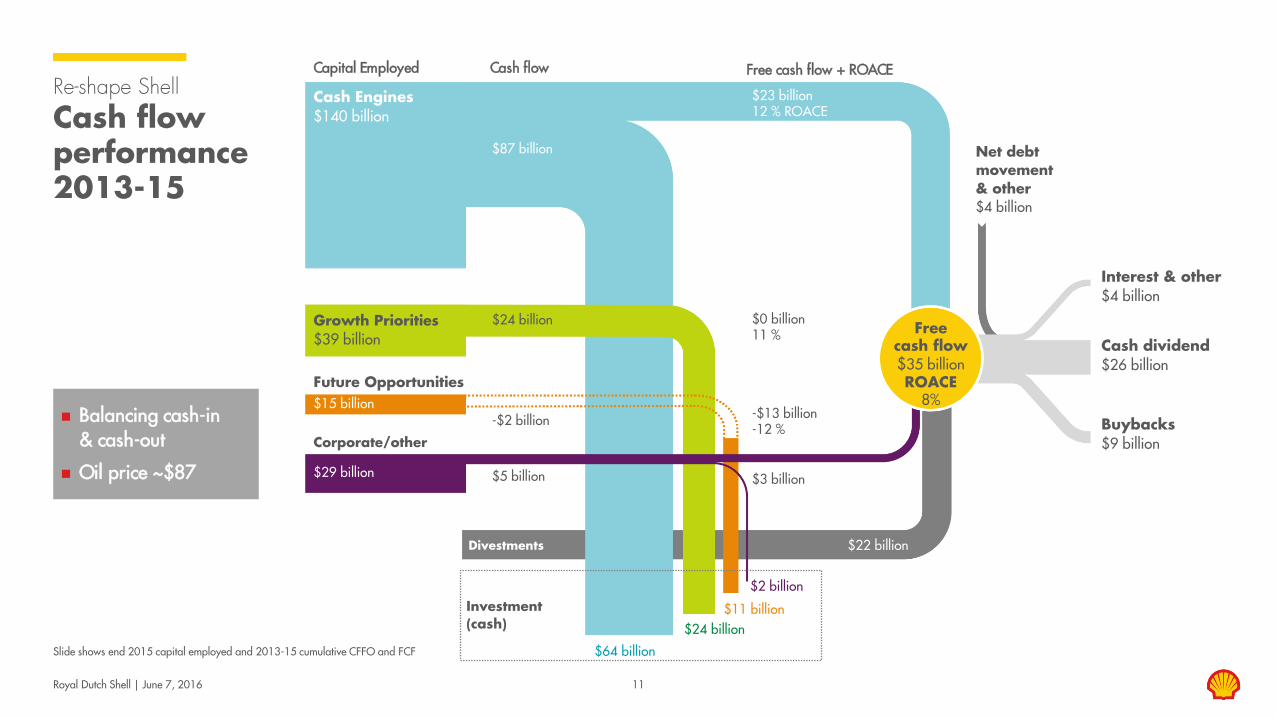
Re-shape Shell
Cash flow performance 2013-15
Free cash flow $35 billion ROACE
8%
Interest & other $4 billion
Cash dividend $26 billion
Buybacks $9 billion
Cash Engines $140 billion
Growth Priorities $39 billion
Future Opportunities $15 billion
Corporate/other
Divestments
Capital Employed Cash flow Free cash flow + ROACE
$87 billion
$23 billion 12 % ROACE
$24 billion $0 billion 11 %
-$2 billion
$64 billion
-$13 billion -12 %
$22 billion
$3 billion $5 billion
$24 billion $11 billion
$2 billion Investment (cash)
$29 billion
Net debt movement & other $4 billion
Balancing cash-in & cash-out
Oil price ~$87
11
Slide shows end 2015 capital employed and 2013-15 cumulative CFFO and FCF
Royal Dutch Shell | June 7, 2016 12
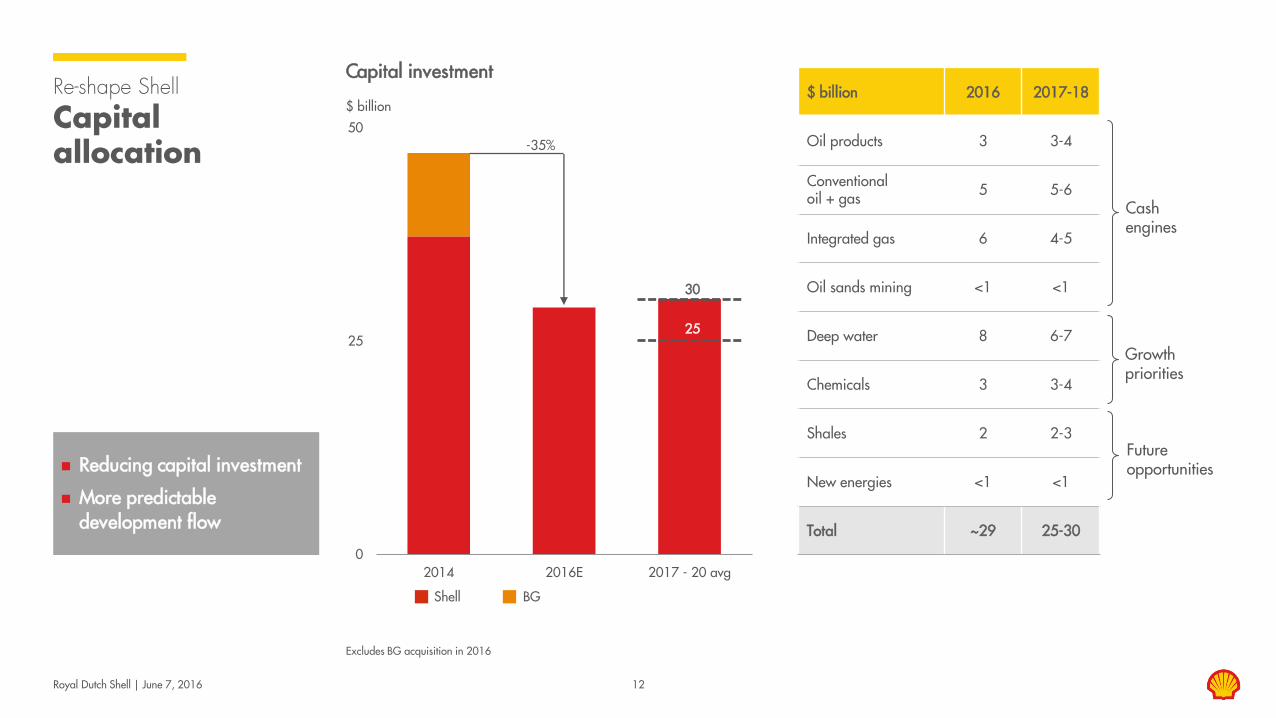
Re-shape Shell
Capital allocation
Excludes BG acquisition in 2016
0
25
50
2014 2016E 2017 - 20 avg
Reducing capital investment
More predictable development flow
Future opportunities
Growth priorities
Cash engines
$ billion
Capital investment
-35%
Shell BG
30
25
$ billion 2016 2017-18
Oil products 3 3-4
Conventional oil + gas 5 5-6
Integrated gas 6 4-5
Oil sands mining <1 <1
Deep water 8 6-7
Chemicals 3 3-4
Shales 2 2-3
New energies <1 <1
Total ~29 25-30
Royal Dutch Shell | June 7, 2016 13
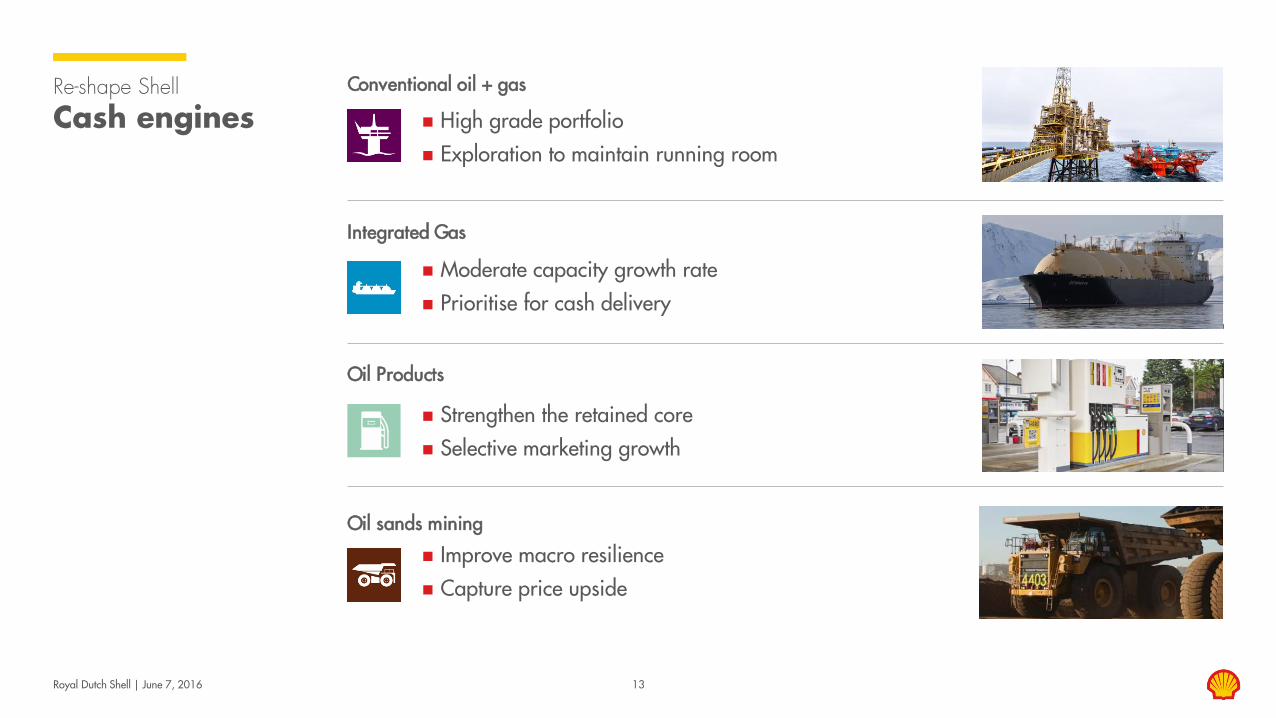
Re-shape Shell
Cash engines Conventional oil + gas
Integrated Gas
Oil Products
Oil sands mining
High grade portfolio
Exploration to maintain running room
Moderate capacity growth rate
Prioritise for cash delivery
Strengthen the retained core
Selective marketing growth
Improve macro resilience Capture price upside
Name
0
15
30
45
2000 2005 2010 2015
Royal Dutch Shell | June 7, 2016
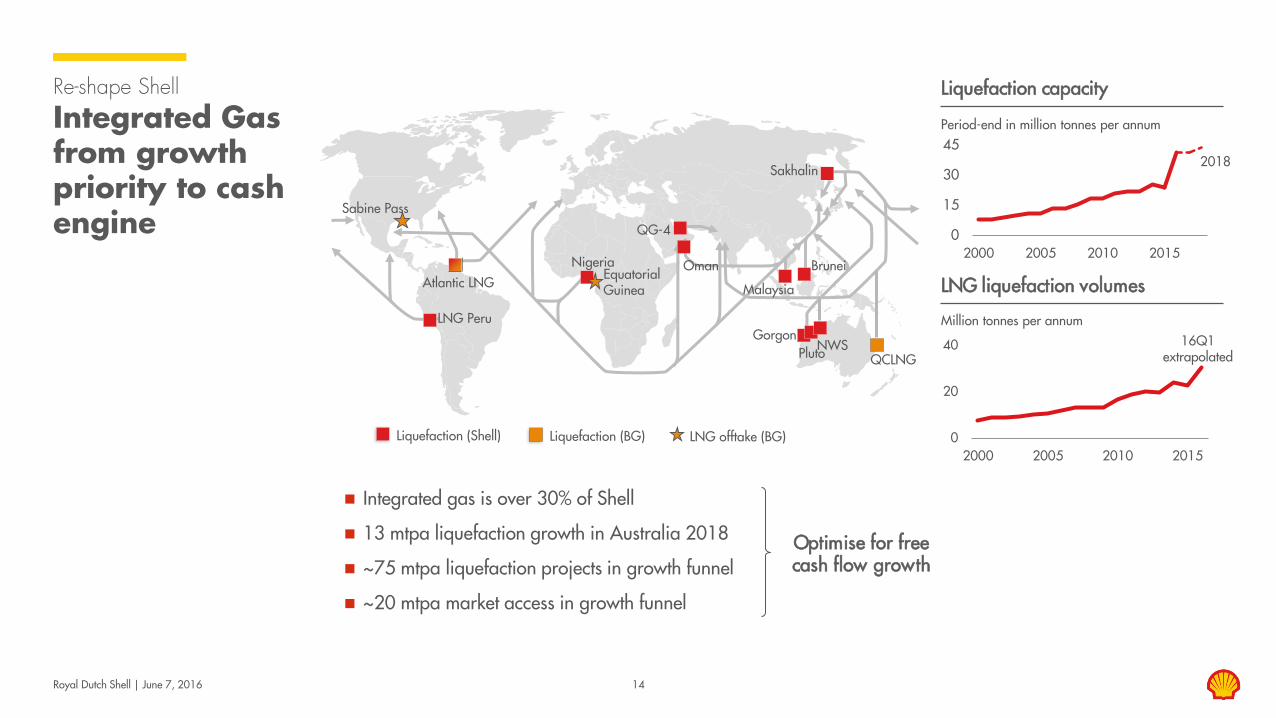
Re-shape Shell
Integrated Gas from growth priority to cash engine
Period-end in million tonnes per annum
Liquefaction capacity
Million tonnes per annum
LNG liquefaction volumes
0
20
40
2000 2005 2010 2015Liquefaction (Shell) LNG offtake (BG)
LNG Peru
Nigeria
QG-4
Atlantic LNG Oman
Sakhalin
Malaysia
Sabine Pass
Equatorial Guinea
Pluto NWS
Brunei
QCLNG
Gorgon
Integrated gas is over 30% of Shell
13 mtpa liquefaction growth in Australia 2018
~75 mtpa liquefaction projects in growth funnel
~20 mtpa market access in growth funnel
Optimise for free cash flow growth
16Q1 extrapolated
2018
14
Liquefaction (BG)
Royal Dutch Shell | June 7, 2016 15
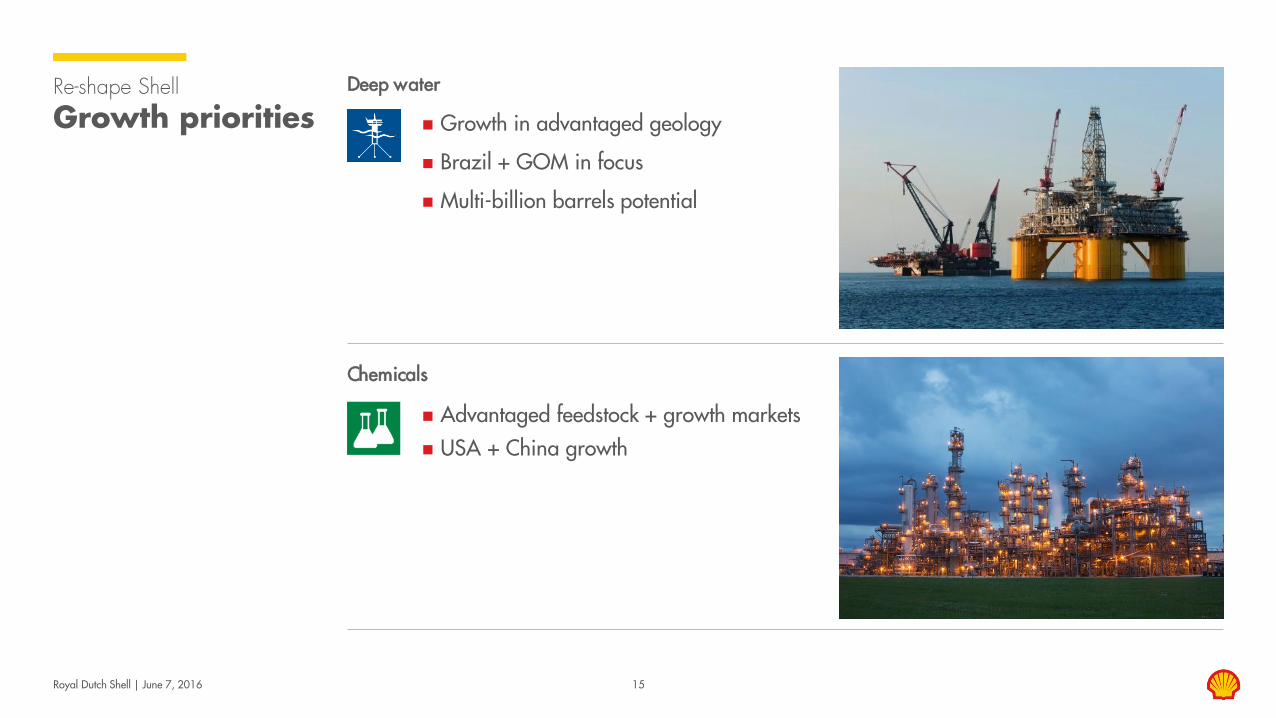
Re-shape Shell
Growth priorities Deep water
Chemicals
Growth in advantaged geology
Brazil + GOM in focus
Multi-billion barrels potential
Advantaged feedstock + growth markets
USA + China growth
Royal Dutch Shell | June 7, 2016 16
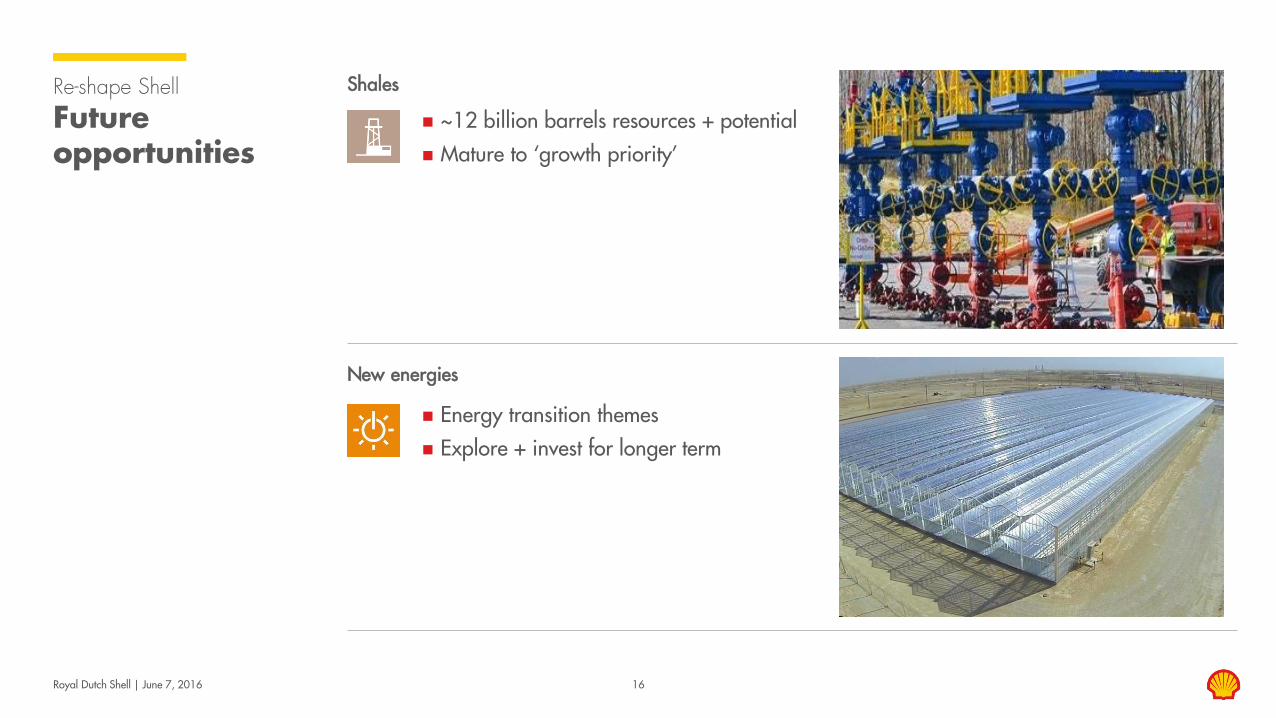
Re-shape Shell
Future opportunities
Shales
New energies
~12 billion barrels resources + potential
Mature to ‘growth priority’
Energy transition themes
Explore + invest for longer term
Royal Dutch Shell | June 7, 2016 17
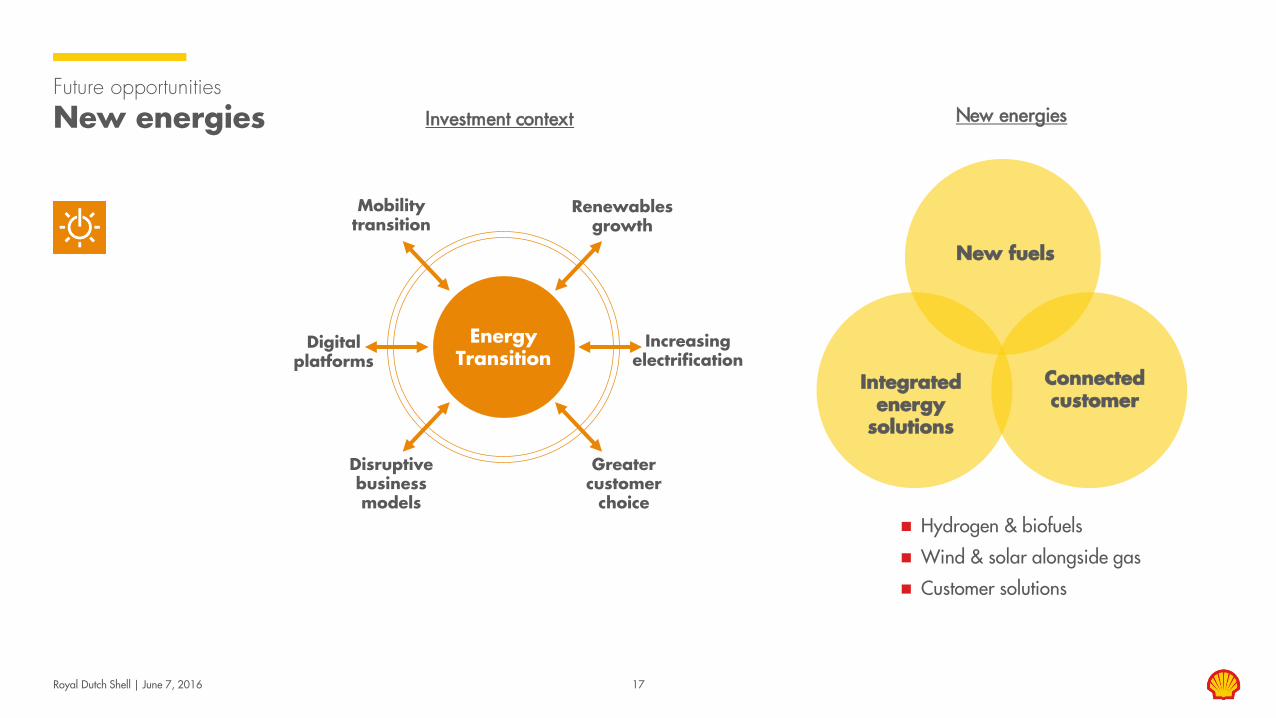
Future opportunities New energies
Hydrogen & biofuels
Wind & solar alongside gas
Customer solutions
New energies Investment context
Energy Transition
Digital platforms
Increasing electrification
Greater customer
choice
Renewables growth
Disruptive business models
Mobility transition
Integrated
energy solutions
New fuels
Connected customer
Simon Henry Chief Financial Officer Royal Dutch Shell plc
Royal Dutch Shell | June 7, 2016
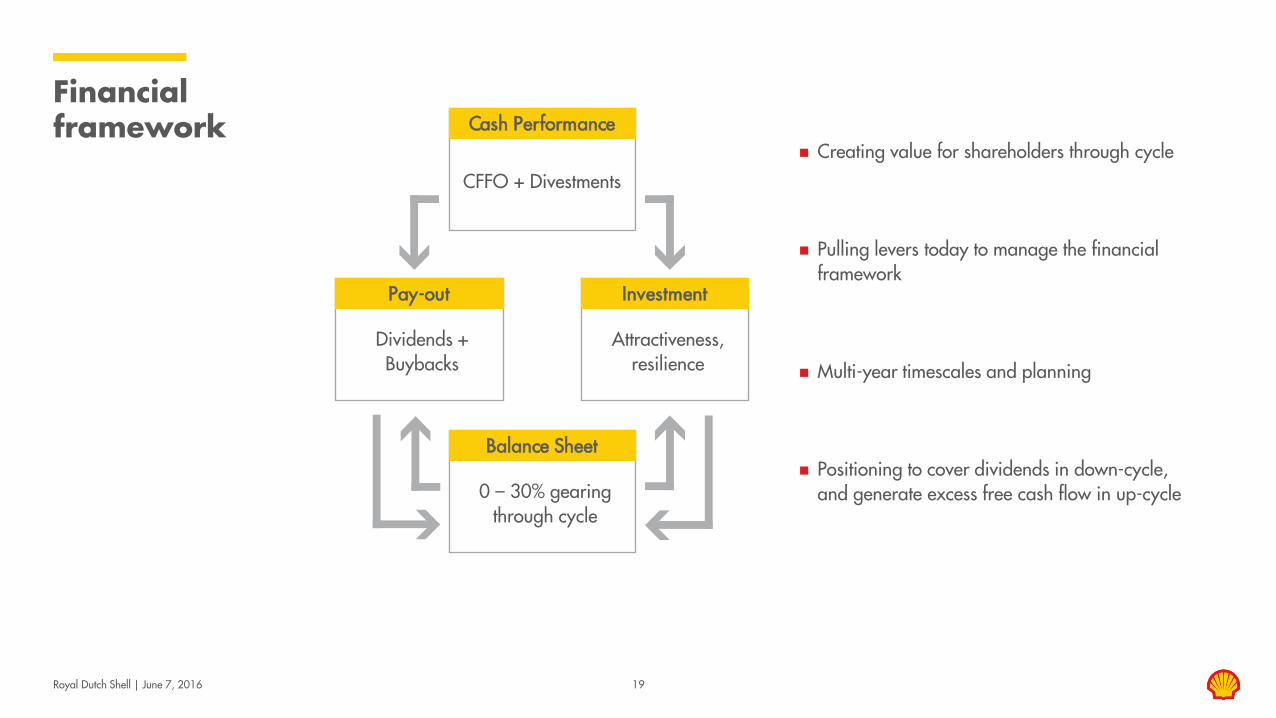
CFFO + Divestments
Attractiveness,
resilience
Dividends + Buybacks
0 – 30% gearing
through cycle
Royal Dutch Shell | June 7, 2016 19
Financial framework Cash Performance
Investment Pay-out
Balance Sheet
Creating value for shareholders through cycle
Pulling levers today to manage the financial framework
Multi-year timescales and planning
Positioning to cover dividends in down-cycle, and generate excess free cash flow in up-cycle
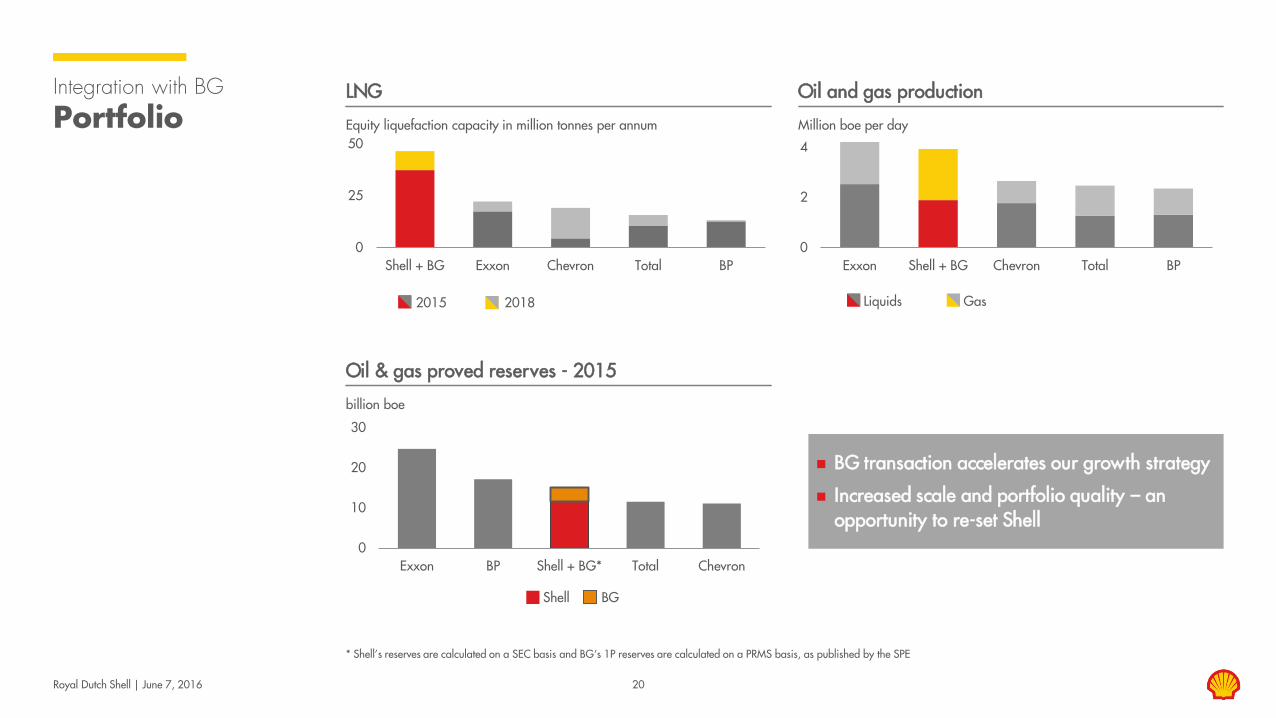
Royal Dutch Shell | June 7, 2016 20
Integration with BG
Portfolio
* Shell’s reserves are calculated on a SEC basis and BG‘s 1P reserves are calculated on a PRMS basis, as published by the SPE
Equity liquefaction capacity in million tonnes per annum
0
25
50
Shell + BG Exxon Chevron Total BP
LNG
billion boe
0
10
20
30
Exxon BP Shell + BG* Total Chevron
Oil & gas proved reserves - 2015
Million boe per day
Oil and gas production
BG transaction accelerates our growth strategy
Increased scale and portfolio quality – an opportunity to re-set Shell
Liquids Gas 2015 2018
Shell BG
0
2
4
Exxon Shell + BG Chevron Total BP
Royal Dutch Shell | June 7, 2016 21
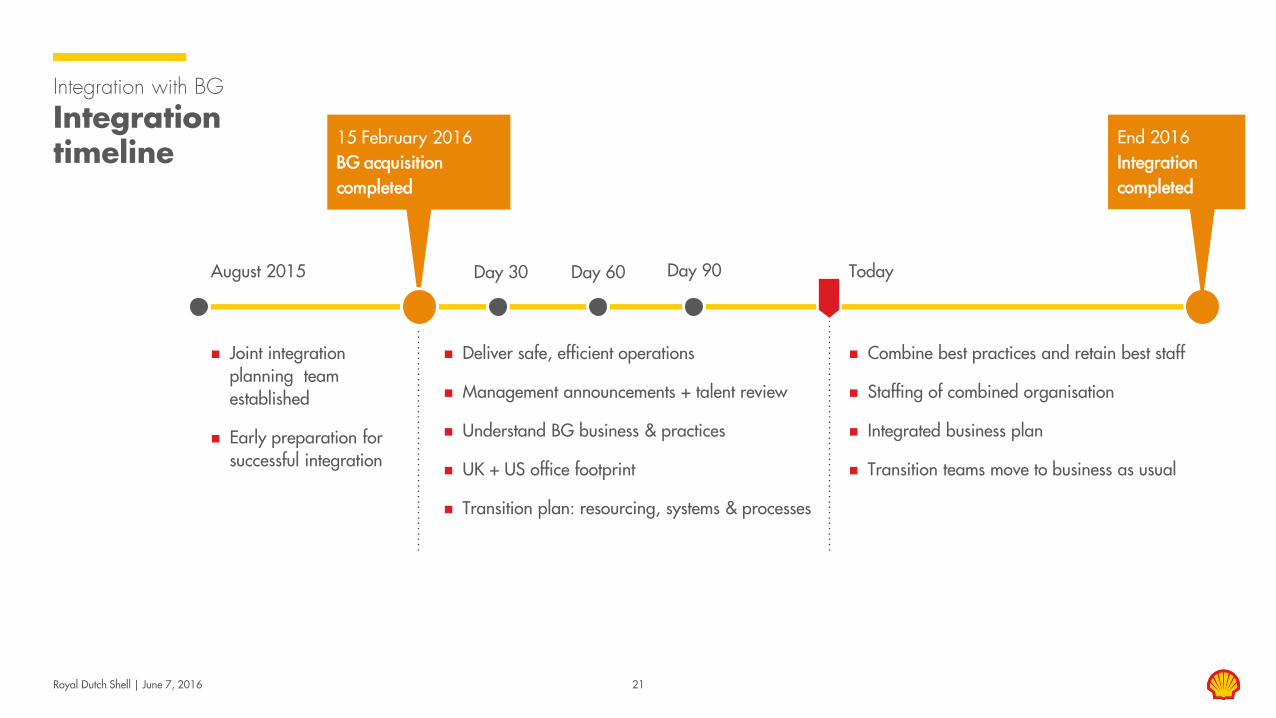
Integration with BG
Integration timeline
Deliver safe, efficient operations
Management announcements + talent review
Understand BG business & practices
UK + US office footprint
Transition plan: resourcing, systems & processes
End 2016 Integration completed
15 February 2016 BG acquisition completed
Day 60 Day 30 Day 90
Combine best practices and retain best staff
Staffing of combined organisation
Integrated business plan
Transition teams move to business as usual
Today
Joint integration planning team established
Early preparation for successful integration
August 2015
2016 2017 2018
-1
0
1
2
3
4
Royal Dutch Shell | June 7, 2016 22
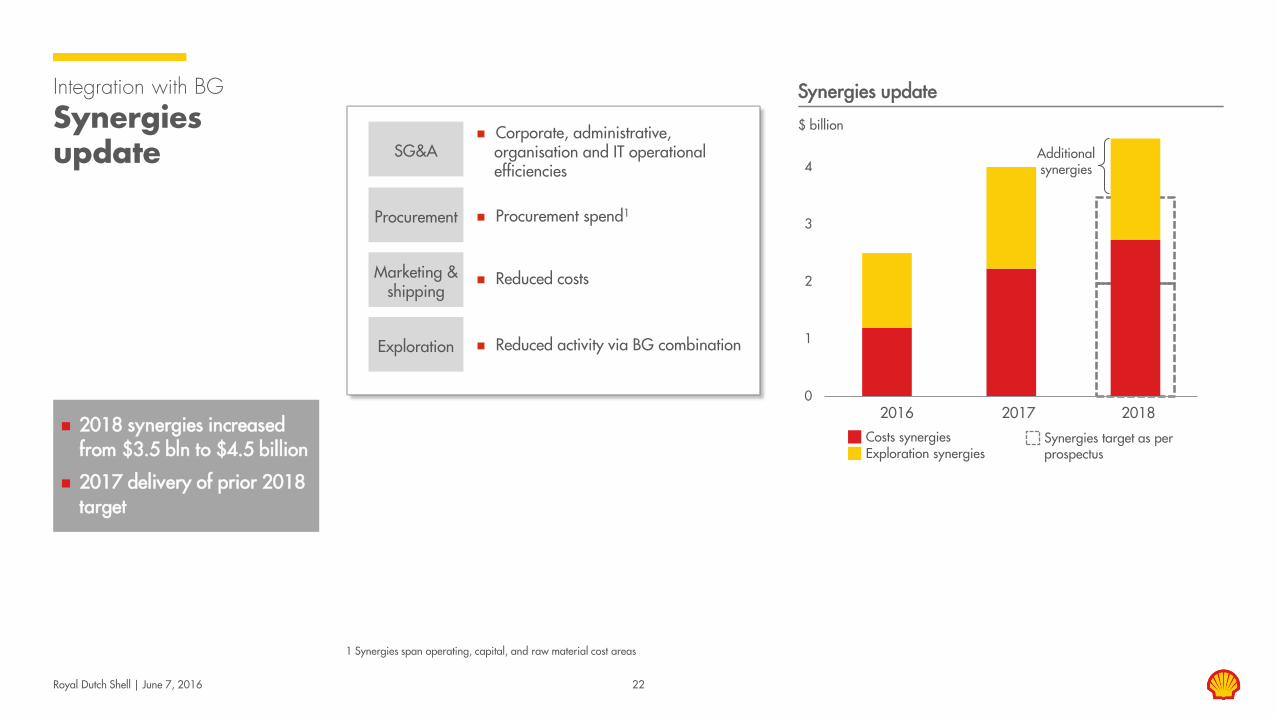
Integration with BG
Synergies update
1 Synergies span operating, capital, and raw material cost areas
$ billion
Synergies update
2018 synergies increased from $3.5 bln to $4.5 billion
2017 delivery of prior 2018 target
Additional synergies
SG&A
Procurement
Marketing & shipping
Corporate, administrative, organisation and IT operational efficiencies
Reduced costs
Procurement spend1
Exploration Reduced activity via BG combination
Exploration synergies Costs synergies Synergies target as per
prospectus
Royal Dutch Shell | June 7, 2016 23
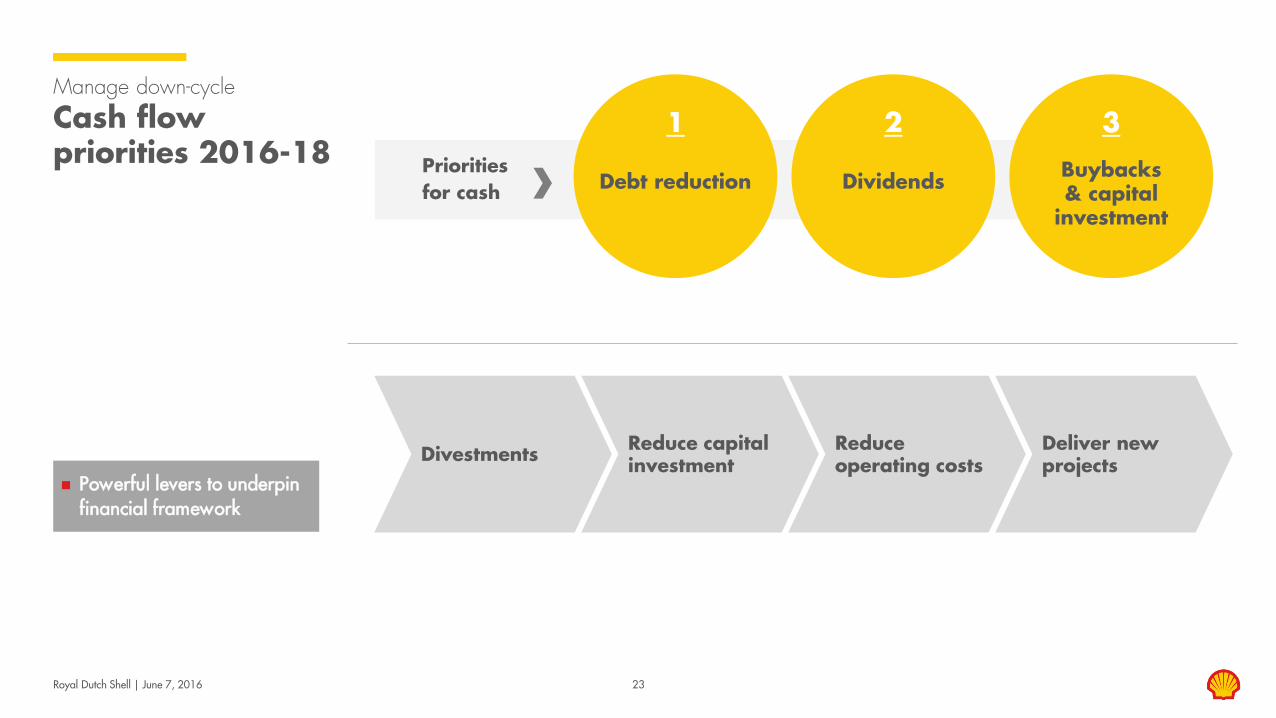
Manage down-cycle
Cash flow priorities 2016-18
Powerful levers to underpin financial framework
Priorities for cash Debt reduction Dividends
Buybacks & capital
investment
1
2
3
Divestments Reduce capital investment
Reduce operating costs
Deliver new projects
Royal Dutch Shell | June 7, 2016 24
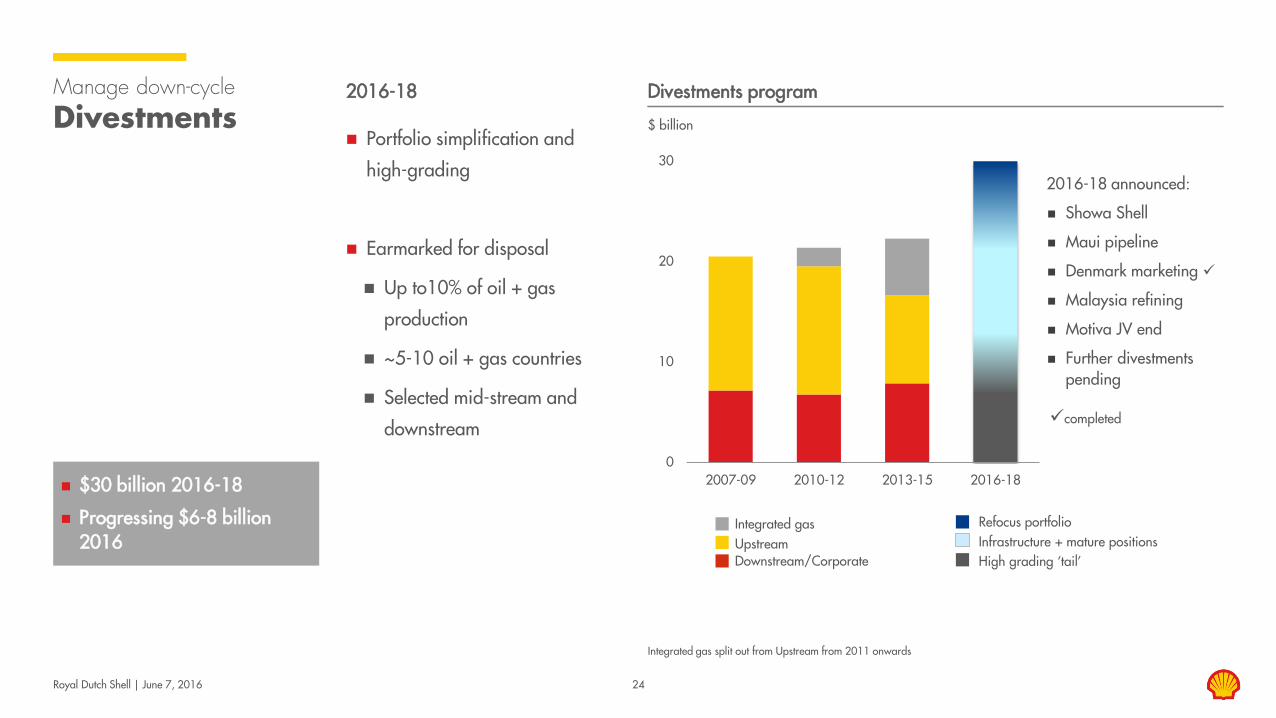
Manage down-cycle Divestments
Integrated gas split out from Upstream from 2011 onwards
$ billion
2016-18
Portfolio simplification and
high-grading
Earmarked for disposal
Up to10% of oil + gas
production
~5-10 oil + gas countries
Selected mid-stream and
downstream
Divestments program
$30 billion 2016-18
Progressing $6-8 billion 2016
0
10
20
30
2007-09 2010-12 2013-15 2016-18
Downstream/Corporate High grading ‘tail’ Infrastructure + mature positions Refocus portfolio
2016-18 announced:
Showa Shell
Maui pipeline
Denmark marketing
Malaysia refining
Motiva JV end
Further divestments pending
completed
Upstream Integrated gas
Royal Dutch Shell | June 7, 2016 25
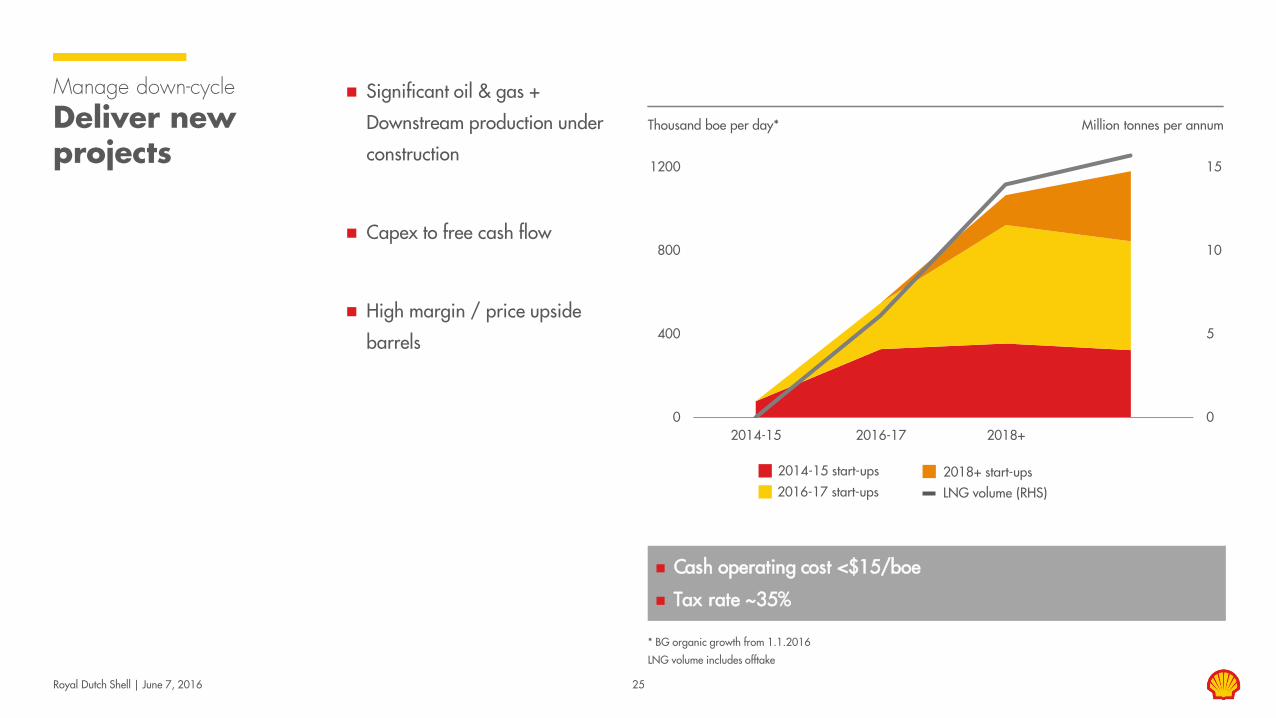
Manage down-cycle
Deliver new projects
* BG organic growth from 1.1.2016
LNG volume includes offtake
Thousand boe per day*
Significant oil & gas +
Downstream production under
construction
Capex to free cash flow
High margin / price upside
barrels
2016-17 start-ups
2014-15 start-ups
LNG volume (RHS) 2018+ start-ups
Million tonnes per annum
Cash operating cost <$15/boe
Tax rate ~35%
0
5
10
15
0
400
800
1200
2014-15 2016-17 2018+
Royal Dutch Shell | June 7, 2016 26
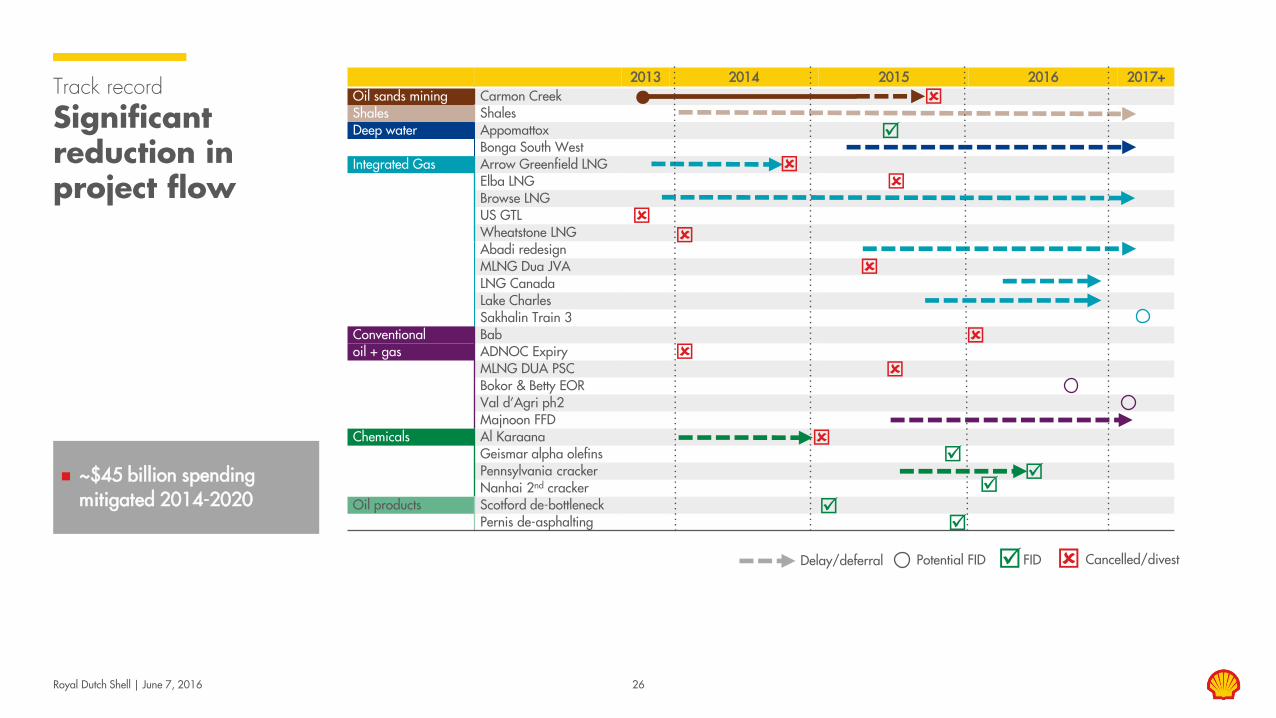
Track record
Significant reduction in project flow
2013 2014 2015 2016 2017+ Oil sands mining Carmon Creek Shales Shales Deep water Appomattox
Bonga South West Integrated Gas Arrow Greenfield LNG
Elba LNG Browse LNG US GTL Wheatstone LNG Abadi redesign MLNG Dua JVA LNG Canada Lake Charles Sakhalin Train 3
Conventional Bab oil + gas ADNOC Expiry
MLNG DUA PSC Bokor & Betty EOR Val d’Agri ph2 Majnoon FFD
Chemicals Al Karaana Geismar alpha olefins Pennsylvania cracker Nanhai 2nd cracker
Oil products Scotford de-bottleneck Pernis de-asphalting
~$45 billion spending mitigated 2014-2020
FID Cancelled/divest Potential FID Delay/deferral
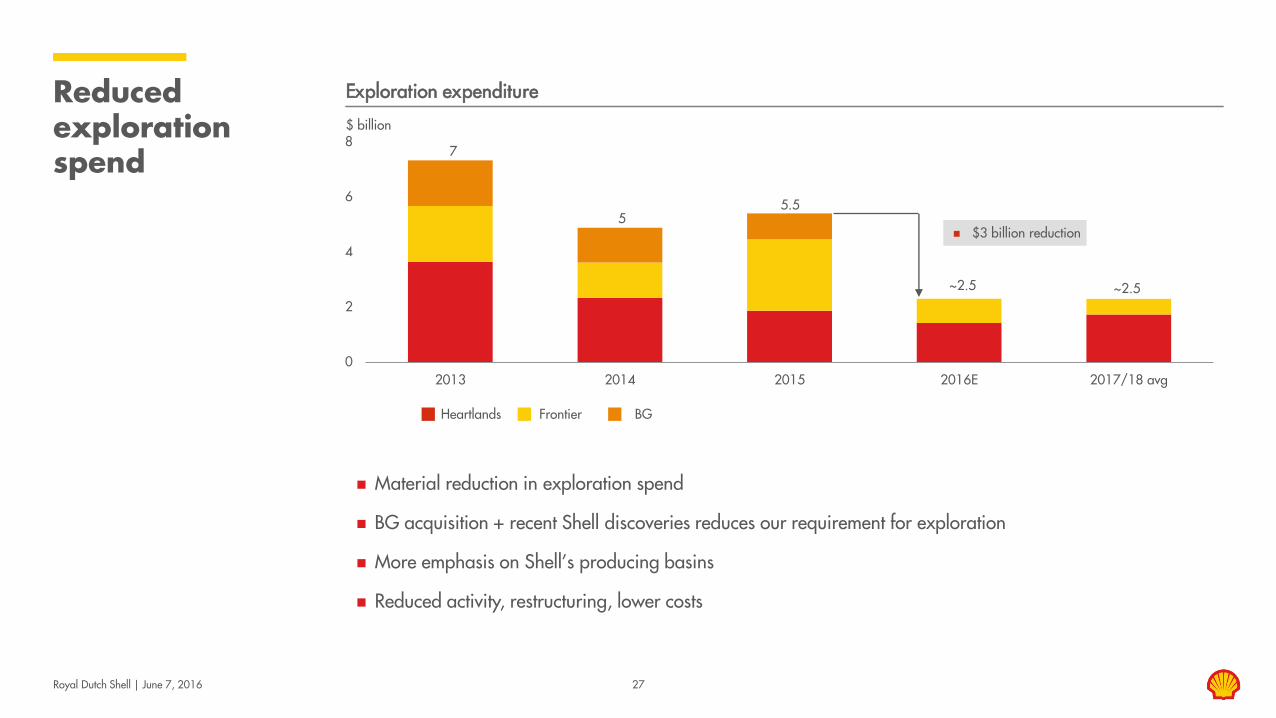
Frontier
Material reduction in exploration spend
BG acquisition + recent Shell discoveries reduces our requirement for exploration
More emphasis on Shell’s producing basins
Reduced activity, restructuring, lower costs
Royal Dutch Shell | June 7, 2016 27
Reduced exploration spend
$ billion
Exploration expenditure
0
2
4
6
8
2013 2014 2015 2016E 2017/18 avg
$3 billion reduction
BG Heartlands
~2.5
7
5 5.5
~2.5
Royal Dutch Shell | June 7, 2016 28
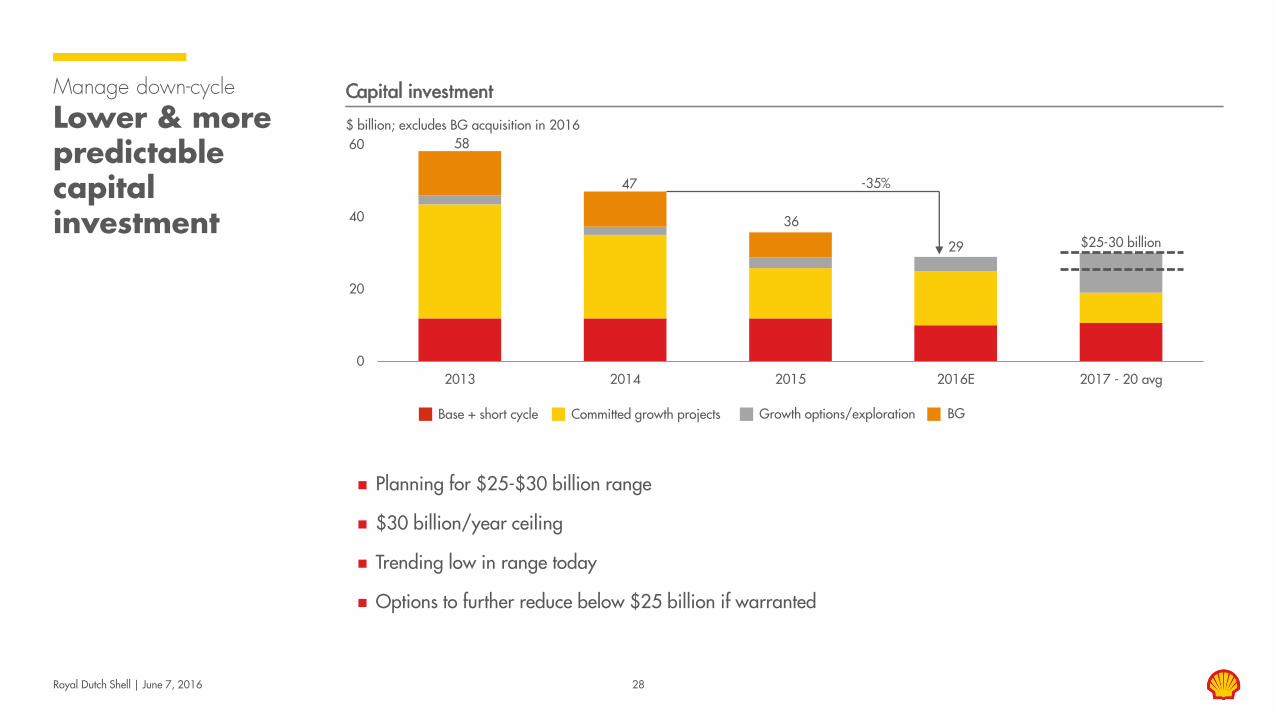
Manage down-cycle
Lower & more predictable capital investment
$ billion; excludes BG acquisition in 2016
Capital investment
Planning for $25-$30 billion range
$30 billion/year ceiling
Trending low in range today
Options to further reduce below $25 billion if warranted
0
20
40
60
2013 2014 2015 2016E 2017 - 20 avg
Growth options/exploration Base + short cycle Committed growth projects BG
$25-30 billion
58
47
36
29
-35%
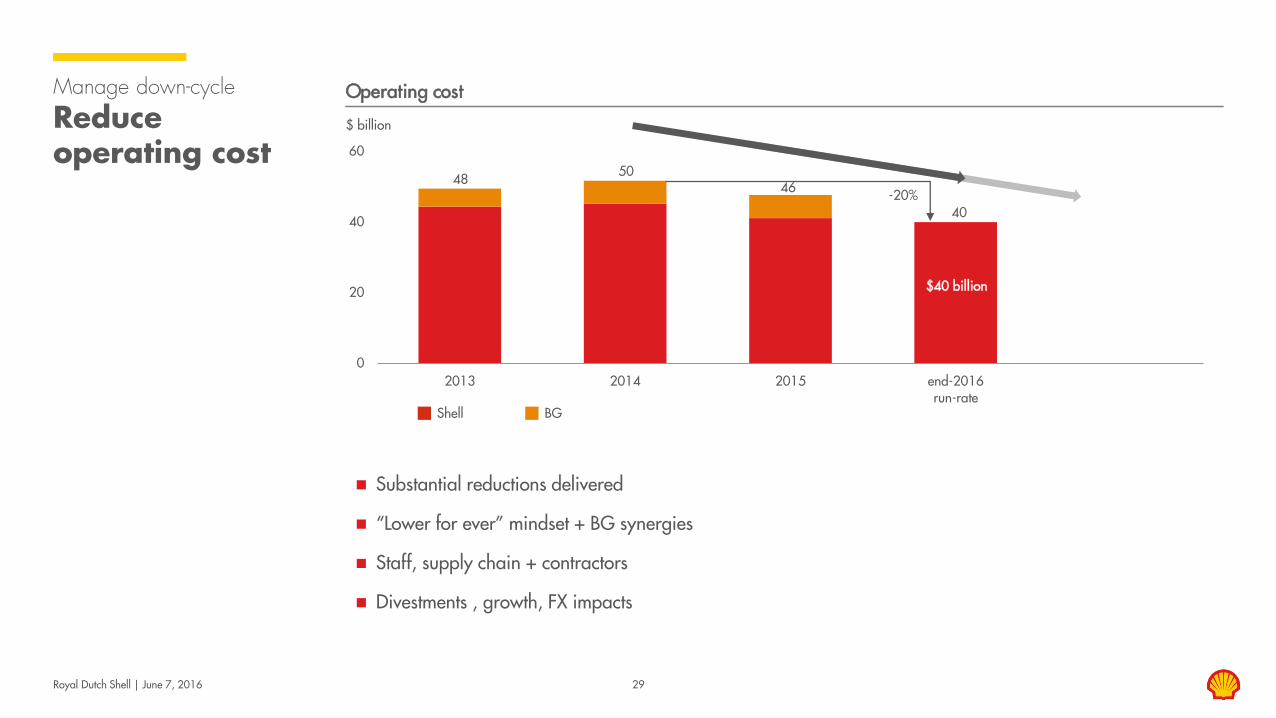
Royal Dutch Shell | June 7, 2016 29
Manage down-cycle
Reduce operating cost
$ billion
Operating cost
0
20
40
60
2013 2014 2015 end-2016run-rate
$40 billion
-20%
Substantial reductions delivered
“Lower for ever” mindset + BG synergies
Staff, supply chain + contractors
Divestments , growth, FX impacts
Shell BG
48 50 46
40
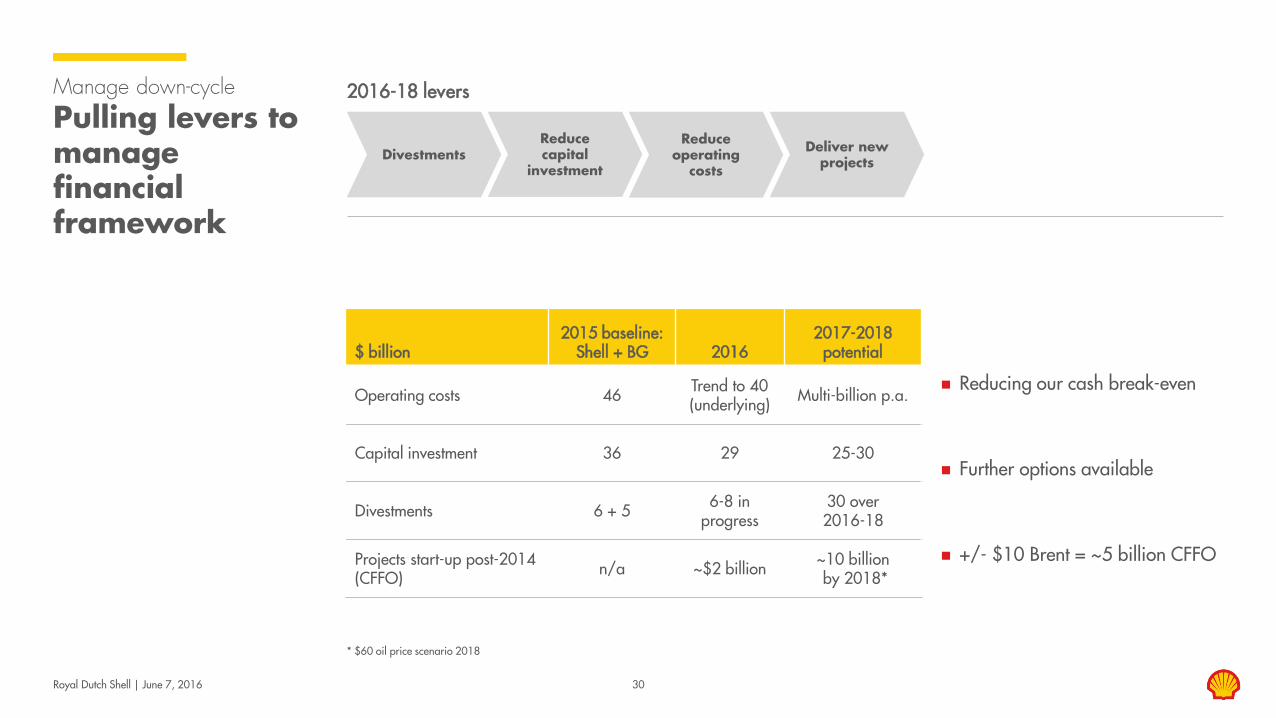
Royal Dutch Shell | June 7, 2016 30
Manage down-cycle
Pulling levers to manage financial framework
* $60 oil price scenario 2018
2016-18 levers
Reducing our cash break-even
Further options available
+/- $10 Brent = ~5 billion CFFO
Divestments Reduce capital
investment
Reduce operating
costs
Deliver new projects
$ billion 2015 baseline:
Shell + BG 2016 2017-2018
potential
Operating costs 46 Trend to 40 (underlying) Multi-billion p.a.
Capital investment 36 29 25-30
Divestments 6 + 5 6-8 in progress
30 over 2016-18
Projects start-up post-2014 (CFFO) n/a ~$2 billion ~10 billion
by 2018*

Ben van Beurden Chief Executive Officer Royal Dutch Shell plc
Royal Dutch Shell | June 7, 2016
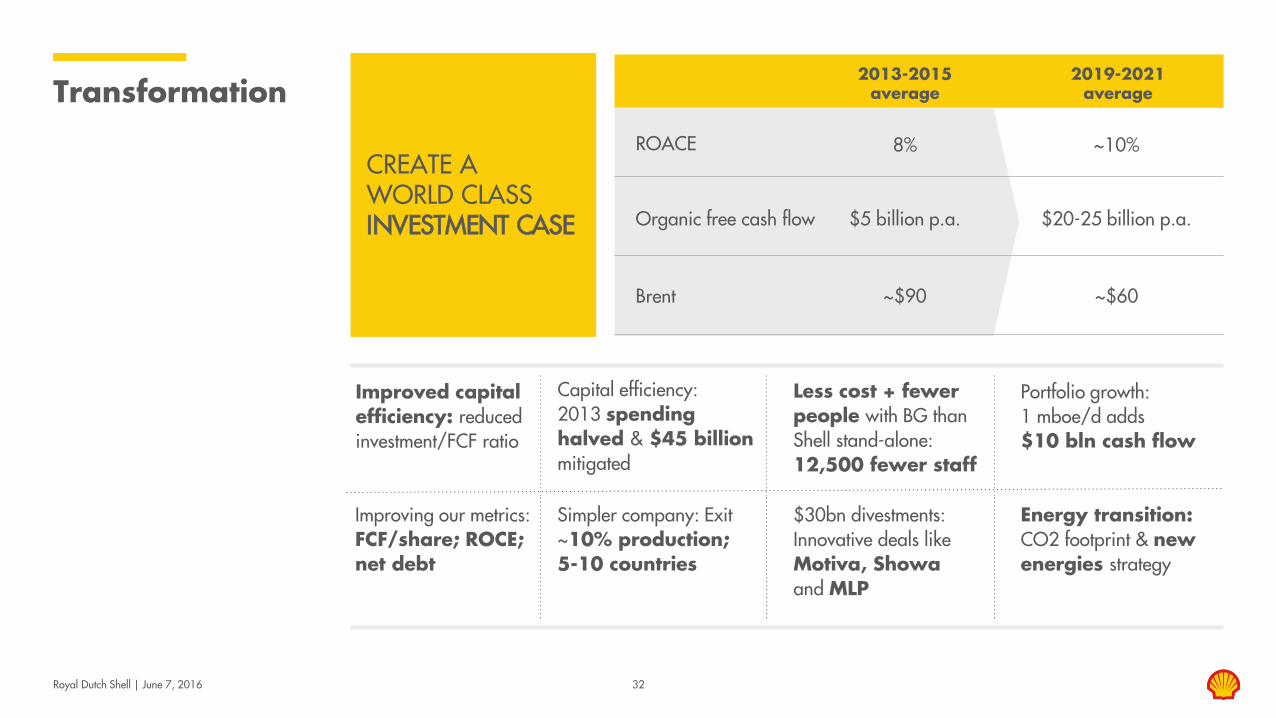
Royal Dutch Shell | June 7, 2016
Transformation
CREATE A WORLD CLASS INVESTMENT CASE
Improved capital efficiency: reduced investment/FCF ratio
Energy transition: CO2 footprint & new energies strategy
Simpler company: Exit ~10% production; 5-10 countries
Less cost + fewer people with BG than Shell stand-alone: 12,500 fewer staff
Capital efficiency: 2013 spending halved & $45 billion mitigated
Improving our metrics: FCF/share; ROCE; net debt
$30bn divestments: Innovative deals like Motiva, Showa and MLP
Portfolio growth: 1 mboe/d adds $10 bln cash flow
2019-2021 average
2013-2015 average
Brent
ROACE
~$60
~10%
~$90
8%
Organic free cash flow $20-25 billion p.a. $5 billion p.a.
32
Questions & Answers
Royal Dutch Shell | June 7, 2016
Royal Dutch Shell plc June 7, 2016
Capital markets day 2016 Re-shaping Shell, to create a world-class investment case
“Let’s make the future”
Royal Dutch Shell | June 7, 2016
Recommended