7/29/2019 Re-Evaluation of the AASHTO 90-Day Salt Ponding Test
http://slidepdf.com/reader/full/re-evaluation-of-the-aashto-90-day-salt-ponding-test 1/10
Cement and Concrete Research 29 (1999) 1239–1248
0008-8846/99/$ – see front matter © 1999 Elsevier Science Ltd. All rights reserved.
PII : S0008-8846(99)00058-7
Re-evaluation of the AASHTO T259 90-day salt ponding testPatrick F. McGratha, R. Doug Hootonb,*
a James Neill & Assoc. Ltd., 45-1866 Rufus Drive, North Vancouver, British Columbia V7J 3L7, Canada
b
Department of Civil Engineering, University of Toronto, 35 St. George Street, Toronto, Ontario M5S 1A4, Canada
Received 18 August 1998; accepted 2 March 1999
Abstract
There is a need to develop a better understanding of the relationship among short-, medium-, and long-term tests to assess the resis-
tance of concrete to chloride penetration. In this contribution, a resistivity-based test is compared to a 90-day salt ponding test. The short-
term (6-h) rapid chloride permeability test has been criticized for its lack of a scientific basis and poor correlation to the so-called control
ponding test. Comparative testing is presented for several concrete and mortar mixtures, which suggests that if modifications are made totest procedures and methods of analysis then the relationship between the results of the resistivity-based test and the diffusion-based test
is improved. The 90-day salt ponding test can be improved by using a depth of penetration approach rather than an integral chloride con-
tent and by limiting the transport process to diffusion only. Modification to the rapid chloride test by shortening the test time to 30 min
did not improve the correlation to other test methods for the range of concretes studied here. © 1999 Elsevier Science Ltd. All rights re-
served.
Keywords: Diffusion; Permeability; Transport properties; Silica fume; Concrete
1. Introduction
It would be advantageous if a simple, short, inexpensivetest could be conducted on concrete at an early age that
would predict the time to onset of corrosion of reinforcing
steel in concrete exposed to chloride ion contamination.
This, however, is a very tall order. The rate of penetration of
the chloride ion into concrete is not easily quantified. Nei-
ther is the likelihood for corrosion to occur once the chlo-
ride gets to the reinforcing steel. Penetration rates into con-
crete depend on many factors, such as pore geometry,
chemical reaction (long and short term), environmental con-
ditions (fluctuations in temperature and moisture), and im-
perfections such as cracking.
The initiation and rate of reinforcing steel corrosion isdifficult to quantify and depend on chloride concentrations
as well as chemical and environmental factors. Taking these
many variables into consideration it is unlikely that either a
resistivity-based test procedure or a 3-month salt ponding
test will completely quantify the long-term nature of chlo-
ride penetration and reinforcing steel corrosion. Nonethe-
less, a recent debate has arisen that pits a peculiar resistivity
test against a ponding test. These tests are the ASTM C1202 “Electrical Indication of Concrete’s Ability to Resist
Chloride Ion Penetration” or AASHTO T277 rapid chloride
permeability test (RCPT) and the AASHTO T259 “Resis-
tance of Concrete to Chloride Penetration” sometimes
called the 90-day salt ponding test.
Whiting [1] first developed the RCPT procedure. Two
electrolyte-filled chambers are attached to either side of a
51-mm thick ϫ
95-mm diameter cylinder of concrete. A 60-
V DC current is passed through the sample, and total charge
is recorded after 6 h. The test was calibrated against the 90-
day salt ponding test. This test involves ponding of a 3%
NaCl solution on air-dried slabs for a period of 90 days. In
comparing results to the RCPT, Whiting used a single pa-
rameter referred to as “integral chloride content,” which is
an approximate integration of the total amount of chloride
ion that has penetrated into the concrete. Whiting found that
the coefficient of correlation (r
2
) was 0.92, but the estimated
quantitative error was 30%.
Pfeifer et al. [2] found that they obtained inconsistent test
results when comparing the resistivity and ponding test pro-
cedures. Scanlon and Sherman [3] reported a substantial
conflict between the two test procedures and stated that the
generalized relationship found by Whiting was not valid if
silica fume, fly ash, or superplasticizer was used.
* Corresponding author. Tel.:ϩ
416-978-5912; fax:ϩ
416-978-6813.
E-mail address
: [email protected] (R.D. Hooton)

7/29/2019 Re-Evaluation of the AASHTO 90-Day Salt Ponding Test
http://slidepdf.com/reader/full/re-evaluation-of-the-aashto-90-day-salt-ponding-test 2/10
1240
P.F. McGrath, R.D. Hooton / Cement and Concrete Research 29 (1999) 1239–1248
2. Background theory
The RCPT is essentially a resistivity test [4,5]. Resistiv-ity is the inverse of conductivity. The 90-day ponding test
involves a combination of absorption, diffusion, and wick-
ing (due to drying from the bottom side). Various methods
of analysis exist for looking at the 90-day ponding test, but
all are based on apparent diffusion (i.e., a factor derived
from the actual penetration). The relation between ionic
conductivity and apparent diffusion would be linear if sev-
eral ideal conditions were true:
• The effect of pore solution concentration must be min-
imal, i.e., dilute solution,
• Diffusion only process must occur, i.e., no chemical
reaction, sorption, changes in surface concentration, etc.• No time-dependent changes in the pore structure.
None of these criteria can be met and a linear relationship is
at best an approximation.
It is interesting to note that concentration of ions in the
pore solution will affect conduction and diffusion in the op-
posite manner. Total conductivity will be a function of total
ion concentration and should increase with concentration.
Increasing pore solution concentration (of all ions) should
reduce diffusion. This effect may not be important if the rate
of both conduction and diffusion were controlled by the tor-
tuosity and constrictivity of the pore structure.
3. Modifications to test procedures
It would appear that obtaining a good relationship be-
tween the two tests is difficult. This does not mean that the
relationship cannot be improved on. The methods of testing
and analysis conducted by Whiting [1] and others [2,3] may
not have been accurate enough to produce a good relation-
ship. The following modifications are proposed to the two
basic test procedures:
• Shorten the RCPT procedure to 30 min to eliminate the
effects of specimen heating
• Eliminate the partially saturated condition of the pond-
ing samples to make diffusion the dominant process
• Control solution concentration in the salt ponding test
• Modify the method of analysis of salt ponding test data
to include (1) the calculation of a diffusion coefficient
from Fick’s second law and (2) the depth of penetra-
tion using an accurate profile grinding method.
Table 1
Mixture proportions and results for Series A mortars
RCPT total charge passedAASHTO 90-day
ponding integral
chloride content %*
Modified ponding
diffusion coefficient
D
p
(m
2
/s;ϫ
10
Ϫ
12
)
Depth @
0.1%
Cl
Ϫ
(mm)ID no. w/cm % SF % FA % Slag
6 h
(coulomb)
30 min ϫ
12
(coulomb)
Depth @ 0.1%
Cl
Ϫ
T259 (mm)
M1 0.30 — — — 3860 2459 0.37 8.8 9.59 22.0
M2 0.30 — — 25 2012 1496 0.24 6.5 2.88 13.2
M3 0.30 — 40 — 920 811 0.23 6.7 0.81 7.7M4 0.30 8 — — 150 145 0.17 5.0 0.71 7.1
M5 0.30 8 — — 205 192 0.09 3.8 0.92 8.4
M6 0.30 12 — — 67 65 0.02 2.2 0.41 5.4
M7 0.30 8 — 25 130 120 0.12 4.1 0.52 6.6
M8 0.30 8 — 40 140 130 0.06 3.2 0.51 6.0
M9 0.30 8 40 — 120 110 0.07 3.6 0.41 5.6
* By mass of mortar.
Table 2Mixture proportions and results for Series A concretes
RCPT total charge passedAASHTO 90-day
ponding integral
chloride content %*
Modified ponding
diffusion coefficient
D
p
(m
2
/s; ϫ
10
Ϫ
12
)ID no. w/cm % SF % FA % Slag
6 h
(coulomb)
30 minϫ
12
(coulomb)
Depth @ 0.1%
Cl
Ϫ
T259 (mm)
Depth @
0.1% Cl
Ϫ
(mm)
C1 0.40 — — — 3171 2333 0.82 13.9 19.0 30.0
C2 0.40 — — 25 1477 1339 0.85 11.7 4.96 15.9
C3 0.40 — 25 — 2056 1745 0.79 12.3 7.65 20.7
C4 0.40 8 — — 316 306 0.48 7.7 1.68 10.2
C5 0.31 8 — — 121 127 2.05 9.0
C6 0.31 8 — 40 72 74 1.67 8.8
C7 0.31 8 30 — 97 100 1.88 8.7
* By mass of concrete.

7/29/2019 Re-Evaluation of the AASHTO 90-Day Salt Ponding Test
http://slidepdf.com/reader/full/re-evaluation-of-the-aashto-90-day-salt-ponding-test 3/10
P.F. McGrath, R.D. Hooton / Cement and Concrete Research 29 (1999) 1239–1248
1241
4. Mix proportions
The concrete and mortar mixtures were cast as part of
two separate graduate student research programs. Group A
mixtures were completed as part of research conducted by
McGrath [6] and Series B as part of research conducted by
Pun [7].
General descriptions of the mixture proportions are
shown in the left sides of Tables 1, 2, and 3. Group A con-
tained two series of concrete mixtures (w/cm ϭ
0.31 and
0.40) and one series of mortar mixtures (w/cm ϭ
0.30).
Mixes contained combinations of silica fume, blast furnace
slag, and Class C and F fly ash. Group B contained one se-
ries of concrete mixtures (w/cm ϭ
0.35, 0.40, and 0.45) andsilica fume contents of 0%, 7%, and 12% mass replacement
of cement. Specific details of Group A are given in refer-
ence [8] and Group B in reference [9].
Series A specimens were cast into 350 ϫ
250ϫ
150-mm
blocks and 350 ϫ
150 ϫ
75-mm slabs. The specimens for
chloride ponding and RCPT were cored from the interior of
the larger blocks to eliminate the effects of curing and form-
ing. Specimens for the AASHTO T259 were cured for 14
days and dried for 14 days in accordance with the standard.
To allow for milling the chloride profiles, the 350 ϫ
150 ϫ
75-mm slabs were cored at age 14 days into 100-mm diame-
ter cylinders and then ponded with salt solution.Series B specimens were cast in similar molds and either
steam cured using a conventional 18-h steam curing cycle
or were moist cured for various combinations of times.
5. Test methods
5.1. AASHTO T259 90-day salt ponding test
Specimens were cast into 350 ϫ
250 ϫ
75-mm slabs.
Fourteen days of moist curing was followed by 28 days of
drying at 50% relative humidity and 23
Њ
C. For Series A, mod-
ifications to the standard procedure were made as follows:
1. Instead of building dams around the top of the 350ϫ
250ϫ
75-mm slabs, samples were cored (100-mm di-
ameter) at age 14 days, 100-mm diameter cores were
sealed around the outside edge using a peel-and-stick
bituminous sheet to create a side seal and a dam for
chloride solution, and cylinders were ponded to a
depth of 1 cm with 3% NaCl solution
2. Tops were sealed completely with plastic wrap and
tape to minimise evaporation
3. Samples were profile ground in 0.5- to 0.75-mm lay-
ers and not 12.5-mm layers.
For Series B the procedure outlined in the standard was
followed except accurate profile grinding was completed.The original work by Whiting [1] that developed a rela-
tionship between the RCPT and the 90-day salt ponding test
used a concept referred to as “integral chloride content,”
which can be calculated by adding the chloride content of
the uppermost eight 5.1-mm thick slices. An example of
how this was approximated is shown in Fig. 1.
5.2. RCPT
The procedure followed for the RCPT was the same as
that described in the ASTM C 1202 (Electrical Indication of
Concrete’s Ability to Resist Chloride Ion Penetration) and
AASHTO T277 with the following exceptions. Specimen
preparation was conducted in the same manner as for the
chloride ponding specimens. Cores were 100-mm diameter
(not 95 mm) and were nominally 50 mm long (not 51 mm).
As per ASTM C 1202, the measured coulomb values were
normalised to the standard 95-mm diameter. Vacuum satu-
ration was for 24 h before coating with epoxy and 3 h after
coating (not just 3 h after coating). The RCPTs were con-
ducted on interior (sealed cure) specimens removed from
350 ϫ
250 ϫ
150-mm blocks (randomly from the middle
100 mm of core length). All tests were conducted when the
specimens were 56 days old.
Table 3
Mixture proportions and results for Series B concretes
RCPT total charge passedAASHTO 90-day
ponding integral
chloride content %*ID no. w/cm % SF % FA % Slag
6 h
(coulomb)
30 min ϫ 12
(coulomb)
Depth @ 0.1%
Cl
Ϫ
T259 (mm)
Modified ponding diffusion
coefficient D
p (m
2
/s;ϫ 10
Ϫ
12
)
Depth @ 0.1%
Cl
Ϫ
(mm)
C8 0.35 0 – – 3168 2495 0.26 7.1 5.9 18.5
C9 0.35 7 _ _ 543 637 0.13 3.9 1.9 10.2
C10 0.35 12 – – 282 272 0.10 3.3 0.9 6.8C11 0.40 0 – – 3713 2742 0.43 10.5 9.4 21.3
C12 0.40 7 _ _ 596 567 0.12 3.6 1.8 10.3
C13 0.45 0 – – 5908 4968 0.62 13.2 10.5 25.0
C14 0.45 7 _ _ 1783 1472 0.29 6.7 1.9 12.5
C15 0.35 0 – – 5058 3962 0.36 9.0 8.2 24.0
C16 0.35 7 – – 611 607 0.15 4.4 3.2 12.5
C17 0.45 0 _ _ 7299 6384 0.63 14.0 12.1 30.7
C18 0.45 7 – – 1430 1164 0.42 10.3 4.5 17.8
* By mass of concrete.

7/29/2019 Re-Evaluation of the AASHTO 90-Day Salt Ponding Test
http://slidepdf.com/reader/full/re-evaluation-of-the-aashto-90-day-salt-ponding-test 4/10
1242
P.F. McGrath, R.D. Hooton / Cement and Concrete Research 29 (1999) 1239–1248
In addition to performing the standard 6-h tests, another
measure was taken to avoid the influence of temperature
rise on test results. Electrical heating results in increased
mobility of ions in the pore solution (i.e., increased electri-
cal conductivity). To avoid this effect, the 30-min charge
was recorded and linearly extrapolated to estimate 6-hcharge passed. This is called 30 min ϫ
12 in the tables and
figures.
5.3. Modified chloride ponding test
The chloride ponding test is similar to the test described
by Wood et al. [10]. The surface to be exposed to chloride
solution was protected with masking tape, and the remain-
ing sides were air dried then coated with a continuous layer
of paste epoxy that was allowed to harden for up to 24 h.
The tape was removed and an additional 3 h of vacuum sat-
uration was applied in case the top surface lost moisture
during the epoxying process.Various salt concentrations, exposure times, and expo-
sure temperatures were used throughout the two test pro-
grams; however, the results of the most highly accelerated
test are provided in this paper. For this test the solution con-
centration was 5 mol/L NaCl and the temperature was 40
Њ
C.
Samples were ponded for 120 days (first immersed at 56
days after casting). Identical 2.5-L rectangular plastic con-
tainers were used for all tests, each filled with 1.5 L of solu-
tion and two specimens. The ratio of solution volume to
specimen area was kept constant to standardise the effects
of leaching and counter diffusion of the OH
Ϫ
ion out of the
specimen. The ability of the OH
Ϫ
ion to diffuse out will be
influenced by its concentration in the surrounding solution
as well as the diffusivity of the specimen. The concentration
of hydroxide ion in the surrounding solution will be influ-
enced by the size of the container.
5.4. Profile grinding technique
Specimens were removed from salt ponding after the re-
quired exposure period and were ground immediately.
Grinding typically would be completed within 2 h of re-
moval from solution. In a few cases where time was notavailable to grind immediately, specimens were tightly
sealed in two plastic bags and frozen (approximately
Ϫ
18
Њ
C) to minimise further chloride diffusion until grind-
ing could be completed.
At the time of grinding, a hammer and wide heavy chisel
were used to chop away the outer epoxied surface and a
wedge of the specimen itself along the grinding path so that
this material would not contaminate the ground sample (Fig. 2).
Grinding was started without delay to avoid movement of
chloride ions with the evaporating pore solution.
The specimen was mounted on a Van Norman milling
machine previously used for machining metal. No adjust-ments were needed to the machine and a simple vice and V
block were used to hold the specimen. Shims were used to
Fig. 1. Example of integral chloride content calculation.
Fig. 2. Schematic diagram of profile ground specimen.

7/29/2019 Re-Evaluation of the AASHTO 90-Day Salt Ponding Test
http://slidepdf.com/reader/full/re-evaluation-of-the-aashto-90-day-salt-ponding-test 5/10
P.F. McGrath, R.D. Hooton / Cement and Concrete Research 29 (1999) 1239–1248
1243
set the plane of the grinding bit parallel to the top exposed
surface of the specimen. This could normally be achieved
with an accuracy of Ϯ
0.20 mm. The grinding bit used was
an AXT/AWT (50-mm outer diameter) ordinary diamond
drill core bit such as those used in hard rock drilling. A sim-
ple adapter was made to attach the drill bit to the mill and to
dissipate heat. The cross-bed travel speed (50 mm/min) and
drill bit rotation (320 r.p.m.) were kept slow enough to pre-
vent excess dusting and heat buildup. Ground layers were
typically 0.51 or 0.76 mm deep (0.020 or 0.030 inch). Not
every layer was saved for analysis.
Before collecting a sample for analysis, the entire area
around the specimen was vacuumed and blown off with
compressed air. Wax paper squares (weighing papers) were
placed at either end of the direction of grinding to collect
the ground powder. Approximately 90% of the ground pow-
der could be recovered by this process; however, this
amount was considered to be representative of the whole
because there was little or no segregation of material from
different areas of the ground specimen surface. After com-pletion of the grinding the final ground depth was measured
with a digital caliper at four locations to verify the depth
readings recorded from the milling. If the final depth varied
by more than 0.25 mm, all the depth readings were adjusted
(making the assumption that the error occurred during the
mounting and zeroing of the milling machine).
5.5. Chloride analysis
The method used for digesting the ground powders was
similar to that outlined in ASTM C 114 Standard Test Meth-
ods for Chemical Analysis of Hydraulic Cement, Section 19
“Chloride.” Powder samples were first dried at 110
Њ
C to con-stant mass and allowed to cool in a desiccater. The material
was next sieved through a 315-
m sieve. Only material pass-
ing the sieve was saved, as the larger chips retained on the
sieve were likely from another layer. The reason for this is
that when the milling bit first strikes the edge of the sample it
chips away a bit of material below the set depth.
Immediately after sieving, either a 2 or 3-g subsample of
the powder is weighed into a 250-mL beaker. The sample is
digested using a nitric acid solution and brought to a boil.
Some experience is necessary to determine when boiling
has occurred, because effervescence (small bubbles) can be
confused with boiling (large lacy bubbles). It is suggested
that chloride can be lost through vaporisation if the sample
is allowed to boil for any length of time [11].
After digestion and filtration the solution is analysed for
total chloride content by potentiometric titration using 0.01
mol/L silver nitrate and a silver billet electrode. In some in-
stances the chloride content of the digested solution was so
low (less than 0.006 mmol) that it was necessary to add a
measured volume of a known NaCl solution (unit addition
or blank addition) so that a clearer inflection point would be
obtained. Later the chloride content of the unit addition
would be subtracted to determine the actual solution con-
centration.
5.6. Diffusion coefficient calculation
A typical profile from the chloride ponding test is shown
in Fig. 3. The chloride content is expressed as a percentage
of the 110
Њ
C dry mass of sample. Typically seven or eight
layers were profile ground from each specimen. An estima-
tion was made of the extent of penetration before grinding
based on past experience. A good curve was produced when
five or six points were within the chloride penetrated region
and one or two points were in the uncontaminated region.
For the types of concrete and mortar analysed in this work
the depth of penetration varied from less than 5 mm togreater than 15 mm.
Fick’s second law of diffusion was fitted to the data us-
ing Eq. (1) to determine the apparent diffusion coefficient
commonly referred to as D
a
or in this work D
p
:
Fig. 3. Typical chloride ponding test.

7/29/2019 Re-Evaluation of the AASHTO 90-Day Salt Ponding Test
http://slidepdf.com/reader/full/re-evaluation-of-the-aashto-90-day-salt-ponding-test 6/10
1244
P.F. McGrath, R.D. Hooton / Cement and Concrete Research 29 (1999) 1239–1248
(1)
For the boundary conditions C
(x
ϭ
0, t
Ͼ
0)
ϭ
C
o
, initial con-
dition C
(x
Ͼ
0, t
ϭ
0)
ϭ
0, and infinite point condition C
(x
ϭ
∞
, t(0)
ϭ
0, the solution is given in Eq. (2):
(2)
where c
(x,t)
ϭ
concentration of chloride per mass of sample
at distance x and time t (%); c
o
ϭ
concentration of chloride
per mass of sample at x ϭ
0, t Ͼ
0 (%); and erf ϭ
error
function.
This type of analysis has been used by numerous re-
searchers to determine diffusion coefficients from either lab
or field data [10–15]. The total chloride content from the ti-
tration analysis was reduced by the amount of the back-
∂ci
∂t------- D
∂2ci
∂x2
--------- .=
c x t,( )
co
---------- 1 erf x
4Dt-------------
–=
ground chloride content, i.e., chloride present in the aggre-
gates, cements, and other mix ingredients. The fitting of
Fick’s second law of diffusion was conducted using a com-
mercial curve fitting software program to search for a non-
linear, least-squares, best fit of the data. The surface con-
centration C
o
and diffusion coefficient (D
p
) were both
allowed to vary. The least-squares regression searches for
the highest coefficient of determination (r
2
).
5.7. Penetration depth
Fig. 3 also shows another measure of chloride penetra-
tion—the penetration depth. A value of 0.1% chloride was
arbitrarily chosen as the approximate point of inflection of
the “toe” of the penetration curve. This value typically will
provide a precise and reproducible depth measurement. Be-
cause of the asymptotic shape of the toe of the curve, choos-
ing a lower concentration would result in a more variable
prediction of penetration depth. The 0.1% by mass of con-
crete value (0.3–0.6% by mass of cement depending on the
mix) is likely somewhat higher than the threshold chloridelevel for the initiation of corrosion. A summary of various
research studies compiled by Glass and Buenfeld [16] found
threshold chloride levels to vary from 0.17 to 2.5% (by
mass of cement) with a value of 0.2% chosen as a good pre-
diction of threshold chloride level for harsh environments.
6. Test results and discussion
Test results are given in Tables 1, 2, and 3. To provide a
degree of understanding of the dispersion of the data such
that an assessment of the test procedures can be made, the
Table 4
Comparison of r
2
values for linear relationship between test methods
r
2
Relationship 6-h RCPT 30 minϫ
12 RCPT
90-day ponding, integral chloride
content vs. RCPT 0.34 0.30
90-day ponding, depth at 0.1%
chloride vs. RCPT 0.61 0.60Modified ponding vs. diffusion
coefficient vs. RCPT 0.65 0.60
Modified ponding, depth at 0.1%
chloride vs. RCPT 0.83 0.79
Fig. 4. AASHTO T259 integral chloride content vs. 6-h rapid chloride permeability test number.

7/29/2019 Re-Evaluation of the AASHTO 90-Day Salt Ponding Test
http://slidepdf.com/reader/full/re-evaluation-of-the-aashto-90-day-salt-ponding-test 7/10
P.F. McGrath, R.D. Hooton / Cement and Concrete Research 29 (1999) 1239–1248
1245
ponding techniques are plotted against RCPT in Figs. 4, 6,
7, and 8. The r
2
for a linear fit of the data is shown in Table
4. Also included in Table 4 is the linear fit for the modified30-min duration RCPT.
The relationship between the integral chloride content
determined from the 90-day salt ponding specimens and the
RCPT number is shown in Fig. 4. As mentioned, it was a
similar calculation that was used to develop the basic rank-
ing of concrete quality for the original work by Whiting [1]
on the rapid chloride test. A great deal of scatter can be seen
in the data.
A problem with the integral chloride content analysis is
the undue influence of high, near-surface chloride concen-
trations. Engineers are concerned with the advance of the
critical chloride front toward the steel and not with near-sur-
face chloride concentrations. The integral chloride content
calculation penalizes concretes with high surface concentra-
tions and low depth of penetration, relative to poorer con-
cretes with deeper depths of penetration, yet lower surface
concentration. For that reason, the depth of the 0.1% chlo-
ride advancing front analysis is preferable [6].
An example of the data obtained from the 90-day salt
ponding test is shown in Fig. 4. As mentioned previously,
chloride profiles were accurately measured using profile
grinding. The AASHTO T259 standard calls for profiles to
be obtained at two depths only, i.e., 0 to 12.5 mm and 12.5
to 25 mm. Using the more accurate profile data, the two-
point data were back calculated. A comparison between the
resolution of the two point method and the more accurate
profile method is shown in Fig. 5. As can be seen, the two-
point method unfairly represents the true depth of chloride
penetration. The two-point data suggest that materials A and
B are similar, when in fact the actual depth of penetration of
the chlorides is nearly twice as deep in material B.
The modified (30 minϫ
12) rapid chloride data are plot-ted against the depth of penetration at 0.1% chloride for the
90-day salt ponding data in Fig. 6. A considerable reduction
in the spread in the data is evident with exactly the same test
specimens. The only thing that changed is the method of
analysing the results. The actual penetration depth is a truer
parameter of interest because it is more likely this value will
influence the onset of reinforcing steel corrosion than a
value weighted with surface chlorides. This was discussed
by Hooton [17].
There is potentially a fundamental problem with the 90-
day salt ponding test. The test appears to be intended to
model field conditions and likely was developed during a
Fig. 5. Schematic diagram of the problem with integrated chloride analysis.
Fig. 6. AASHTO T259 depth at 0.1% vs. 30-min RCPT no.ϫ 12.

7/29/2019 Re-Evaluation of the AASHTO 90-Day Salt Ponding Test
http://slidepdf.com/reader/full/re-evaluation-of-the-aashto-90-day-salt-ponding-test 8/10
1246
P.F. McGrath, R.D. Hooton / Cement and Concrete Research 29 (1999) 1239–1248
time when ordinary Portland cement concrete of low-to-
moderate w/c ratio was in common use. There are three pro-
cesses at work that advance the chloride into the concrete.The samples are dried for 14 days before immersion and,
therefore, suction or sorption occurs for several days, pull-
ing chlorides well into the concrete [16]. The bottom sur-
face of the sample is left exposed to 50% relative humidity
(presumably to model the underside of a bridge deck) and
wicking occurs through the sample. Diffusion occurs due to
the concentration gradient of chloride. Although it can be
argued that all three of these processes may be important to
actual chloride penetration in the field, it is suggested here
that the relative importance of the sorption component is
overestimated. Furthermore, the test itself introduces errors
that affect the precision of the data, such as the method of sample recovery and the variable concentration of the pond-
ing solution. It is for this reason that the “chloride ponding/
profile grinding test” on saturated samples was developed.
The diffusion coefficient determined from Fick’s second
law is plotted against the RCPT data for the modified pond-
ing test in Fig. 7. A fair relationship exists; however, errorsare introduced when significantly different surface concen-
trations of chloride influence the convergence of the equa-
tion. That the diffusion coefficient can be influenced by sur-
face concentrations is important. Differences in surface
concentration (or even the top two or three horizons) may
be strongly influenced by environmental conditions and
chemical binding of the chlorides, which may result in an
inaccurate estimate of the true rate of diffusion.
The best correlation (assuming a linear relationship be-
tween a “medium-term” ponding test and the “short-term”
AASHTO T277 RCPT) is shown in Fig. 8. In this final case
the penetration depth at 0.1% for the chloride ponding/pro-file grinding test is plotted against the modified rapid chlo-
ride data. Fig. 8 suggests that critics of the RCPT may need
to look to their own standard correlation test procedure for
Fig. 7. Modified ponding test diffusion coefficient (Dp) vs. 30 min RCPT no. ϫ 12.
Fig. 8. Modified ponding test depth at 0.1% vs. 30-min RCPT no.ϫ 12.
7/29/2019 Re-Evaluation of the AASHTO 90-Day Salt Ponding Test
http://slidepdf.com/reader/full/re-evaluation-of-the-aashto-90-day-salt-ponding-test 9/10
P.F. McGrath, R.D. Hooton / Cement and Concrete Research 29 (1999) 1239–1248 1247
answers as to why a poor correlation with RCPT was found.
The good correlation between the RCPT and the chloride
ponding test suggests that a conduction-type test might be a
useful indicator of long-term chloride penetration.
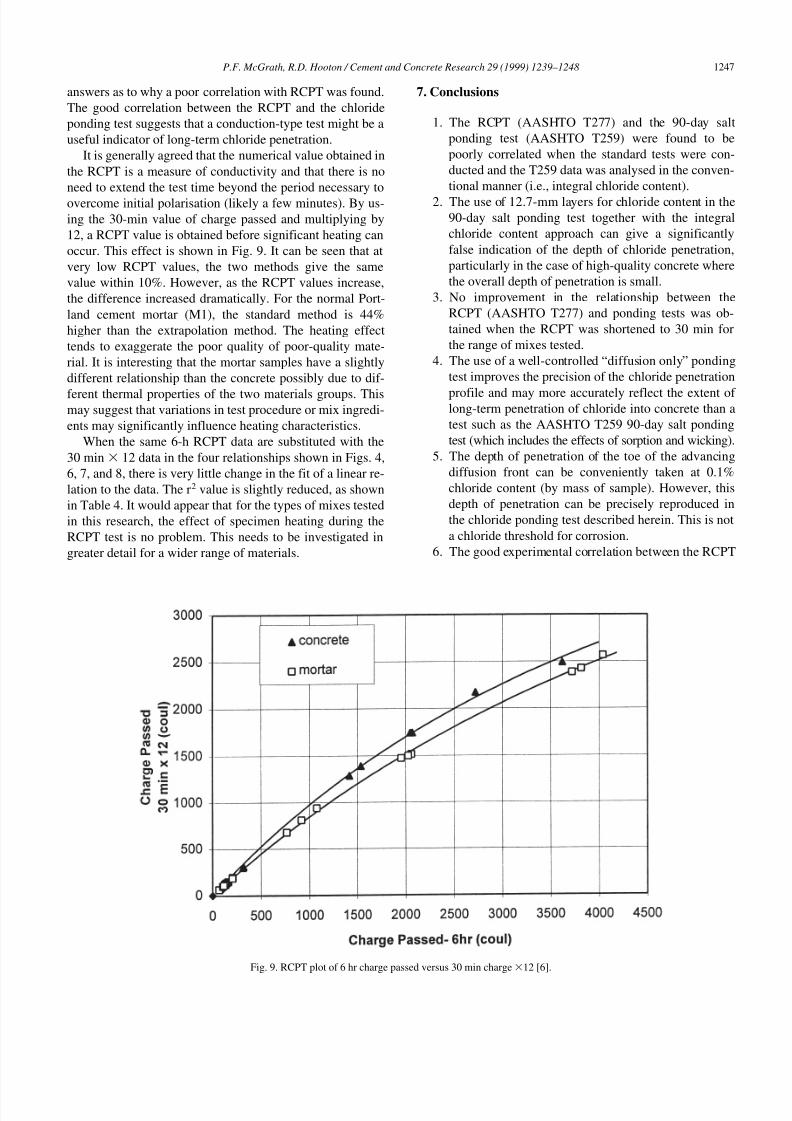
It is generally agreed that the numerical value obtained in
the RCPT is a measure of conductivity and that there is no
need to extend the test time beyond the period necessary to
overcome initial polarisation (likely a few minutes). By us-
ing the 30-min value of charge passed and multiplying by
12, a RCPT value is obtained before significant heating can
occur. This effect is shown in Fig. 9. It can be seen that at
very low RCPT values, the two methods give the same
value within 10%. However, as the RCPT values increase,
the difference increased dramatically. For the normal Port-
land cement mortar (M1), the standard method is 44%
higher than the extrapolation method. The heating effect
tends to exaggerate the poor quality of poor-quality mate-
rial. It is interesting that the mortar samples have a slightly
different relationship than the concrete possibly due to dif-
ferent thermal properties of the two materials groups. Thismay suggest that variations in test procedure or mix ingredi-
ents may significantly influence heating characteristics.
When the same 6-h RCPT data are substituted with the
30 min ϫ 12 data in the four relationships shown in Figs. 4,
6, 7, and 8, there is very little change in the fit of a linear re-
lation to the data. The r2 value is slightly reduced, as shown
in Table 4. It would appear that for the types of mixes tested
in this research, the effect of specimen heating during the
RCPT test is no problem. This needs to be investigated in
greater detail for a wider range of materials.
7. Conclusions
1. The RCPT (AASHTO T277) and the 90-day salt
ponding test (AASHTO T259) were found to be
poorly correlated when the standard tests were con-
ducted and the T259 data was analysed in the conven-
tional manner (i.e., integral chloride content).
2. The use of 12.7-mm layers for chloride content in the
90-day salt ponding test together with the integral
chloride content approach can give a significantly
false indication of the depth of chloride penetration,
particularly in the case of high-quality concrete where
the overall depth of penetration is small.
3. No improvement in the relationship between the
RCPT (AASHTO T277) and ponding tests was ob-
tained when the RCPT was shortened to 30 min for
the range of mixes tested.
4. The use of a well-controlled “diffusion only” ponding
test improves the precision of the chloride penetration
profile and may more accurately reflect the extent of long-term penetration of chloride into concrete than a
test such as the AASHTO T259 90-day salt ponding
test (which includes the effects of sorption and wicking).
5. The depth of penetration of the toe of the advancing
diffusion front can be conveniently taken at 0.1%
chloride content (by mass of sample). However, this
depth of penetration can be precisely reproduced in
the chloride ponding test described herein. This is not
a chloride threshold for corrosion.
6. The good experimental correlation between the RCPT
Fig. 9. RCPT plot of 6 hr charge passed versus 30 min chargeϫ12 [6].

7/29/2019 Re-Evaluation of the AASHTO 90-Day Salt Ponding Test
http://slidepdf.com/reader/full/re-evaluation-of-the-aashto-90-day-salt-ponding-test 10/10
1248 P.F. McGrath, R.D. Hooton / Cement and Concrete Research 29 (1999) 1239–1248
and the chloride ponding test suggests that a conduc-
tion-type test might be a useful indicator of long-term
chloride penetration, even though processes such as
binding are not considered in the rapid tests.
Acknowledgments
The authors would like to acknowledge the financial sup-
port of Lafarge Canada, the Natural Science and Engineer-
ing Research Council of Canada (NSERC), and the Ontario
Centre of Materials Research (OCMR).
References
[1] D. Whiting, Rapid determination of the chloride ion permeability of
concrete, Final Report No. FHWA/RD-81/119, Federal Highway Ad-
ministration, 1981.
[2] D.W. Pfeifer, D.B. McDonald, P.D. Krauss, The rapid chloride per-
meability test and its correlation to the 90-day chloride ponding test,
PCI J 41 (4) (1994) 82–95.
[3] M.J. Scanlon, M.R. Sherman, Fly ash concrete: An evaluation of chloride penetration testing methods, Concr Int 18 (6) (1996) 57–62.
[4] M. Geiker, N. Thaulow, P.J. Anderson, Assessment of rapid chloride
permeability test of concrete with and without mineral admixtures,
Fifth Internationall Conference on Durability of Building Materials
and Components, Brighton, UK, 1990.
[5] C. Andrade, Calculation of chloride diffusion coefficients in concrete
from ionic migration measurements, Cem Concr Res 23 (3) (1993)
724–742.
[6] P.F. McGrath, Development of Test Methods for Predicting Chloride
Penetration into High Performance Concrete, Ph.D. Thesis, Univer-
sity of Toronto, Toronto, Canada, 1996.
[7] C.H. Pun, Influence of Silica Fume on Chloride Resistance of Con-
crete, Master of Applied Science Thesis, University of Toronto, Tor-
onto, Canada, 1997.
[8] P.F. McGrath, R.D. Hooton, Influence of binder composition on du-
rability of concrete, Fourth CANMET/ACI International Conference
on Durability of Concrete, Sydney, Australia, August 1997, pp. 331–
345.
[9] R.D. Hooton, P. Pun, T. Kojundic, P. Fidjestol, Influence of silica
fume on chloride resistance of concrete, Proceedings of the PCI/ FHWA International Symposium on High Performance Concentra-
tion, New Orleans, LA, October 1997, pp. 245–256.
[10] J.G.M. Wood, J.R. Wilson, D.S. Leek, Improved testing for chloride
ingress resistance of concretes and relation of results to calculated be-
havior, Third International Conference on Deterioration and Repair of
Reinforced Concrete in the Arabian Gulf, Bahrain Society of Engi-
neering and CIRIA, October 1989.
[11] H.A. Berman, Determination of chloride in hardened portland cement
paste, mortar, and concrete, J Mater 7 (3) (1972) 330–335.
[12] P.B. Bamforth, Prediction of the onset of reinforcement corrosion due
to chloride ingress, Proceedings of Concrete Across Borders,
Odemse, Denmark, 1994.
[13] M. Maage, S. Helland, J.E. Carlsen, Chloride penetration in high per-
formance concrete exposed to marine environment, in: I. Holand, E.
Sellevold (Eds.), Utilization of High Strength Concrete Proceedings,Lillehammer, Norway, June 20, 1993, pp. 836–846.
[14] P.S. Mangat, B.T. Molloy, Prediction of long term chloride concen-
tration in concrete, Mater Struct 27 (1994) 338–346.
[15] L. Tang, L-O. Nilsson, Chloride diffusivity in high strength concrete,
Nord Concr Res 11 (1992) 162–170.
[16] G.K. Glass, N.R. Buenfeld, Chloride threshold levels for corrosion in-
duced deterioration of steel in concrete, Chloride Penetration into Con-
crete, International RILEM Workshop, St. Remy-Les Chevreuse, 1995.
[17] R.D. Hooton, Discussion of the rapid chloride permeability test and
its correlation to the 90-day chloride ponding test, PCI J 42 (3) (1997)
65–66.
Recommended