Radio in the bush A study of radio listening in remote Western AustraliaMAY 2017

Canberra Red Building Benjamin Offices Chan Street Belconnen ACT
PO Box 78 Belconnen ACT 2616
T +61 2 6219 5555 F +61 2 6219 5353
Melbourne Level 32 Melbourne Central Tower 360 Elizabeth Street Melbourne VIC
PO Box 13112 Law Courts Melbourne VIC 8010
T +61 3 9963 6800 F +61 3 9963 6899
Sydney Level 5 The Bay Centre 65 Pirrama Road Pyrmont NSW
PO Box Q500 Queen Victoria Building NSW 1230
T +61 2 9334 7700 or 1800 226 667 F +61 2 9334 7799
Copyright notice
http://creativecommons.org/licenses/by/3.0/au/
With the exception of coats of arms, logos, emblems, images, other third-party material or devices protected by a trademark, this content is licensed under the Creative Commons Australia Attribution 3.0 Licence.
We request attribution as: © Commonwealth of Australia (Australian Communications and Media Authority) 2017.
All other rights are reserved.
The Australian Communications and Media Authority has undertaken reasonable enquiries to identify material owned by third parties and secure permission for its reproduction. Permission may need to be obtained from third parties to re-use their material.
Written enquiries may be sent to:
Manager, Editorial and Design PO Box 13112 Law Courts Melbourne VIC 8010 Tel: 03 9963 6968 Email: [email protected]
Contents
acma | iii
Overview 1
Background 1
ACMA research program 2
researchacma 2
About the research 2
Methodology 2
Research parameters 3
Key findings 4
Radio listening in remote WA 4
Availability of radio stations and listening preferences 7
Radio an important source of information in an emergency 10
Radio as a source of local news in remote WA 12
Appendix A—Populations of remote and very remote WA 15
Appendix B—Research design and sample frames 16
Appendix C—Remoteness 17
Appendix D—Regional and national breakdowns by age 19
Appendix E—Data by area of remoteness 20

acma | 1
Overview
This report explores radio use and listening habits in remote Western Australia (WA),
regional Australia and nationally. The research was undertaken by the ACMA in 2016
to contribute to an evidence base on the role of AM radio in the contemporary
communications environment.
Broadly, the research shows that AM and FM radio is popular in remote WA, with
71 per cent of adults listening to AM and 80 per cent listening to FM in the past six
months, either at home or in the car. While FM listening is comparable with levels
in regional Australia and nationally, AM radio listening is significantly higher in
remote WA.
People in remote WA spend significantly more time listening to the radio (AM, FM and
online) than the nation as a whole. The number of hours spent listening to AM radio in
the bush (6.9 hours/past seven days) is double the regional and national levels.
Remote Western Australians spend more time listening to AM/FM radio in the car than
at home. Large distances and dispersed towns in remote WA provide some
explanation for this, coupled with the wider availability of AM transmission compared to
FM, which is limited in its capability to service large areas.
A greater proportion of older remote Western Australians listen to AM radio; however,
FM radio is more popular among younger adults. This pattern is similar in regional
Australia and nationally.
The research shows that preferences for radio listening in remote WA are linked to
availability. ABC Local Radio and Triple J are the top two most widely available and
most often-listened to radio stations in remote WA. ABC Local Radio is also identified
as a key information source in emergency situations and an important source of local
news for people in remote WA.
Background The ACMA conducted research to provide information on radio listening in remote
Australia. In particular, the ACMA sought to better understand the reliance Australians
living in remote areas place on radio to deliver news and emergency information.
The ACMA recently published its new approach to approving AM to FM conversions of
commercial radio broadcasting stations in single licensee markets. This research
illustrates the importance of AM radio coverage in remote parts of Australia. These
findings informed the design of regulatory arrangements for infill transmitters to be
established to ameliorate coverage loss that may occur when moving from AM to FM.

2 | acma
ACMA research program
researchacma Our research program—researchacma—underpins the ACMA’s work and decisions as
an evidence-informed regulator. It contributes to the ACMA’s strategic policy
development, regulatory reviews and investigations, and helps the ACMA better
understand its role in fulfilling its strategic intent to make media and communications
work for all Australians.
researchacma has five broad areas of interest:
market developments
media content and culture
social and economic participation
citizen and consumer safeguards
regulatory best practice and development.
This research contributes to the ACMA’s market developments research theme.
About the research This research was conducted as part of the ACMA’s 2016 Annual Consumer Survey.
In May 2016, the ACMA commissioned Omnipoll to conduct the ninth survey to
monitor changes in use of telecommunications services and media. A series of
questions were added to the national survey to explore AM radio use and listening
habits in regional and remote areas of Australia.
Methodology In 2016, a total of n=351 computer-assisted telephone interviews (CATI) were
conducted with a sample of Australians aged 18 years and older living in remote or
very remote WA. WA was selected as an appropriate geographical area to collect data
about radio use in dispersed and isolated areas, noting that remote areas cover vast
and far-reaching parts of this state. The research was conducted in three distinct areas
of remote WA—very remote, remote, and the urban centres of Karratha, Port Hedland,
Broome and Esperance. The sample breakdowns for each area are provided on
page 3, with estimated population figures listed in Appendix A.
The vast majority (92 per cent) of the sample had one usual place of residence in
remote or very remote WA; the remaining eight per cent had another place of
residence (six per cent in WA and two per cent outside WA). The eight per cent with
another place of residence most likely represents fly-in fly-out workers.
Detailed quotas were set based on Australian Bureau of Statistics (ABS) estimated
residential population (ERP) June 2015 data in order to ensure the sample was
representative by each area, age and gender.
Households were recruited through random-digit dialling using a dual-frame sample
design, and included those who live in a household with a fixed-line telephone (50 per
cent) and those who have a mobile phone (50 per cent). A random selection
procedure recruited eligible participants within households for the landline sample (last
birthday). The mobile-only sample interviewed the main user of the mobile phone. The
fieldwork was conducted between 24 May and 7 June 2016.

acma | 3
To reflect the population distribution, the results were post-weighted and projected to
ABS data on age, sex and area.
For more details on the research design and sample, refer to Appendix B.
Research parameters Definition of ‘remote WA’
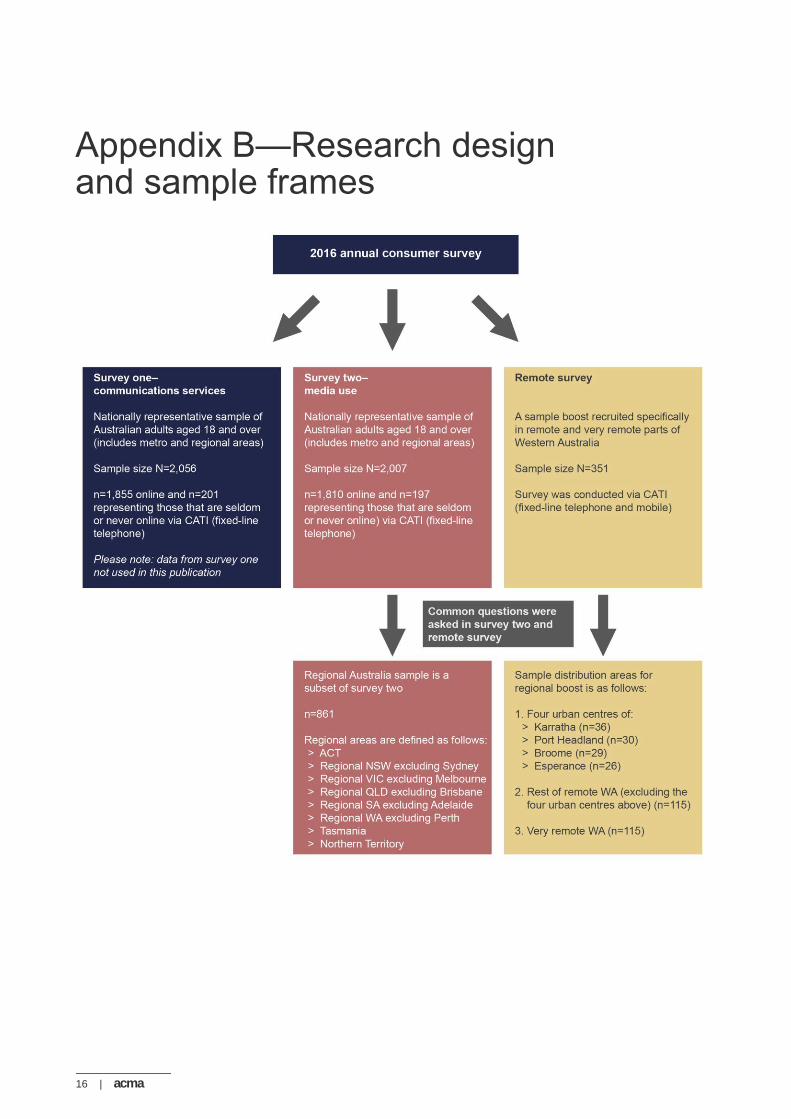
For the purposes of this research, remote WA (n=351) includes:
four urban centres—Karratha, Port Headland, Broome and Esperance (n=121)
rest of remote WA (excluding the four urban centres of Karratha, Port Hedland,
Broome and Esperance) (n=115)
very remote WA (n=115).1
This definition of remote is not the same as the ACMA’s definition of the Remote
Western Australia Radio licence area.
For further information about remoteness, refer to Appendix C, Figure 11.
Definitions of ‘regional’ and ‘national’
The two additional samples referred to in the report include national and regional
Australia.
The national sample (n=2,007) is drawn from the 2016 Annual Consumer Survey
recruited to complete survey two on media use; n=1,810 online and n=197
(representing those that are seldom or never online) via CATI (fixed-line telephone).
The regional sample (n=861) is a subset of the national sample described above and
includes the following regions:
Australian Capital Territory
Regional New South Wales, excluding Sydney
Regional Victoria, excluding Melbourne
Regional Queensland, excluding Brisbane
Regional South Australia, excluding Adelaide
Regional Western Australia, excluding Perth
Tasmania
Northern Territory.
Radio listening in the car or at home
Radio listening is separated into two categories, with the key distinction between
listening to radio in the car or at home. The complete definition for the two variables is:
listening to radio in the car or another vehicle
listening to radio at home or elsewhere.
1 ABS Census Collection Districts ARIA+ value ranges used as a nationally consistent measure of
geographic remoteness. Remoteness ARIA+ values for Remote Australia is greater than 5.92 and less than
or equal to 10.53, and for Very Remote Australia greater than 10.53.

4 | acma
Key findings
Radio listening in remote WA Two-thirds of remote Western Australians surveyed have a radio at home, compared
to 87 per cent of regional Australians and 79 per cent nationally. The vast majority of
remote Western Australians surveyed (91 per cent) had listened to the radio in the
past six months, with similar listenership at regional and national levels (90 per cent
each).
AM and FM radio listening is popular in remote WA
Eight in 10 remote Western Australians surveyed listen to FM radio, which is
comparable to the proportions listening regionally (82 per cent) and nationally (81 per
cent). Seventy-one per cent of remote Western Australians listen to AM radio—
significantly higher than regionally (46 per cent) and nationally (47 per cent). Almost a
third (29 per cent) of remote Western Australians listen to the radio online, with similar
proportions doing so regionally (23 per cent) and nationally (24 per cent) (Figure 1).
Fifty-nine per cent of remote Western Australians listen to both AM and FM radio;
11 per cent only listen to AM radio; and 20 per cent listen exclusively to FM radio.
Figure 1: Radio listening at home or in the car, past six months (%)
Weighted base: WA remote sample N=351, Regional Australia sample N=861, total national sample N=2,007.
Question C4 (both surveys): Which of the following have you personally done in the past six months?
Music streaming is popular among younger adults in remote WA
Nearly a quarter (24 per cent) of remote Western Australians used an online music
service such as Spotify, Pandora or iTunes radio in the past seven days, compared
with 17 per cent regionally and 19 per cent nationally. Almost half (47 per cent) of
those aged 18 to 34 in remote WA used an online music streaming service in the past
seven days.

acma | 5
Adults in remote WA are frequent radio listeners
People in remote WA spend significantly more time listening to the radio than does the
nation as a whole. Eight in 10 (81 per cent) remote Western Australians listened to the
radio in the past seven days, spending 13.9 hours on average, compared to 8.5 hours
regionally and 8.6 nationally.
The difference is particularly pronounced for AM radio, with people in the bush
spending more than double the time listening to AM radio than those regionally or
nationally—6.9 hours compared to three hours (Figure 2).
Figure 2: Average time spent per radio activity, past seven days
Weighted base: WA remote sample N=351 (includes those n=280 who had listened to any form of radio in the last seven days), Regional Australia sample N=861 (includes those n=724 who had listened to any form of radio in the last seven days), and the total national sample N=2,007 (includes those n=1,717 who had listened to any form of radio in the last seven days).
Question C6 (both surveys): How many hours have you spent doing each of the following in the past 7 days?
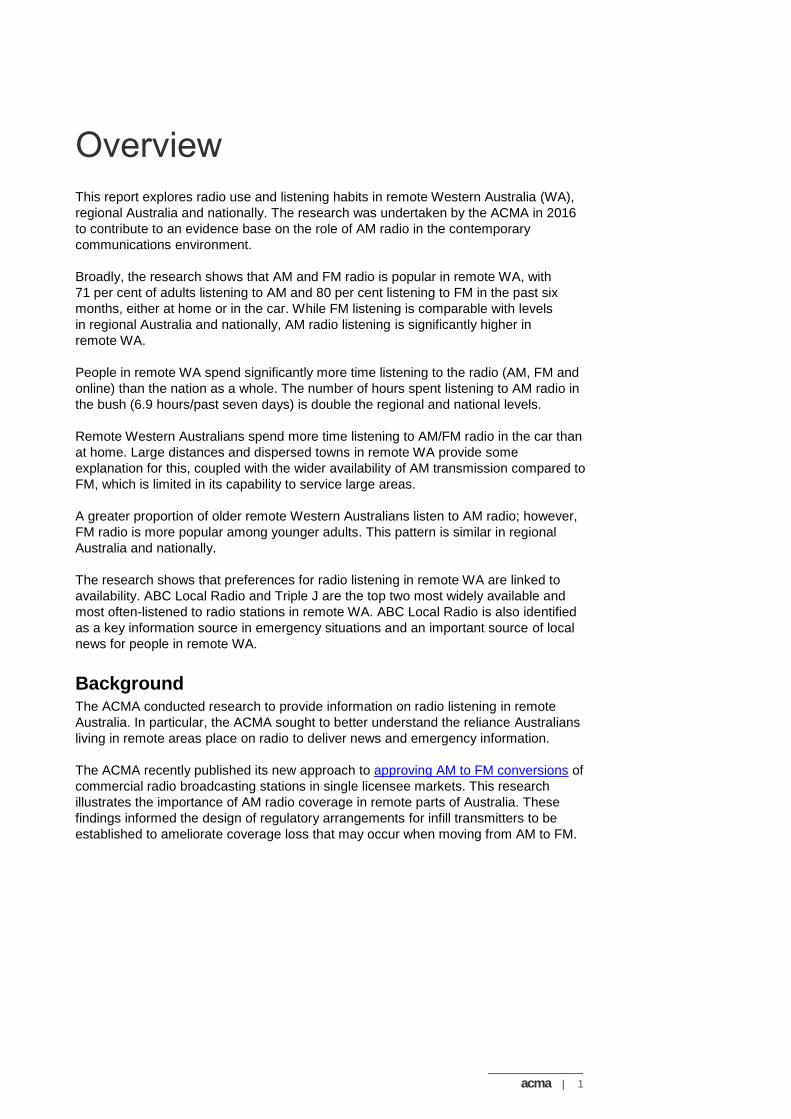
Adults in remote WA spend most of their AM/FM radio listening time in the car
Most of the total time remote Western Australians spend listening to AM/FM radio
(12.9 hours on average/past seven days) is in the car (eight hours), compared to at
home (4.9 hours). The time spent listening to AM/FM radio in the car is significantly
lower at regional (3.3 hours) and national (3.4 hours) levels (Figure 3).
Compared to regional Australia and nationally, the difference is particularly notable for
AM radio—4.5 hours of AM radio listening occurs in the car in remote WA, compared
to just under an hour (0.9) regionally and an hour (1.0) nationally. On the other hand,
FM radio listening in the car is comparable, with 3.5 hours spent in remote WA
compared to 2.4 hours regionally and nationally.
6 | acma
Figure 3: Average time spent per AM/FM radio activity and location,
past seven days
Weighted base: WA remote sample N=351 (includes those n=280 who had listened to any form of radio in the last seven days), Regional Australia sample N=861 (includes those n=724 who had listened to any form of radio in the last seven days), and the total national sample N=2,007 (includes those n=1,717 who had listened to any form of radio in the last seven days).
Question C6 (both surveys): How many hours have you spent doing each of the following in the past 7 days?
AM radio listening increases with age; FM is popular among younger adults in
remote WA
The research shows only small variations in the number of total hours spent listening
to all forms of radio across different age groups in remote WA. However, listening
preferences varied across the different radio platforms.
The time spent listening to AM radio increases with age in remote WA, with those
aged 65 and over listening to 12.5 hours on average/past seven days. The time spent
listening to FM radio is highest for those aged 35–49 (7.4 hours) and 18–34 (7.1
hours) (Figure 4).
At the national level, the time spent listening to all forms of radio combined increases
significantly with age. FM radio dominates listening across all age groups nationally,
with the exception of those aged 65 and over—this older age group listens to AM radio
more than FM radio. A similar pattern is observed regionally. For more details on
national and regional breakdowns by age, please refer to Appendix D.

acma | 7
Figure 4: Average number of hours spent listening, by radio activity and age
for remote WA
Weighted base: All respondents in remote WA (18–34 n=67, 35–49 n=133, 50–64 n=95, 65+ n=56).
Question C6 (both surveys}: How many hours have you spent doing each of the following in the past 7 days?
By area of remoteness, adults living in remote WA (excluding the four urban centres of
Karratha, Port Hedland, Broome and Esperance) are spending considerably more time
listening to AM radio than their counterparts in the rest of remote and very remote WA.
This is particularly evident for AM radio listening in the car. For details on the area
breakdowns, refer to Appendix E.
Availability of radio stations and listening preferences National radio stations are reported as the most available in remote WA
Nearly three-quarters (74 per cent) of remote Western Australians reported that ABC
Local Radio is available in their area. More than six in 10 reported that they have
access to Triple J (63 per cent), and over half reported that ABC News Radio (56 per
cent) and ABC Radio National (53 per cent) are available (Figure 5).
For a more detailed breakdown by area, please refer to Appendix E.

8 | acma
Figure 5: Radio stations available in remote WA (%)
Weighted base: WA remote sample (N=351).
*Community radio station Hope FM is included in the category ‘Community radio stations’ (Hope FM was originally listed as a separate category for this question but was combined into the overall category for community radio stations).
Question C3(a): Which of the following radio stations are available where you live? (multi response)

acma | 9
In remote WA, national radio stations are most often listened to
ABC Local Radio (24 per cent) and Triple J (16 per cent) are the radio stations most
often listened to in remote WA (Figure 6).
Figure 6: Radio stations most often listened to (%)
Weighted base: WA remote sample (N=351).
Question C8: And which radio station do you most often listen to? (single response)
Listeners of ABC Local Radio tend to be older, with the majority of listeners aged 45
and over (77 per cent). By area of remoteness, the highest proportion of ABC Local
Radio listeners resided in ‘rest of remote WA’, which excludes the four urban centres
(42 per cent), followed by the four urban centres of Karratha, Port Headland, Broome
and Esperance (30 per cent) and ‘very remote WA’ (28 per cent).
Male listeners account for the majority of listeners of ABC Local Radio (69 per cent).
However, to some extent, this can be attributable to the higher number of males living
in remote WA—59 per cent compared to 41 per cent females.
Due to the small sample size representing Triple J listeners, it was not possible to
undertake more detailed demographic analysis of Triple J audiences by area or
gender.

10 | acma
Preferences for radio listening in remote WA linked to availability
There is a relationship between availability of radio stations and listening preferences,
with ABC Local Radio and Triple J the top two most widely available and most often-
listened to radio stations in remote WA. As shown in Figure 7, for remote Western
Australians, ABC Local Radio is the most listened to and most available. Triple J is the
second-ranked radio station for preference and availability.
ABC News Radio, ABC Radio National, ABC Classic FM and community radio stations
are available to relatively large proportions of people in remote WA, but have a lower
listenership (Figure 7).
Figure 7: Radio stations—availability vs listening preference
Weighted base: WA remote sample (N=351).
Question C3(a): Which of the following radio stations are available where you live? (multi response)
Question C8: And which radio station do you most often listen to? (single response)
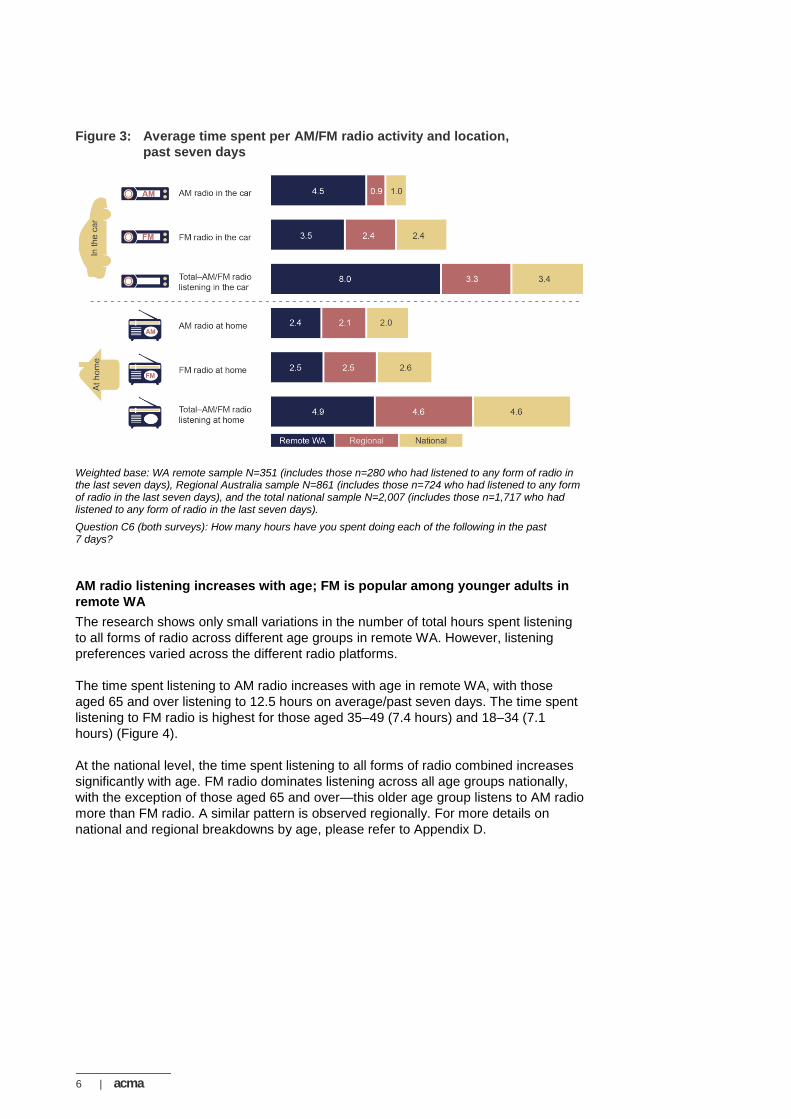
Radio an important source of information in an emergency Radio is identified as an important source of information in emergency situations.
Almost two-thirds (62 per cent) of remote Western Australians would turn to local ABC
radio if faced with an emergency, which is nearly double the proportion for regional
Australia (32 per cent).
As shown in Figure 8, the Bureau of Meteorology (74 per cent), fire and emergency
services (72 per cent), local ABC radio (62 per cent) and social media (46 per cent)
are the most common sources that remote Western Australians would use for up-to-
date information in an emergency. For regional Australians, the most common sources
would be fire and emergency services (43 per cent), commercial radio (33 per cent),
the Bureau of Meteorology (32 per cent) and local ABC radio (32 per cent).
acma | 11
Figure 8: Sources of information people would use in emergency (%)
Weighted base: remote WA sample n=351, regional Australia n=861.
Question E6 (both surveys): Thinking now about being in an emergency, such as a bush fire, storm, flood or cyclone, where would you go to get up-to-date information about what to do? (multi response)

12 | acma
Two-thirds of remote Western Australians reported having experienced emergency
situations (fire or weather event) in the last 10 years, compared with 38 per cent in
regional Australia. For this group, the Bureau of Meteorology (51 per cent) was the
most often reported source, followed by local ABC radio (45 per cent) (Table 1).
Table 1: Sources used for up-to-date news during an emergency
Remote WA % Regional Australia %
Bureau of Meteorology 51 29
Local ABC radio 45 33
Received phone calls or SMS from friends, neighbours …
41 21
Social media 28 28
Commercial TV 26 19
Received phone calls or SMS from fire and/or emergency services
25 23
Friends, neighbours came to knock at our door 25 11
Have contacted fire and emergency services 22 10
Commercial radio 17 32
Community radio 16 16
ABC website 16 6
Some officials (council, fire and emergency services) came to knock at our door
14 8
Local council website 13 6
Any commercial TV station website 11 5
Local newspaper website 5 5
Emergency services websites, updates online, on apps
5 2
I am part of the emergency services 4 0
Through work, work has an emergency service 3 0
Use alert system, sirens 3 0
Use two-way radio, CB radio 2 0
Other 4 8
Weighted base: respondents who had experienced an emergency in the past 10 years (remote WA sample n=233, regional Australia sample n=324).
Question E8: When you were in this emergency situation, how did you get up-to-date information about what to do? (multi response)
Radio as a source of local news in remote WA The ACMA has also undertaken broader research to explore consumer awareness of,
use of and preferences for accessing local content and local news in regional
Australia, as well as how important they perceive this content to be. Findings from the
Local content in regional Australia report series will be published in May 2017.
Radio is a key source of local news in remote WA
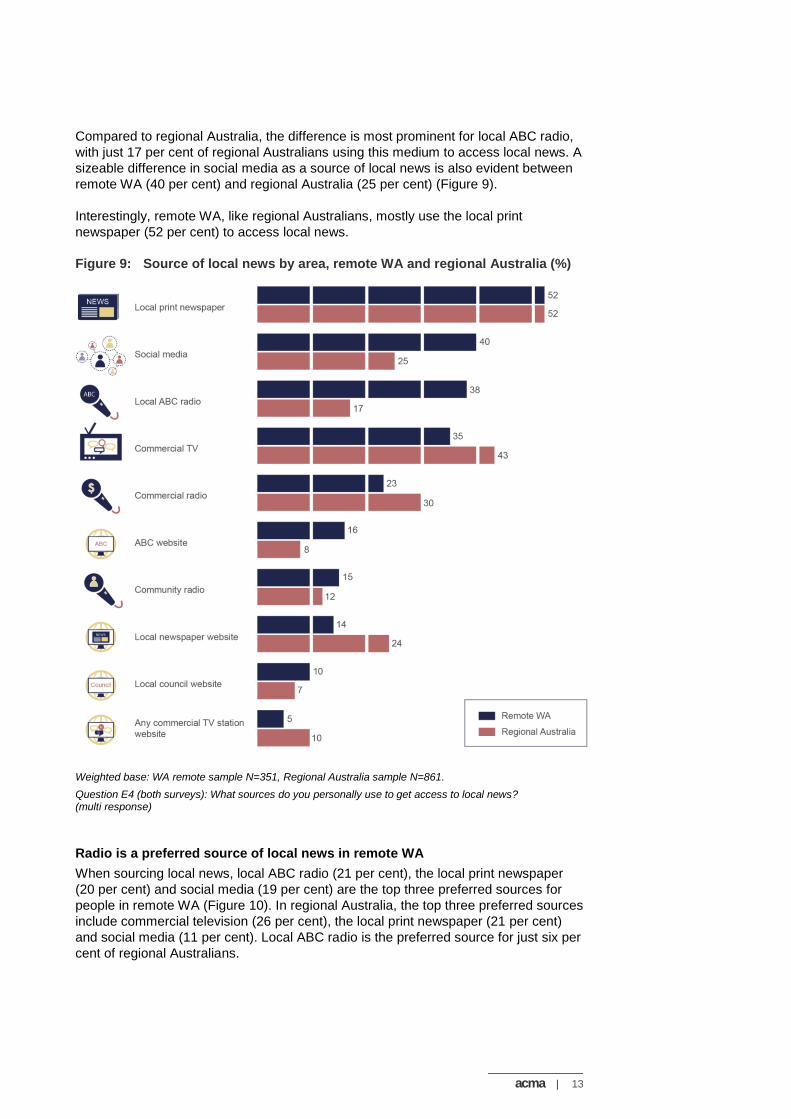
In remote WA, the local print newspaper is the number one source for local news
(52 per cent), followed by social media (40 per cent), local ABC radio (38 per cent),
and commercial TV (35 per cent).
acma | 13
Compared to regional Australia, the difference is most prominent for local ABC radio,
with just 17 per cent of regional Australians using this medium to access local news. A
sizeable difference in social media as a source of local news is also evident between
remote WA (40 per cent) and regional Australia (25 per cent) (Figure 9).
Interestingly, remote WA, like regional Australians, mostly use the local print
newspaper (52 per cent) to access local news.
Figure 9: Source of local news by area, remote WA and regional Australia (%)
Weighted base: WA remote sample N=351, Regional Australia sample N=861.
Question E4 (both surveys): What sources do you personally use to get access to local news? (multi response)
Radio is a preferred source of local news in remote WA
When sourcing local news, local ABC radio (21 per cent), the local print newspaper
(20 per cent) and social media (19 per cent) are the top three preferred sources for
people in remote WA (Figure 10). In regional Australia, the top three preferred sources
include commercial television (26 per cent), the local print newspaper (21 per cent)
and social media (11 per cent). Local ABC radio is the preferred source for just six per
cent of regional Australians.

14 | acma
Figure 10: Preferred source of local news (%)
Base: WA remote sample N=351; Regional Australia N=861.
Question E5 (both surveys): Now imagine you could use any source to get access to local news. What would be your preferred source for local news?

acma | 15
Appendix A— Populations of remote and very remote WA
Table 2: Population of very remote WA
Age Male Female Total
18–24 3,764 2,386 6,150
25–34 8,472 4,637 13,109
35–49 10,424 5,120 15,544
50–64 6,421 3,466 9,887
65+ 3,100 1,934 5,034
Total 18+ 32,181 17,543 49,724
Table 3: Population of remote WA excluding four urban centres
(Broome, Karratha, Port Hedland and Esperance)
Age Male Female Total
18–24 1,632 1,225 2,857
25–34 2,939 2,740 5,679
35–49 5,191 4,597 9,788
50–64 5,063 3,919 8,982
65+ 3,978 3,176 7,154
Total 18+ 18,803 15,657 34,460
Table 4: Population of four urban centres of Broome, Karratha, Port Hedland
and Esperance
Age Male Female Total
18–24 2,586 2,439 5,025
25–34 5,081 4,646 9,727
35–49 7,411 5,882 13,293
50–64 4,824 3,545 8,369
65+ 2,562 2,111 4,673
Total 18+ 22,464 18,623 41,087
16 | acma
Appendix B—Research design and sample frames

acma | 17
Appendix C—Remoteness
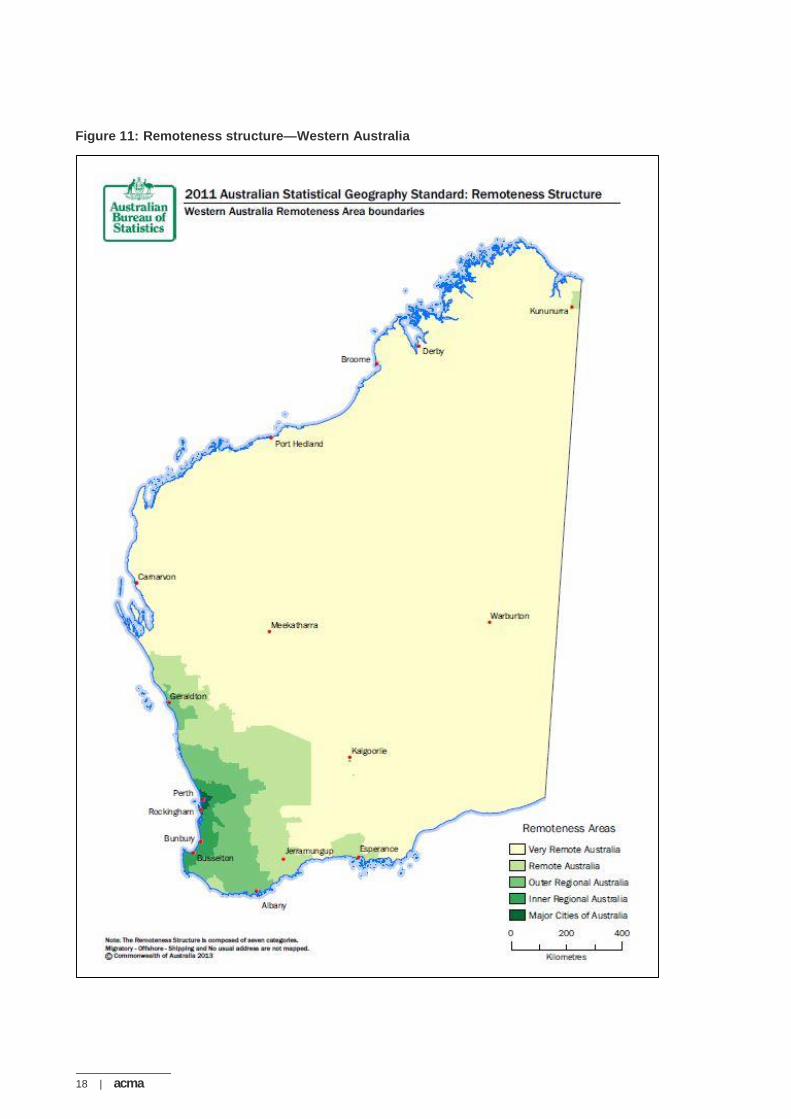
The concept of remoteness used in this research is based on the Australian Bureau of
Statistics Australian Statistical Geography Standard (ASGS): Volume 5—Remoteness
Structure.2 The Remote and Very Remote areas of WA are coloured very light green
and yellow respectively on the map shown in Figure 11.
According to ABS 2011 Census data, there are almost 61,000 people living in Very
Remote WA and just over 95,000 people living in Remote WA. There is a higher male
(57 per cent) to female (43 per cent) ratio across both areas, with a median age of 33
in Very Remote WA and 35 in Remote WA.
2 ABS Cat 1270.0.55.005
18 | acma
Figure 11: Remoteness structure—Western Australia

acma | 19
Appendix D—Regional and national breakdowns by age
Table 5: Average number of hours by radio activity and age, nationally
Radio activity 18–34 35–49 50–64 65+
AM radio in the car or another vehicle 0.3 0.9 1.7 1.5
AM radio at home or somewhere else (but not in a vehicle) 0.4 1.2 2.1 6.0
FM radio in the car or another vehicle 2.7 2.6 2.5 1.3
FM radio at home or somewhere else (but not in a vehicle) 2.5 2.6 2.9 2.5
Radio online 0.5 1.0 0.6 0.3
Total hours 6.4 8.3 9.8 11.6
Weighted base: All respondents in remote WA (18–34 n=496, 35–49 n=472, 50–64 n=532, 65+ n=507).
Question C6: How many hours have you spent doing each of the following in the past 7 days?
Table 6: Average number of hours by radio activity and age, regionally
Radio activity 18–34 35–49 50–64 65+
AM radio in the car or another vehicle 0.1 0.5 1.7 1.5
AM radio at home or somewhere else (but not in a vehicle) 0.5 1.0 1.5 6.3
FM radio in the car or another vehicle 3.0 2.4 2.6 1.6
FM radio at home or somewhere else (but not in a vehicle) 2.1 2.5 2.9 2.5
Radio online 0.3 0.6 0.8 0.5
Total hours 6.0 7.0 9.5 12.4
Weighted base: All respondents in remote WA (18–34 n=183, 35–49 n=192, 50–64 n=238, 65+ n=248)
Question C6: How many hours have you spent doing each of the following in the past 7 days?
20 | acma
Appendix E— Data by area of remoteness
Table 7: Radio listening at home or in the car, past six months, by area of
remoteness (%)
Radio activity Four centres in
remote WA
Rest of remote WA (excl. four
centres)
Very remote WA
FM radio 84 72 81
AM radio 65 80 69
Radio online 29 22 34
None of these activities 7 10 9
Weighted base: All respondents in remote WA (four centres n=121, rest of remote WA n=115, very remote WA n=115).
Question C4: Which of the following have you personally done in the past six months?
Table 8: Average number of hours by radio activity and area
(remote WA, regional and national)
Radio activity Four centres in
remote WA
Rest of remote WA (excl. four
centres)
Very remote WA
Regional National
AM radio in the car or another vehicle 2.7 8.6 3.2 0.9 1.0
AM radio at home or somewhere else (but not in a vehicle)
2.0 2.9 2.4 2.1 2.0
FM radio in the car or another vehicle 2.9 2.0 5.1 2.4 2.4
FM radio at home or somewhere else (but not in a vehicle)
3.8 0.8 2.6 2.5 2.6
Radio online 1.1 0.9 0.9 0.6 0.6
Total hours 12.5 15.2 14.2 8.5 8.6
Weighted base: All respondents in remote WA (four centres n=121, rest of remote WA n=115, very remote WA n=115), regional Australia N=861, and national sample N=2,007.
Q6: How many hours have you spent doing each of the following in the past 7 days?
acma | 21
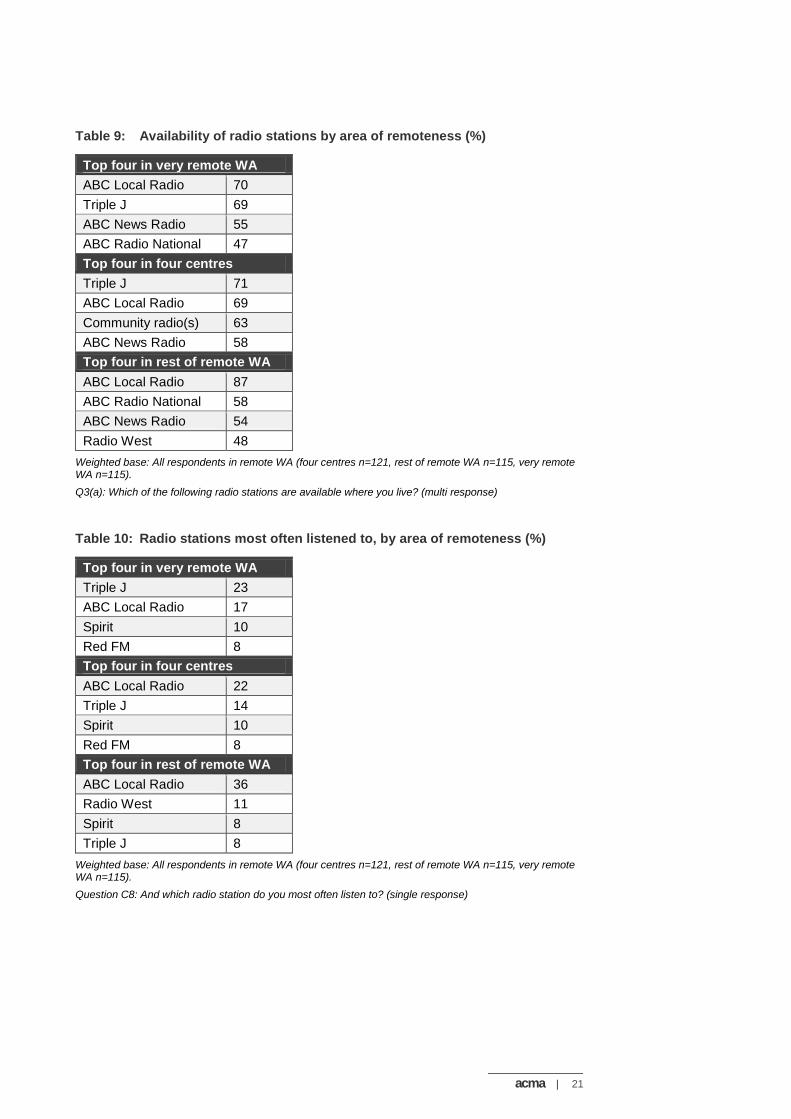
Table 9: Availability of radio stations by area of remoteness (%)
Top four in very remote WA
ABC Local Radio 70
Triple J 69
ABC News Radio 55
ABC Radio National 47
Top four in four centres
Triple J 71
ABC Local Radio 69
Community radio(s) 63
ABC News Radio 58
Top four in rest of remote WA
ABC Local Radio 87
ABC Radio National 58
ABC News Radio 54
Radio West 48
Weighted base: All respondents in remote WA (four centres n=121, rest of remote WA n=115, very remote WA n=115).
Q3(a): Which of the following radio stations are available where you live? (multi response)
Table 10: Radio stations most often listened to, by area of remoteness (%)
Top four in very remote WA
Triple J 23
ABC Local Radio 17
Spirit 10
Red FM 8
Top four in four centres
ABC Local Radio 22
Triple J 14
Spirit 10
Red FM 8
Top four in rest of remote WA
ABC Local Radio 36
Radio West 11
Spirit 8
Triple J 8
Weighted base: All respondents in remote WA (four centres n=121, rest of remote WA n=115, very remote WA n=115).
Question C8: And which radio station do you most often listen to? (single response)

22 | acma
Table 11: Sources of information people would use in emergency, by area of
remoteness (%)
Top four in very remote WA
Fire and emergency services 77
Bureau of Meteorology 75
Local ABC radio 61
Social media 51
Top four in four centres
Bureau of Meteorology 82
Local ABC radio 64
Fire and emergency services 63
Social media 51
Top four in rest of remote WA
Fire and emergency services 76
Bureau of Meteorology 64
Local ABC radio 59
Commercial radio 32
Weighted base: All respondents in remote WA (four centres n=121, rest of remote WA n=115, very remote WA n=115).
Question E6: Thinking now about being in an emergency, such as a bush fire, storm, flood or cyclone, where would you go to get up-to-date information about what to do? (multi response)
Table 12: Sources used for up-to-date news in emergency, by level of
remoteness (%)
Top four in very remote WA
Bureau of Meteorology 48
Local ABC radio 47
Received phone calls or SMS from friends, neighbours, etc. 42
Friends, neighbours came to knock at our door 27
Top four in four centres
Local ABC radio 49
Received phone calls or SMS from friends, neighbours, etc. 42
Bureau of Meteorology 37
Commercial TV 34
Top four in rest of remote WA
Received phone calls or SMS from friends, neighbours, etc. 39
Bureau of Meteorology 36
Local ABC radio 34
Received phone calls or SMS from fire and emergency services 32
Weighted base: respondents who had experienced an emergency in the past 10 years (four centres n=92, rest of remote WA n=56, very remote WA n=85).
Question E8: When you were in this emergency situation, how did you get up-to-date information about what to do? (multi response)

acma | 23
Table 13: Local news sources—personally used and the preferred source, by
area of remoteness (%)
Top four in very remote WA
Sources used
Preferred source
Social media 45 23
Local print newspaper 40 13
Commercial TV 38 19
Local ABC radio 34 21
Top four in four centres
Local print newspaper 60 20
Social media 44 16
Local ABC radio 38 20
Commercial TV 37 11
Top four in rest of remote WA
Local print newspaper 58 32
Local ABC radio 43 21
Commercial TV 29 15
Social media 28 17
Base: All respondents in remote WA (four centres n=121, rest of remote WA n=115, very remote WA n=115).
Question E4: What sources do you personally use to get access to local news? (multi response)
Question E5: Now imagine you could use any source to get access to local news. What would be your preferred source for local news?

acma.gov.au
CanberraRed Building Benjamin Offices Chan Street Belconnen ACT
PO Box 78 Belconnen ACT 2616
T +61 2 6219 5555F +61 2 6219 5353
MelbourneLevel 32 Melbourne Central Tower 360 Elizabeth Street Melbourne VIC
PO Box 13112 Law Courts Melbourne VIC 8010
T +61 3 9963 6800 F +61 3 9963 6899
SydneyLevel 5 The Bay Centre 65 Pirrama Road Pyrmont NSW
PO Box Q500 Queen Victoria Building NSW 1230
T +61 2 9334 7700 1800 226 667 F +61 2 9334 7799
Recommended

![Announcer: Bulletproof Radio. A state of high …...Announcer: Bulletproof Radio. A state of high performance. Dave: You're listening to Bulletproof Radio with Dave [inaudible 00:00:15]](https://img.pdfslide.us/doc/110x75/5f05a4337e708231d413f915/announcer-bulletproof-radio-a-state-of-high-announcer-bulletproof-radio.jpg)