Embed Size (px)
Citation preview
March 2011

ContentsRadio Summary 2010 - Useful Facts• Revenue• Listening• Digital
Radio Engagement & Connection• 2011 Brand Strategy and Campaign - Overview• Supporting Research:
Neuro Insight Radio Engagement Study The Hoop Group Research

Increase in metro commercial radio revenue
• Metropolitan advertising revenue up 7.8%* from Jan-Dec 2009.• All five metro markets recorded significant increases in advertising
spend, with the biggest performers in Perth, Sydney & Brisbane*.• Radio revenue comprised of 7.1%** of the total expenditure in main
media – exceeding outdoor, cinema and magazine spend.
Radio in 2010 Summary – Revenue
* Source: Deloitte Jan to Dec 2010** Source: CEASA Advertising Expenditure Report Jan to June 2010
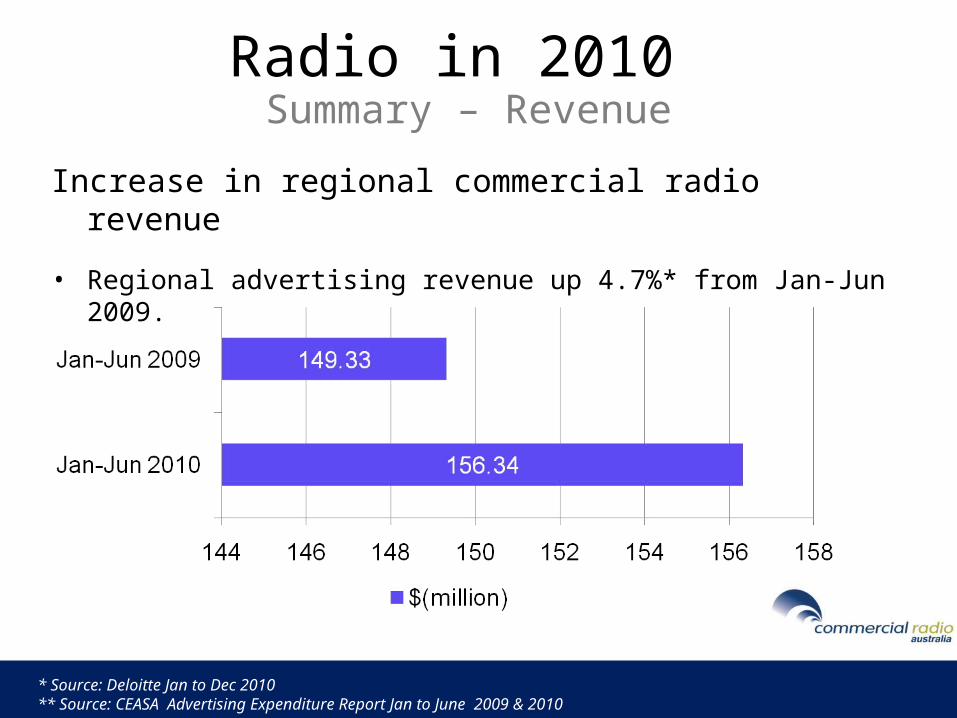
Increase in regional commercial radio revenue
• Regional advertising revenue up 4.7%* from Jan-Jun 2009.
Radio in 2010 Summary – Revenue
* Source: Deloitte Jan to Dec 2010** Source: CEASA Advertising Expenditure Report Jan to June 2009 & 2010

2010 was a strong year for commercial radio listening
• Metropolitan surveys recorded commercial radio listening at 9.19* million people each week.
• This is an increase of 2.8%* or 250 000* listeners when compared with 2009.
Radio in 2010 Summary - Listening
* Source: The Nielsen Company Radio Ratings Survey #1 to #8 2009 & 2010. Based on All People Aged 10+ Mon-Sun 5.30am to midnight
2010 was a positive year for digital radio listening
• Over 400,000* digital radios in the marketplace.• 691,000** listeners to radio via a DAB+ device each week (5.6% of
the total metropolitan population).• Time spent listening to digital radio double the TSL of listening via
the Internet. • There are up to 20 new digital only stations in the metro markets.
• The second Digital Radio Industry Report was released by CRA in March 2011. Visit digitalradioplus.com.au to download.
Radio in 2010 Summary - Digital
* In the market supply chain (chip maker, manufacturer, and retailer) supported by GfK sales data, and Frontier Silicon (80-90% of DAB+ chip market) reports. ** Source: The Nielsen Company Radio Ratings Survey #8 2010 (Brisbane) and Survey #1 2011 (S,M,A,P). Based on All People Aged 10+ . Mon-Sun 5.30am to midnight

Radio Engagement & Connection2011 Brand Strategy and Campaign - Overview
Objectives:
• Promote radio as an engaging, influential medium.
• Ensure radio is top of mind with advertisers and included in media campaigns.
• Give creative agency staff a new way of approaching the development of radio commercials.
• Increase radio share of advertising revenue.
Radio Engagement & Connection2011 Brand Strategy and Campaign - Overview
People are 32% more engaged with their favourite radio station than they are with other media content
Radio Engagement & Connection2011 Brand Strategy and Campaign - Overview
* Source: Neuro Insight Pty Ltd Radio Engagement Study 2010
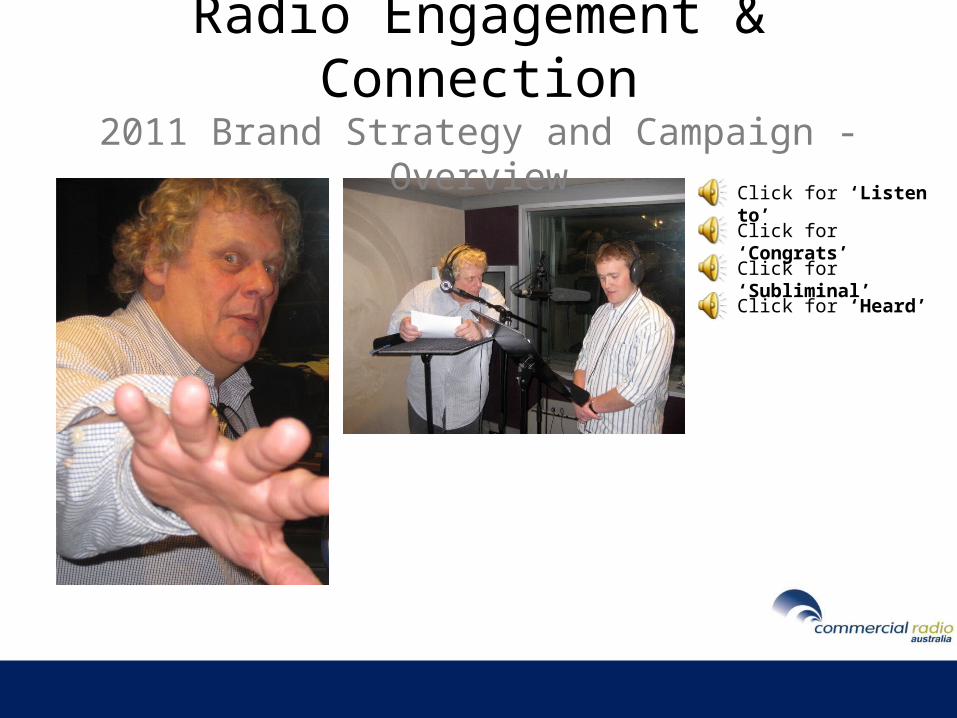
Radio Engagement & Connection2011 Brand Strategy and Campaign - Overview
Click for ‘Listen to’
Click for ‘Congrats’
Click for ‘Subliminal’
Click for ‘Heard’

Radio Engagement & ConnectionNeuro Insight Radio Engagement Study

Radio Engagement & ConnectionNeuro Insight Radio Engagement Study - Methodology
Commercial Radio Australia’s latest research project investigates:
• The neuro state of radio listeners• Consumer engagement with actual radio content
Neuro Insight has previously undertaken neuro studies for major media groups such as:
• EYE Corp • SBS• Channel 9• ACP
* Source: Neuro Insight Pty Ltd Radio Engagement Study 2010
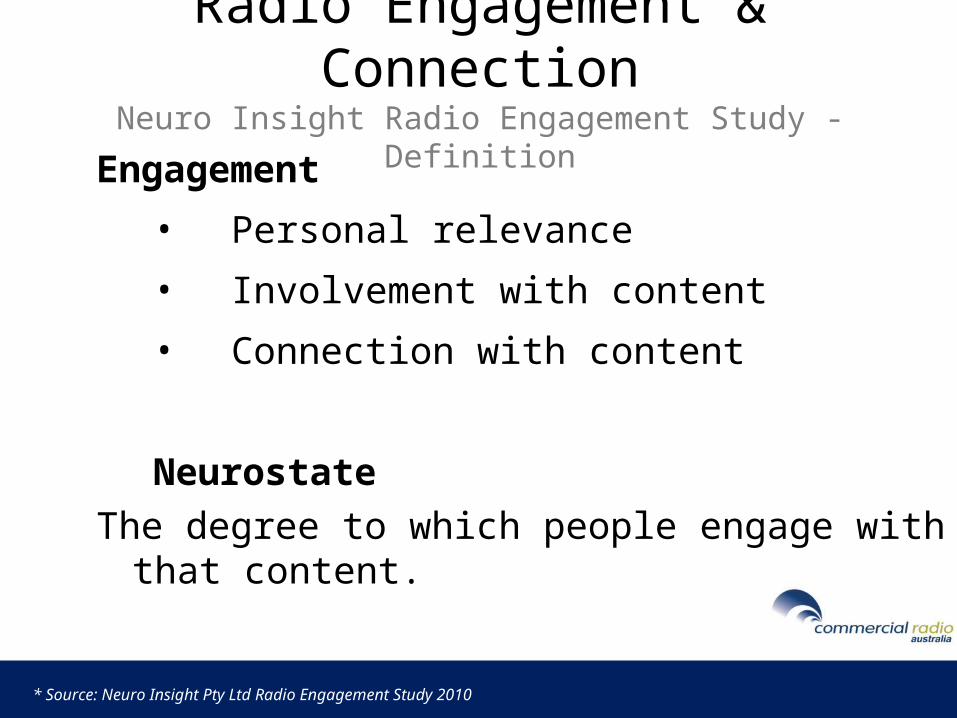
Radio Engagement & ConnectionNeuro Insight Radio Engagement Study - Definition
Engagement
• Personal relevance
• Involvement with content
• Connection with content
Neurostate
The degree to which people engage with that content.
* Source: Neuro Insight Pty Ltd Radio Engagement Study 2010
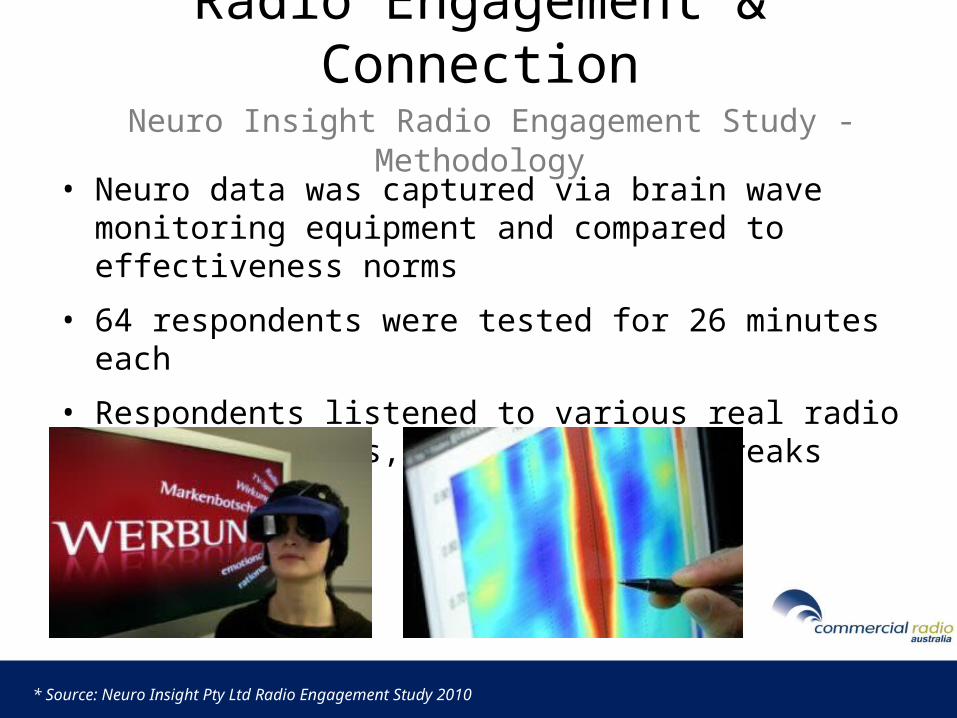
Radio Engagement & Connection Neuro Insight Radio Engagement Study - Methodology
• Neuro data was captured via brain wave monitoring equipment and compared to effectiveness norms
• 64 respondents were tested for 26 minutes each
• Respondents listened to various real radio program formats, content and ad breaks
* Source: Neuro Insight Pty Ltd Radio Engagement Study 2010

Radio Engagement & Connection Neuro Insight Radio Engagement Study – KISS Approach
* Source: Neuro Insight Pty Ltd Radio Engagement Study 2010
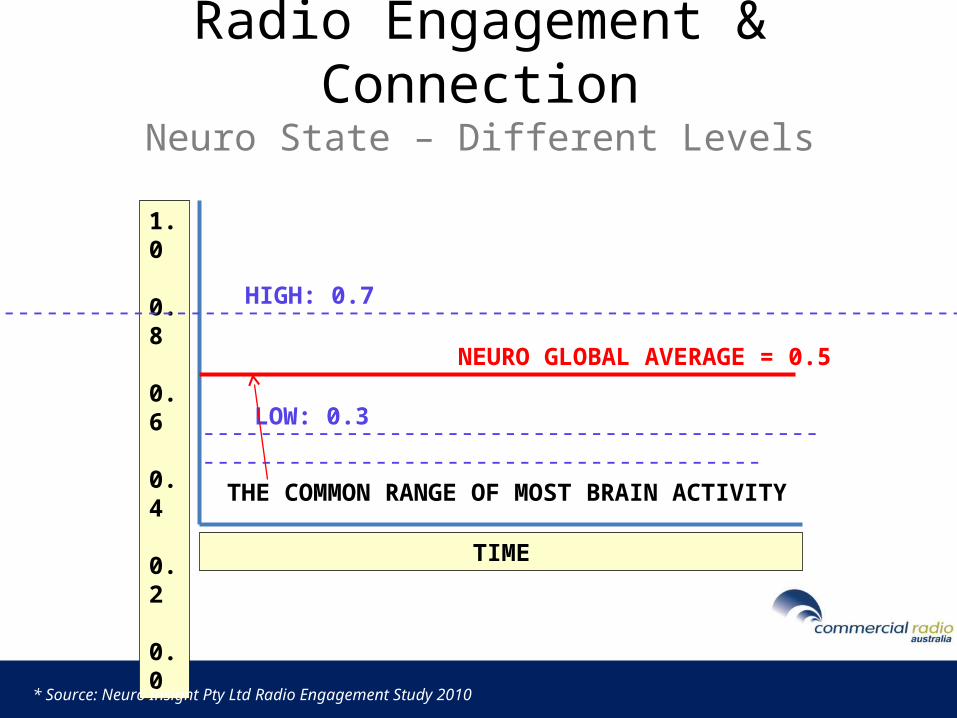
Radio Engagement & ConnectionNeuro State – Different Levels
THE COMMON RANGE OF MOST BRAIN ACTIVITY
1.0
0.8
0.6
0.4
0.2
0.0
----------------------------------------------------------------------------------
----------------------------------------------------------------------------------
HIGH: 0.7
LOW: 0.3
NEURO GLOBAL AVERAGE = 0.5
TIME
* Source: Neuro Insight Pty Ltd Radio Engagement Study 2010
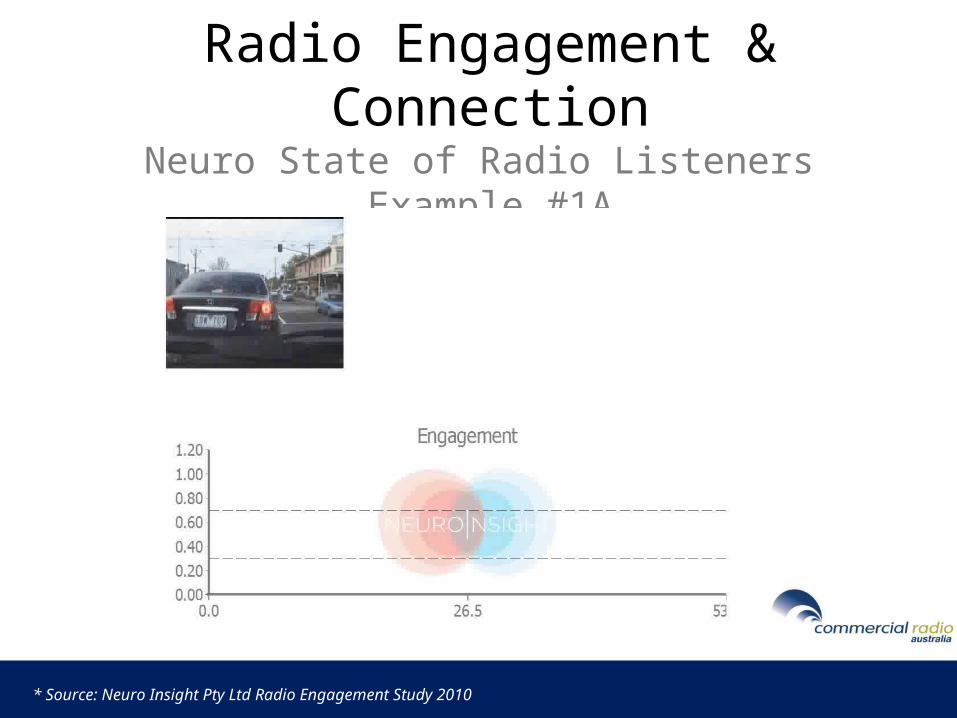
Radio Engagement & ConnectionNeuro State of Radio Listeners
Example #1A
* Source: Neuro Insight Pty Ltd Radio Engagement Study 2010

Radio Engagement & ConnectionNeuro State of Radio Listeners
Example #1B
* Source: Neuro Insight Pty Ltd Radio Engagement Study 2010
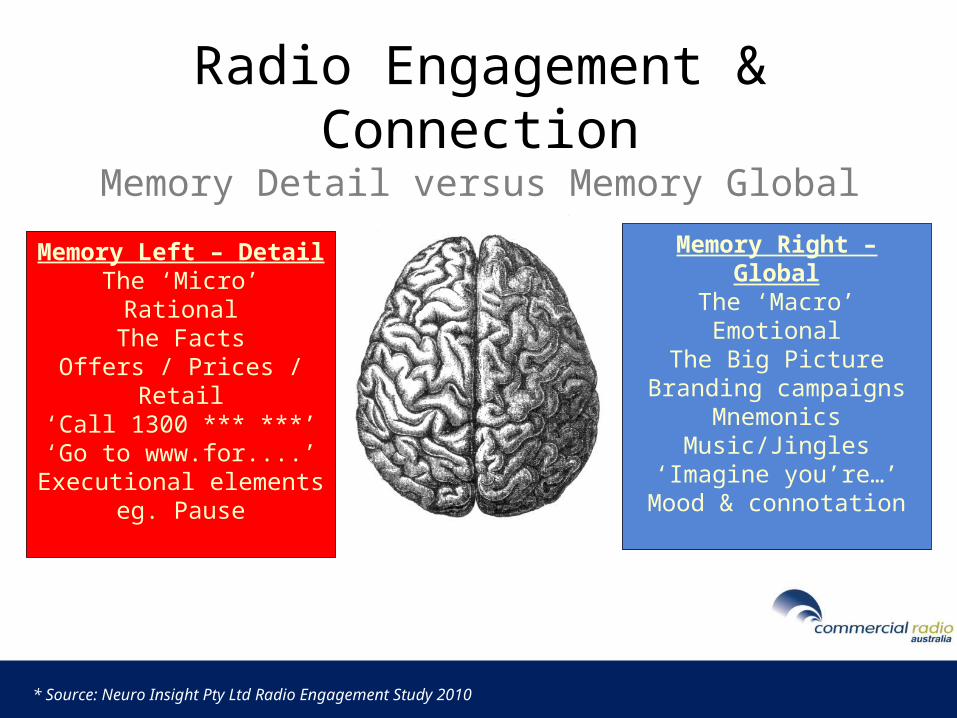
Radio Engagement & ConnectionMemory Detail versus Memory Global
Memory Left – DetailThe ‘Micro’
RationalThe Facts
Offers / Prices / Retail‘Call 1300 *** ***’‘Go to www.for....’
Executional elements eg. Pause
Memory Right – GlobalThe ‘Macro’Emotional
The Big PictureBranding campaigns
MnemonicsMusic/Jingles
‘Imagine you’re…’Mood & connotation
* Source: Neuro Insight Pty Ltd Radio Engagement Study 2010

Radio Engagement & ConnectionNeuro State of Radio Listeners
Example #2A
* Source: Neuro Insight Pty Ltd Radio Engagement Study 2010
Memory Left = Rational, Detailed
Memory Right = Emotional, Big Picture

Radio Engagement & ConnectionNeuro State of Radio Listeners
Example #2B
* Source: Neuro Insight Pty Ltd Radio Engagement Study 2010
Memory Left = Rational, Detailed
Memory Right = Emotional, Big Picture

Radio Engagement & ConnectionOverall 32% Higher than the Neuro Global Average
The research shows the ‘Radio Average’ is 32% higher than the ‘Neuro Global Average’
High
Ave
Low
* Source: Neuro Insight Pty Ltd Radio Engagement Study 2010
High
Ave

The Hoop Group Research

Radio Engagement & ConnectionThe Hoop Group Study - Methodolgy
• Radio relevance study
• 1500 people were interviewed
• 5 mainland capital cities + 3 regional hubs.
• The research will be released in 2 phases in 2011
* Source: Hoop Group / CRA Radio Relevance Study Oct 2010. n = 1 500
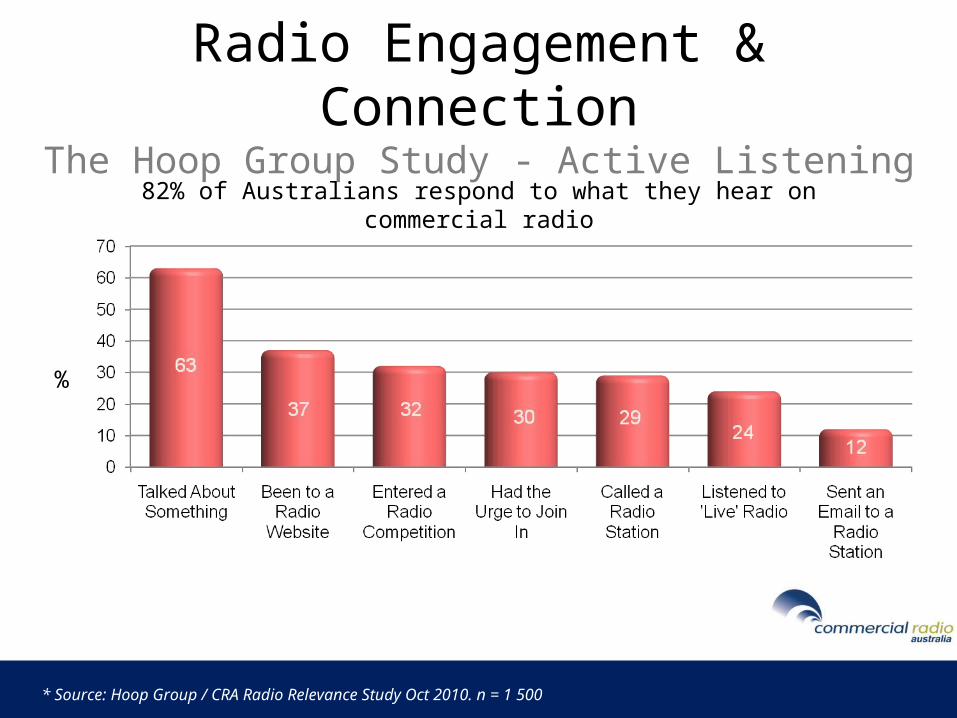
Radio Engagement & ConnectionThe Hoop Group Study - Active Listening
82% of Australians respond to what they hear on commercial radio
* Source: Hoop Group / CRA Radio Relevance Study Oct 2010. n = 1 500
%
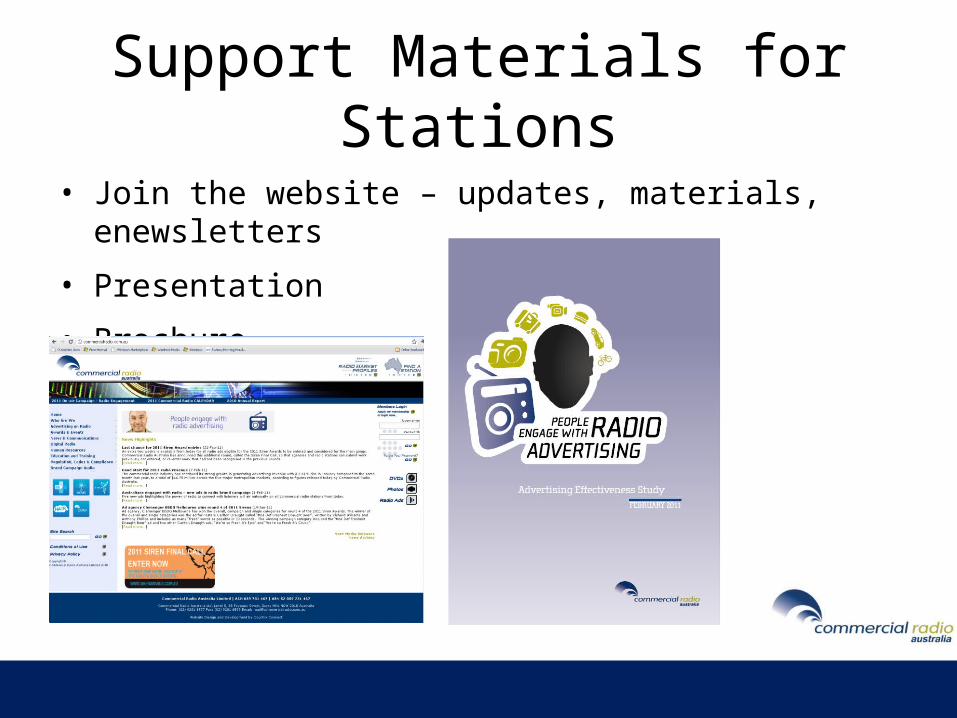
Support Materials for Stations
• Join the website – updates, materials, enewsletters
• Presentation
• Brochure
For further information regarding the CRA Brand Strategy, Campaign and Supporting
Research contact:
Natalie Muir – Strategic Insights Executive
(02) 9281 [email protected]