Project B:Determining the Relationshipof Insulin to Diabetes
• Orientation
• Project Synopsis
• Phase I: Diabetes
• Phase II: Tools for Monitoring DiabetesActivity 1: FuelActivity 2: Controlling DiabetesActivity 3: Modelling Two Competing Processes
• Phase III: Solving a Regimen Problem
M A T H E M A T I C S

Mathematics 9 • 145
Project B: Determining the Relationship of Insulin to Diabetes
Project B: Determining theRelationship of Insulin to Diabetes
Orientation
Time:
Phase I: DiabetesActivity 1: Diabetes Research .............................................. 1 to 2 class periodsPhase II: Tools for Monitoring DiabetesActivity 1: Fuel .................................................................... 1 to 2 class periodsActivity 2: Controlling Diabetes ................................................. 2 class periodsActivity 3: Modelling Two Competing Processes ................. 1 to 2 class periodsPhase III: Solving a Regimen Problem ............................... 1 class period
Instructional Strategies:
• Direct Instruction• Case Study• Group Work• Issues Inquiry
Real-World Applications:
Some real-world applications of the skills learned in this project include:• representing and interpreting health data in the form of graphs• making better decisions about health based on the interpretation of health
data• determining the optimal price for concert ticket sold by scalpers
Project Overview:
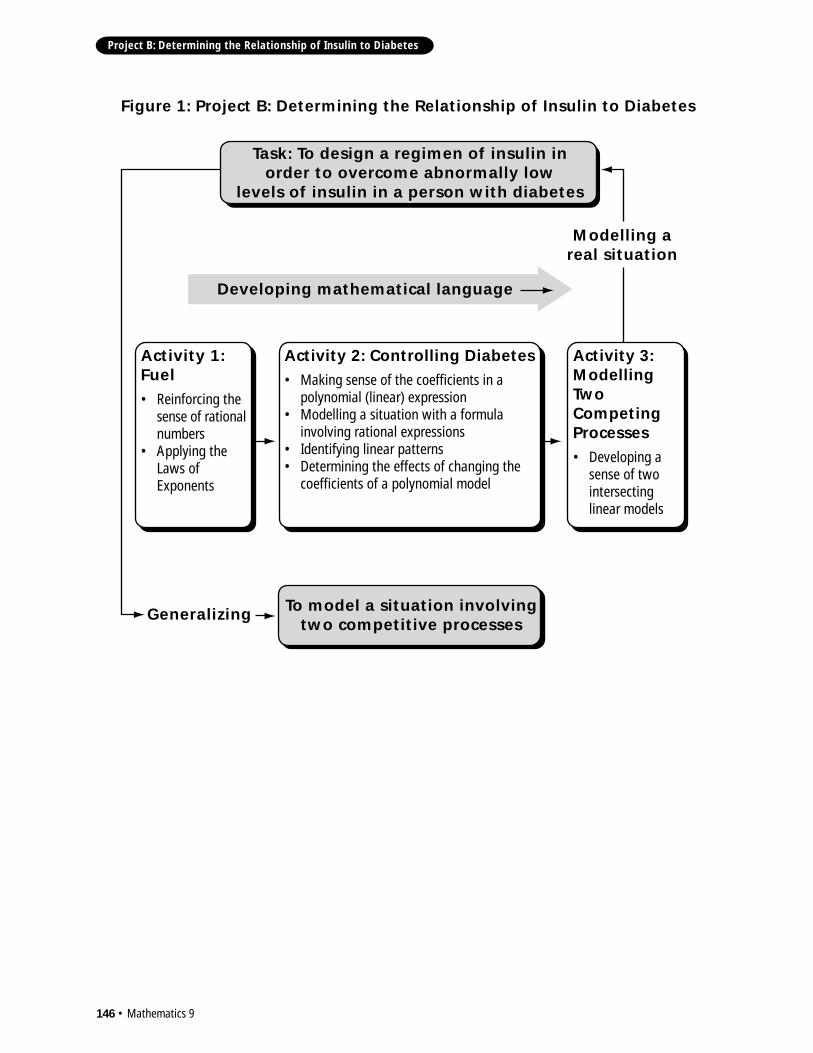
Figure 1 on the following page is a schematic to help you conceptualizeProject B: Determining the Relationship of Insulin to Diabetes.
146 • Mathematics 9
Project B: Determining the Relationship of Insulin to Diabetes
Figure 1: Project B: Determining the Relationship of Insulin to Diabetes
Task: To design a regimen of insulin in order to overcome abnormally low
levels of insulin in a person with diabetes
Modelling a real situation
Activity 1: Fuel• Reinforcing the
sense of rational numbers
• Applying the Laws of Exponents
Activity 2: Controlling Diabetes• Making sense of the coefficients in a
polynomial (linear) expression• Modelling a situation with a formula
involving rational expressions• Identifying linear patterns• Determining the effects of changing the
coefficients of a polynomial model
Activity 3: Modelling Two Competing Processes• Developing a
sense of two intersecting linear models
Developing mathematical language
Generalizing To model a situation involving two competitive processes
Mathematics 9 • 147
Project B: Determining the Relationship of Insulin to Diabetes
Project Synopsis
The objective of this project is to reinforce student skills in patternrecognition and in performing calculations with rational numbers and powerswhile developing their consciousness about diabetes.
Students identify and graphically represent patterns. These patterns are thenapplied to make predictions and draw conclusions.
Students analyse two competitive processes (input and output) with linearmodels in order to develop their understanding of polynomial coefficientsand their significance.
Students are evaluated on their skills and abilities in:• statistics, that is, establishing the correlation between two variables
(Activity 1: Diabetes Research)• number concepts and number operations, that is using rational numbers
and powers in a real context by applying the laws of exponents (Activity 1:Fuel)
• patterns, variables and equations that is, model a real situation withpolynomials and solving first-degree equations (Activity 2: ControllingDiabetes, and Activity 3: Modelling Two Competing Processes).
This project has three phases.
In Phase I: Diabetes, students are introduced to the topic of diabetes andassigned the task of collecting more information about the disease.
Phase II: Tools for Monitoring Diabetes has three major activities, Activity I:Fuel; Activity 2: Controlling Diabetes; and Activity 3: Modelling TwoCompeting Processes. In Activity 1: Fuel, students identify the variables thatare involved in diabetes development. Students relate the causes, the diagnosisand the treatment of diabetes. In Activity 2: Controlling Diabetes, studentsrecognize the patterns representing the change in the variables (sugar andinsulin) over time. Students also have an opportunity to design regimens.Finally, in Activity 3: Modelling Two Competing Processes, students learnabout the biochemical properties of insulin, and its role in the metabolism ofsugar and in regulating the blood glucose level by injection. Students areassigned the tasks of designing other situations where two competingprocesses are involved and of modelling the result.
Phase III: Solving a Regimen Problem is the evaluation component of thisproject. In this phase, the mathematical and scientific concepts are evaluatedfrom reports prepared by groups of students. These reports include: adescription of the preparation of a regimen of insulin injections from a tableof blood sugar readings; answers to questions about the impact of changes inthe diet; and the social and economic implications of diabetes.
148 • Mathematics 9
Project B: Determining the Relationship of Insulin to Diabetes
Activity 1: Diabetes Research
Objective:
The objective of this activity is for students to become familiar with thenature of diabetes, the vocabulary used, and the physiological effects of theillness. Students collect and represent data related to the occurrence ofdiabetes and analyse the results in terms of two variables. You may alsochoose to do Phase I as part of the science course or in collaboration with thescience teacher.
Note: Before you begin this project, check with your school administratorto determine whether there is any school, district or Ministry of Educationpolicy governing the use of body fluids for testing purposes. Some activitiesrequire authentic data from humans. For sources of human physiologicaldata, consult local health officials and/or diabetes organizations.
Materials:
• information pamphlets obtained from the Canadian Diabetes Associationand local Diabetes Education Centres
• access to Internet• prepared microscope slide of a pancreas cell(s)• Student Activity: Diabetes Research• access to a nurse, physician, dietitian or student with diabetes
Procedure:
Diabetes is a condition in which the body cannot properly use the energyfrom food eaten. When food is ingested, some of it is broken down by thedigestive system into forms of sugar, one of which is called glucose. Glucose isthe main fuel of the body. It enters the bloodstream and goes to the cellswhere it is used as energy or where it is stored in the liver for future use.
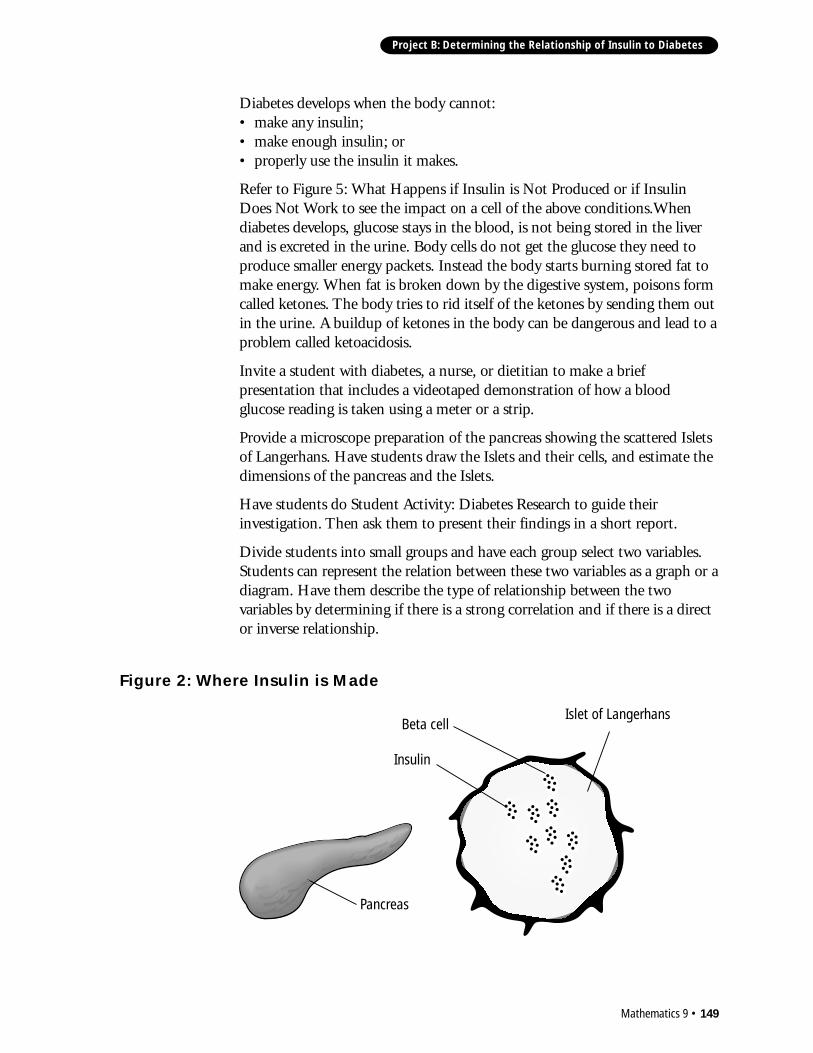
Insulin is a chemical made and stored in specific cells of an organ called thepancreas. Refer to Figure 2: Where Insulin is Made. Insulin is needed to helpsugar leave the bloodstream and enter cells of the body: liver cells followingdigestion, and all body cells when human activity levels rise. Refer to Figure3: Microscopic Sections of Pancreas and to Figure 4: Intake of Glucose Intoan Islet Cell.
Phase I: Diabetes
Mathematics 9 • 149
Project B: Determining the Relationship of Insulin to Diabetes
Diabetes develops when the body cannot:• make any insulin;• make enough insulin; or• properly use the insulin it makes.
Refer to Figure 5: What Happens if Insulin is Not Produced or if InsulinDoes Not Work to see the impact on a cell of the above conditions.Whendiabetes develops, glucose stays in the blood, is not being stored in the liverand is excreted in the urine. Body cells do not get the glucose they need toproduce smaller energy packets. Instead the body starts burning stored fat tomake energy. When fat is broken down by the digestive system, poisons formcalled ketones. The body tries to rid itself of the ketones by sending them outin the urine. A buildup of ketones in the body can be dangerous and lead to aproblem called ketoacidosis.
Invite a student with diabetes, a nurse, or dietitian to make a briefpresentation that includes a videotaped demonstration of how a bloodglucose reading is taken using a meter or a strip.
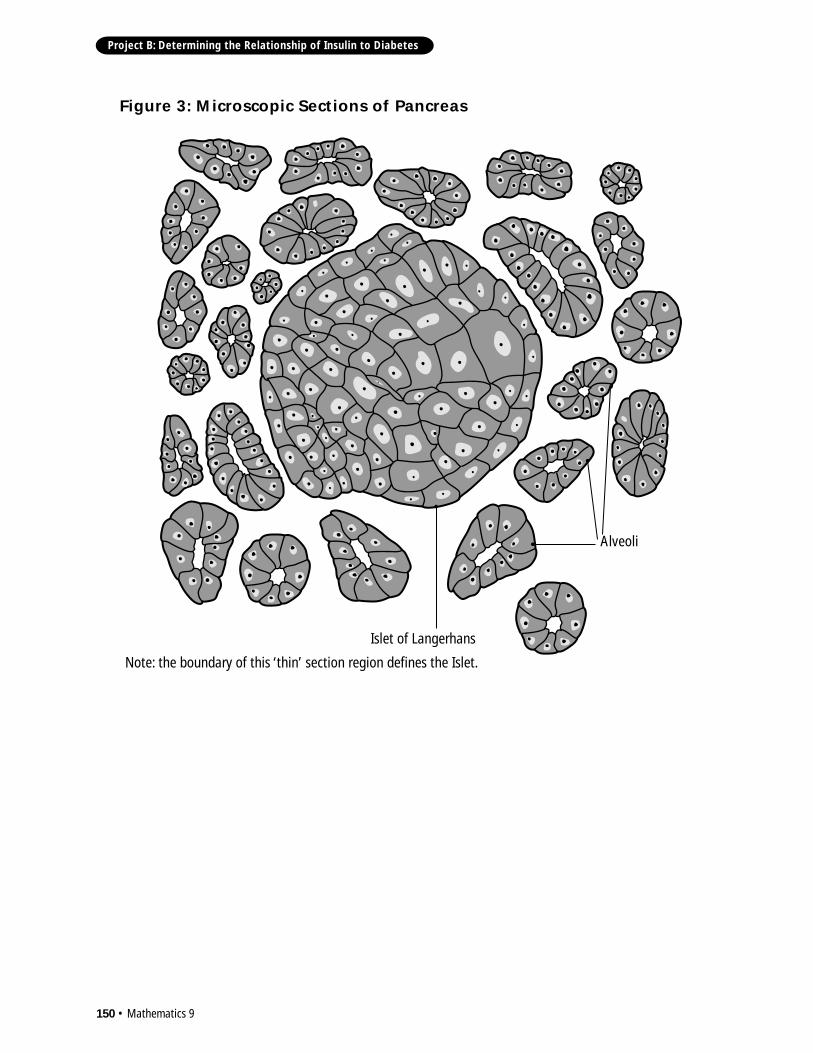
Provide a microscope preparation of the pancreas showing the scattered Isletsof Langerhans. Have students draw the Islets and their cells, and estimate thedimensions of the pancreas and the Islets.
Have students do Student Activity: Diabetes Research to guide theirinvestigation. Then ask them to present their findings in a short report.
Divide students into small groups and have each group select two variables.Students can represent the relation between these two variables as a graph or adiagram. Have them describe the type of relationship between the twovariables by determining if there is a strong correlation and if there is a director inverse relationship.
Figure 2: Where Insulin is Made
Islet of LangerhansBeta cell
Insulin
Pancreas
150 • Mathematics 9
Project B: Determining the Relationship of Insulin to Diabetes
Figure 3: Microscopic Sections of Pancreas
Islet of Langerhans
Note: the boundary of this ‘thin’ section region defines the Islet.
Alveoli
Mathematics 9 • 151
Project B: Determining the Relationship of Insulin to Diabetes
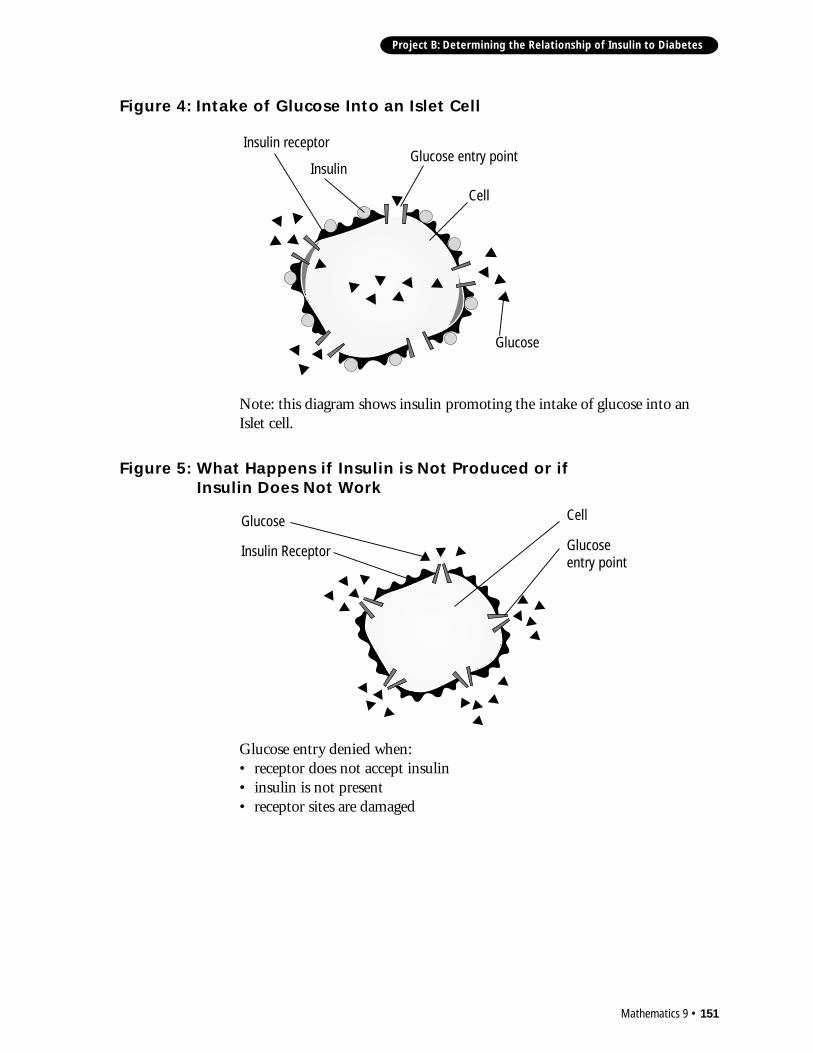
Note: this diagram shows insulin promoting the intake of glucose into anIslet cell.
Figure 4: Intake of Glucose Into an Islet Cell
Insulin receptorGlucose entry point
Glucose
Cell
Insulin
Figure 5: What Happens if Insulin is Not Produced or if Insulin Does Not Work
Cell
Glucoseentry point
Glucose
Insulin Receptor
Glucose entry denied when:• receptor does not accept insulin• insulin is not present• receptor sites are damaged

152 • Mathematics 9
Project B: Determining the Relationship of Insulin to Diabetes
1. Research: What is diabetes?
• What is diabetes?
• What are the causes of diabetes?
• What are some of the characteristics of people who have diabetes, forfactors such as age, gender and geographic location? Are there some groupsof people who have a higher than average incidence of the disease? If so,why might this be?
• What is the number of Canadians with diabetes?
• What is the percentage of Canadians with diabetes?
• How many people have Type I diabetes and how many have Type II?Complete Table 1: Comparing Type I and Type II Incidence by AgeGroup. Complete Figure 6: Type I and Type II Incidence by Age Group.
Student Activity: Diabetes Research
Student Name: _________________________ Date: _________________
Table 1
Comparing Type I and Type II Incidence by Age Group
Age Group Type I Diabetes Type II Diabetes
Mathematics 9 • 153
Project B: Determining the Relationship of Insulin to Diabetes
Figure 6: Type I and Type II Incidence by Age Group
Age Groups
Perc
enta
ge o
f Can
adia
nsStudent Activity: Diabetes Research
154 • Mathematics 9
Project B: Determining the Relationship of Insulin to Diabetes
• What are the symptoms of diabetes?
• What are the consequences to the individual of having diabetes?
• What are the financial costs to the individual, the province and the nation?
• What are the costs involved in the treatment of diabetes? How do thesecosts compare to the treatment costs 50 years ago?
• Is there a cure for diabetes? What are some recent developments frommedical research?
• What are some of the ways that people cope with diabetes?
• What is the significance of 1-800-BANTING, used as the toll-free numberfor the Canadian Diabetes Association.
Student Activity: Diabetes Research
Mathematics 9 • 155
Project B: Determining the Relationship of Insulin to Diabetes
Student Activity: Diabetes Research
Comment on the following terms related to diabetes• Pancreas:
Description:
Dimensions:Diagram:
• Islet of Langerhans:Description:
Dimensions:Diagram:
• Beta cell:Description:
Dimensions:Diagram:

156 • Mathematics 9
Project B: Determining the Relationship of Insulin to Diabetes
• Describe the role that Banting and Best played in the history of diabetesresearch.
• Insulin:Definition:
Chemical formula:
• Glucose:Definition:
Chemical formula:
• Sugars:Definition:
Chemical formula generalized:
• Ketones:Definition:
Chemical formula generalized:
Student Activity: Diabetes Research
Mathematics 9 • 157
Project B: Determining the Relationship of Insulin to Diabetes
Student Activity: Diabetes Research
• Carbohydrates:Definition:
Chemical formula generalized:
• Type I Diabetes:Definition:
• Type II Diabetes:Definition:
2. What are the complications of diabetes?
• Low blood sugar (Hypoglycemia)Causes:
Signs of mild hypoglycemia:
Ways to treat low blood sugar:
Ways to avoid low blood sugar:
158 • Mathematics 9
Project B: Determining the Relationship of Insulin to Diabetes
• High blood sugar (Hyperglycemia)Causes:
Signs of hyperglycemia:
Ways to treat high blood sugar:
Ways to avoid high blood sugar:
• KetoacidosisCauses:
Signs of mild ketoacidosis:
Ways to avoid ketoacidosis:
Ways to treat ketoacidosis:
Description of long term complications:
Student Activity: Diabetes Research
Mathematics 9 • 159
Project B: Determining the Relationship of Insulin to Diabetes
Student Activity: Diabetes Research
3. Statistics
Name and describe any two variables related to diabetes.
Describe the kind of relationship you predict between the two variables for agiven set of conditions. Explain.
Represent their relationship to each other in a diagram.
Complete Table 2: Values of the Two Variables, by recording the values of thetwo variables for example, over time. Properly identify the units of each of thevariables.
Table 2
Values of the Two Variables
Variable #1 Variable #2
160 • Mathematics 9
Project B: Determining the Relationship of Insulin to Diabetes
Create a scatter graph in the space below for the two variables and analyse therelationship. Were your predictions correct?
Student Activity: Diabetes Research
Mathematics 9 • 161
Project B: Determining the Relationship of Insulin to Diabetes
Activity 1: Fuel
Objective:
Students perform operations with rational numbers and powers. Theydevelop simple linear models representing two competing processes in orderto develop their understanding of the coefficients of a polynomial modelrepresenting a real situation.
Materials:
• information pamphlets obtained from the Canadian Diabetes Associationand local Diabetes Education Centres
• Student Activity: Fuel• graphing calculator or mathematics software for example Mathcad and
Mathematica• access to a nurse, physician, dietitian, or to a student with diabetes• copies of diabetes diaries• Good Health Eating Guide Poster or equivalent
Procedure:
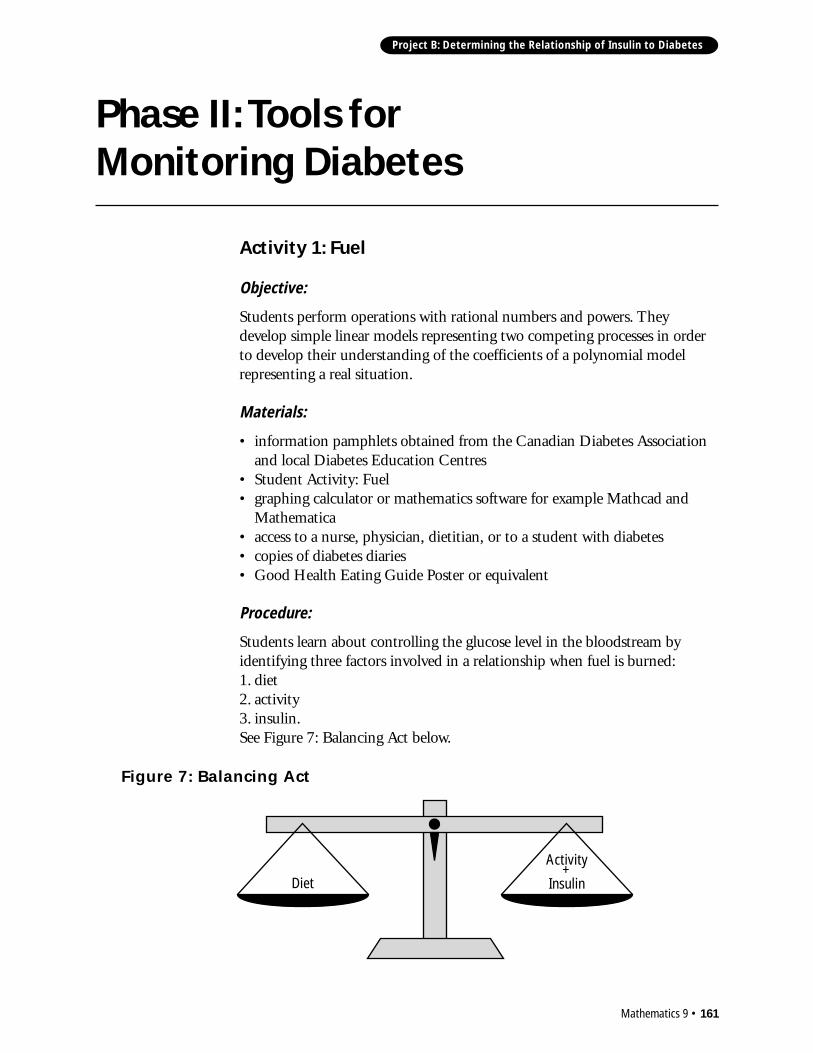
Students learn about controlling the glucose level in the bloodstream byidentifying three factors involved in a relationship when fuel is burned:1. diet2. activity3. insulin.See Figure 7: Balancing Act below.
Figure 7: Balancing Act
Diet
Activity +
Insulin
Phase II: Tools forMonitoring Diabetes
162 • Mathematics 9
Project B: Determining the Relationship of Insulin to Diabetes
These factors contribute to the fluctuations in the blood glucose level. Peoplewith Type I diabetes need to adjust the glucose level by manipulating thesethree factors. To do this they must understand the effect and contribution ofeach of the factors.
Have students use the 24-hour timeline (see Figure 12: 24-Hour Timeline inStudent Activity: Fuel) to show what they expect the glucose level to be in theblood of a normal person under normal conditions with the proper amountof insulin. This is called a qualitative estimation, since students can onlyestimate whether the level is higher or lower.
Ask students to include meals, sleep time, exercise, and stress on a timelineand to estimate the effect these factors have on the glucose level.
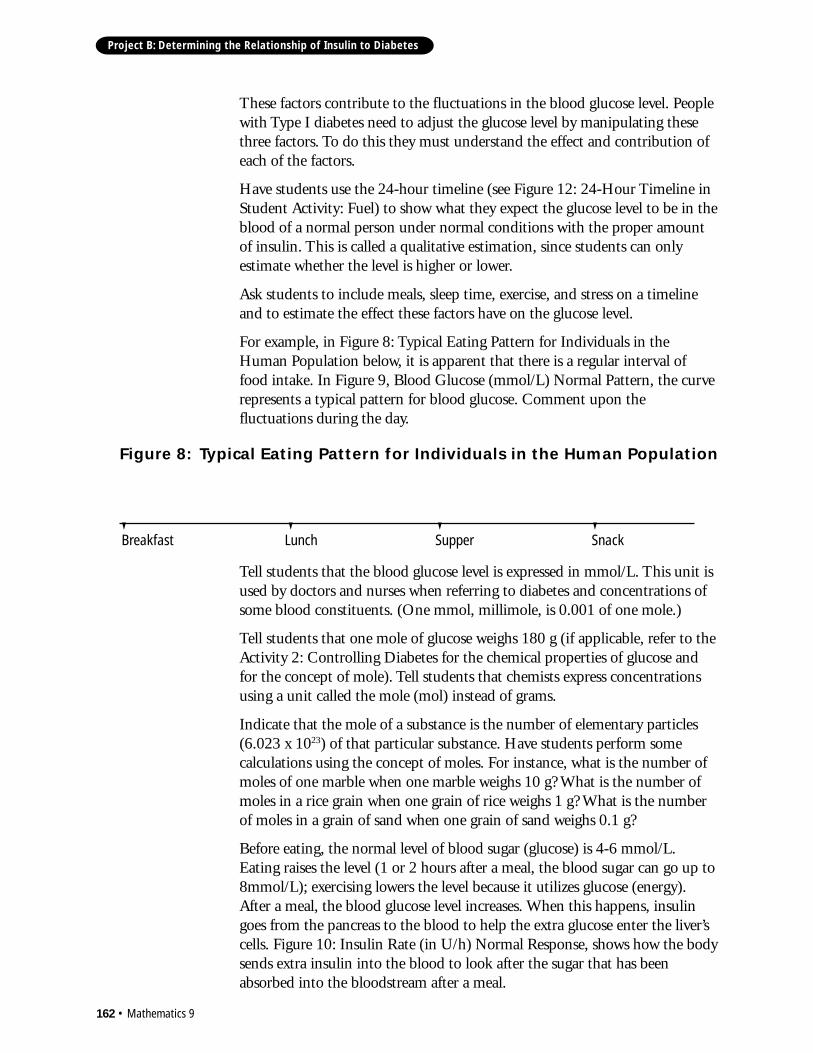
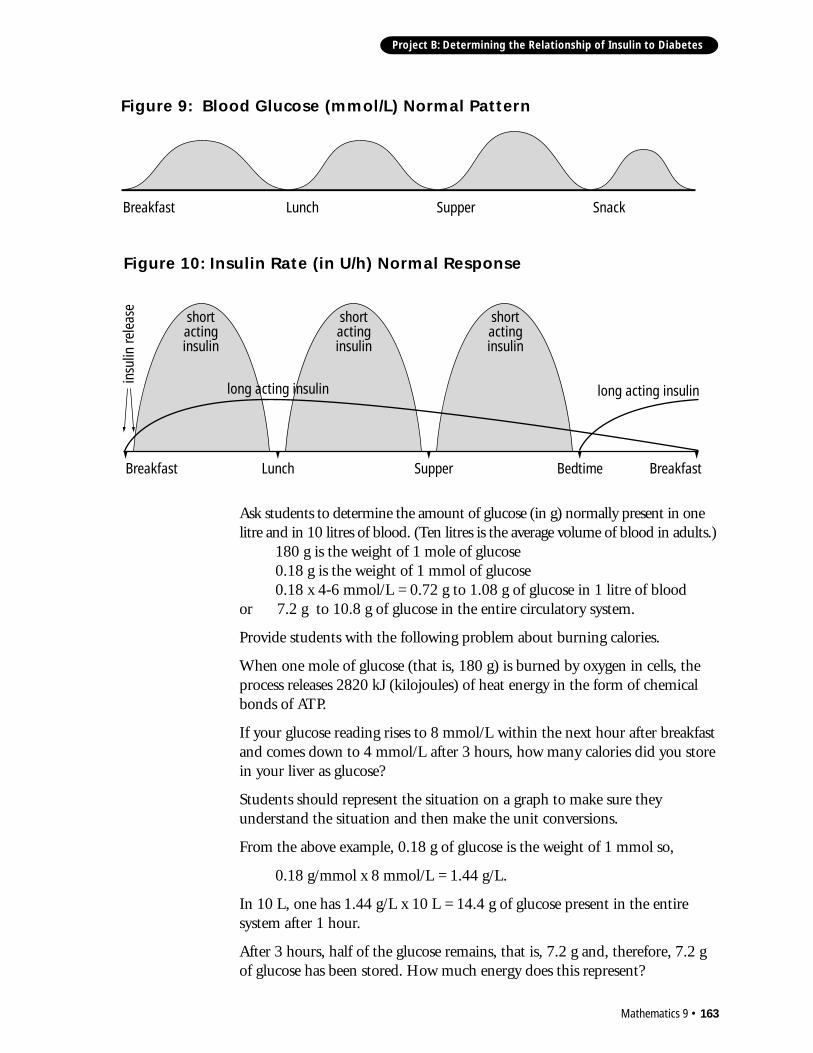
For example, in Figure 8: Typical Eating Pattern for Individuals in theHuman Population below, it is apparent that there is a regular interval offood intake. In Figure 9, Blood Glucose (mmol/L) Normal Pattern, the curverepresents a typical pattern for blood glucose. Comment upon thefluctuations during the day.
Tell students that the blood glucose level is expressed in mmol/L. This unit isused by doctors and nurses when referring to diabetes and concentrations ofsome blood constituents. (One mmol, millimole, is 0.001 of one mole.)
Tell students that one mole of glucose weighs 180 g (if applicable, refer to theActivity 2: Controlling Diabetes for the chemical properties of glucose andfor the concept of mole). Tell students that chemists express concentrationsusing a unit called the mole (mol) instead of grams.
Indicate that the mole of a substance is the number of elementary particles(6.023 x 10²³) of that particular substance. Have students perform somecalculations using the concept of moles. For instance, what is the number ofmoles of one marble when one marble weighs 10 g? What is the number ofmoles in a rice grain when one grain of rice weighs 1 g? What is the numberof moles in a grain of sand when one grain of sand weighs 0.1 g?
Before eating, the normal level of blood sugar (glucose) is 4-6 mmol/L.Eating raises the level (1 or 2 hours after a meal, the blood sugar can go up to8mmol/L); exercising lowers the level because it utilizes glucose (energy).After a meal, the blood glucose level increases. When this happens, insulingoes from the pancreas to the blood to help the extra glucose enter the liver’scells. Figure 10: Insulin Rate (in U/h) Normal Response, shows how the bodysends extra insulin into the blood to look after the sugar that has beenabsorbed into the bloodstream after a meal.
Figure 8: Typical Eating Pattern for Individuals in the Human Population
Breakfast Lunch Supper Snack
Mathematics 9 • 163
Project B: Determining the Relationship of Insulin to Diabetes
Ask students to determine the amount of glucose (in g) normally present in onelitre and in 10 litres of blood. (Ten litres is the average volume of blood in adults.)
180 g is the weight of 1 mole of glucose0.18 g is the weight of 1 mmol of glucose0.18 x 4-6 mmol/L = 0.72 g to 1.08 g of glucose in 1 litre of blood
or 7.2 g to 10.8 g of glucose in the entire circulatory system.
Provide students with the following problem about burning calories.
When one mole of glucose (that is, 180 g) is burned by oxygen in cells, theprocess releases 2820 kJ (kilojoules) of heat energy in the form of chemicalbonds of ATP.
If your glucose reading rises to 8 mmol/L within the next hour after breakfastand comes down to 4 mmol/L after 3 hours, how many calories did you storein your liver as glucose?
Students should represent the situation on a graph to make sure theyunderstand the situation and then make the unit conversions.
From the above example, 0.18 g of glucose is the weight of 1 mmol so,
0.18 g/mmol x 8 mmol/L = 1.44 g/L.
In 10 L, one has 1.44 g/L x 10 L = 14.4 g of glucose present in the entiresystem after 1 hour.
After 3 hours, half of the glucose remains, that is, 7.2 g and, therefore, 7.2 gof glucose has been stored. How much energy does this represent?
Figure 9: Blood Glucose (mmol/L) Normal Pattern
Breakfast Lunch Supper Snack
Figure 10: Insulin Rate (in U/h) Normal Response
Breakfast BreakfastLunch Supper Bedtime
long acting insulin long acting insulin
insu
lin re
leas
e
short actinginsulin
short actinginsulin
short actinginsulin
164 • Mathematics 9
Project B: Determining the Relationship of Insulin to Diabetes
Note that: 1 Joule = 0.23901 calories1 kJ = 239.01 calories1 calorie = 1/0.23901 J
= 4.184 J
As indicated earlier 180 g releases 2820 kJ or2820 x 239.01 cal = 674 008.2 calories or674 kcal, therefore,7.2 g releases 674 kcal x 7.2 g/ 180 g = 27 kcal of energy when burned.
Discuss the results with your students in relation to the daily amount ofenergy required by an average adult (1500 kcal at rest in a warm room to3000 kcal for a person doing average work) .
Ask students:• “Why are the results so low?”• “Does the result make sense?”
You can provide them with some clues to the answer:• the process is continuous• the glucose is only one source of energy; other carbohydrates, fats and
proteins also produce energy while they are metabolized• glucose is at the end of the chain of decomposition of carbohydrates;
intermediate steps already produced energy.
These values are approximately the same as the amount of energyconsumed by a 100-watt light bulb operating for a 24-hr period.
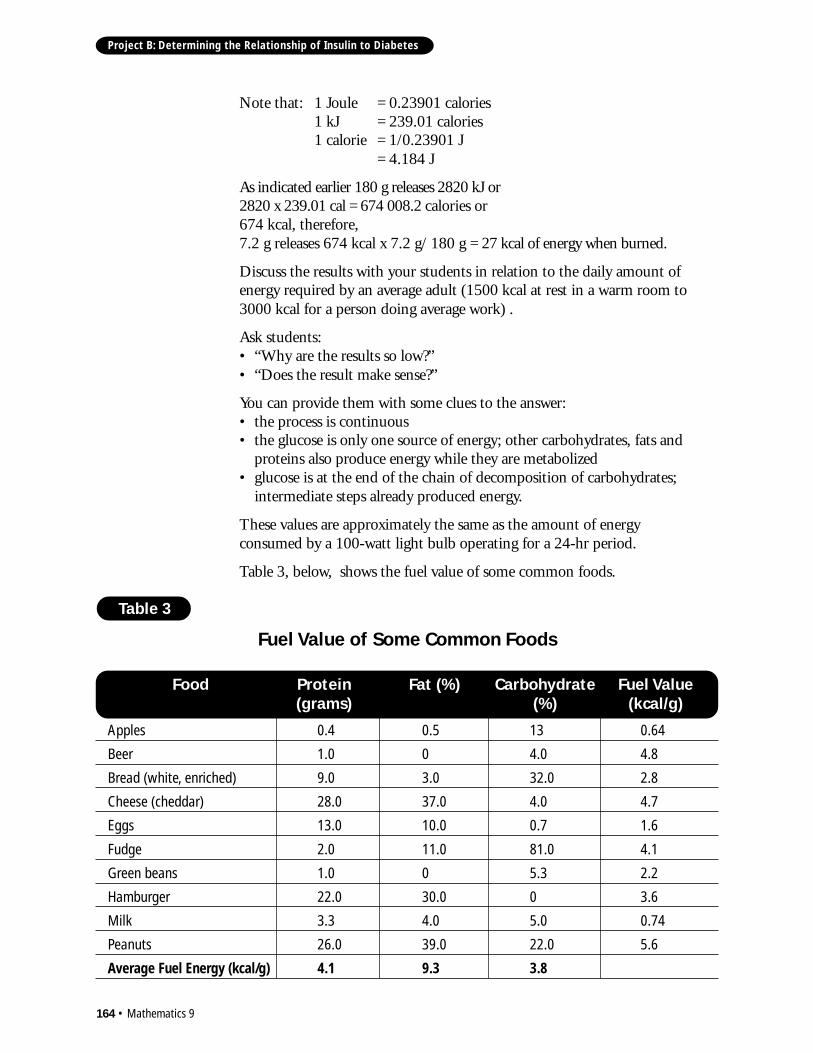
Table 3, below, shows the fuel value of some common foods.
Table 3
Fuel Value of Some Common Foods
Apples 0.4 0.5 13 0.64
Beer 1.0 0 4.0 4.8
Bread (white, enriched) 9.0 3.0 32.0 2.8
Cheese (cheddar) 28.0 37.0 4.0 4.7
Eggs 13.0 10.0 0.7 1.6
Fudge 2.0 11.0 81.0 4.1
Green beans 1.0 0 5.3 2.2
Hamburger 22.0 30.0 0 3.6
Milk 3.3 4.0 5.0 0.74
Peanuts 26.0 39.0 22.0 5.6
Average Fuel Energy (kcal/g) 4.1 9.3 3.8
Food Protein(grams)
Fat (%) Carbohydrate(%)
Fuel Value(kcal/g)
Mathematics 9 • 165
Project B: Determining the Relationship of Insulin to Diabetes
The fuel energy value of carbohydrates is approximately 4 kcal/g ofcarbohydrate (3.8 in Table 3 above) and the fuel energy value of fats isapproximately 10 kcal/g (9.3 in Table 3 above).
To maintain body weight, a normal active, healthy adult must take in about130 kJ of food energy per kilogram of body weight per day. Have studentsprepare a daily diet model (Student Activity: Modelling the Blood SugarLevel) and compare the data in Table 3: Fuel Value of Some Common Foods,above with the required number of calories to maintain their body weight.Make sure that students first convert the energy from kJ to kcal.
Tell students that although exercise is great for improving tone and firming upsagging tissues, it is not an effective way to lose weight. A one hour brisk walkover average terrain uses only about 700 kJ of stored energy. This is about onequarter of the energy contained in a quarter-pound hamburger in a bun.
Note: the popular term calorie is actually a kilocalorie and is sometimeswritten calorie (1000 cal = 1 Cal).
Have students complete the Figure 11: Blood Sugar Level Over Time, inStudent Activity: Modelling the Blood Sugar Level in a more rigorous fashionfrom the data students have provided through their own research. Insist thatonly carbohydrates are considered in glucose production and that the lowerpart of the graph showing the input of insulin (time and quantity) beincluded. Tell students that insulin is measured in Units of insulin per hour(U/h). As a rule, a person needs about 0.3 U of insulin per kilogram ofweight per day. For example, a 50 kg person would need 15 Units a day.
Note: if students are unable to locate blood glucose data, then make itavailable to them. They should be encouraged, however, to researchplausible sources.
166 • Mathematics 9
Project B: Determining the Relationship of Insulin to Diabetes
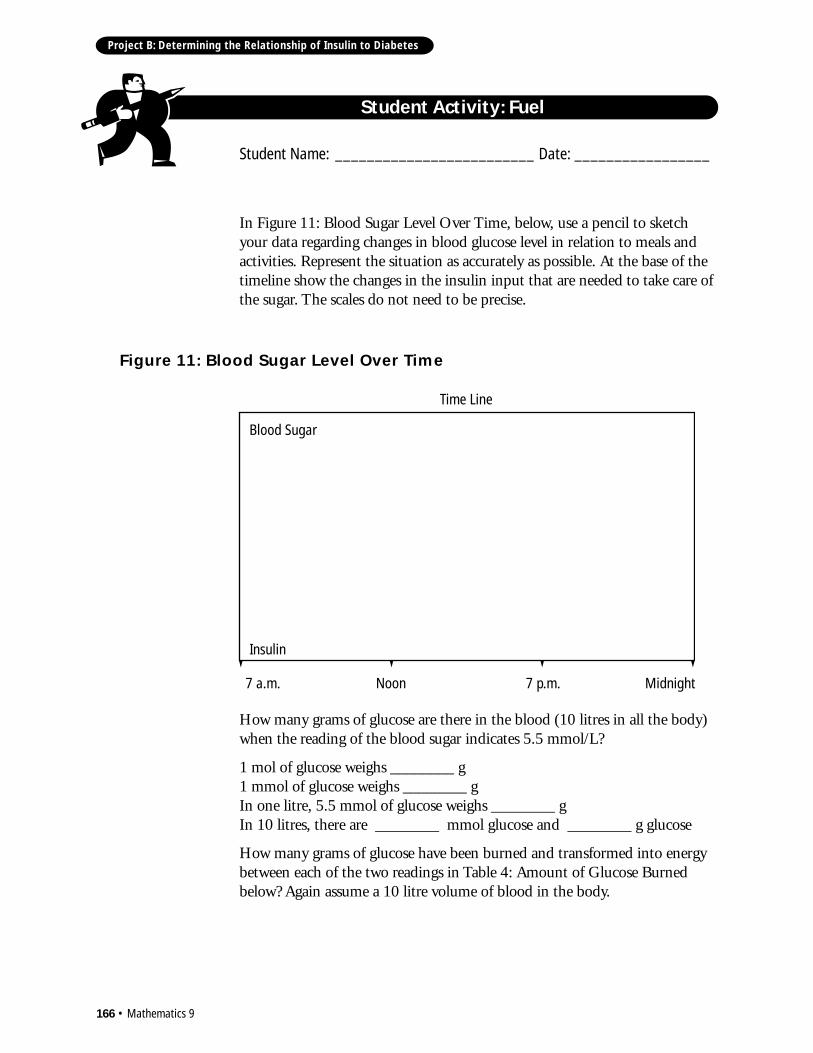
In Figure 11: Blood Sugar Level Over Time, below, use a pencil to sketchyour data regarding changes in blood glucose level in relation to meals andactivities. Represent the situation as accurately as possible. At the base of thetimeline show the changes in the insulin input that are needed to take care ofthe sugar. The scales do not need to be precise.
Student Activity: Fuel
Student Name: _________________________ Date: _________________
Figure 11: Blood Sugar Level Over Time
7 a.m. Midnight7 p.m.Noon
Time Line
Blood Sugar
Insulin
How many grams of glucose are there in the blood (10 litres in all the body)when the reading of the blood sugar indicates 5.5 mmol/L?
1 mol of glucose weighs ________ g1 mmol of glucose weighs ________ gIn one litre, 5.5 mmol of glucose weighs ________ gIn 10 litres, there are ________ mmol glucose and ________ g glucose
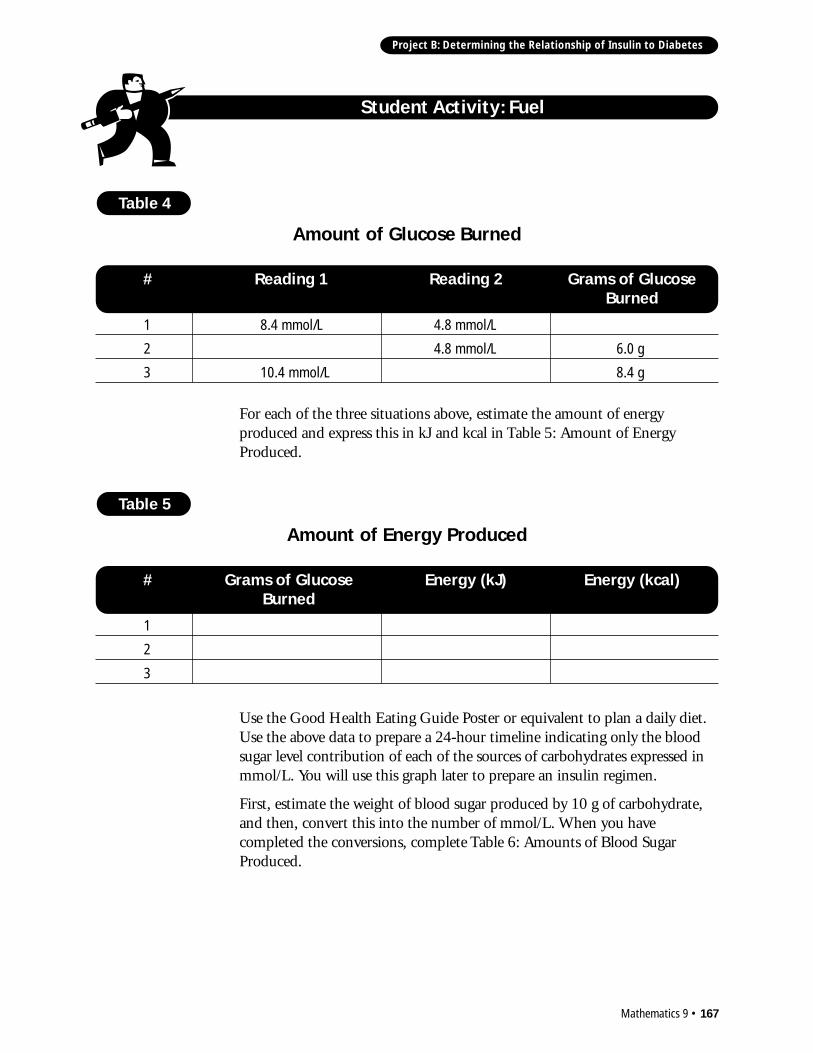
How many grams of glucose have been burned and transformed into energybetween each of the two readings in Table 4: Amount of Glucose Burnedbelow? Again assume a 10 litre volume of blood in the body.
Mathematics 9 • 167
Project B: Determining the Relationship of Insulin to Diabetes
For each of the three situations above, estimate the amount of energyproduced and express this in kJ and kcal in Table 5: Amount of EnergyProduced.
Table 4
Amount of Glucose Burned
1 8.4 mmol/L 4.8 mmol/L
2 4.8 mmol/L 6.0 g
3 10.4 mmol/L 8.4 g
# Reading 1 Reading 2 Grams of GlucoseBurned
Table 5
Amount of Energy Produced
1
2
3
# Grams of GlucoseBurned
Energy (kJ) Energy (kcal)
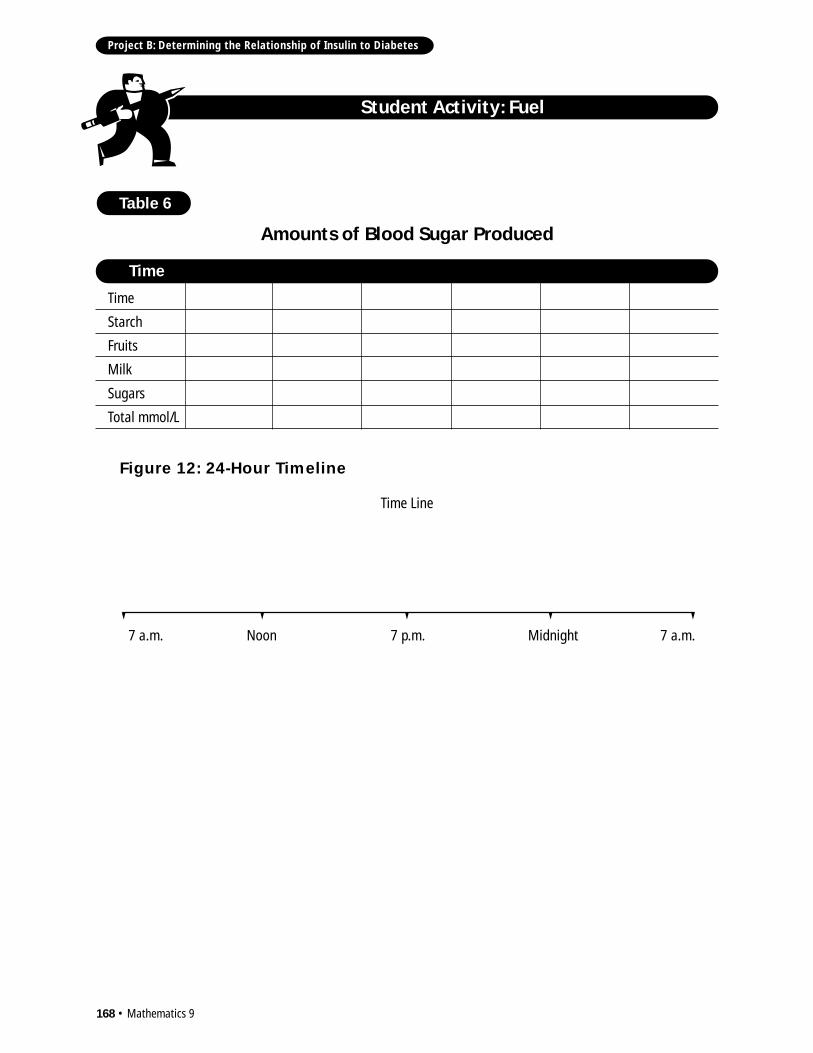
Use the Good Health Eating Guide Poster or equivalent to plan a daily diet.Use the above data to prepare a 24-hour timeline indicating only the bloodsugar level contribution of each of the sources of carbohydrates expressed inmmol/L. You will use this graph later to prepare an insulin regimen.
First, estimate the weight of blood sugar produced by 10 g of carbohydrate,and then, convert this into the number of mmol/L. When you havecompleted the conversions, complete Table 6: Amounts of Blood SugarProduced.
Student Activity: Fuel
168 • Mathematics 9
Project B: Determining the Relationship of Insulin to Diabetes
Student Activity: Fuel
Figure 12: 24-Hour Timeline
7 a.m. Midnight7 p.m.Noon
Time Line
7 a.m.
Table 6
Amounts of Blood Sugar Produced
Time
Time
Starch
Fruits
Milk
Sugars
Total mmol/L
Mathematics 9 • 169
Project B: Determining the Relationship of Insulin to Diabetes
Activity 2: Controlling Diabetes
Objective:
The students develop simple linear models representing two competingprocesses in order to develop their understanding of the coefficients of apolynomial model representing a real situation.
The students solve problems related to insulin deficiency by using theirknowledge of patterns and relations. They propose insulin regimens and solveproblems related to insulin adjustment in cases of low and high readings,illness, exercise and special circumstances.
Materials:
• information pamphlets obtained from the Canadian Diabetes Associationand local Diabetes Education Centres
• Student Activity: Modelling the Blood Sugar Level• Student Activity: Planning the Day• graphing calculator or mathematics software for example Mathcad and
Mathematica• access to a nurse, physician, dietitian, or to a student with diabetes• copies of diabetes diaries• copy of Good Health Eating Guide poster or equivalent
Procedure:
Ask students why people with diabetes regularly monitor their blood glucose(before meals and at bedtime, 1 to 4 times a day).
Diabetics generally use a diary to record their blood glucose levels along withinsulin doses and comments. Comments might include information aboutdelayed meals, extra snacks or having the flu.
Provide students with anonymous diary information from a diabetic sourcewhere blood glucose levels have been monitored during a normal day. Theymust record the measurements on the timeline in Student Activity:Modelling the Blood Sugar Level. They also need to identify and record timesof meals, snacks, and exercise on the timeline.
Modelling Blood Sugar LevelProvide students with examples in Student Activity: Modelling the BloodSugar Level and have them interpret each of the curves. These examplesrepresent different patterns of variation in blood sugar at different timesthroughout the day. Students are asked to find the equation for each curve.
170 • Mathematics 9
Project B: Determining the Relationship of Insulin to Diabetes
For example, in Example 1 the blood glucose level at 7 a.m. is 5 mmol/L.Blood glucose is identified below by the letter g. The function represented byan equation would read:
g = 5 (for t = 7)
In Example 2, the blood sugar level increases from 5 mmol/L at 7 a.m. to 7.5mmol/L at 12 p.m., a period of 5 hours. Have students determine that theequation is:
g = 0.5 t + 5 (for t � 7and t �12) or (7 � t � 12)
In Example 3, the level decreases from 7.5 mmol/L to 5.5 mmol/L over aperiod of 4 hours. The equation should read:
g = -0.5t + 7.5 (for t �12 and t �4) or (12 � t � 4)
In Example 4, the level increases from 5.5 mmol/L to 8.5 mmol/L within anhour. The equation should read:
g = 3t + 5.5 (for t � 4 and t � 5) or (4 � t � 5)
Ensure that students understand the significance of the coefficients of theindependent variable; that is, negative means decrease, positive means an increasein glucose level; the larger the coefficient is, the bigger the increase (input).
Have students compare available readings to these observations and thencomment on the differences in terms of meals, snacks and exercise.
Have students solve the problems in the Student Activity: Modelling theBlood Sugar Level. In these problems they must add or subtract twocompeting processes, that is input and output.
Modelling Insulin ReleaseHave students set a target range for blood glucose control from their 24-hourtimeline glucose level established in the previous activity. They should assumethat the body is not releasing any insulin into the bloodstream. Therecommended target is 4 to 7 mmol/L of glucose.
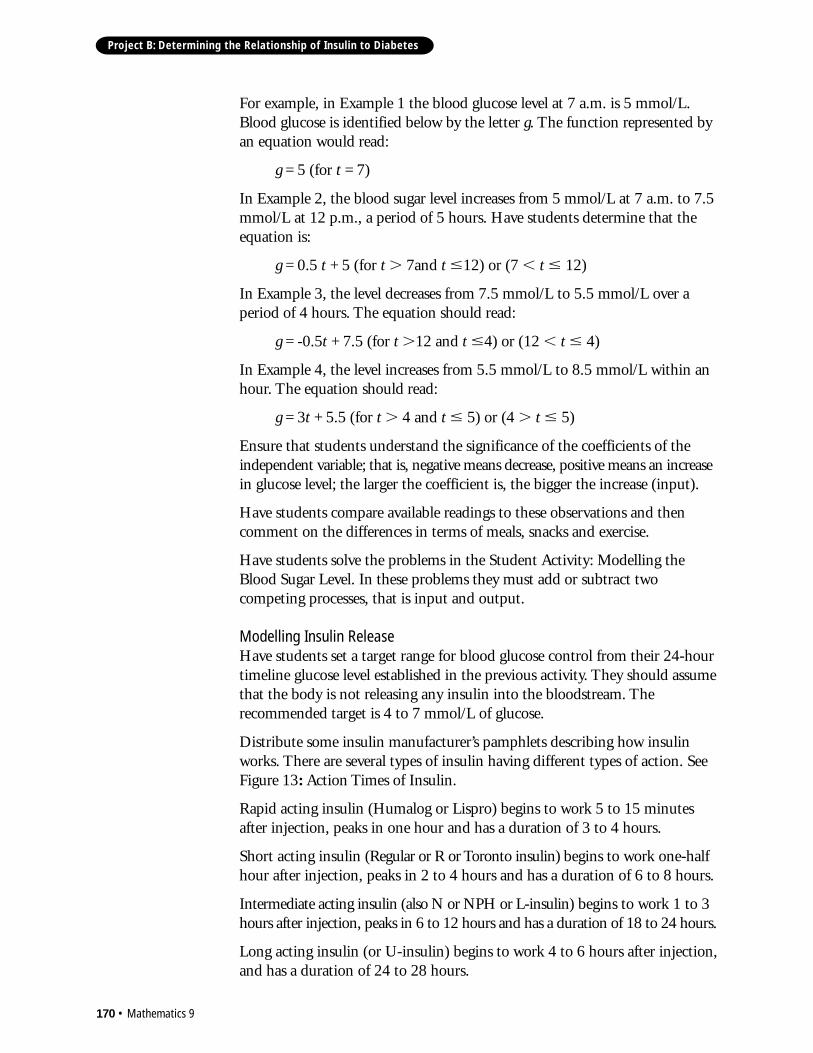
Distribute some insulin manufacturer’s pamphlets describing how insulinworks. There are several types of insulin having different types of action. SeeFigure 13: Action Times of Insulin.
Rapid acting insulin (Humalog or Lispro) begins to work 5 to 15 minutesafter injection, peaks in one hour and has a duration of 3 to 4 hours.
Short acting insulin (Regular or R or Toronto insulin) begins to work one-halfhour after injection, peaks in 2 to 4 hours and has a duration of 6 to 8 hours.
Intermediate acting insulin (also N or NPH or L-insulin) begins to work 1 to 3hours after injection, peaks in 6 to 12 hours and has a duration of 18 to 24 hours.
Long acting insulin (or U-insulin) begins to work 4 to 6 hours after injection,and has a duration of 24 to 28 hours.
Mathematics 9 • 171
Project B: Determining the Relationship of Insulin to Diabetes
Have students determine equations representing each of the four types offunctions for insulin. To do this they need to simplify the model to a linearone by doing the following:
• time 0 to the time insulin begins to work: constant level zone
• time insulin begins to work to peak: increasing zone (linear)
• time insulin stops increasing to time insulin stops working: decreasing zone(linear)
For example, where the release of insulin is denoted by I, the rapid actinginsulin could be modelled by the equations shown below.
I = 0 (for t � 0 and t � 0.4) or (0 � t � 0.4)
I = 40/3 t (for t � 0.4 and t � 1) or (0.4 � t � 1)
I = -10/3 t (t � 1 and t � 4) or (1 � t � 4)
40/3 represents a rate of increase in the insulin level.-10/3 represents a rate of decrease in the insulin level.
Provide students with some typical insulin regimens like those illustrated inFigures 14, 15, and 16 below and have them comment on the patterns inrelation to the increase in blood sugar (input).
Figure 13: Action Times of Insulin
4 hrs 8 hrs
Humalog regular intermediate long
24 hrs
172 • Mathematics 9
Project B: Determining the Relationship of Insulin to Diabetes
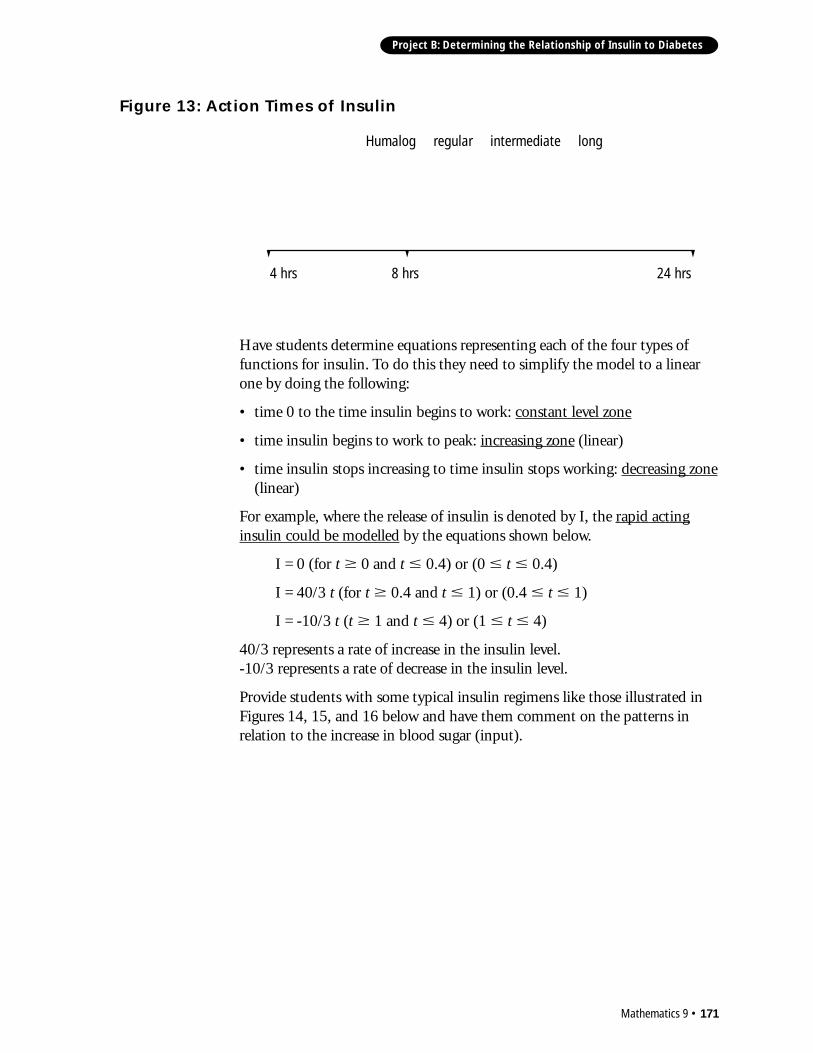
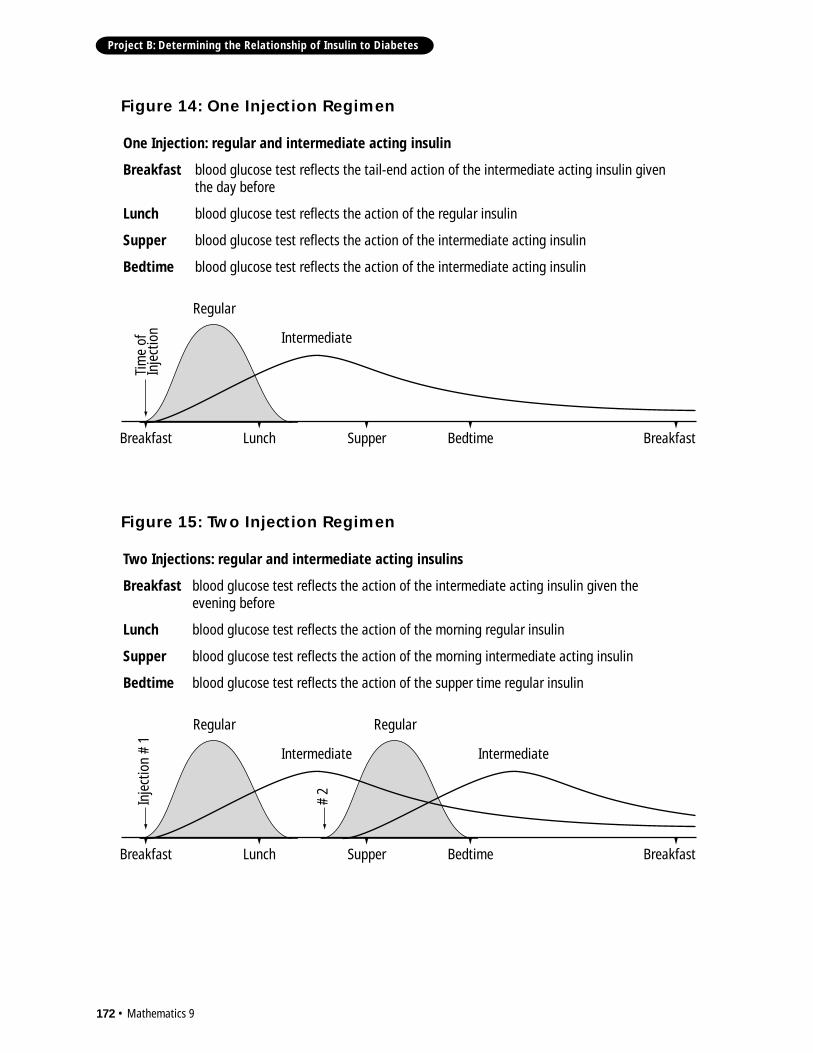
Figure 14: One Injection Regimen
One Injection: regular and intermediate acting insulin
Breakfast blood glucose test reflects the tail-end action of the intermediate acting insulin given the day before
Lunch blood glucose test reflects the action of the regular insulin
Supper blood glucose test reflects the action of the intermediate acting insulin
Bedtime blood glucose test reflects the action of the intermediate acting insulin
Breakfast Lunch Supper Bedtime Breakfast
Intermediate
Regular
Tim
e of
Inje
ctio
n
Regular
Figure 15: Two Injection Regimen
Two Injections: regular and intermediate acting insulins
Breakfast blood glucose test reflects the action of the intermediate acting insulin given the evening before
Lunch blood glucose test reflects the action of the morning regular insulin
Supper blood glucose test reflects the action of the morning intermediate acting insulin
Bedtime blood glucose test reflects the action of the supper time regular insulin
Breakfast Lunch Supper Bedtime Breakfast
Intermediate Intermediate
Regular
Inje
ctio
n #
1
# 2
Mathematics 9 • 173
Project B: Determining the Relationship of Insulin to Diabetes
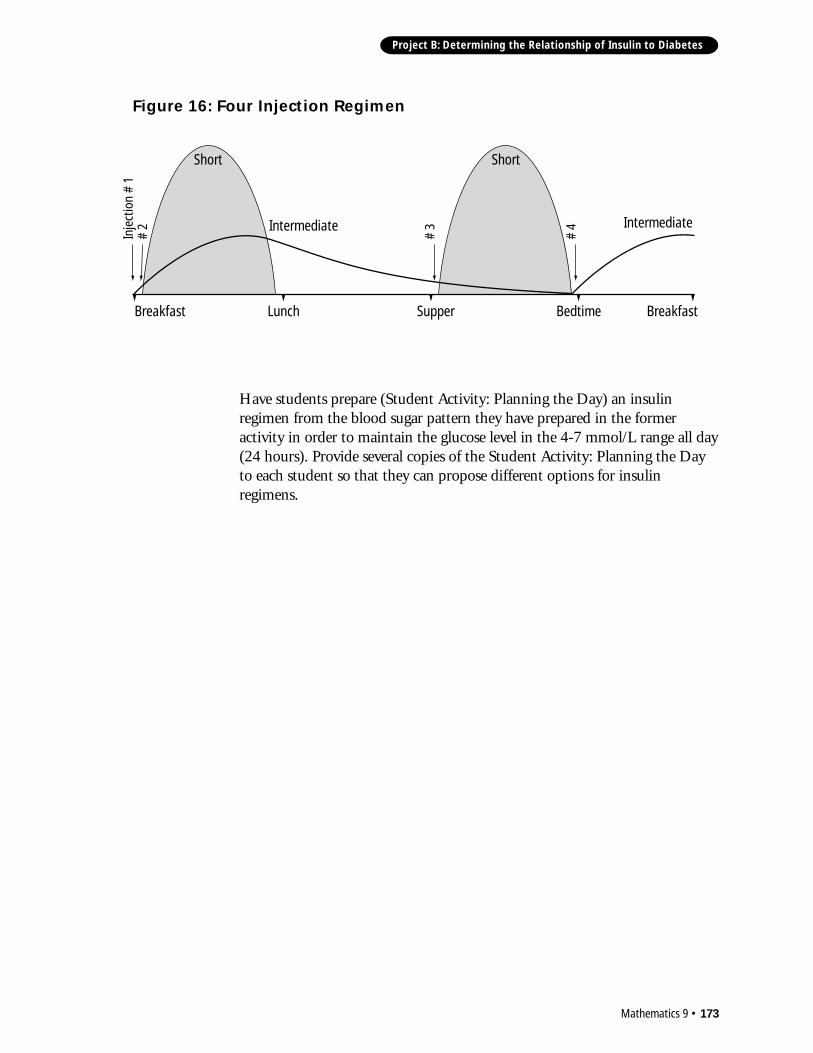
Have students prepare (Student Activity: Planning the Day) an insulinregimen from the blood sugar pattern they have prepared in the formeractivity in order to maintain the glucose level in the 4-7 mmol/L range all day(24 hours). Provide several copies of the Student Activity: Planning the Dayto each student so that they can propose different options for insulinregimens.
Figure 16: Four Injection Regimen
Breakfast BreakfastLunch Supper Bedtime
Intermediate Intermediate
Short Short
Inje
ctio
n #
1
# 3
# 4
# 2
174 • Mathematics 9
Project B: Determining the Relationship of Insulin to Diabetes
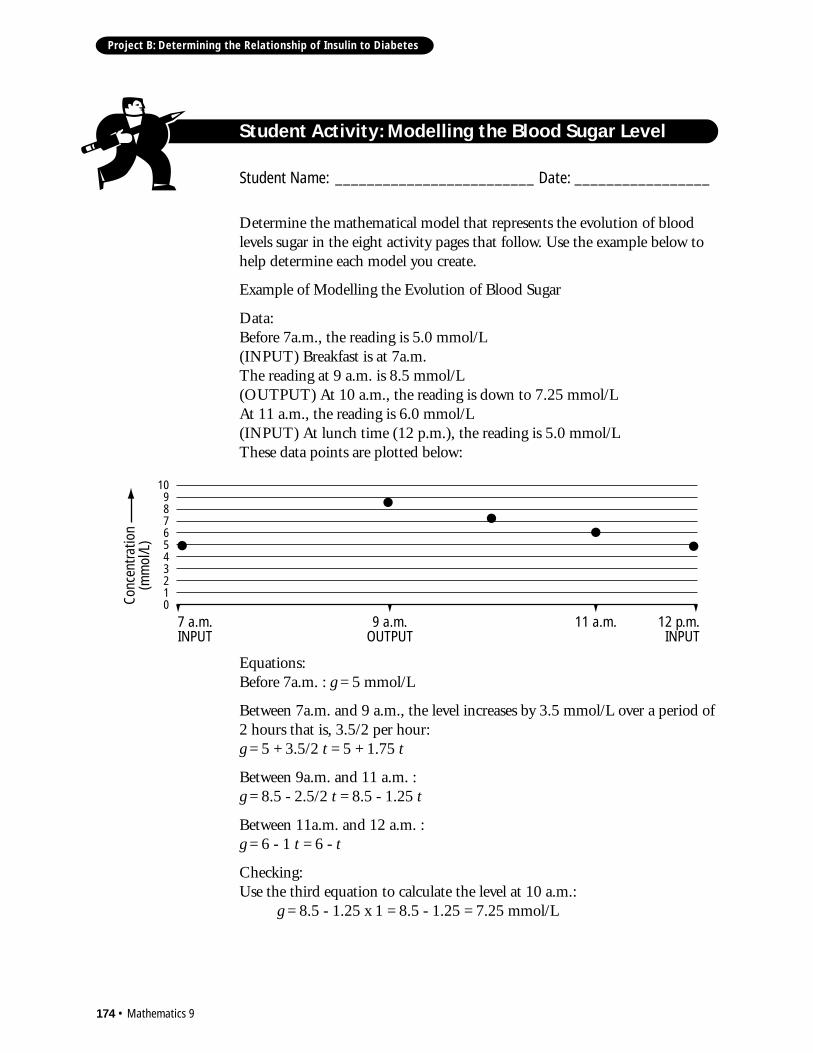
Determine the mathematical model that represents the evolution of bloodlevels sugar in the eight activity pages that follow. Use the example below tohelp determine each model you create.
Example of Modelling the Evolution of Blood Sugar
Data:Before 7a.m., the reading is 5.0 mmol/L(INPUT) Breakfast is at 7a.m.The reading at 9 a.m. is 8.5 mmol/L(OUTPUT) At 10 a.m., the reading is down to 7.25 mmol/LAt 11 a.m., the reading is 6.0 mmol/L(INPUT) At lunch time (12 p.m.), the reading is 5.0 mmol/LThese data points are plotted below:
Equations:Before 7a.m. : g = 5 mmol/L
Between 7a.m. and 9 a.m., the level increases by 3.5 mmol/L over a period of2 hours that is, 3.5/2 per hour:g = 5 + 3.5/2 t = 5 + 1.75 t
Between 9a.m. and 11 a.m. :g = 8.5 - 2.5/2 t = 8.5 - 1.25 t
Between 11a.m. and 12 a.m. :g = 6 - 1 t = 6 - t
Checking:Use the third equation to calculate the level at 10 a.m.:
g = 8.5 - 1.25 x 1 = 8.5 - 1.25 = 7.25 mmol/L
Student Activity: Modelling the Blood Sugar Level
Student Name: _________________________ Date: _________________
7 a.m.INPUT
Conc
entr
atio
n (m
mol
/L)
109876543210
12 p.m.INPUT
9 a.m.OUTPUT
11 a.m.

Mathematics 9 • 175
Project B: Determining the Relationship of Insulin to Diabetes
Student Activity: Modelling the Blood Sugar Level
Example Model #1
7 a.m.INPUT
12 p.m.INPUT
9 a.m.OUTPUT
11 a.m.

176 • Mathematics 9
Project B: Determining the Relationship of Insulin to Diabetes
Student Activity: Modelling the Blood Sugar Level
Example Model #2
7 a.m.INPUT
12 p.m.INPUT
9 a.m.OUTPUT
11 a.m.
Mathematics 9 • 177
Project B: Determining the Relationship of Insulin to Diabetes
Student Activity: Modelling the Blood Sugar Level
Example Model #3
7 a.m.INPUT
12 p.m.INPUT
9 a.m.OUTPUT
11 a.m.

178 • Mathematics 9
Project B: Determining the Relationship of Insulin to Diabetes
Student Activity: Modelling the Blood Sugar Level
Example Model #4
7 a.m.INPUT
12 p.m.INPUT
9 a.m.OUTPUT
11 a.m.

Mathematics 9 • 179
Project B: Determining the Relationship of Insulin to Diabetes
Student Activity: Modelling the Blood Sugar Level
Example Model #5
7 a.m.INPUT
12 p.m.INPUT
9 a.m.OUTPUT
11 a.m.

180 • Mathematics 9
Project B: Determining the Relationship of Insulin to Diabetes
Student Activity: Modelling the Blood Sugar Level
Example Model #6
7 a.m.INPUT
12 p.m.INPUT
9 a.m.OUTPUT
11 a.m.

Mathematics 9 • 181
Project B: Determining the Relationship of Insulin to Diabetes
Student Activity: Modelling the Blood Sugar Level
Example Model #7
7 a.m.INPUT
12 p.m.INPUT
9 a.m.OUTPUT
11 a.m.
182 • Mathematics 9
Project B: Determining the Relationship of Insulin to Diabetes
Student Activity: Modelling the Blood Sugar Level
Example Model #8
7 a.m.INPUT
12 p.m.INPUT
9 a.m.OUTPUT
11 a.m.
Mathematics 9 • 183
Project B: Determining the Relationship of Insulin to Diabetes
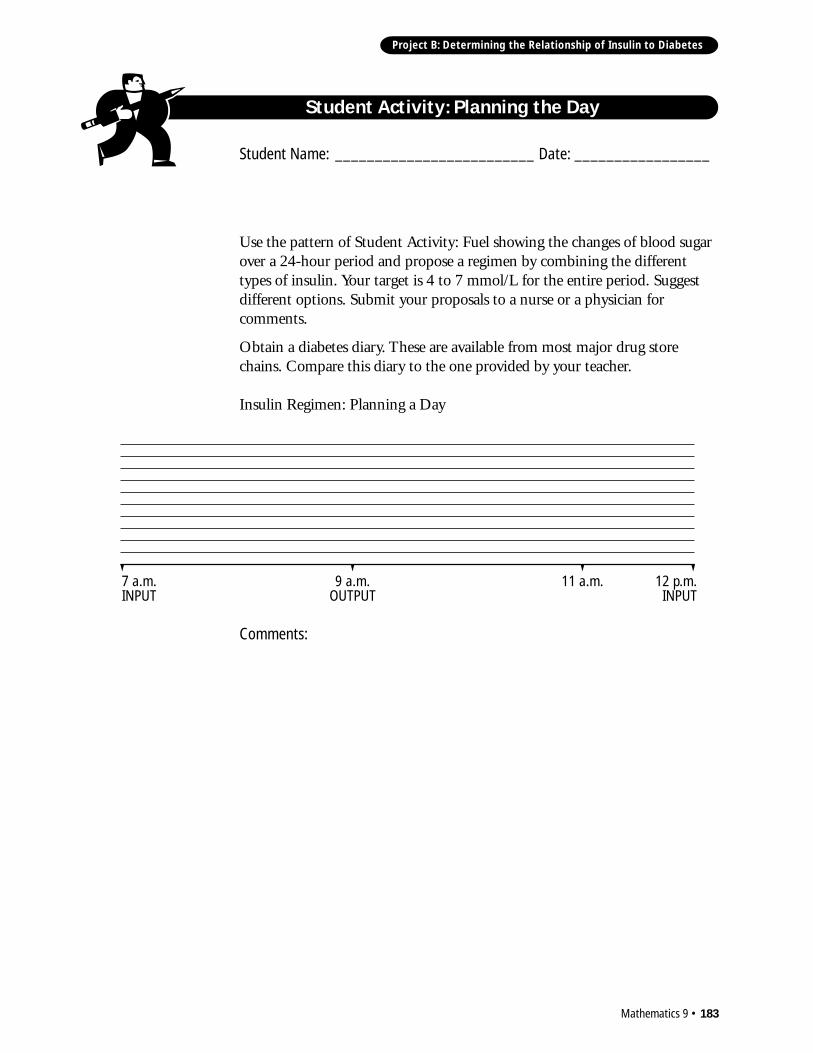
Use the pattern of Student Activity: Fuel showing the changes of blood sugarover a 24-hour period and propose a regimen by combining the differenttypes of insulin. Your target is 4 to 7 mmol/L for the entire period. Suggestdifferent options. Submit your proposals to a nurse or a physician forcomments.
Obtain a diabetes diary. These are available from most major drug storechains. Compare this diary to the one provided by your teacher.
Insulin Regimen: Planning a Day
Comments:
Student Activity: Planning the Day
Student Name: _________________________ Date: _________________
7 a.m.INPUT
12 p.m.INPUT
9 a.m.OUTPUT
11 a.m.
184 • Mathematics 9
Project B: Determining the Relationship of Insulin to Diabetes
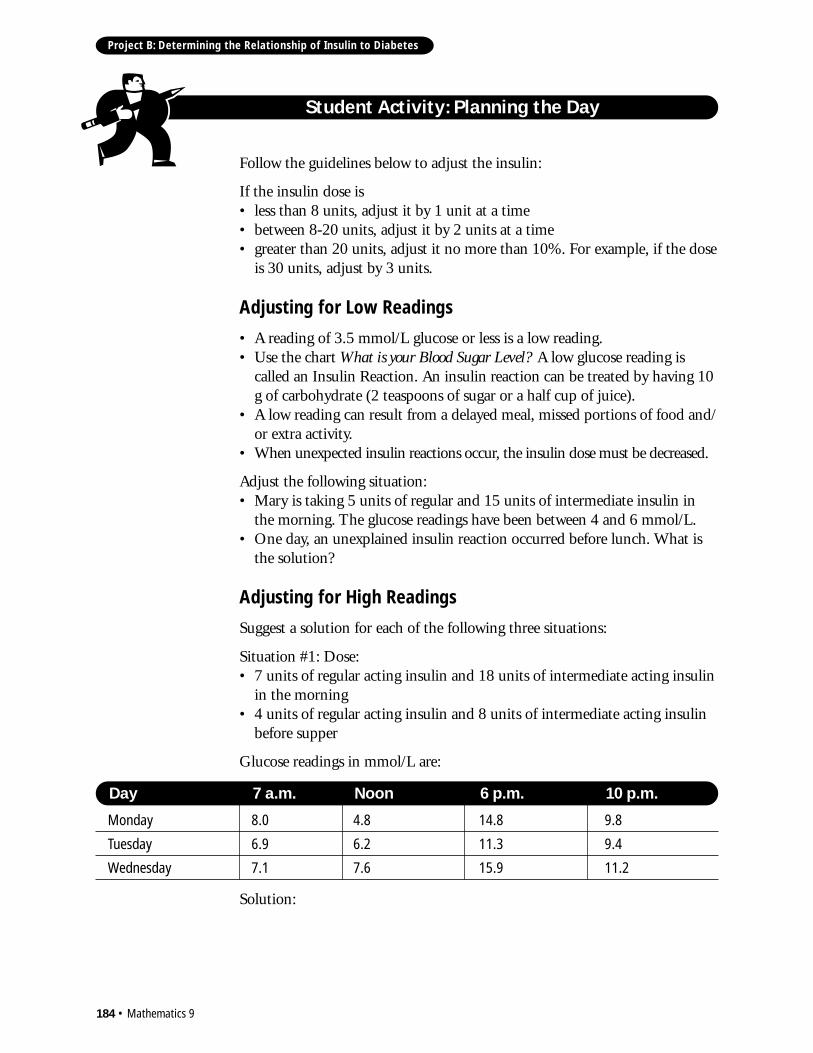
Follow the guidelines below to adjust the insulin:
If the insulin dose is• less than 8 units, adjust it by 1 unit at a time• between 8-20 units, adjust it by 2 units at a time• greater than 20 units, adjust it no more than 10%. For example, if the dose
is 30 units, adjust by 3 units.
Adjusting for Low Readings
• A reading of 3.5 mmol/L glucose or less is a low reading.• Use the chart What is your Blood Sugar Level? A low glucose reading is
called an Insulin Reaction. An insulin reaction can be treated by having 10g of carbohydrate (2 teaspoons of sugar or a half cup of juice).
• A low reading can result from a delayed meal, missed portions of food and/or extra activity.
• When unexpected insulin reactions occur, the insulin dose must be decreased.
Adjust the following situation:• Mary is taking 5 units of regular and 15 units of intermediate insulin in
the morning. The glucose readings have been between 4 and 6 mmol/L.• One day, an unexplained insulin reaction occurred before lunch. What is
the solution?
Adjusting for High Readings
Suggest a solution for each of the following three situations:
Situation #1: Dose:• 7 units of regular acting insulin and 18 units of intermediate acting insulin
in the morning• 4 units of regular acting insulin and 8 units of intermediate acting insulin
before supper
Glucose readings in mmol/L are:
Day 7 a.m. Noon 6 p.m. 10 p.m.
Monday 8.0 4.8 14.8 9.8
Tuesday 6.9 6.2 11.3 9.4
Wednesday 7.1 7.6 15.9 11.2
Student Activity: Planning the Day
Solution:
Mathematics 9 • 185
Project B: Determining the Relationship of Insulin to Diabetes
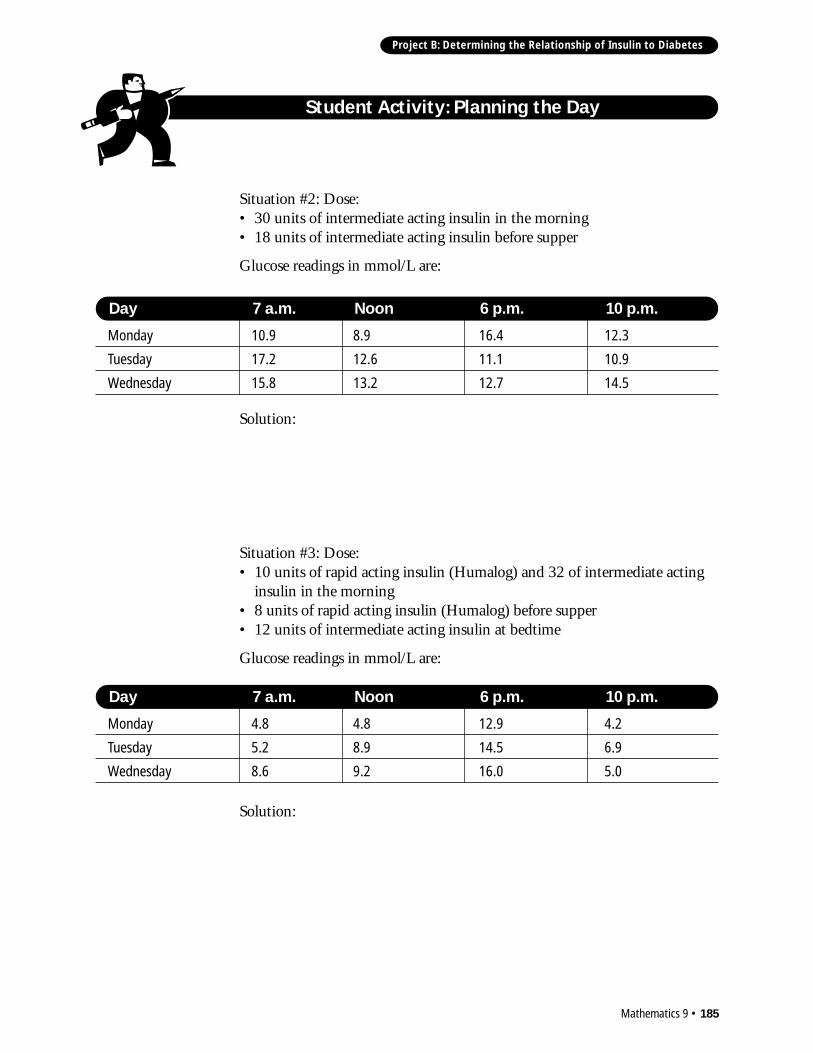
Situation #2: Dose:• 30 units of intermediate acting insulin in the morning• 18 units of intermediate acting insulin before supper
Glucose readings in mmol/L are:
Solution:
Situation #3: Dose:• 10 units of rapid acting insulin (Humalog) and 32 of intermediate acting
insulin in the morning• 8 units of rapid acting insulin (Humalog) before supper• 12 units of intermediate acting insulin at bedtime
Glucose readings in mmol/L are:
Solution:
Day 7 a.m. Noon 6 p.m. 10 p.m.
Monday 10.9 8.9 16.4 12.3
Tuesday 17.2 12.6 11.1 10.9
Wednesday 15.8 13.2 12.7 14.5
Day 7 a.m. Noon 6 p.m. 10 p.m.
Monday 4.8 4.8 12.9 4.2
Tuesday 5.2 8.9 14.5 6.9
Wednesday 8.6 9.2 16.0 5.0
Student Activity: Planning the Day
186 • Mathematics 9
Project B: Determining the Relationship of Insulin to Diabetes
Activity 3: Modelling Two Competing Processes
Objective:
The objective of this activity is for students to develop simple linear modelsrepresenting two competing processes. This helps develop theirunderstanding of the coefficients of a polynomial model representing a realsituation. The students solve problems related to insulin deficiency by usingtheir knowledge of patterns and relations. They propose insulin regimens andsolve problems related to insulin adjustment in situations of low and highreadings, illness, exercise and special circumstance. They extend theirknowledge by designing a situation where two competing processes areinvolved.
Materials:
• information pamphlets obtained from the Canadian Diabetes Associationand local Diabetes Education Centers
Procedure:
1. Introduction
Assume that y represents a population and t represents time. An example ofan increasing process is one in which the size of population grows, while adecreasing process is one in which the population decays.
When these two processes (both linear) are combined, the overall result is thesum of the two linear models.
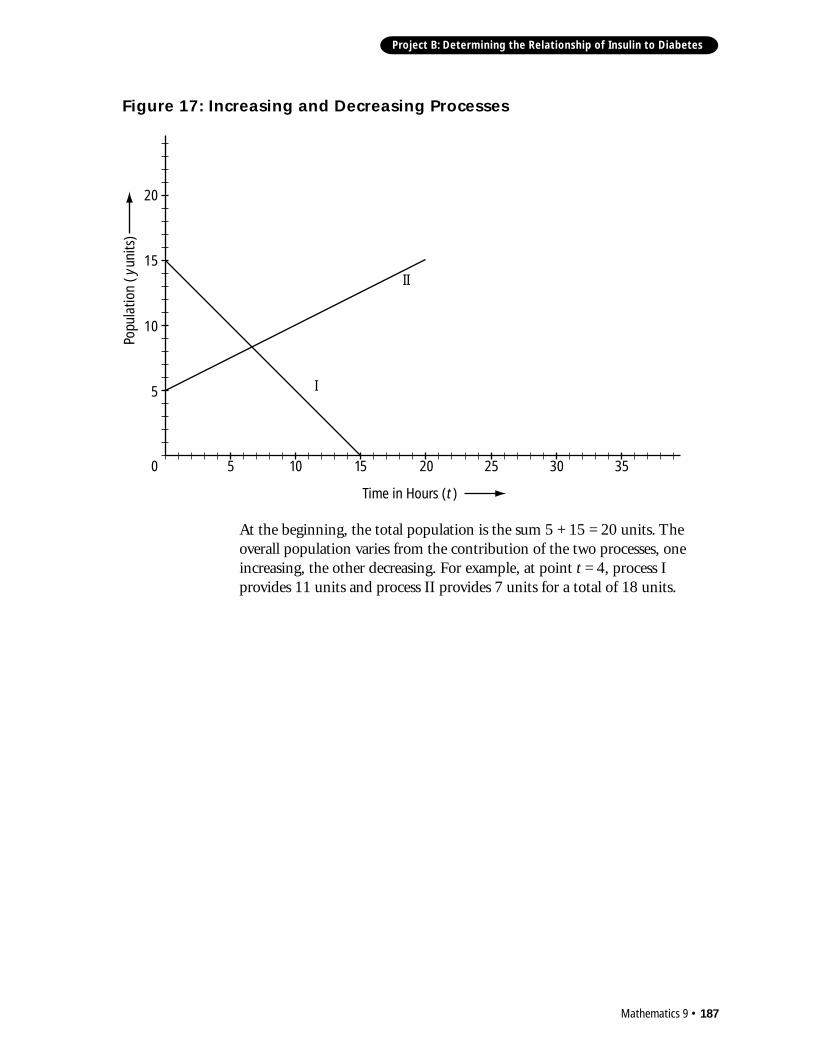
Figure 17: Increasing and Decreasing Processes illustrates two processes:
I: y = - t + 15 (decreasing at a rate of -1 U/h from 15)
II: y = 0.5t + 5 (increasing at a rate of 0.5 U/h from 5)
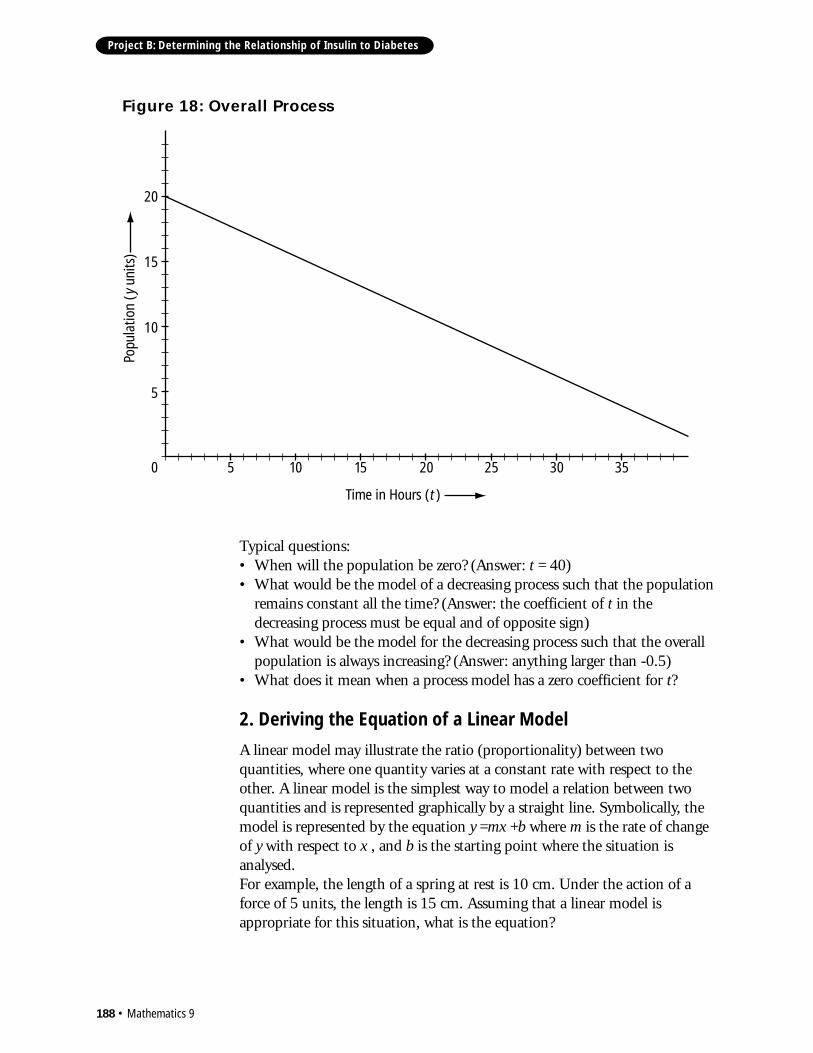
Overall process (Figure 18: Overall Process)Y = -t + 15 + 0.5t + 5 = -0.5t + 20 (decreasing at a rate of -0.5 U/h from 20)
Mathematics 9 • 187
Project B: Determining the Relationship of Insulin to Diabetes
At the beginning, the total population is the sum 5 + 15 = 20 units. Theoverall population varies from the contribution of the two processes, oneincreasing, the other decreasing. For example, at point t = 4, process Iprovides 11 units and process II provides 7 units for a total of 18 units.
Figure 17: Increasing and Decreasing Processes
50
5
10
15
20
10 15 20 25 30 35
Time in Hours ( )
I
II
t
Popu
latio
n (
uni
ts)
y
188 • Mathematics 9
Project B: Determining the Relationship of Insulin to Diabetes
Typical questions:• When will the population be zero? (Answer: t = 40)• What would be the model of a decreasing process such that the population
remains constant all the time? (Answer: the coefficient of t in thedecreasing process must be equal and of opposite sign)
• What would be the model for the decreasing process such that the overallpopulation is always increasing? (Answer: anything larger than -0.5)
• What does it mean when a process model has a zero coefficient for t?
2. Deriving the Equation of a Linear Model
A linear model may illustrate the ratio (proportionality) between twoquantities, where one quantity varies at a constant rate with respect to theother. A linear model is the simplest way to model a relation between twoquantities and is represented graphically by a straight line. Symbolically, themodel is represented by the equation y =mx +b where m is the rate of changeof y with respect to x , and b is the starting point where the situation isanalysed.For example, the length of a spring at rest is 10 cm. Under the action of aforce of 5 units, the length is 15 cm. Assuming that a linear model isappropriate for this situation, what is the equation?
Figure 18: Overall Process
50
5
10
15
20
10 15 20 25 30 35
Popu
latio
n (
uni
ts)
Time in Hours ( )t
y
Mathematics 9 • 189
Project B: Determining the Relationship of Insulin to Diabetes
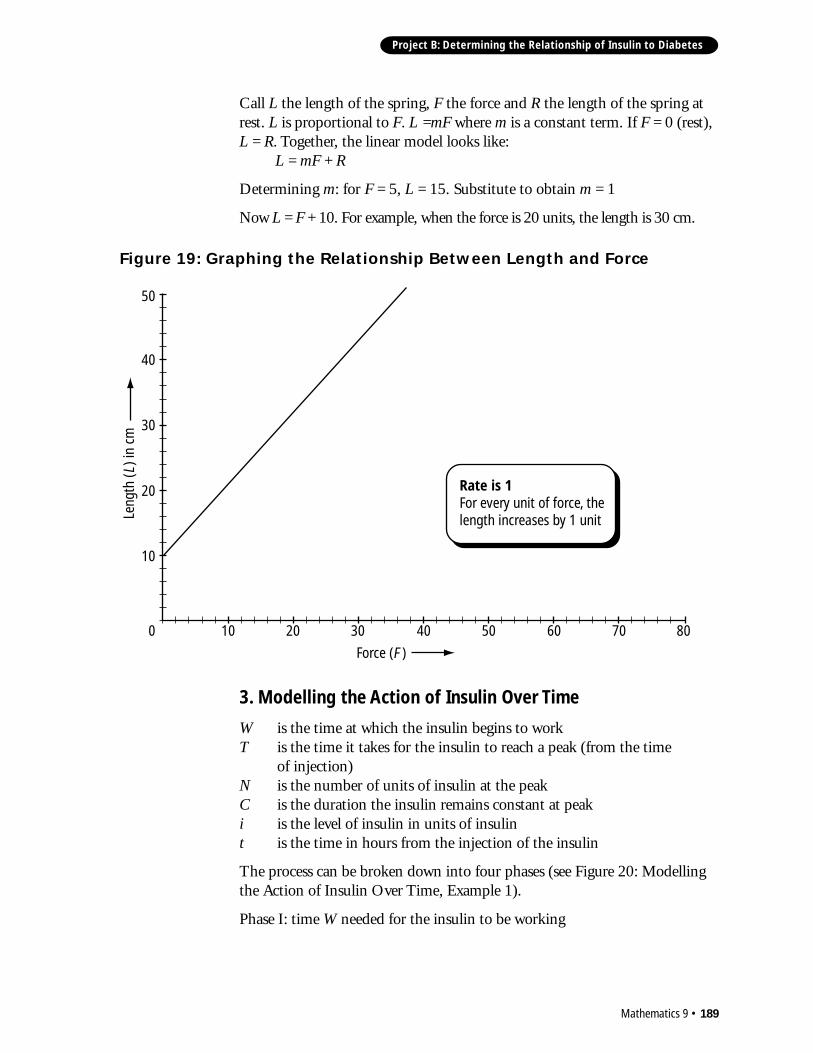
Call L the length of the spring, F the force and R the length of the spring atrest. L is proportional to F. L =mF where m is a constant term. If F = 0 (rest),L = R. Together, the linear model looks like:
L = mF + R
Determining m: for F = 5, L = 15. Substitute to obtain m = 1
Now L = F + 10. For example, when the force is 20 units, the length is 30 cm.
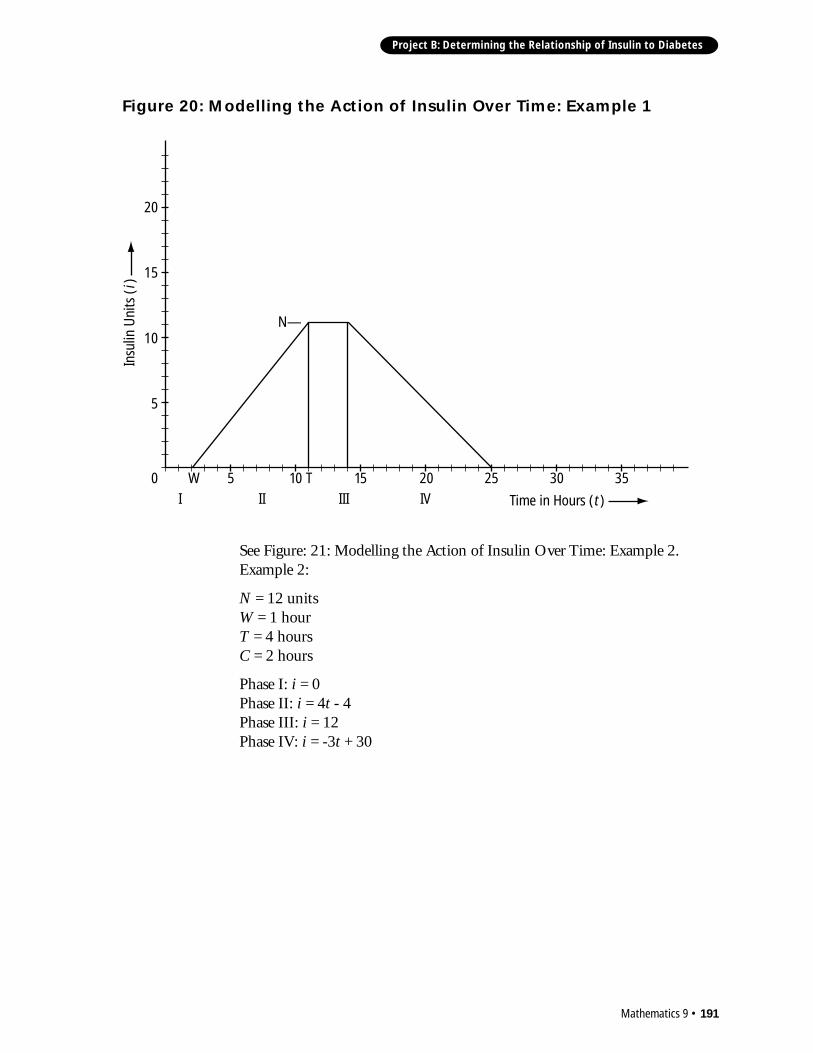
3. Modelling the Action of Insulin Over Time
W is the time at which the insulin begins to workT is the time it takes for the insulin to reach a peak (from the time
of injection)N is the number of units of insulin at the peakC is the duration the insulin remains constant at peaki is the level of insulin in units of insulint is the time in hours from the injection of the insulin
The process can be broken down into four phases (see Figure 20: Modellingthe Action of Insulin Over Time, Example 1).
Phase I: time W needed for the insulin to be working
Figure 19: Graphing the Relationship Between Length and Force
100
10
20
30
40
50
20 30 40 50 60 70 80
Rate is 1For every unit of force, the length increases by 1 unit
Force ( )F
Leng
th (
) in
cm
L
190 • Mathematics 9
Project B: Determining the Relationship of Insulin to Diabetes
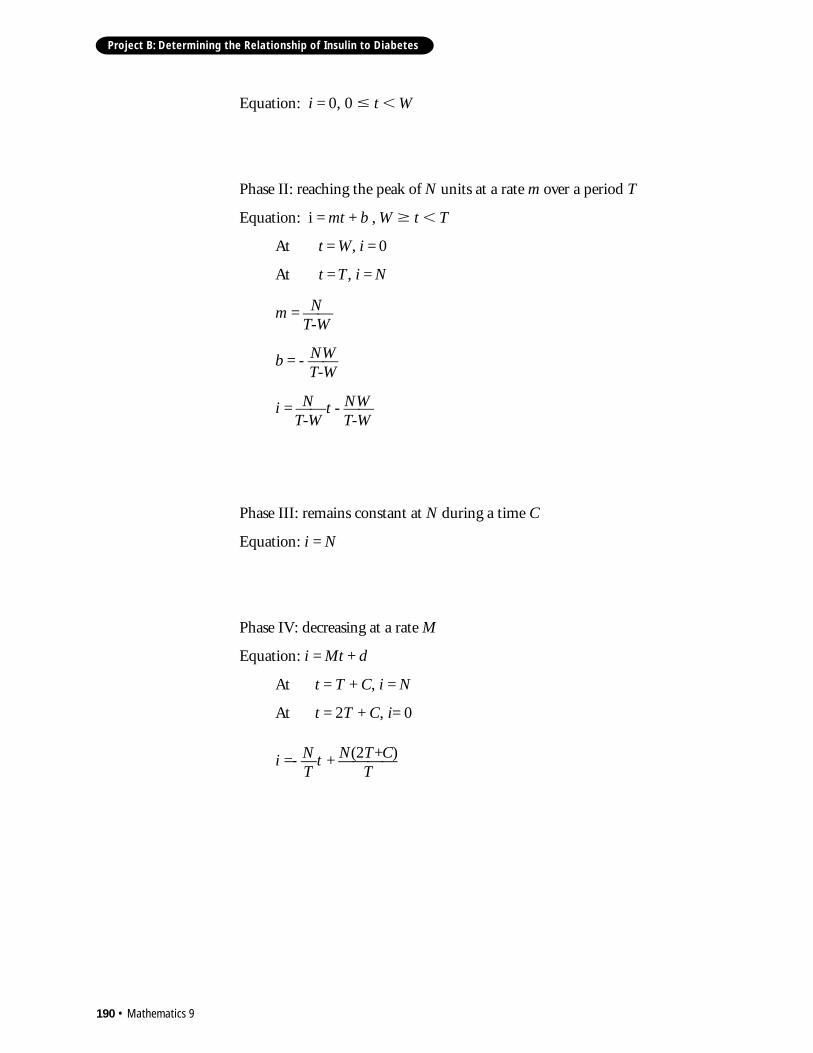
Equation: i = 0, 0 � t � W
Phase II: reaching the peak of N units at a rate m over a period T
Equation: i = mt + b , W � t � T
At t = W, i = 0
At t = T, i = N
m = ——
b = - ——
i = ——t - ——
Phase III: remains constant at N during a time C
Equation: i = N
Phase IV: decreasing at a rate M
Equation: i = Mt + d
At t = T + C, i = N
At t = 2T + C, i= 0
i =- —t + ————
NT-W
NWT-W
NT-W
NWT-W
NT
N(2T+C)T
Mathematics 9 • 191
Project B: Determining the Relationship of Insulin to Diabetes
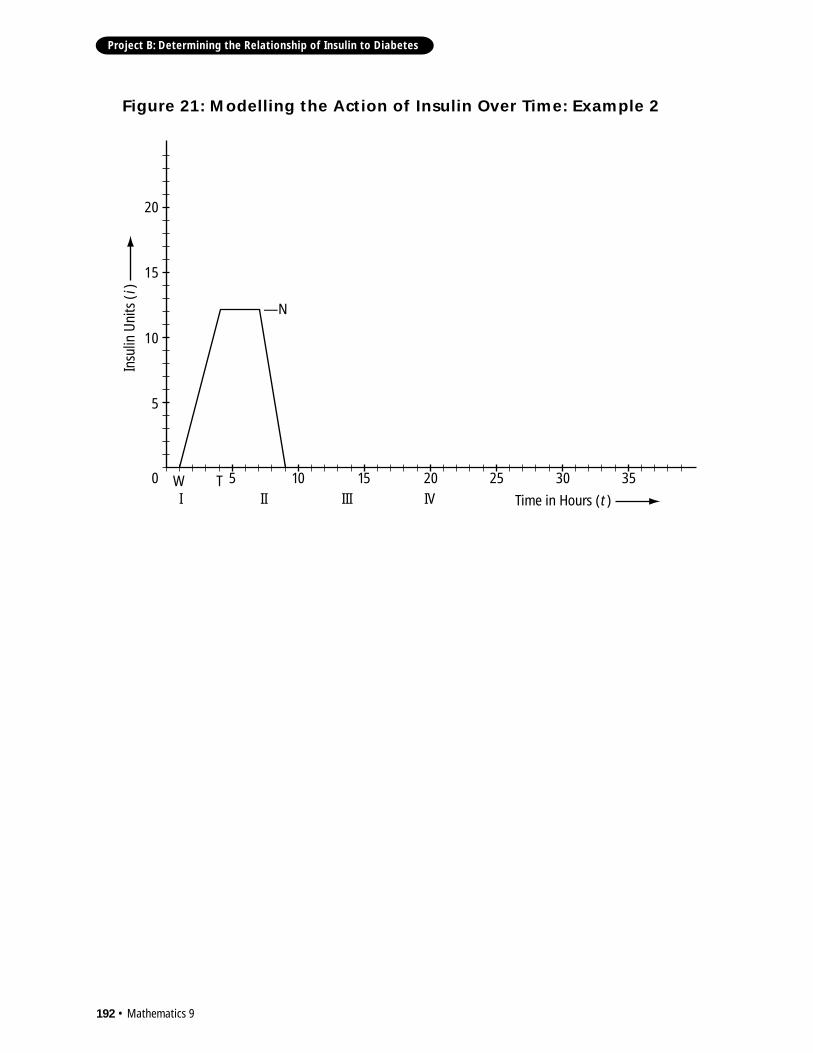
See Figure: 21: Modelling the Action of Insulin Over Time: Example 2.Example 2:
N = 12 unitsW = 1 hourT = 4 hoursC = 2 hours
Phase I: i = 0Phase II: i = 4t - 4Phase III: i = 12Phase IV: i = -3t + 30
Figure 20: Modelling the Action of Insulin Over Time: Example 1
50
5
10
15
20
10 15 20 25 30 35
Time in Hours ( ) I
N—
W TII III IV t
Insu
lin U
nits
( )i
192 • Mathematics 9
Project B: Determining the Relationship of Insulin to Diabetes
Figure 21: Modelling the Action of Insulin Over Time: Example 2
50
5
—N
TW
10
15
20
10 15 20 25 30 35
Time in Hours ( ) I II III IV t
Insu
lin U
nits
( ) i
Mathematics 9 • 193
Project B: Determining the Relationship of Insulin to Diabetes
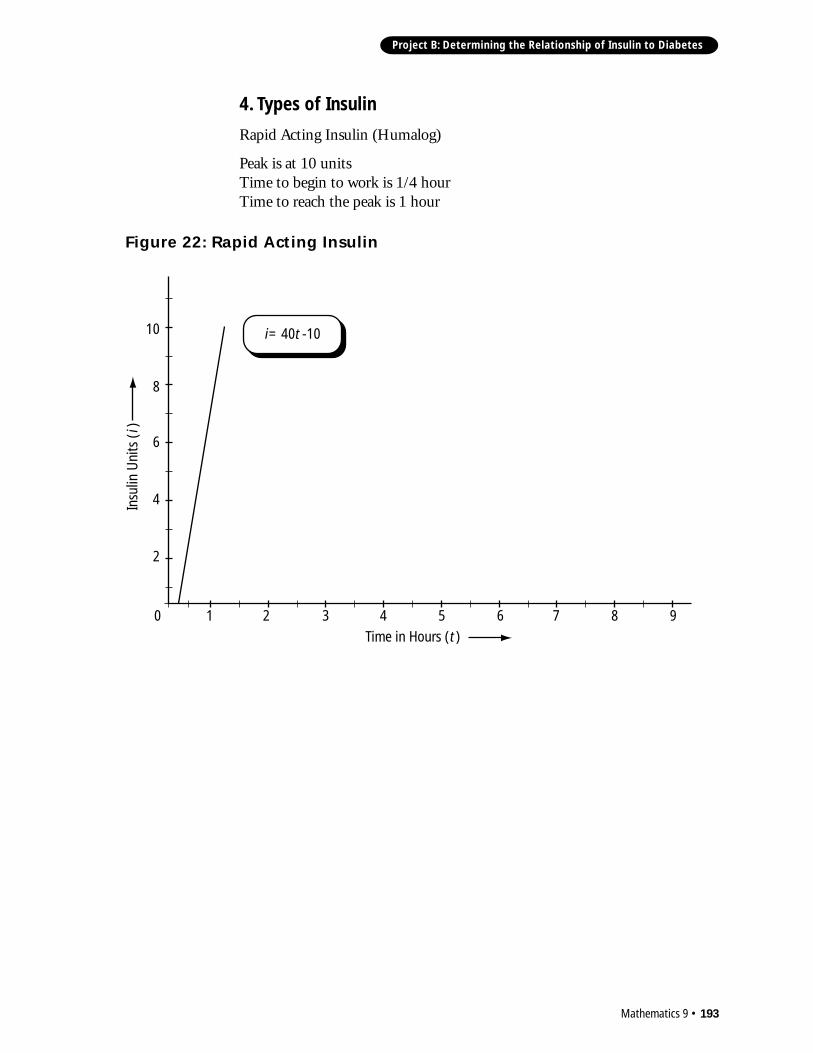
4. Types of Insulin
Rapid Acting Insulin (Humalog)
Peak is at 10 unitsTime to begin to work is 1/4 hourTime to reach the peak is 1 hour
Figure 22: Rapid Acting Insulin
10
2
4
6
8
10
2 3 4 5 6 7 8 9
= 40 -10i t
Insu
lin U
nits
( )i
Time in Hours ( ) t
194 • Mathematics 9
Project B: Determining the Relationship of Insulin to Diabetes
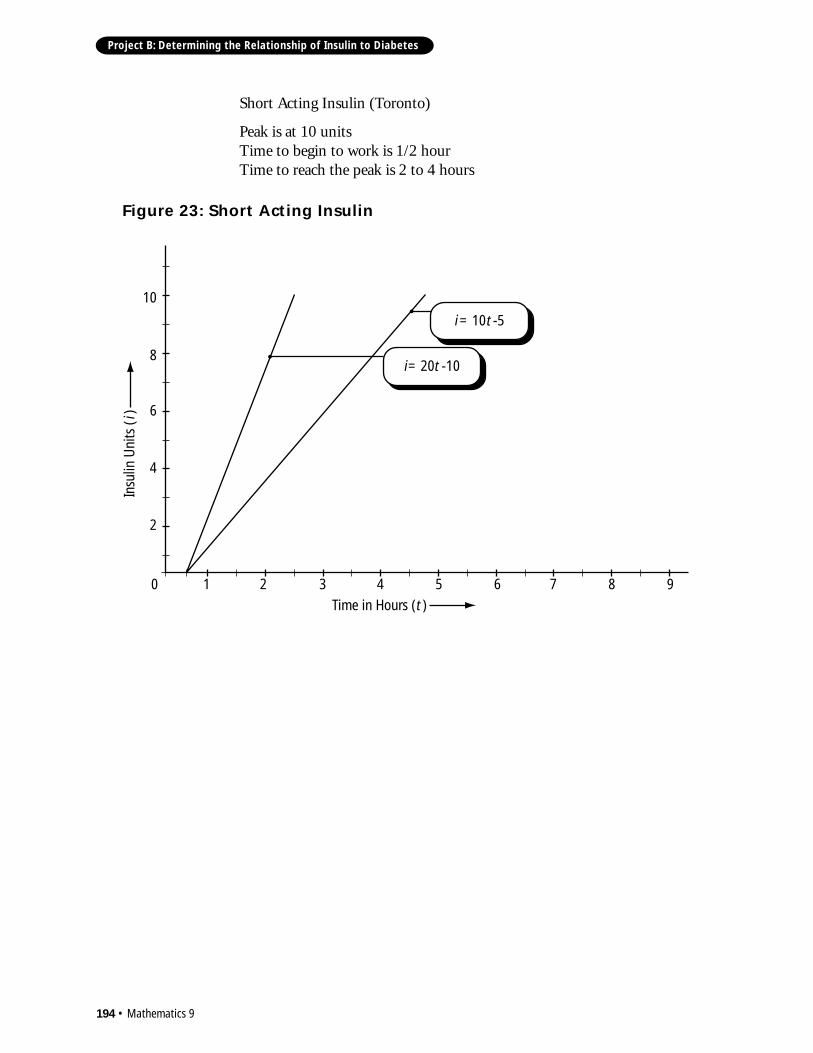
Short Acting Insulin (Toronto)
Peak is at 10 unitsTime to begin to work is 1/2 hourTime to reach the peak is 2 to 4 hours
Figure 23: Short Acting Insulin
10
2
4
6
8
10
2 3 4 5 6 7 8 9
= 20 -10i t
= 10 -5i t
Insu
lin U
nits
( )i
Time in Hours ( ) t
Mathematics 9 • 195
Project B: Determining the Relationship of Insulin to Diabetes
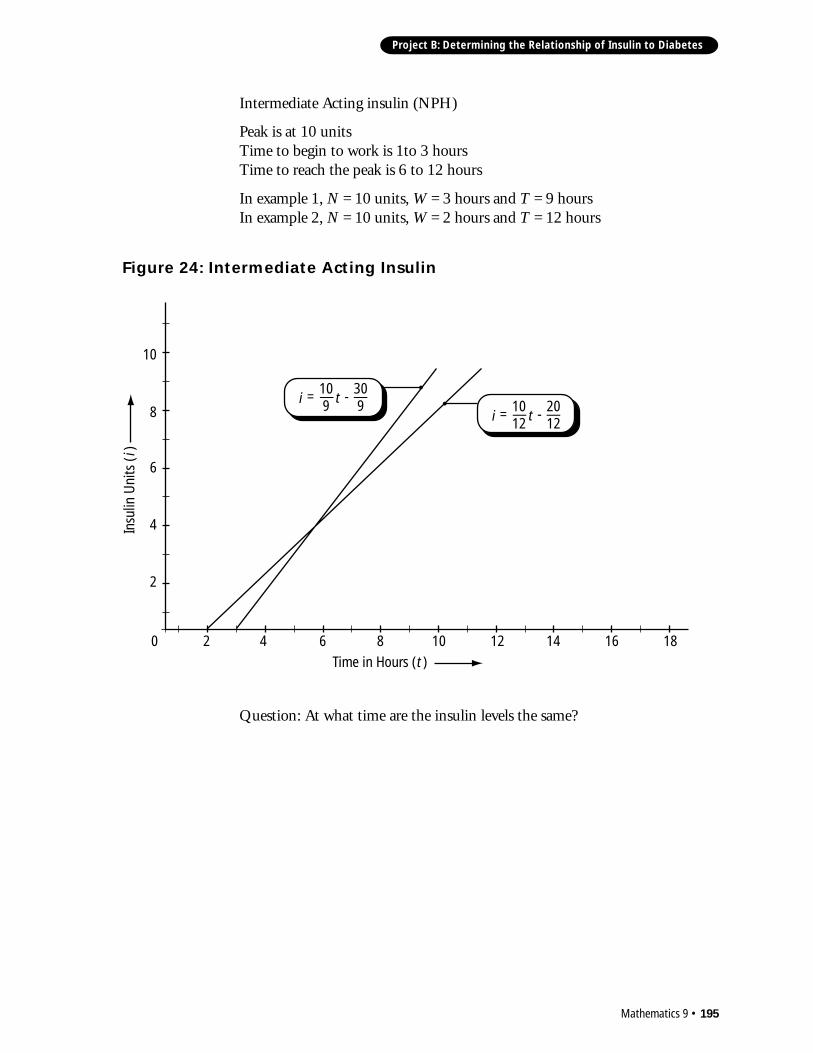
Intermediate Acting insulin (NPH)
Peak is at 10 unitsTime to begin to work is 1to 3 hoursTime to reach the peak is 6 to 12 hours
In example 1, N = 10 units, W = 3 hours and T = 9 hoursIn example 2, N = 10 units, W = 2 hours and T = 12 hours
Question: At what time are the insulin levels the same?
Figure 24: Intermediate Acting Insulin
20
2
4
6
8
10
4 6 8 10 12 14 16 18
= — -i t109
—309 = — -i t
1012
—2012
Time in Hours ( ) t
Insu
lin U
nits
( )i
196 • Mathematics 9
Project B: Determining the Relationship of Insulin to Diabetes
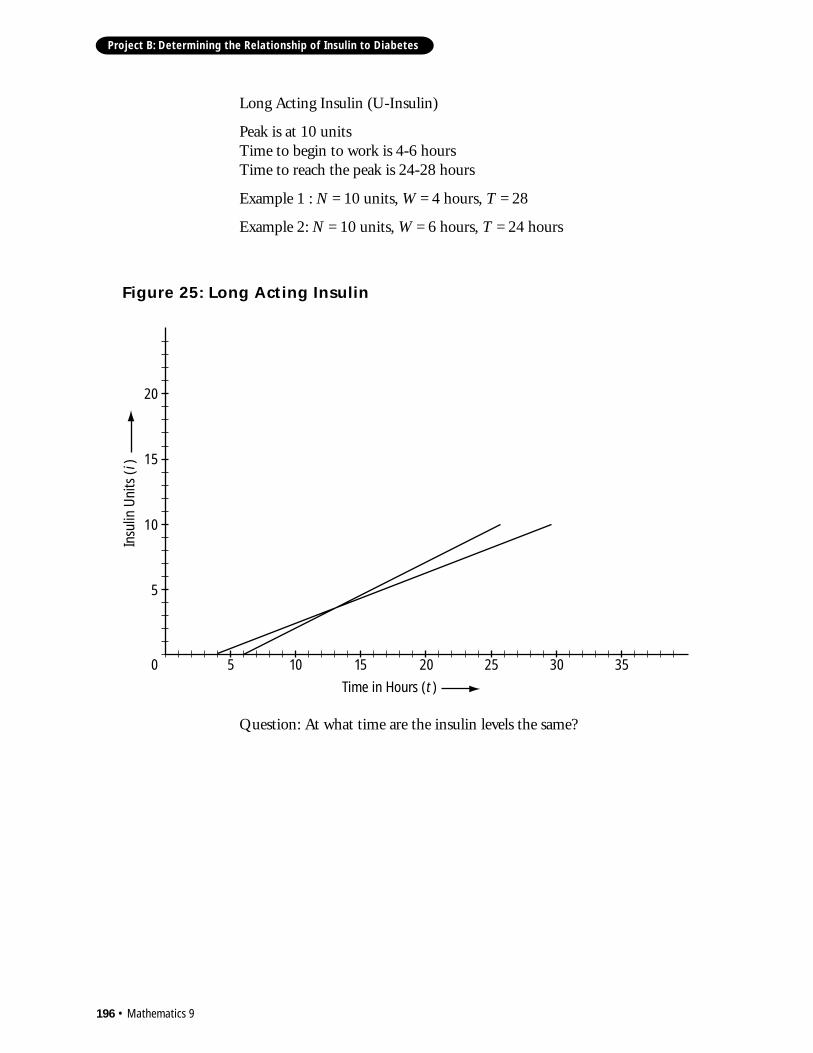
Long Acting Insulin (U-Insulin)
Peak is at 10 unitsTime to begin to work is 4-6 hoursTime to reach the peak is 24-28 hours
Example 1 : N = 10 units, W = 4 hours, T = 28
Example 2: N = 10 units, W = 6 hours, T = 24 hours
Question: At what time are the insulin levels the same?
Figure 25: Long Acting Insulin
50
5
10
15
20
10 15 20 25 30 35
Time in Hours ( ) t
Insu
lin U
nits
( )i
Mathematics 9 • 197
Project B: Determining the Relationship of Insulin to Diabetes
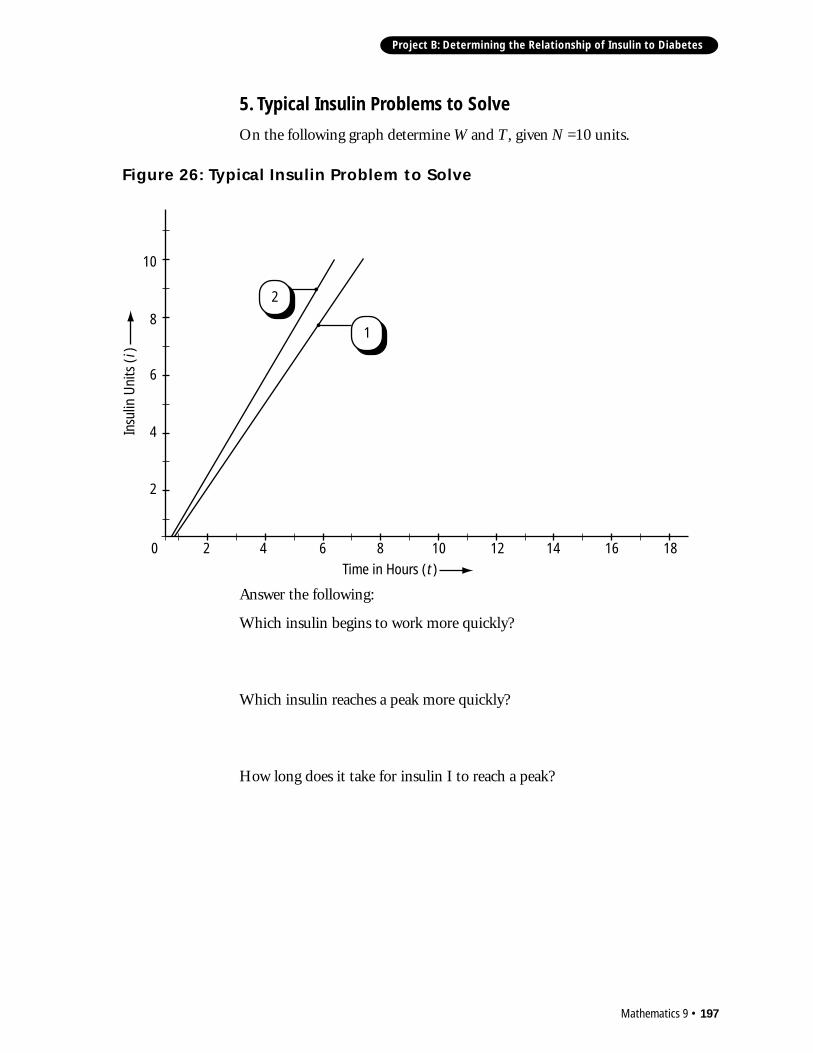
5. Typical Insulin Problems to Solve
On the following graph determine W and T, given N =10 units.
Answer the following:
Which insulin begins to work more quickly?
Which insulin reaches a peak more quickly?
How long does it take for insulin I to reach a peak?
Figure 26: Typical Insulin Problem to Solve
20
2
4
6
8
10
4 6 8 10 12 14 16 18
Insu
lin U
nits
( )
Time in Hours ( )
2
1
t
i
198 • Mathematics 9
Project B: Determining the Relationship of Insulin to Diabetes
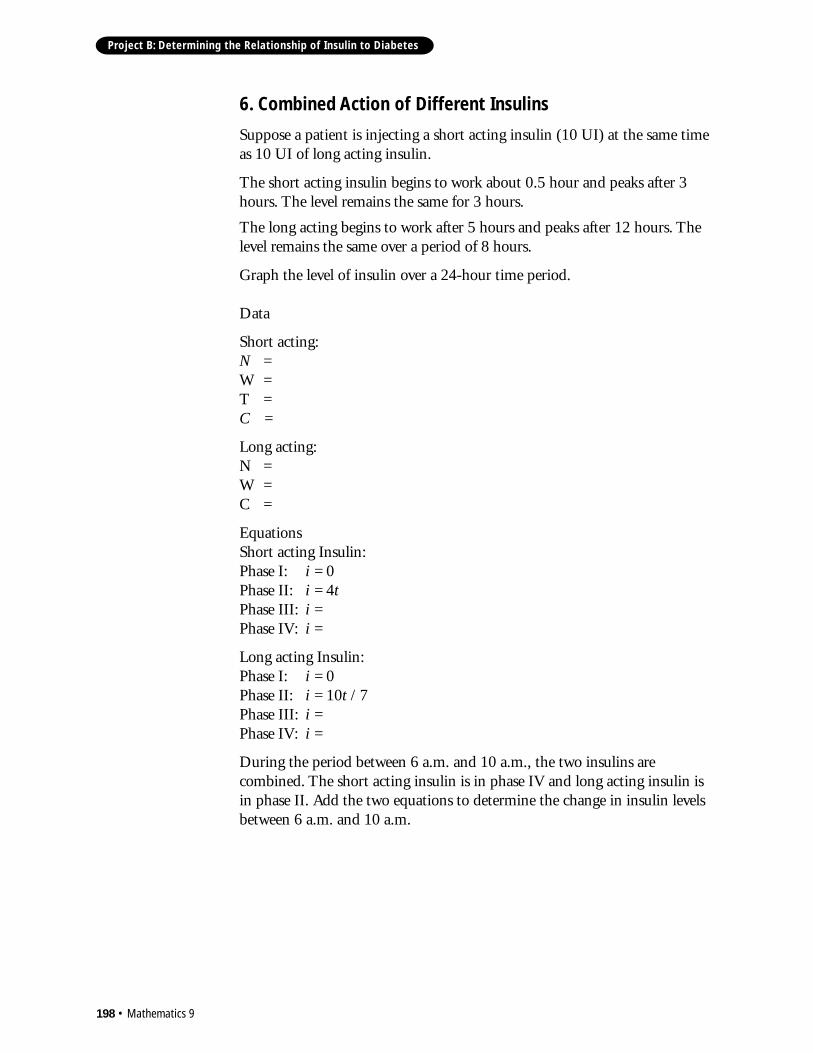
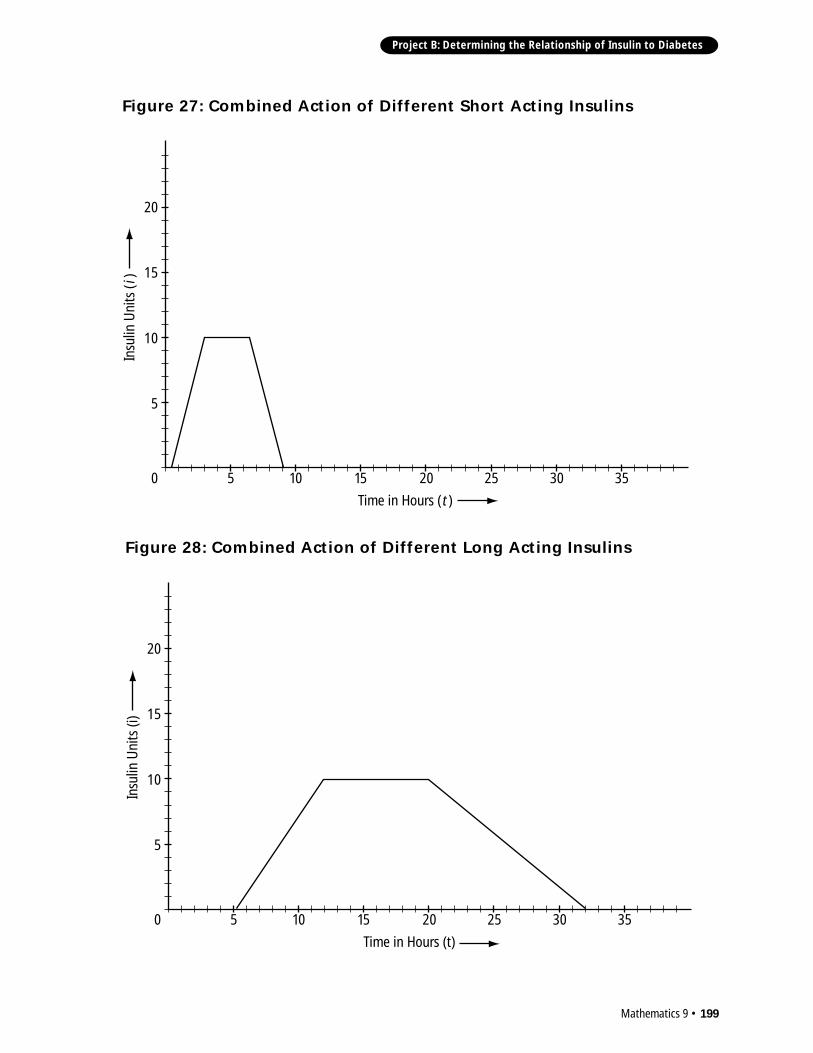
6. Combined Action of Different Insulins
Suppose a patient is injecting a short acting insulin (10 UI) at the same timeas 10 UI of long acting insulin.
The short acting insulin begins to work about 0.5 hour and peaks after 3hours. The level remains the same for 3 hours.
The long acting begins to work after 5 hours and peaks after 12 hours. Thelevel remains the same over a period of 8 hours.
Graph the level of insulin over a 24-hour time period.
Data
Short acting:N =W =T =C =
Long acting:N =W =C =
EquationsShort acting Insulin:Phase I: i = 0Phase II: i = 4tPhase III: i =Phase IV: i =
Long acting Insulin:Phase I: i = 0Phase II: i = 10t / 7Phase III: i =Phase IV: i =
During the period between 6 a.m. and 10 a.m., the two insulins arecombined. The short acting insulin is in phase IV and long acting insulin isin phase II. Add the two equations to determine the change in insulin levelsbetween 6 a.m. and 10 a.m.
Mathematics 9 • 199
Project B: Determining the Relationship of Insulin to Diabetes
Figure 27: Combined Action of Different Short Acting Insulins
50
5
10
15
20
10 15 20 25 30 35
Insu
lin U
nits
( )
Time in Hours ( ) t
i
Figure 28: Combined Action of Different Long Acting Insulins
50
5
10
15
20
10 15 20 25 30 35
Insu
lin U
nits
(i)
Time in Hours (t)
200 • Mathematics 9
Project B: Determining the Relationship of Insulin to Diabetes
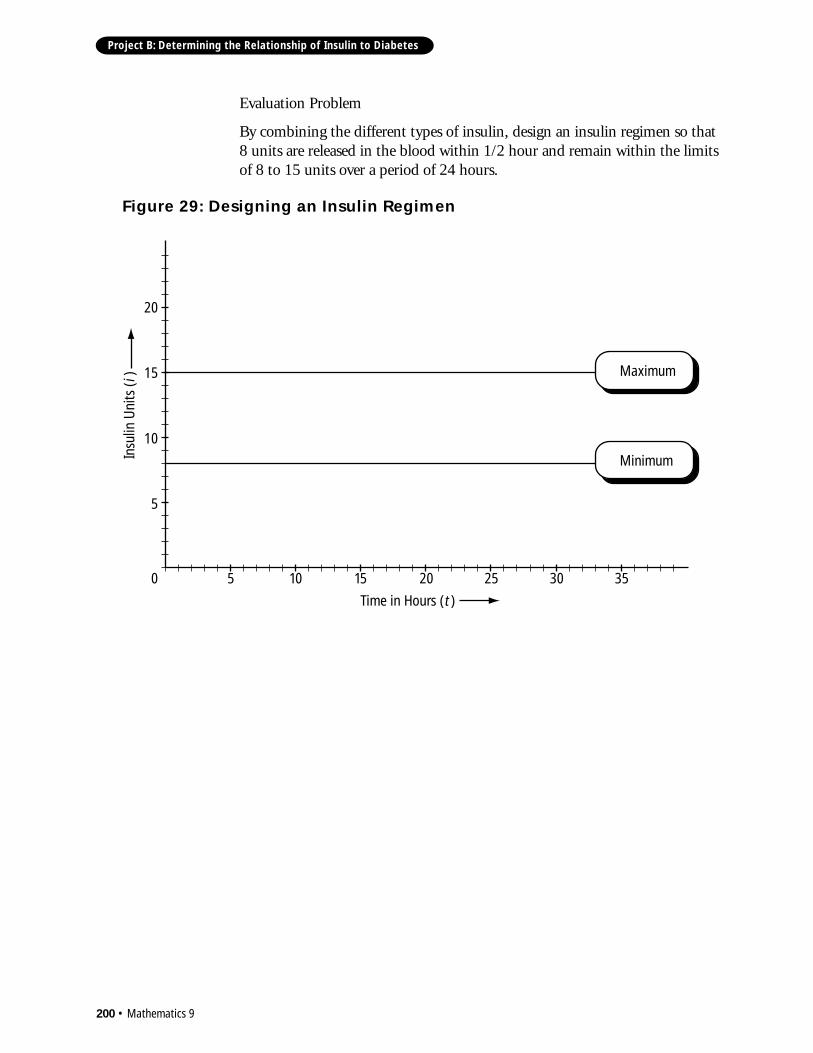
Evaluation Problem
By combining the different types of insulin, design an insulin regimen so that8 units are released in the blood within 1/2 hour and remain within the limitsof 8 to 15 units over a period of 24 hours.
Figure 29: Designing an Insulin Regimen
50
5
10
15
20
10 15 20 25 30 35
Insu
lin U
nits
( )
Time in Hours ( )
Minimum
Maximum
t
i
Mathematics 9 • 201
Project B: Determining the Relationship of Insulin to Diabetes
Procedure:
In this phase, mathematical and science concepts are evaluated from reportsprepared by individual students or groups of students. These reports mayinclude a description of diabetes, preparation of a regimen of insulininjections from a table of blood sugar readings, answers to questions andchanges in the diet, and the social and economic implications of diabetes.
Phase III: Solving aRegimen Problem
Note:This project has been prepared with the help of Dr. Susanne Voetman, M.D.,The Medicine Cabinet, Nanaimo, B.C., and Norma E. Gomerich andElly Hay, Diabetes Education Centre, Nanaimo Regional General Hospital,Nanaimo, B.C.

Recommended