Embed Size (px)
Citation preview
Determining the relationship between physical environment and weight status
using Google Street View
Ketevan Glonti
Research Fellow - ECOHOST
Improving health worldwide
www.lshtm.ac.uk
Enhancing data capture in health research using digital technology
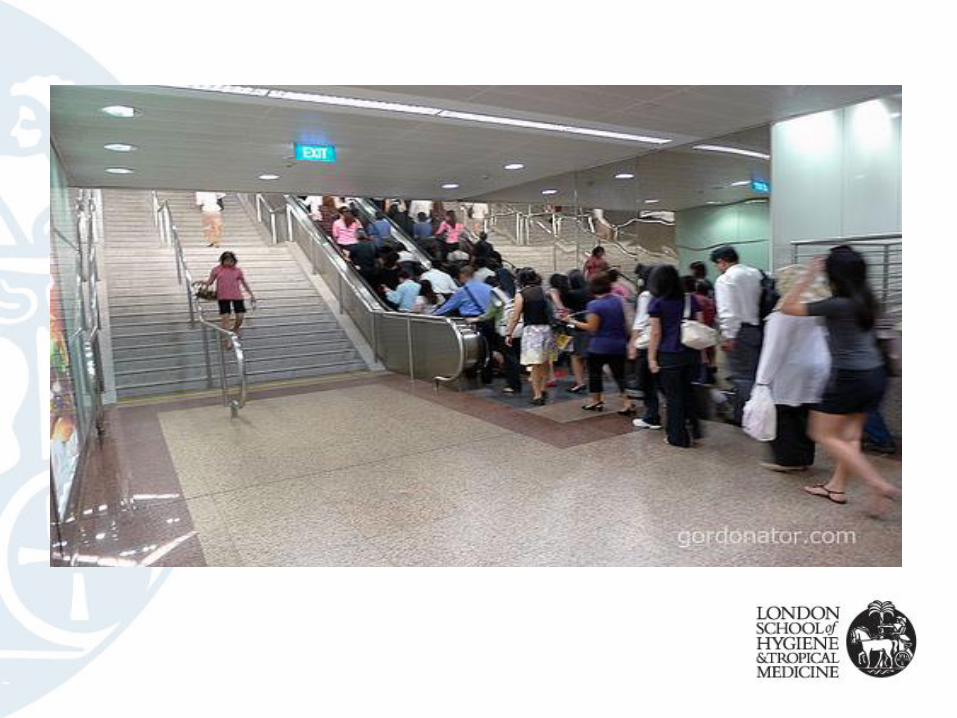
Obesogenic environment
• “The sum of influences that the surroundings, opportunities or conditions of life have on promoting obesity in individuals or populations”*
• All around us, with an impact on everyday behaviour, choices and health
* Swinburn, B., G. Egger, and F. Raza, Dissecting obesogenic environments: the development and application of a framework for identifying and prioritizing environmental interventions for obesity. Prev Med, 1999. 29(6 Pt 1): p. 563-70.

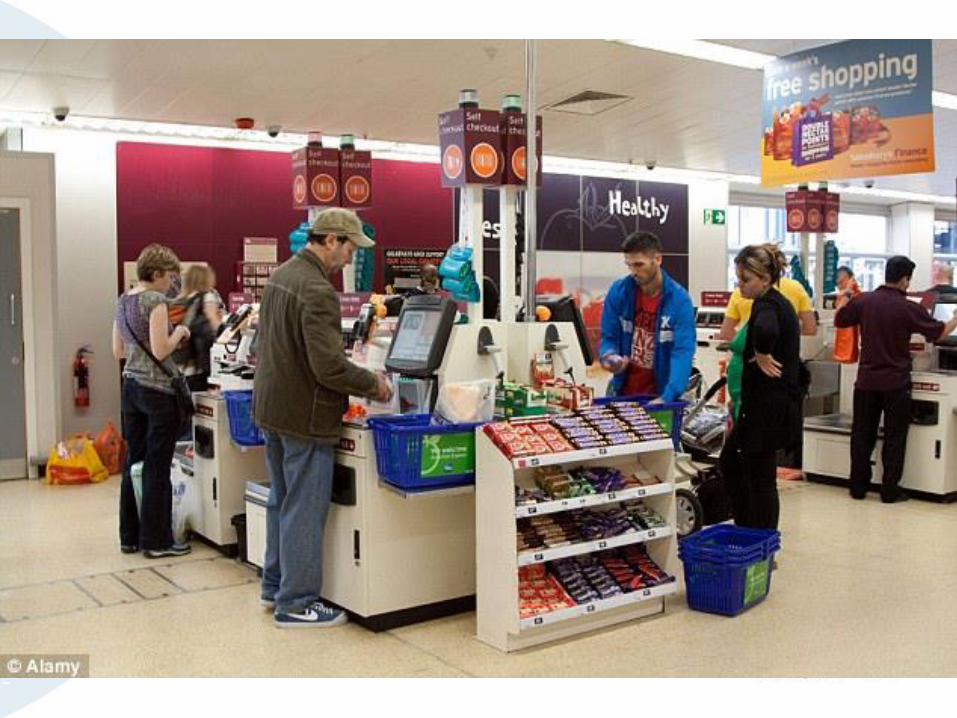
Obesogenic environments
• Another photo example of an obesogenic environment -supermarket
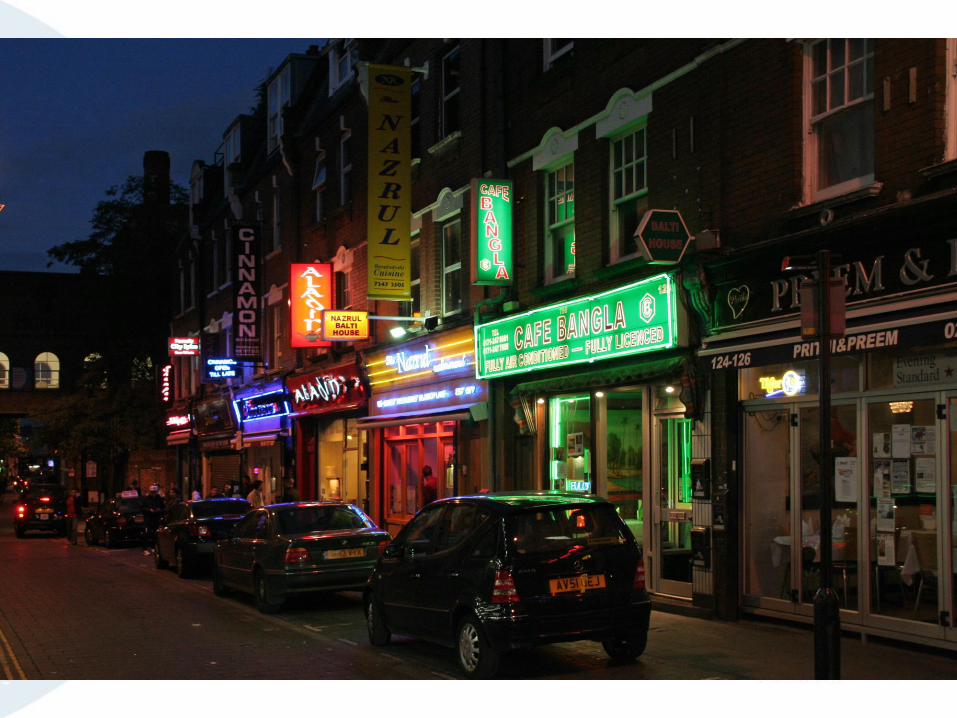
Obesogenic environments
SPOTLIGHT
• EU-funded project
• SPOTLIGHT – Sustainable Prevention of Obesity Through Integrated Strategies
• Addressing the social and environmental determinants of obesity
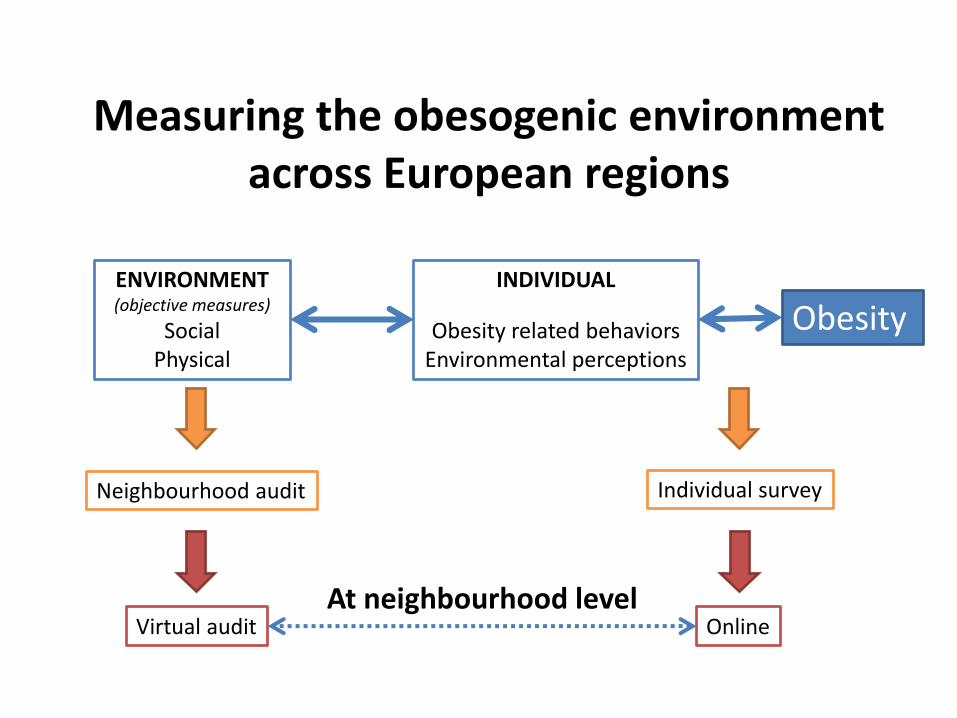
Measuring the obesogenic environmentacross European regions
ENVIRONMENT(objective measures)
SocialPhysical
ObesityINDIVIDUAL
Obesity related behaviorsEnvironmental perceptions
Neighbourhood audit Individual survey
Virtual audit OnlineAt neighbourhood level

Defining
neighbourhoods
9
2 CHARACTERISTICS
Residential density- A central component
of both urban sprawl and land use mix
- Percentage of coverage of buildings devoted to residential facilities
- Available at European level from the European Urban Atlas dataset
Median income (SES)
5 URBAN REGIONS
4 Types : Low / High Density X SES

Neighbourhood audit Individual survey
Virtual audit Online
In 5 European cities
Random selection
3 neighborhoods per typology
12 neighborhoods by region
Total: 60 neighborhoods
Sampling neighbourhoods
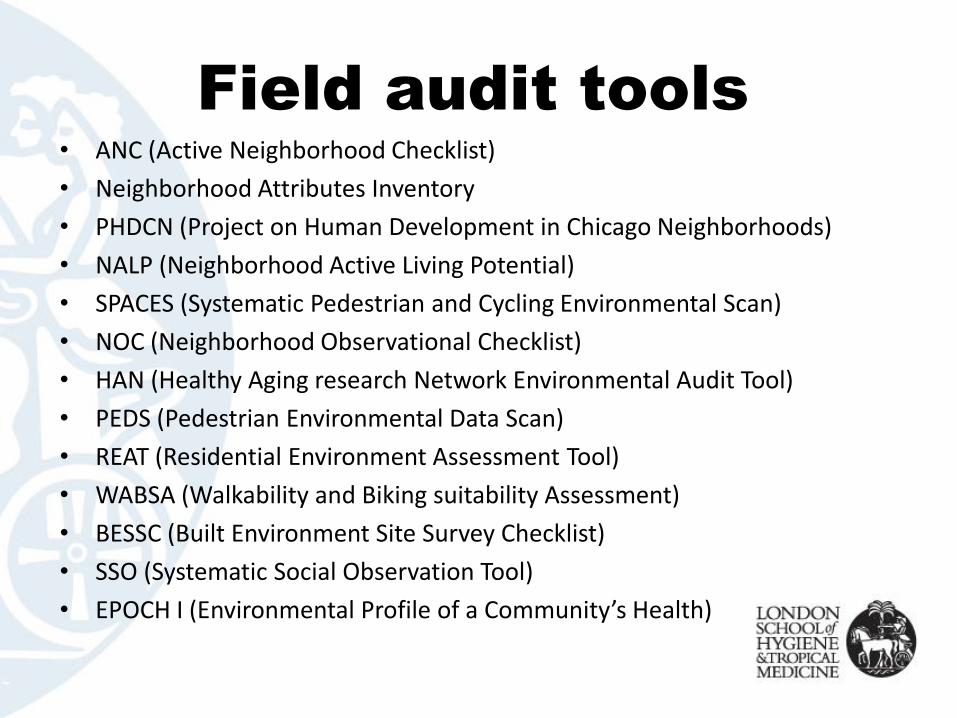
Field audit tools
• ANC (Active Neighborhood Checklist)
• Neighborhood Attributes Inventory
• PHDCN (Project on Human Development in Chicago Neighborhoods)
• NALP (Neighborhood Active Living Potential)
• SPACES (Systematic Pedestrian and Cycling Environmental Scan)
• NOC (Neighborhood Observational Checklist)
• HAN (Healthy Aging research Network Environmental Audit Tool)
• PEDS (Pedestrian Environmental Data Scan)
• REAT (Residential Environment Assessment Tool)
• WABSA (Walkability and Biking suitability Assessment)
• BESSC (Built Environment Site Survey Checklist)
• SSO (Systematic Social Observation Tool)
• EPOCH I (Environmental Profile of a Community’s Health)
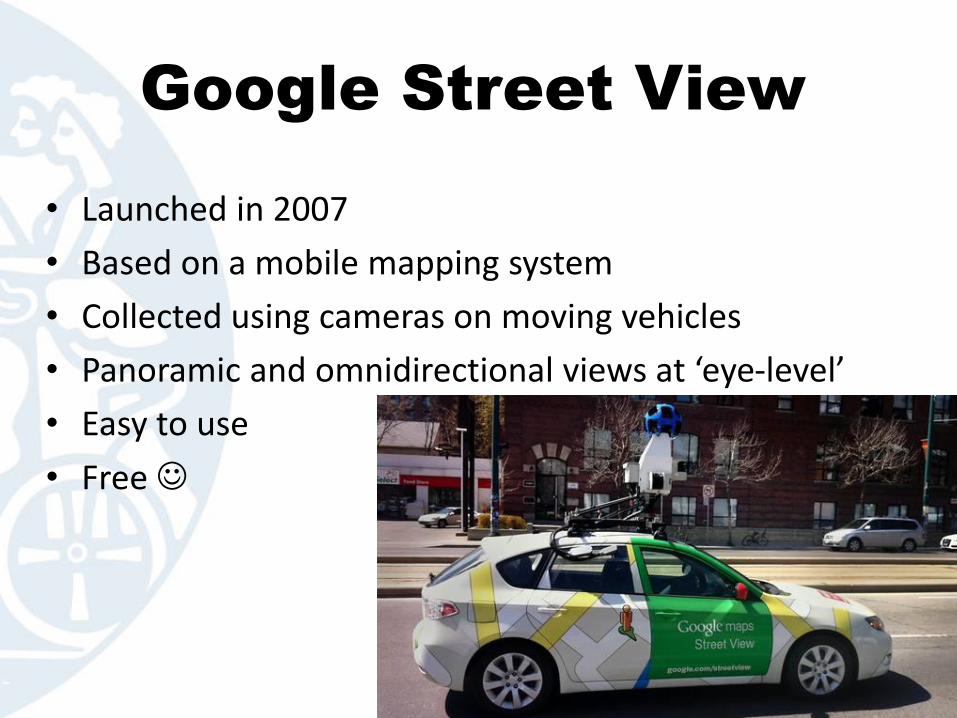
Google Street View
• Launched in 2007
• Based on a mobile mapping system
• Collected using cameras on moving vehicles
• Panoramic and omnidirectional views at ‘eye-level’
• Easy to use
• Free
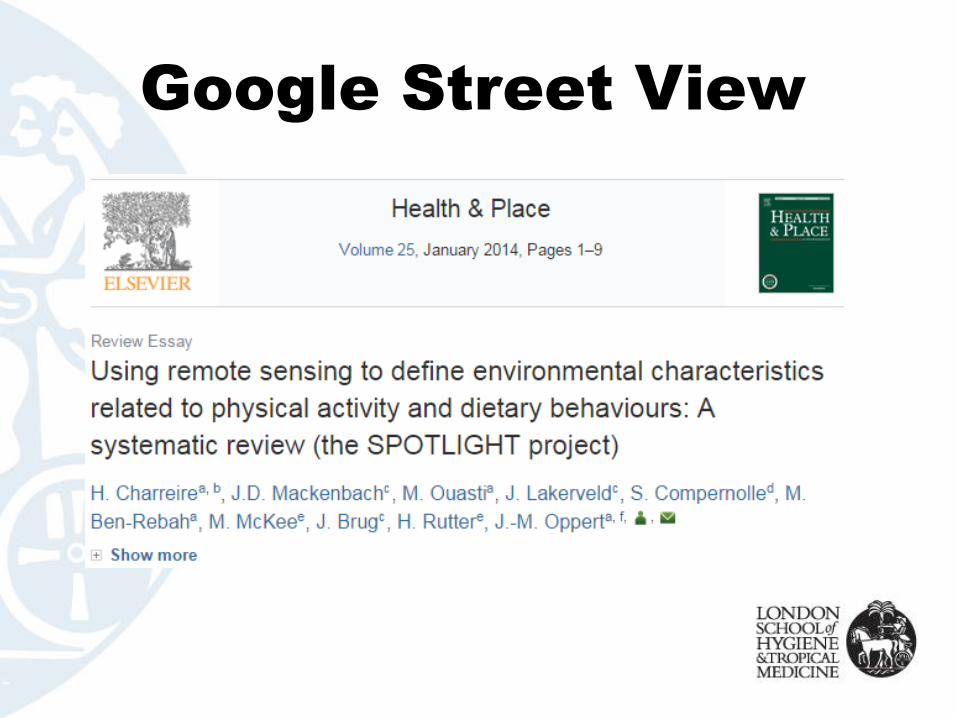
Google Street View
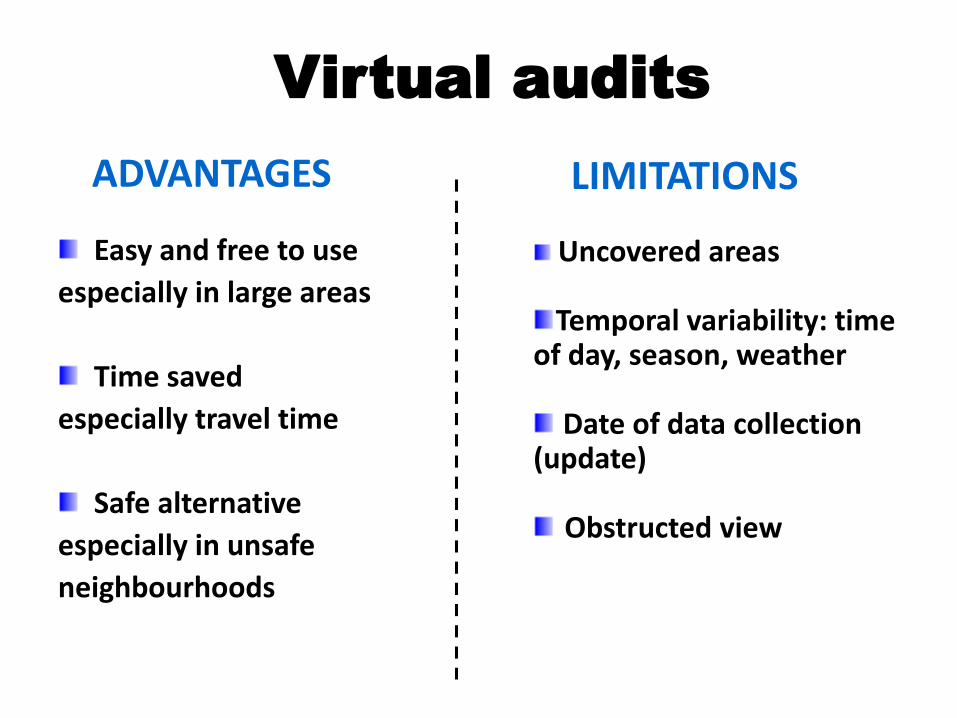
Virtual audits
Easy and free to use
especially in large areas
Time saved
especially travel time
Safe alternative
especially in unsafe
neighbourhoods
ADVANTAGES
Uncovered areas
Temporal variability: time of day, season, weather
Date of data collection (update)
Obstructed view
LIMITATIONS
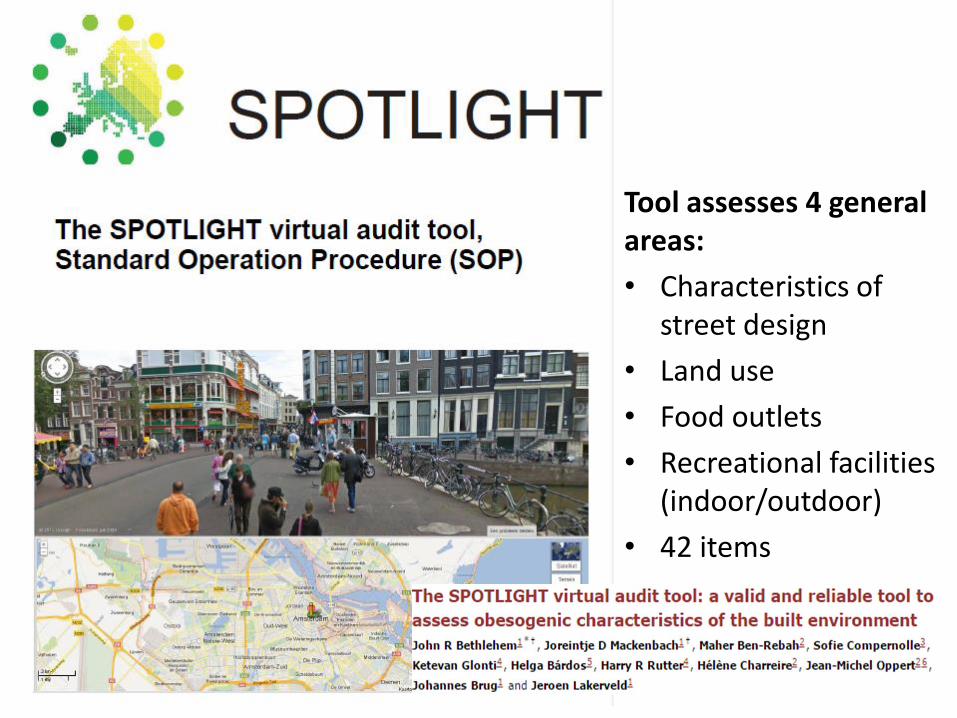
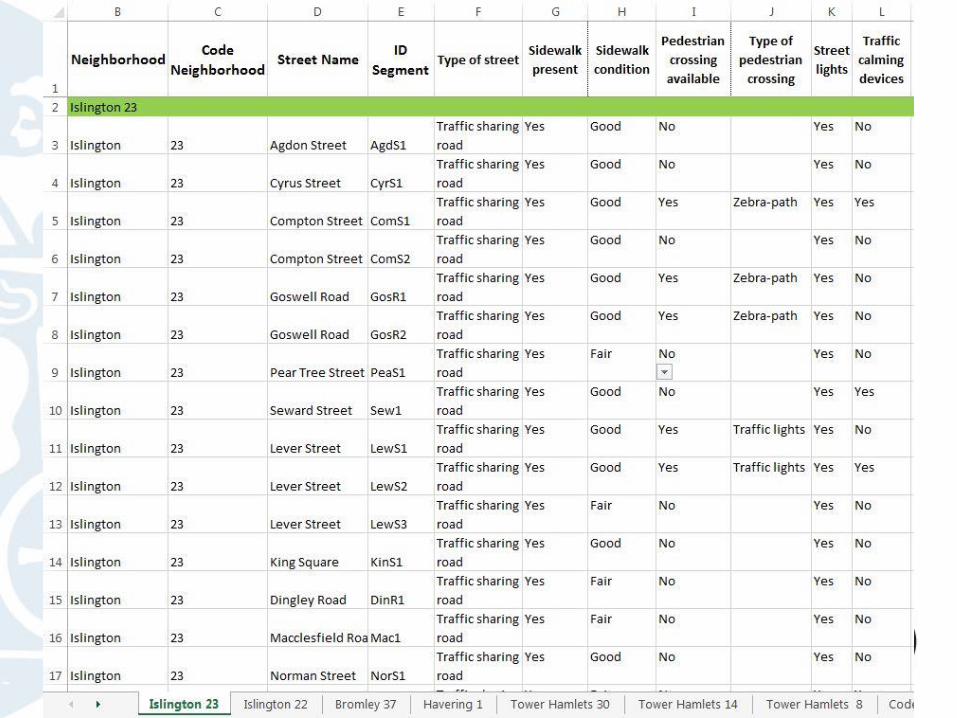
Tool assesses 4 general areas:
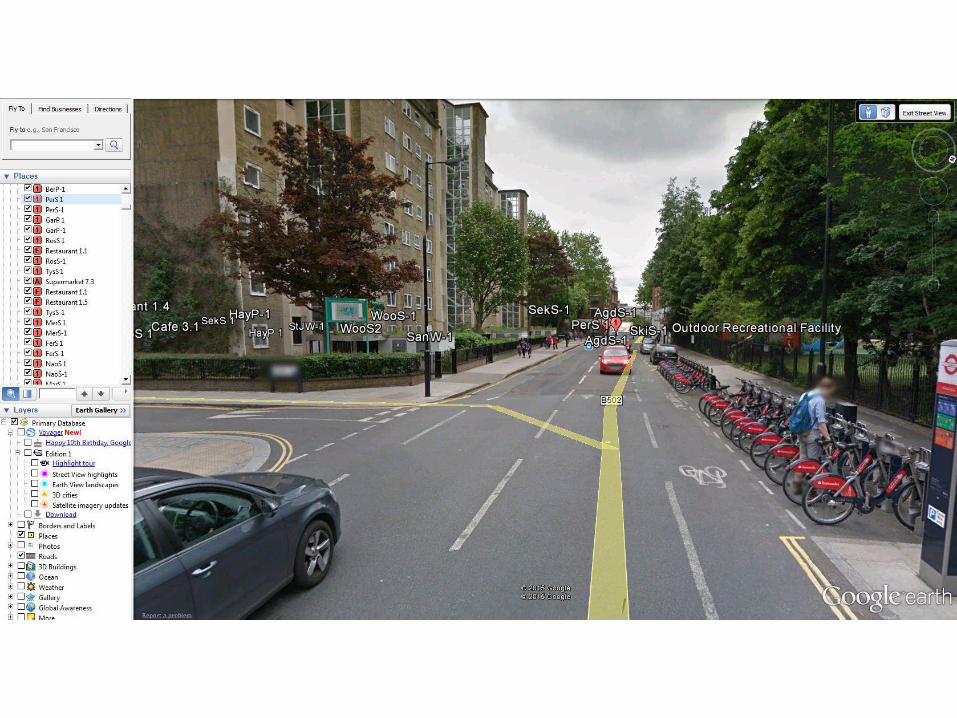
• Characteristics of street design
• Land use
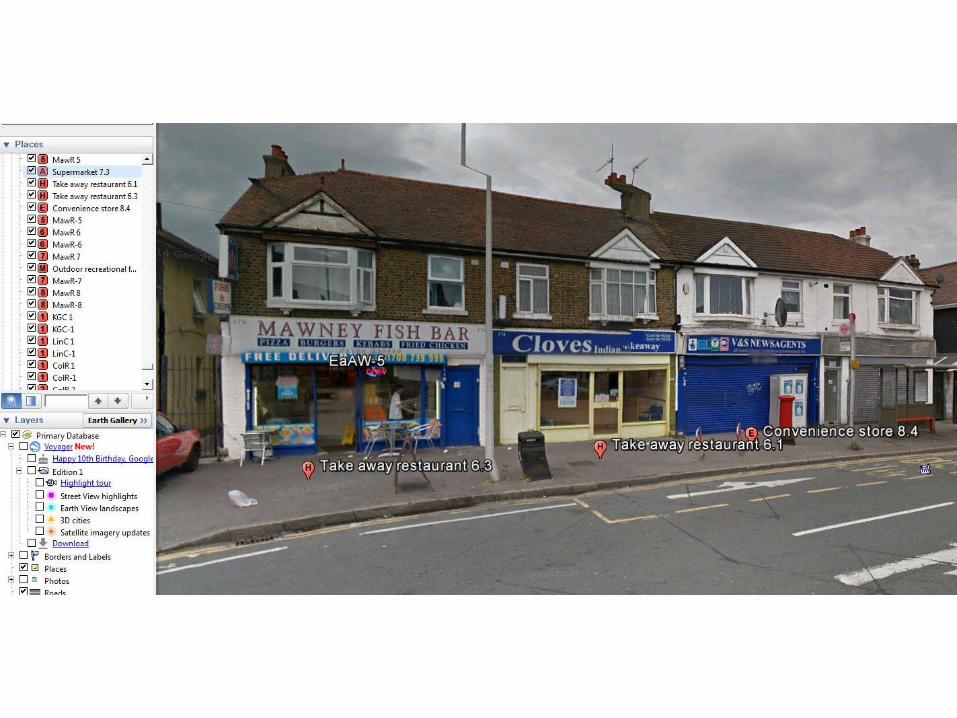
• Food outlets
• Recreational facilities (indoor/outdoor)
• 42 items
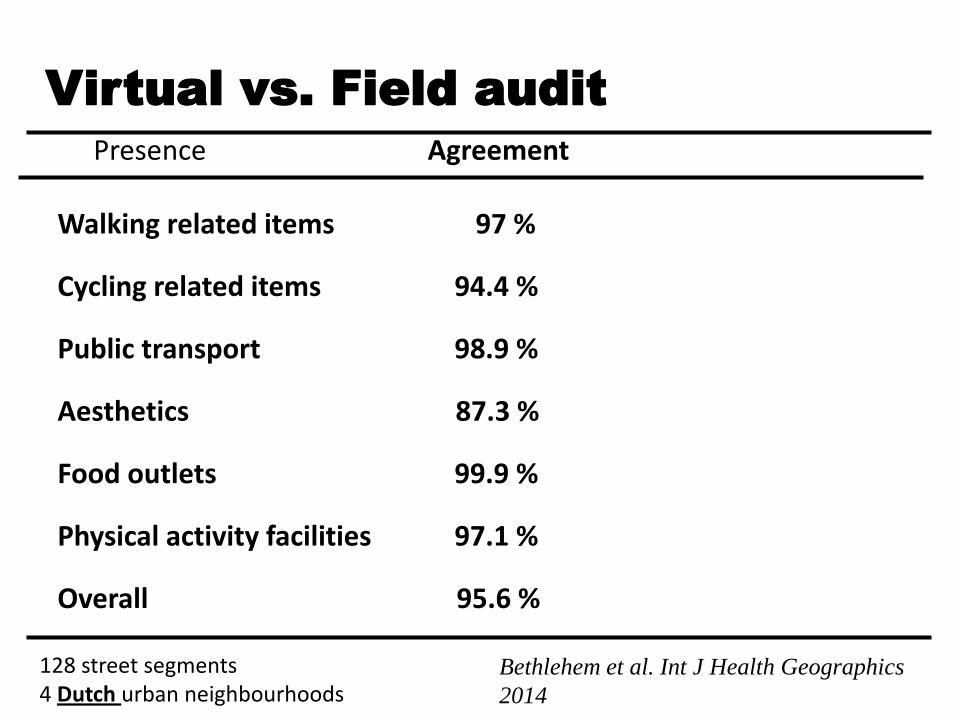
Virtual vs. Field audit
Presence Agreement
Walking related items 97 %
Cycling related items 94.4 %
Public transport 98.9 %
Aesthetics 87.3 %
Food outlets 99.9 %
Physical activity facilities 97.1 %
Overall 95.6 %
Bethlehem et al. Int J Health Geographics
2014
128 street segments 4 Dutch urban neighbourhoods
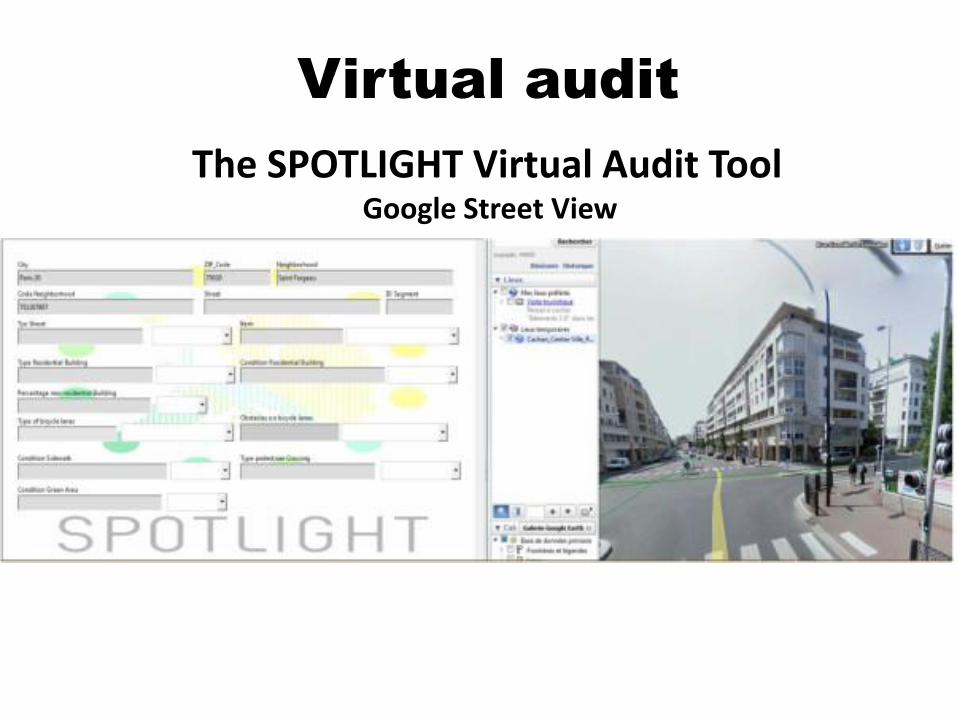
Virtual audit
The SPOTLIGHT Virtual Audit ToolGoogle Street View
Virtual Audit

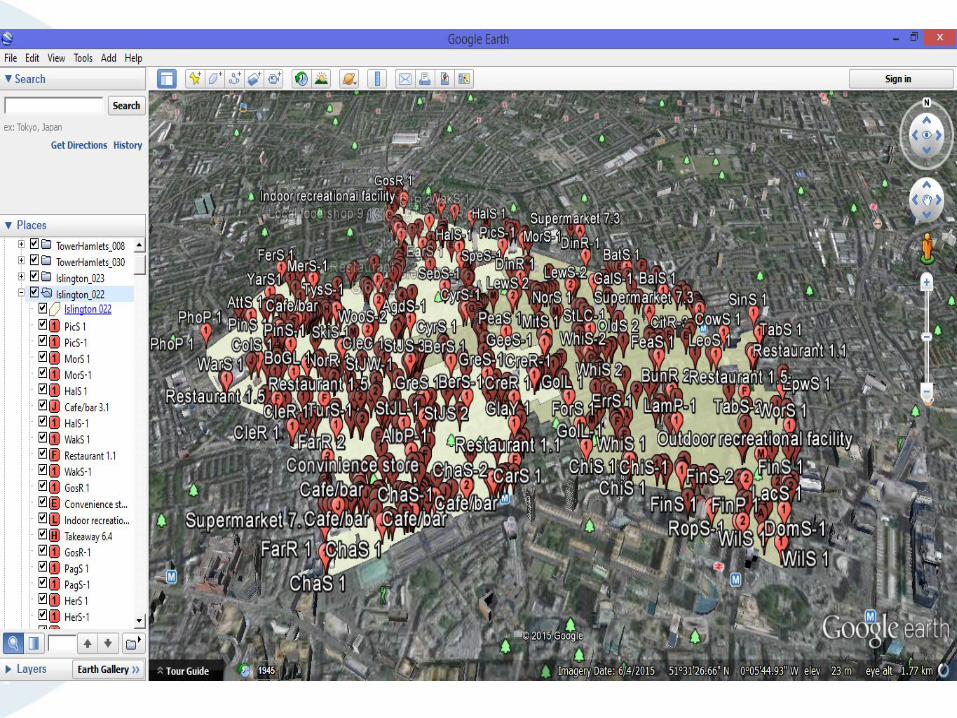
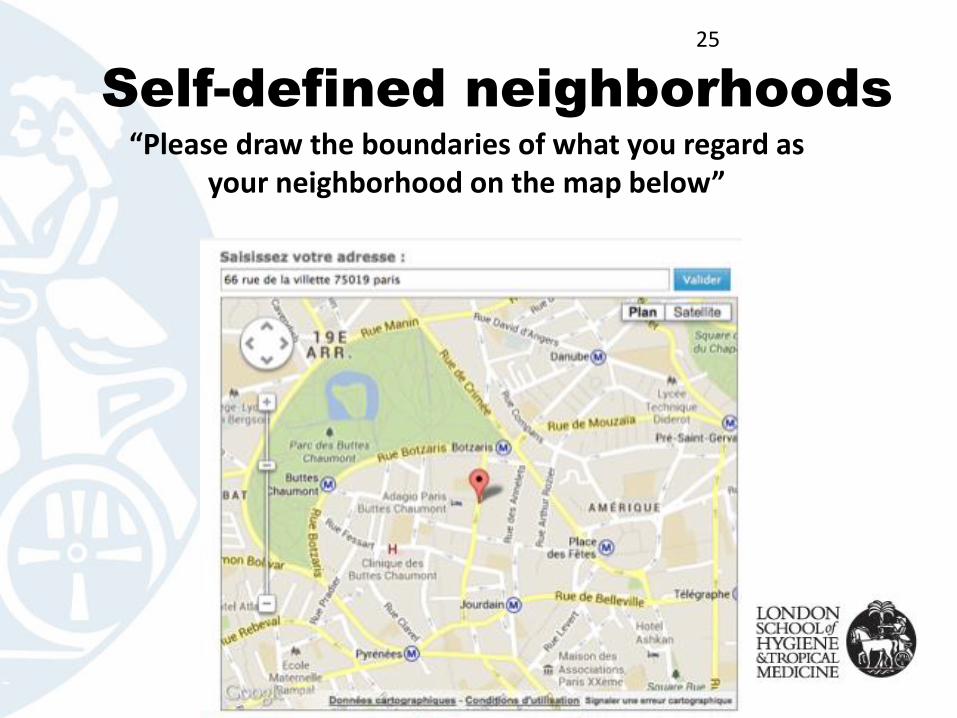
Self-defined neighborhoods
25
“Please draw the boundaries of what you regard as your neighborhood on the map below”
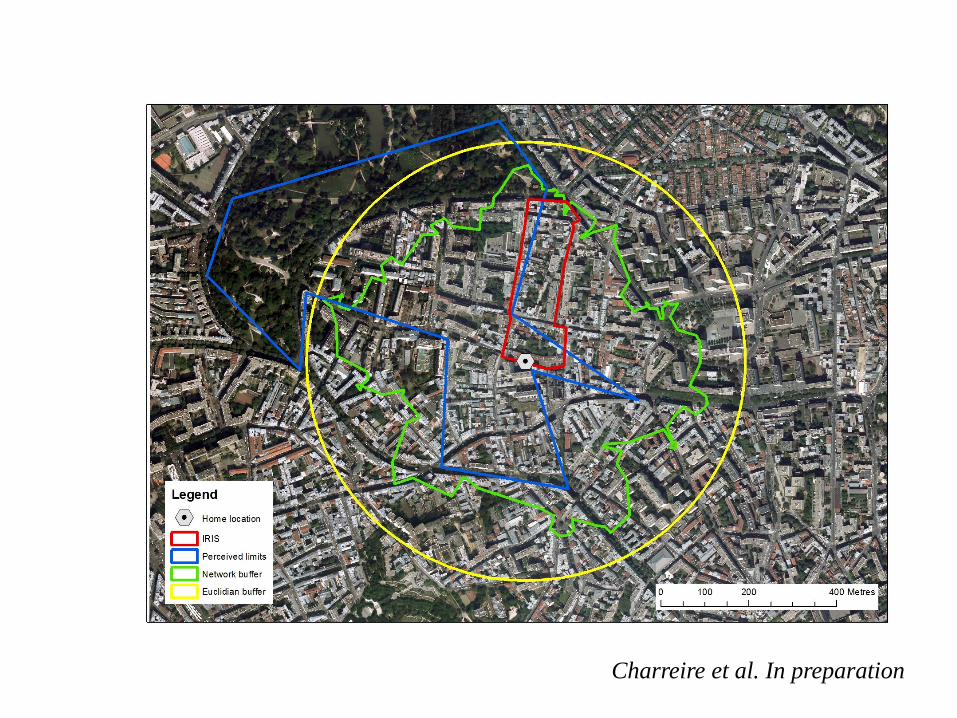
Charreire et al. In preparation
Conclusions
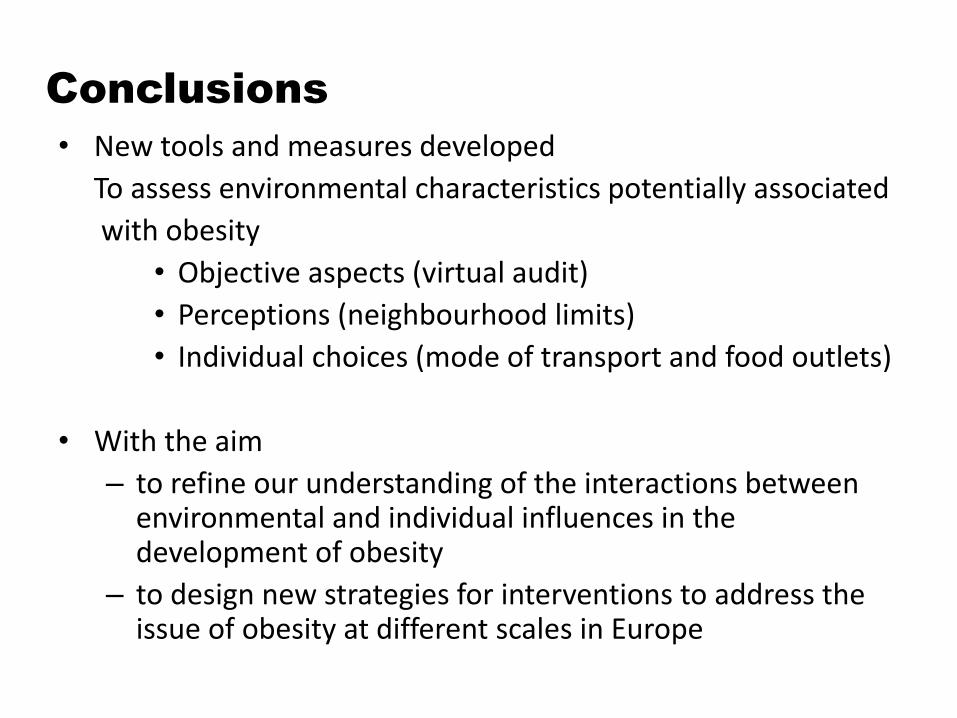
• New tools and measures developed
To assess environmental characteristics potentially associated
with obesity
• Objective aspects (virtual audit)
• Perceptions (neighbourhood limits)
• Individual choices (mode of transport and food outlets)
• With the aim
– to refine our understanding of the interactions betweenenvironmental and individual influences in the development of obesity
– to design new strategies for interventions to address the issue of obesity at different scales in Europe

Thank you for your attention!
Questions?
Special thanks to all colleagues from the SPOTLIGHT team
Contact details:
Improving health worldwide
www.lshtm.ac.uk


![Tools for Google Data · 12.04.2013 · Plot of [weight loss] and [best vacation spots] New Year. Correlated with [weight loss] 3 weeks later. 1 5 Unemployment. Initial claims: good](https://img.pdfslide.us/doc/110x75/60368b4e1f90912cdd34c615/tools-for-google-data-12042013-plot-of-weight-loss-and-best-vacation-spots.jpg)