Production & Research-based Approaches forMaximizing Recovery in the Barnett Shale
during the Period 05/15/2001 to 05/14/2002
By
Jason LacewellOperations / Reservoir Consultant, Republic Energy Inc.
December 2002
Work Performed Under Prime Award No. DE-FC26-00NT41025Subcontract No. 2057-RE-DOE-1025
ForU.S. Department of EnergyNational Energy Technology LaboratoryP.O. Box 10940Pittsburgh, Pennsylvania 15236
ByRepublic Energy Inc.4925 Greenville Ave. Suite 1050Dallas, Texas 75206
Production & Research-based Approaches forMaximizing Recovery in the Barnett ShaleJason Lacewell, Operations / Reservoir Consultant, Republic Energy Inc.
Executive SummaryThe Barnett Shale is a Mississippian age, very tight matrix, naturally fractured reservoir
in the Ft. Worth Basin in north Texas. Unprecedented drilling activity has occurred in the
current core productive area (primarily Denton, Wise and Tarrant co.), and Barnett
activity continues as the second largest Texas gas field. Since 1981, field cumulative
production is roughly 0.365 TCF, and is on pace to reach 1.5 TCF cumulative by 2006.
The U.S.G.S. estimates between 3.4 and 10.0 TCF of shale gas are recoverable1 within
the identified play area, making the Barnett an important piece of the economic puzzle
for shale gas resources in the U.S. There are many Barnett successes for operators,
but a focused, integrated study could help enhance the knowledge base and provide a
springboard for improved overall ultimate recoveries. While a percentage of wells are
better than 1 BCF, and refrac treatments do improve well reserves – overall gas
resource recovery-per-well is lower than the industry needs, considering the activity
level. Barnett challenges include:
• Higher liquid volumes & poorer fracture dehydration than desired for gas wells.• The need for better baseline data, and understanding of core properties as it
relates to Barnett Shale completion and production methods.• Developing approaches and technologies to give Barnett fieldwide recovery an
opportunity to approach to upper end of U.S.G.S. recoverable gas spectrum.
The Barnett is a very successful Play for a number of operators including Republic
Energy, Inc. (Dallas, Texas). However, Republic has taken the pro-active step in joining
the Department of Energy, Penn State University and the Stripper Well Consortium with
the goal of maximizing Shale gas resources. The project focus is underperforming wells,
their known and suspected underlying causes, and improving fieldwide Shale ultimate
recoveries. Total project allotted budget is $98,550, with Republic Energy bearing a
$25,550 total share and the balance funded by the U.S. DOE.
This is the first comprehensive Barnett Shale project which provides a model for other
area operators, developing the link between: Rock characteristics, Fieldwide flowback,
pressure and chlorides trends, and the Effect of conventional & high-rate dewatering on
gas well performance.
The three project objectives are:
• Focus on improving gas recovery in wells that don’t have benefit ofwell-connected natural fracture system.
• Characterizing mechanisms that control gas & water recovery in the reservoir atthe pore level – using reservoir core.
• Testing reservoir drawdown limits and effect of maximum water removal, knownas gas/water ‘Co-Production’ using Electric Submersible Pump (along w/ other liftmethods like plunger lift and rod pump).
Results Summary & General Conclusions
Barnett rock is surprisingly not extremely water sensitive. It shares fracture and cleating
characteristics with some coals, and has an apparent tertiary production mechanism
(methane molecule desorption) at low reservoir pressure when properly dehydrated. In
carefully controlled laboratory tests using Barnett core, two (of nine) commercial
products were shown to enhance loadwater recovery and gas permeability recovery on
core in the laboratory.
A sizeable percentage of Barnett wells suffer from liquid loading problems and poor
fracture dehydration. Analysis of fieldwide flowing pressures, flowback / produced water
trends, as well as chlorides trends show this to be the case. There is strong evidence
that the source of high liquids production is bounding Viola or Ellenberger zones.
Republic’s pro-active approach of using aggressive Co-Production dewatering improves
wells that don’t behave like a typical flowing, trouble free gas wells. Dewatering with rod
pump has been shown to add an estimated incremental 330 MMCF / well, and plunger
lift an estimated incremental 90 MMCF / well, on average. Twelve wells were included
as test cases, and tests are currently ongoing. *Note that estimates of incremental
production and EUR may change over time as further data becomes available, and
estimates are also subject to judgemental factors.
High drawdown ESP’s (submersible pump) were used dewater high PI wells in two
30-day test cases, to liberate trapped gas as shown successful in other gas / water
basins. Even with detailed pre-planning, well tests did not adequately prove / disprove
the concept of liberating trapped gas within pore spaces and lowering reservoir pressure
(at least in our two candidate wellbores), and operational problems were also an issue.
Gas was produced from these two non-flowing wells during the test period, but in
uneconomic proportions.
In conclusion, this project was designed to serve as a model for area operators and
others involved in developing unconventional Shale resources. The ultimate project goal
is maximizing Barnett Shale gas recovery to the economically feasible limit, through the
integration of baseline research and field production approaches.
Table of Contents
PAGE
Reservoir Characterization and Regional Activity Level 1
Problem Description 2
Objectives Statement & Summary 5
Three-Phase Work Plan 6
Bulleted Summary of Overall Project Results 8
Discussion of Results 11
Conclusions & Recommendations 20
Acknowledgments 22
References 22
Tables 1-5
Figures 1-12
Appendix I 46
Production & Research-based Approaches forMaximizing Recovery in the Barnett ShaleJason Lacewell, Operations / Reservoir Consultant, Republic Energy Inc.
Reservoir Characterization and Regional Activity LevelPossibly the most active natural gas play in the lower 48 states, the Barnett Shale is a
Mississippian age naturally fractured reservoir in the Ft. Worth Basin in north Texas.
Drilling depths are typically between 6800 to 8600 ft., and the reservoir unit has between
200 to 700 ft. of gross interval in the current core productive area (primarily Denton,
Wise and Tarrant co.). From its outcrop in central Texas ( Llano uplift), the unit dips
northward to a maximum thickness of near 1000 ft. near the Texas / Oklahoma state
line1,2. The Barnett shale is both a non-siliciclastic source rock and a reservoir rock, with
generalized drill cuttings composition being dense, black, with a lignite-type appearance.
The clay content is measured between 20-40% by volume from available samples using
SEM, with smectite and illite comprising a large proportion.
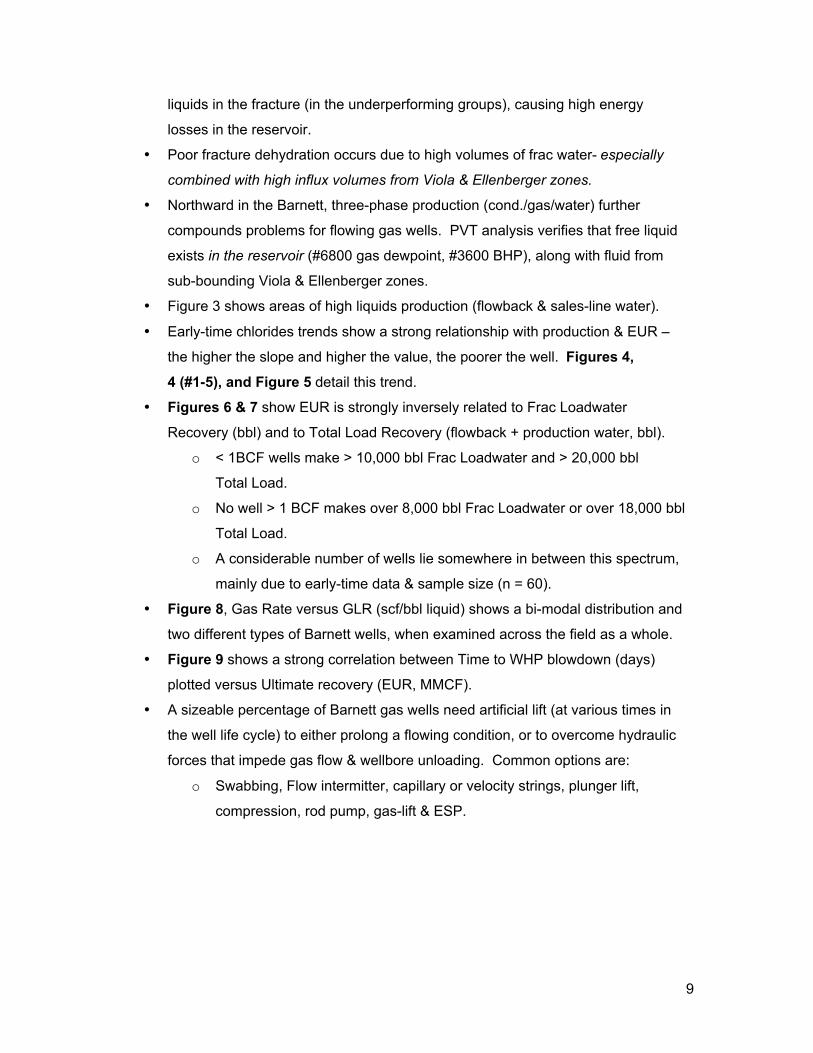
The Barnett Shale is usually described as having two productive units; The massive
Lower Barnett which exhibits layered reservoir behavior, and the Upper Barnett which is
about 20% of the gross thickness of the Lower. The Forestburg Lime section lies
between the Upper and Lower Barnett with variable thickness. The Marble Falls Lime
provides the apparent seal above, while the Viola Lime provides the lower boundary for
the reservoir.
Detailed work by GRI 3-7 and others have shown that the Barnett Shale exhibits dual-
porosity behavior because of its limited volume, “high” permeability natural fractured
system coupled with a low permeability matrix (0.001- 0.0001 md). Natural fractures
trend in a NW to SE direction, while induced hydraulic fractures run NE to SW. Since
roughly 1999, almost all Barnett Shale wells are currently water-fractured with 0.8 to 1.5
million gallons of fresh (slick) water at high rates (60-80 BPM), with operators moving
away from MHF’s with gel performed previously. Lowering well completion costs was
the primary driver for this shift, while maintaining comparable well performance. The
Barnett is considered a ‘dry gas’ reservoir in general terms, but associated water and
areas of condensate production are concerns as development continues. A sizeable
percentage of underperforming Barnett wells have been completed across the Play, with
2
liquid production and reservoir quality problems. This project examines these problems,
gathers quality reservoir / field data, and attempts to develop solutions for improving well
performance.
Current drilling activity in the Shale is impressive, and the aerial productive limits of the
play have yet to be defined. 3000 to 5000 locations could be left to drill among all
operators within the play. Some quick facts on area activity:
• Between 1981 and 1990, 71 wells were drilled.• During the period between 1990 and 11/2000, 705 wells were drilled!• 25-30 drilling rigs currently operating• 2000 total production was over 79 BCFE, and climbing.• 2nd largest gas field in Texas.• Field Cum-to-Date since 1981, roughly 0.365 TCF.• At current pace, roughly 1.5 TCF cum gas by early 2006.• Impressive well production has recently been coming from expansion
southward, into NE Tarrant Co. and into the Ft. Worth city limits.
Tight natural gas demand and low cost completions will continue to fuel activity in the
region; however, this in turn places a greater emphasis on the industry’s production
practices and artificial lift technology to maximize gas recovery as time moves on.
The principle company in this project is Republic Energy Inc. (REI) is a small,
independent company which is currently the second-largest Barnett operator with over
120 wells. By contrast, over 900 have been drilled by Devon Energy (formerly Mitchell
Energy & Development Corp.), the area’s largest operator. The Barnett is a very
successful Play for Republic and a number of operators. However, the main project
focus is underperforming wells, their known & suspected underlying causes, and
improving fieldwide Shale gas ultimate recovery.
Problem DescriptionUnderstanding factors that dictate initial well productivity (IP) and EUR are absolutely
essential for maximizing gas resource utilization in this area. The U.S. Geological
Survey estimates that between 3.4 and 10.0 TCF of shale gas are recoverable1 within
the identified play area, making the Barnett Shale an important piece of the economic
puzzle for shale gas resources in the Lower 48 states. While a percentage of wells are
better than 1 BCF, and refrac treatments improve well reserves – the industry and
Barnett Shale operators need ways to ensure that overall resource recovery-per-well is
3
maximized, especially considering the activity level and the resource opportunity that
exists in this area.
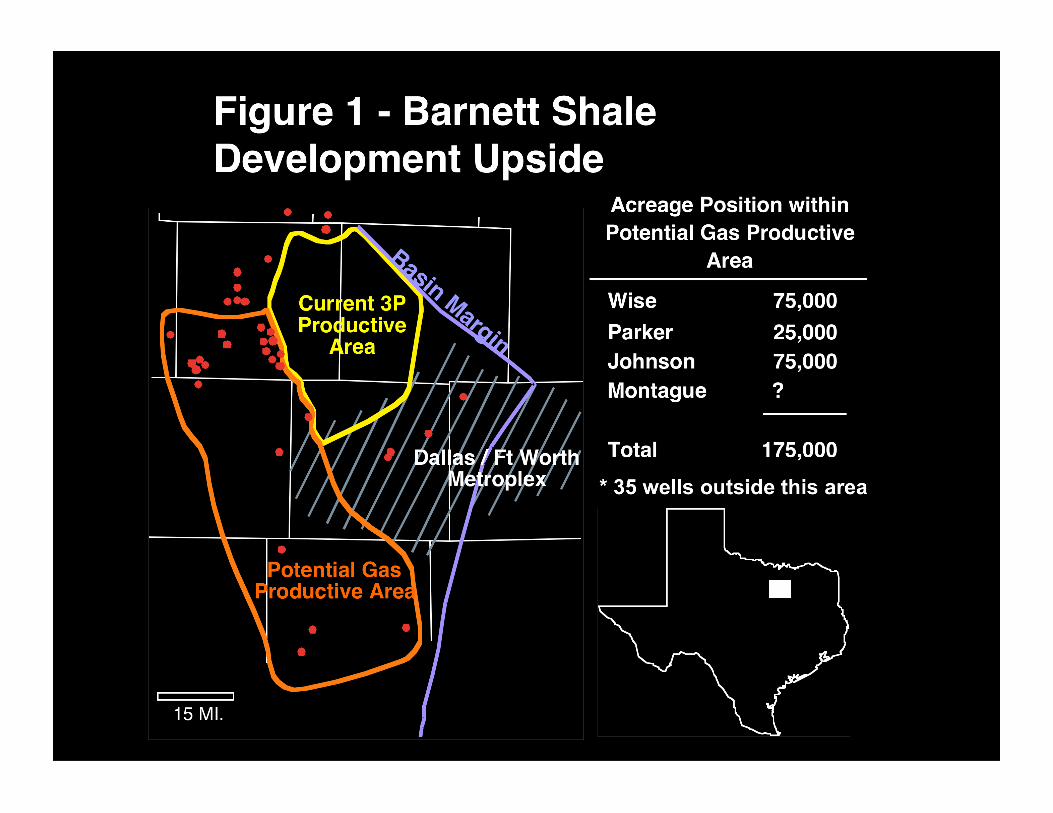
Projected fieldwide, and even extending to a possible 5000 drilling locations across
175,000 ac. (Figure 1), this “lower” percentage recovery is leading to fieldwide ultimate
recoveries toward the lower end of the U.S.G.S. recoverable shale gas spectrum (3.4
TCF estimate). Liquid production from a high percentage of gas wells (50-400 bbl/
MMCF of both formation & frac water) is compounding the problem of lower ultimate
recoveries, and is also symptomatic of reservoir and completion problems. The above
facts and trends are the justification for this proposal: To gather the proper baseline
data, apply proven production engineering technology and develop new approaches to
improve EUR’s to the economically feasible extent. The goal of the SWC is to maximize
Shale gas resources, and attempt to develop solutions in working toward that goal.
WELL COMPLETION & RESERVOIR BACKGROUND
A typical completion approach (with many variations along the way) has been to fracture
both the Upper and Lower Barnett (together or separately depending on barrier
thickness) to increase chances of intersecting natural fracture systems. Since roughly
late 1998, most Barnett Shale wells are water-fractured with 0.8 to 1.5 million gallons of
fresh (slick) water at high rates (50-90 BPM), with low sand concentrations usually
ramped up to less than 1.4 ppa at the tail-end of the treatment. This switch to waterfracs
was driven by the need to lower well completion costs. Wells are completed without
packers, using the annulus for production assistance.
Flowbacks are normally very aggressive, moving 200-300 or more bbl/hr until casing
pressure declines & breaks back. Loadwater recovery from flowback is commonly in the
8-25% range, depending on geographic area.
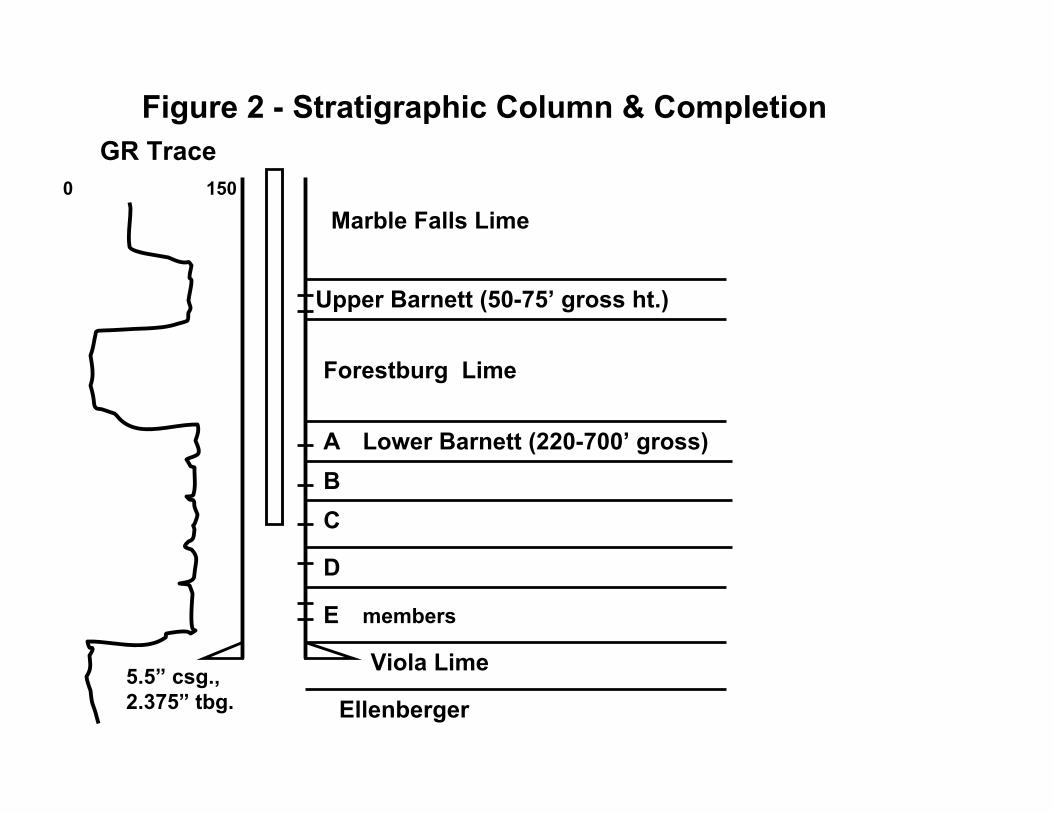
Regarding reservoir quality - well performance appears to be a moderate-to-strong
function of density porosity, natural fracture volume along with quartz content within the
Shale. Reservoir communication both vertically (to bounding Viola lime and Ellenberger
sand) and aerially, due to induced & natural fracture cross-communication, also likely
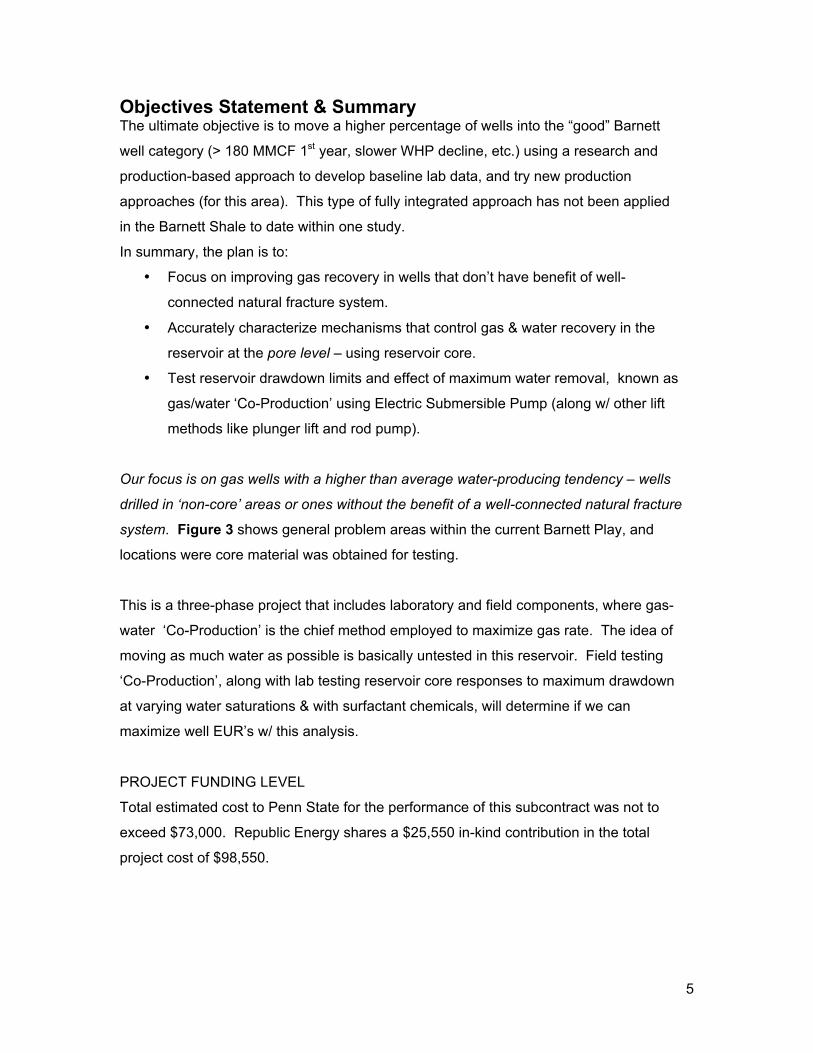
affects well performance. Figure 2 shows generic Barnett geologic zones and a typical
zonal completion.
4
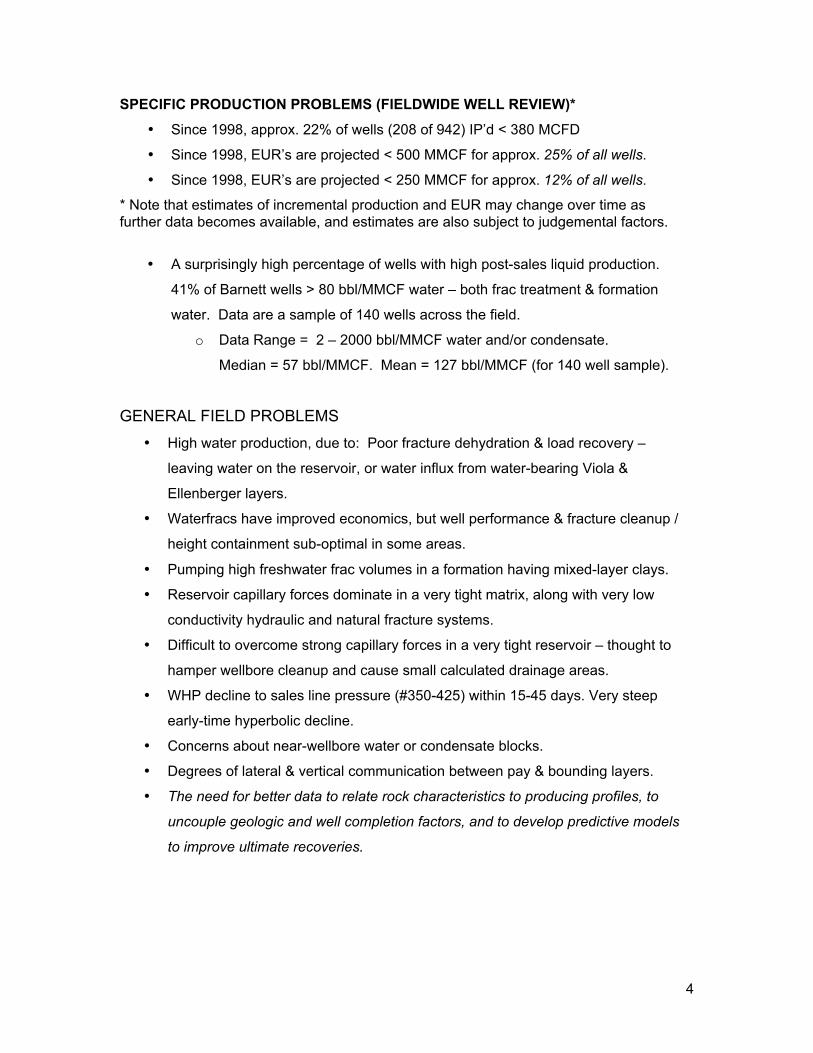
SPECIFIC PRODUCTION PROBLEMS (FIELDWIDE WELL REVIEW)*
• Since 1998, approx. 22% of wells (208 of 942) IP’d < 380 MCFD
• Since 1998, EUR’s are projected < 500 MMCF for approx. 25% of all wells.
• Since 1998, EUR’s are projected < 250 MMCF for approx. 12% of all wells.
* Note that estimates of incremental production and EUR may change over time asfurther data becomes available, and estimates are also subject to judgemental factors.
• A surprisingly high percentage of wells with high post-sales liquid production.
41% of Barnett wells > 80 bbl/MMCF water – both frac treatment & formation
water. Data are a sample of 140 wells across the field.
o Data Range = 2 – 2000 bbl/MMCF water and/or condensate.
Median = 57 bbl/MMCF. Mean = 127 bbl/MMCF (for 140 well sample).
GENERAL FIELD PROBLEMS
• High water production, due to: Poor fracture dehydration & load recovery –
leaving water on the reservoir, or water influx from water-bearing Viola &
Ellenberger layers.
• Waterfracs have improved economics, but well performance & fracture cleanup /
height containment sub-optimal in some areas.
• Pumping high freshwater frac volumes in a formation having mixed-layer clays.
• Reservoir capillary forces dominate in a very tight matrix, along with very low
conductivity hydraulic and natural fracture systems.
• Difficult to overcome strong capillary forces in a very tight reservoir – thought to
hamper wellbore cleanup and cause small calculated drainage areas.
• WHP decline to sales line pressure (#350-425) within 15-45 days. Very steep
early-time hyperbolic decline.
• Concerns about near-wellbore water or condensate blocks.
• Degrees of lateral & vertical communication between pay & bounding layers.
• The need for better data to relate rock characteristics to producing profiles, to
uncouple geologic and well completion factors, and to develop predictive models
to improve ultimate recoveries.
5
Objectives Statement & SummaryThe ultimate objective is to move a higher percentage of wells into the “good” Barnett
well category (> 180 MMCF 1st year, slower WHP decline, etc.) using a research and
production-based approach to develop baseline lab data, and try new production
approaches (for this area). This type of fully integrated approach has not been applied
in the Barnett Shale to date within one study.
In summary, the plan is to:
• Focus on improving gas recovery in wells that don’t have benefit of well-
connected natural fracture system.
• Accurately characterize mechanisms that control gas & water recovery in the
reservoir at the pore level – using reservoir core.
• Test reservoir drawdown limits and effect of maximum water removal, known as
gas/water ‘Co-Production’ using Electric Submersible Pump (along w/ other lift
methods like plunger lift and rod pump).
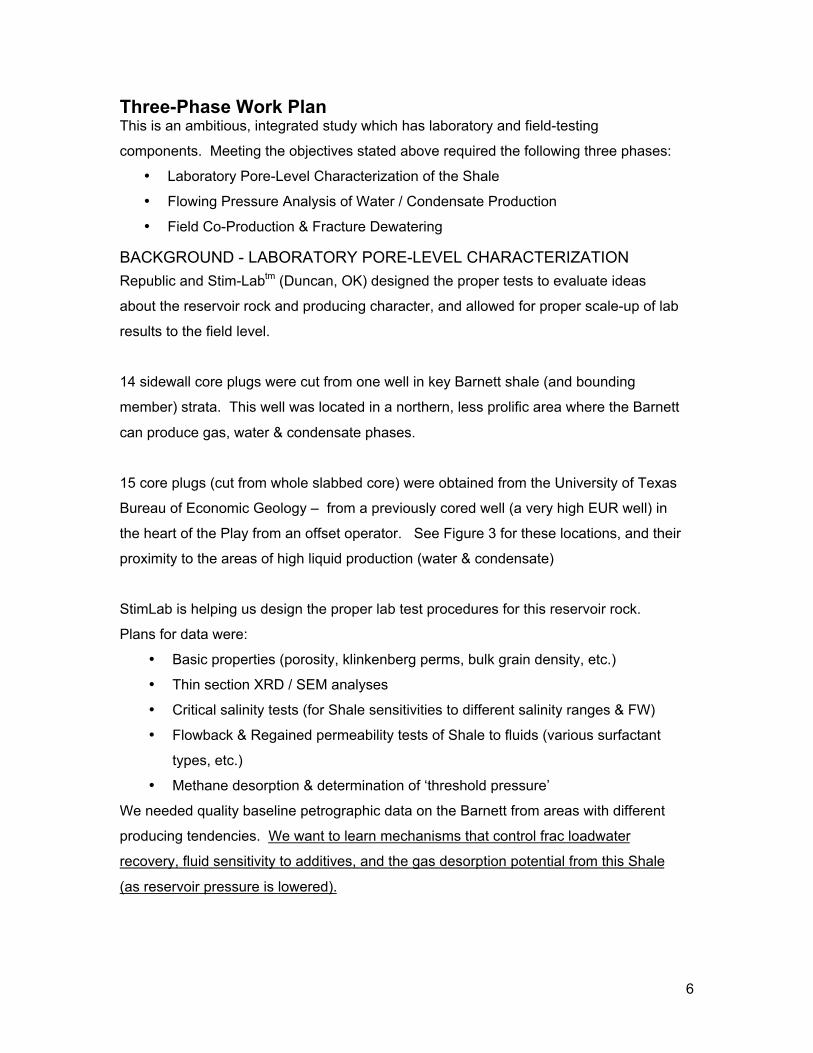
Our focus is on gas wells with a higher than average water-producing tendency – wells
drilled in ‘non-core’ areas or ones without the benefit of a well-connected natural fracture
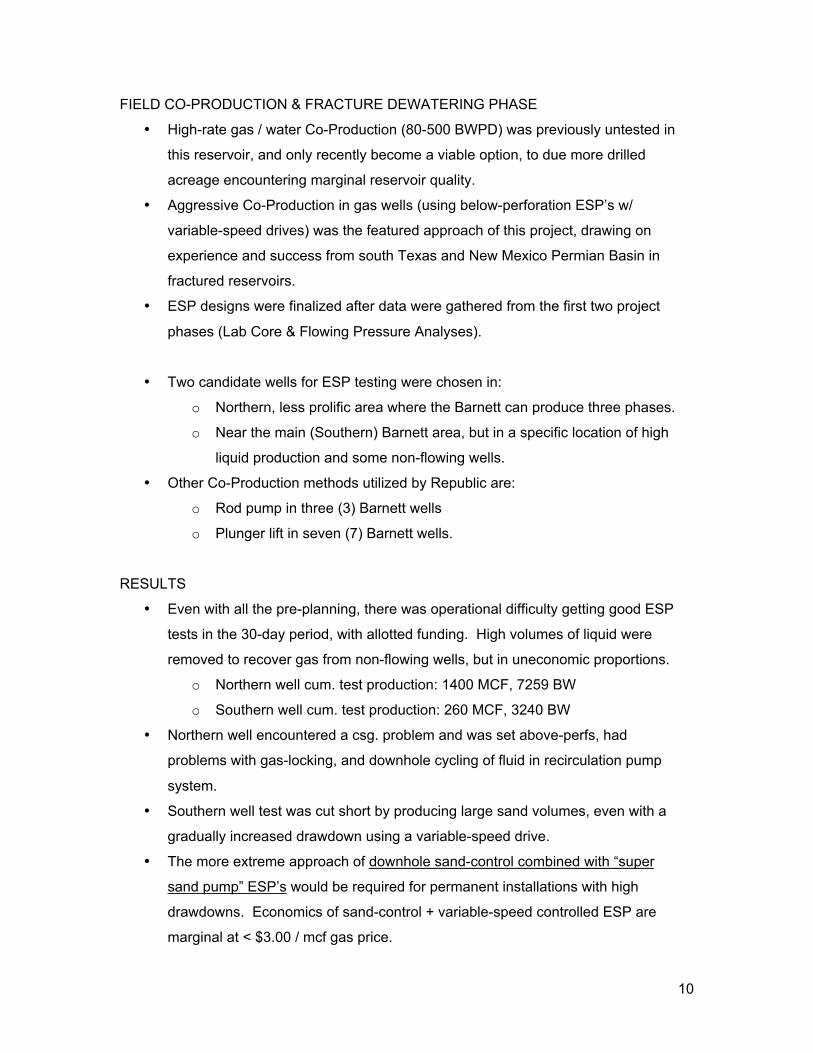
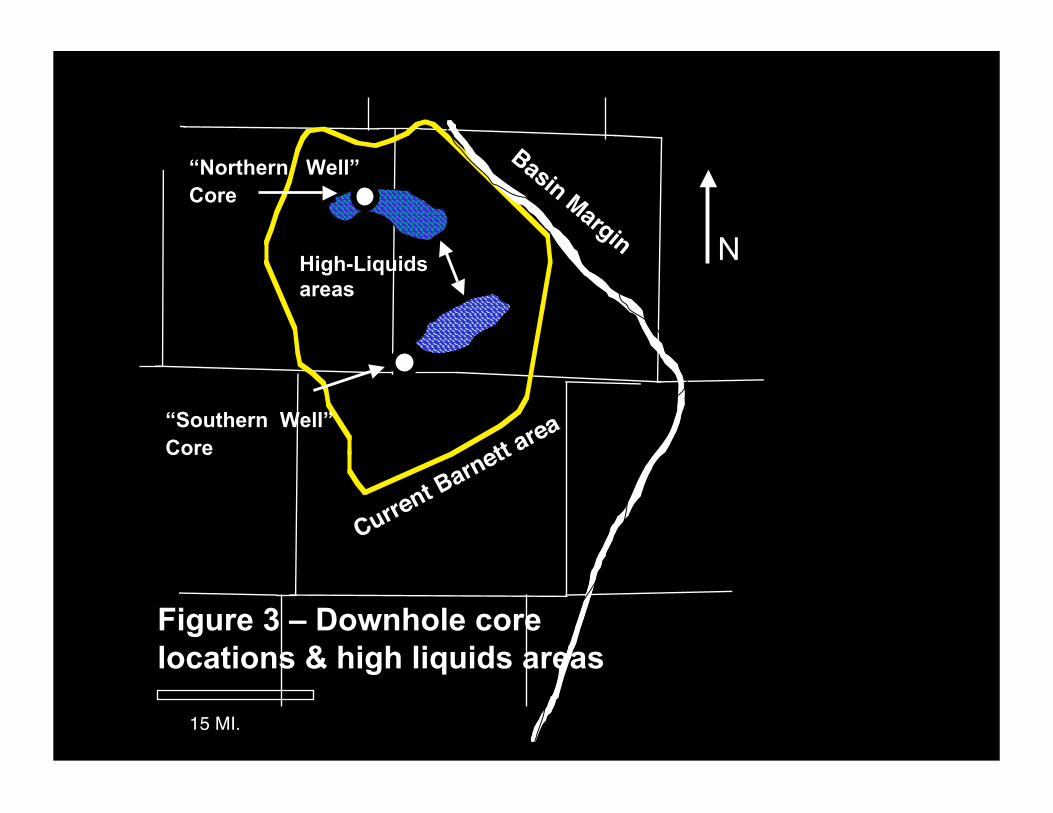
system. Figure 3 shows general problem areas within the current Barnett Play, and
locations were core material was obtained for testing.
This is a three-phase project that includes laboratory and field components, where gas-
water ‘Co-Production’ is the chief method employed to maximize gas rate. The idea of
moving as much water as possible is basically untested in this reservoir. Field testing
‘Co-Production’, along with lab testing reservoir core responses to maximum drawdown
at varying water saturations & with surfactant chemicals, will determine if we can
maximize well EUR’s w/ this analysis.
PROJECT FUNDING LEVEL
Total estimated cost to Penn State for the performance of this subcontract was not to
exceed $73,000. Republic Energy shares a $25,550 in-kind contribution in the total
project cost of $98,550.
6
Three-Phase Work PlanThis is an ambitious, integrated study which has laboratory and field-testing
components. Meeting the objectives stated above required the following three phases:
• Laboratory Pore-Level Characterization of the Shale
• Flowing Pressure Analysis of Water / Condensate Production
• Field Co-Production & Fracture Dewatering
BACKGROUND - LABORATORY PORE-LEVEL CHARACTERIZATION
Republic and Stim-Labtm (Duncan, OK) designed the proper tests to evaluate ideas
about the reservoir rock and producing character, and allowed for proper scale-up of lab
results to the field level.
14 sidewall core plugs were cut from one well in key Barnett shale (and bounding
member) strata. This well was located in a northern, less prolific area where the Barnett
can produce gas, water & condensate phases.
15 core plugs (cut from whole slabbed core) were obtained from the University of Texas
Bureau of Economic Geology – from a previously cored well (a very high EUR well) in
the heart of the Play from an offset operator. See Figure 3 for these locations, and their
proximity to the areas of high liquid production (water & condensate)
StimLab is helping us design the proper lab test procedures for this reservoir rock.
Plans for data were:
• Basic properties (porosity, klinkenberg perms, bulk grain density, etc.)
• Thin section XRD / SEM analyses
• Critical salinity tests (for Shale sensitivities to different salinity ranges & FW)
• Flowback & Regained permeability tests of Shale to fluids (various surfactant
types, etc.)
• Methane desorption & determination of ‘threshold pressure’
We needed quality baseline petrographic data on the Barnett from areas with different
producing tendencies. We want to learn mechanisms that control frac loadwater
recovery, fluid sensitivity to additives, and the gas desorption potential from this Shale
(as reservoir pressure is lowered).
7
BACKGROUND - FLOWING PRESSURE ANALYSIS OF LIQUID PRODUCTION
Low calculated fractured well drainage areas (5-15 ac.) are thought to be due to
hydraulic fractures which are not properly dehydrated. Data shows that long hydraulic
fracs are induced but may be stress sensitive, and its suspected that tortuosity combined
with near-wellbore liquid saturations could cause excessive reservoir energy (pressure)
loss. This impacts calculated drainage radii, gas well performance and ultimately EUR’s.
Evaluation of well flowing pressure trends & early-time production data were used to
examine why high percentages of Barnett Shale wells suffer from natural or induced
liquid problems, and aggressive approaches that can improve gas rates & EUR’s.
Data gathering and interpretation consists of:
• Early & late time flowing tubing & casing pressures, pressure decline trends &
gas / water rates for over 140 total Barnett wells.
• Flowing pressure differentials between tubings & casings, which signify a well’s
liquid production & liquid loading tendency.
• Identifying geographic areas of known problems in the Barnett, and what
completion / production approaches can be used to maximize gas rate & EUR.
BACKGROUND - FIELD CO-PRODUCTION & FRACTURE DEWATERINGProperly designed field tests using submersible pumps for gas-water Co-Production
comprise the core of the dewatering approach in this project. In wells with high liquid
producing tendencies (for Barnett, high PI’s are 0.3 – 5.0 bbl/day/psi ), properly sized
ESP’s can provide maximum and consistent bottomhole pressure drawdown by
removing the hydrostatic head component in wells roughly 8000’ deep.
For Republic, two (2) candidate wells for ESP testing were selected (for both practical
and logistical reasons) – wells in different parts of the Barnett:
• Northern, less prolific area where the Barnett can produce gas, water &
condensate phases.
• Near the main (Southern) Barnett area, but in a specific location of high liquid
production and some non-flowing wells. (See Figure 3 for approximate location)
Also, less-aggressive styles of Co-Production dewatering are underway for Republic:
• Rod pump in three (3) Barnett wells
• Plunger lift in seven (7) Barnett wells.
8
The major differences are rod pump / plunger lift methods operate with an on-off
drawdown condition in wells with a lower productivity index (PI) and bottomhole
pressure, while ESP’s allow for a constant (and often greater) bottomhole drawdown in
gas wells with a sufficient liquid PI. Results from all styles of Barnett Co-Production
have been integrated and the benefits quantified.
Bulleted Summary of Overall Project ResultsLABORATORY CHARACTERIZATION PHASE
• All shale zone samples showed < 0.01 md permeability. This adds to the
prevailing opinion that matrix is not the primary production source, and only acts
as desorption storage similar to coalbed.
• Based on the salinities tested (freshwater to 150,000 ppm), the Barnett is
not extremely water sensitive. The one case where FW sensitivity was shown
(Barnett ‘C’ zone, Northern well), as little as 5000 ppm controlled this sensitivity.
• Nine commercial additives were tested for improved water recovery and
increased gas permeability.
o Plexsurf WRS-C (Chemplex Inc.) improved kGAS over 24%, but at 4 times
the recommended concentration (2 gal/1000 gal).
o ProSurf I Plus (1 gal/1000 gal) & Prosurf II (0.5 gal/1000 gal) measurably
lowered time to recovery, and improved kGAS over 5% (American Energy
Services, Inc.).
o Inflo 45S (2 gal/1000 gal) & Prosurf II (2 gal/1000 gal) improved kGAS
over 9% (BJ Services, Inc.).
o Cudd RFF-1 (1 gal/1000 gal) improved kGAS over 10% (Cudd Inc.).
o The other four products either foamed and hampered flow or showed no
substantial improvement for their cost.
FLOWING PRESSURE ANALYSIS OF PRODUCED LIQUIDS PHASE
• High liquids production that causes problems in Barnett wells is almost certainly
not Barnett water, but fluid from sub-bounding Viola & Ellenberger zones. This is
verified by flowback analyses, chlorides trends vs. time, and flowing pressures.
• Long hydraulic fractures are induced upon treatment (killing offset wells).
However, low calculated drainage areas are due to stress-sensitive fractures and
9
liquids in the fracture (in the underperforming groups), causing high energy
losses in the reservoir.
• Poor fracture dehydration occurs due to high volumes of frac water- especially
combined with high influx volumes from Viola & Ellenberger zones.
• Northward in the Barnett, three-phase production (cond./gas/water) further
compounds problems for flowing gas wells. PVT analysis verifies that free liquid
exists in the reservoir (#6800 gas dewpoint, #3600 BHP), along with fluid from
sub-bounding Viola & Ellenberger zones.
• Figure 3 shows areas of high liquids production (flowback & sales-line water).
• Early-time chlorides trends show a strong relationship with production & EUR –
the higher the slope and higher the value, the poorer the well. Figures 4,
4 (#1-5), and Figure 5 detail this trend.
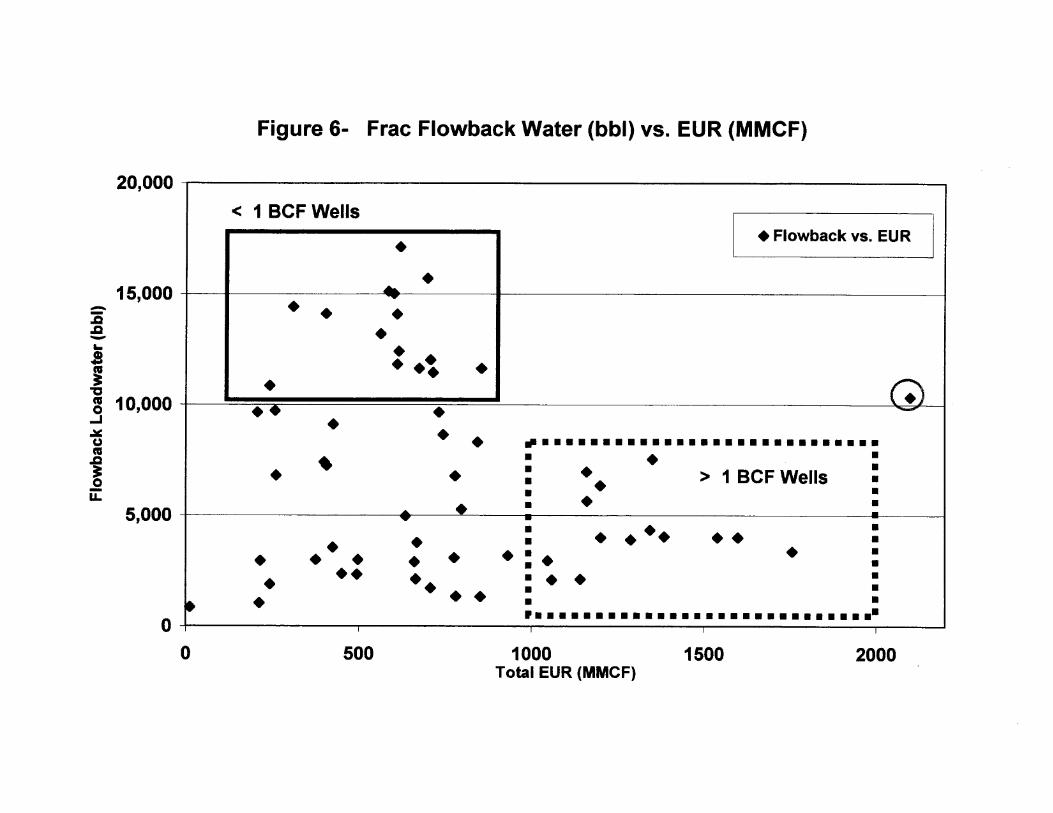
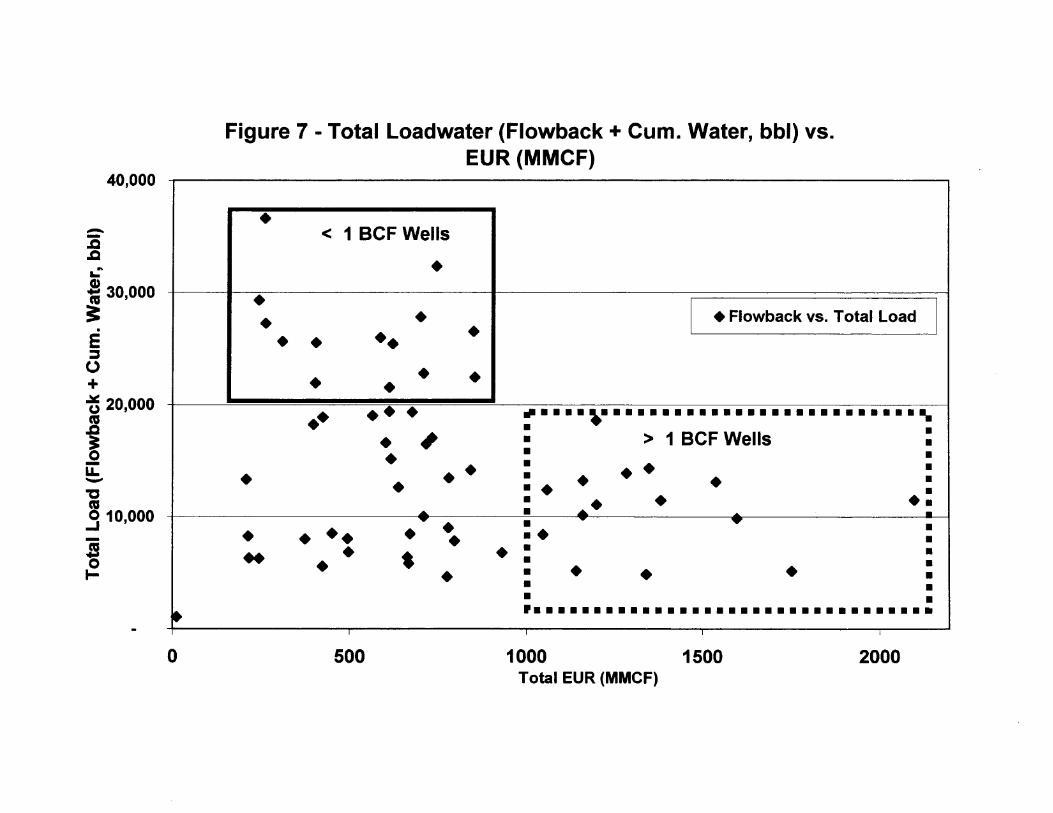
• Figures 6 & 7 show EUR is strongly inversely related to Frac Loadwater
Recovery (bbl) and to Total Load Recovery (flowback + production water, bbl).
o < 1BCF wells make > 10,000 bbl Frac Loadwater and > 20,000 bbl
Total Load.
o No well > 1 BCF makes over 8,000 bbl Frac Loadwater or over 18,000 bbl
Total Load.
o A considerable number of wells lie somewhere in between this spectrum,
mainly due to early-time data & sample size (n = 60).
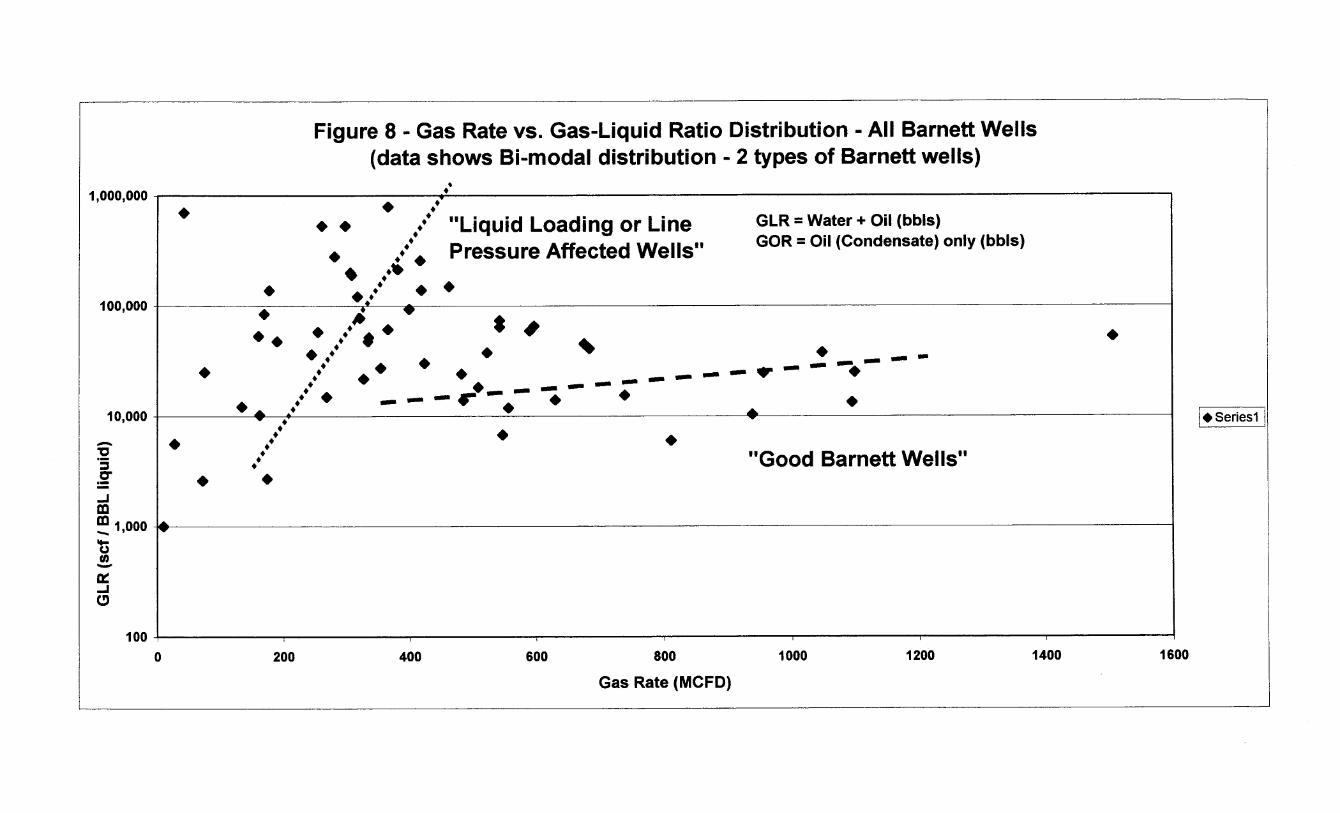
• Figure 8, Gas Rate versus GLR (scf/bbl liquid) shows a bi-modal distribution and
two different types of Barnett wells, when examined across the field as a whole.
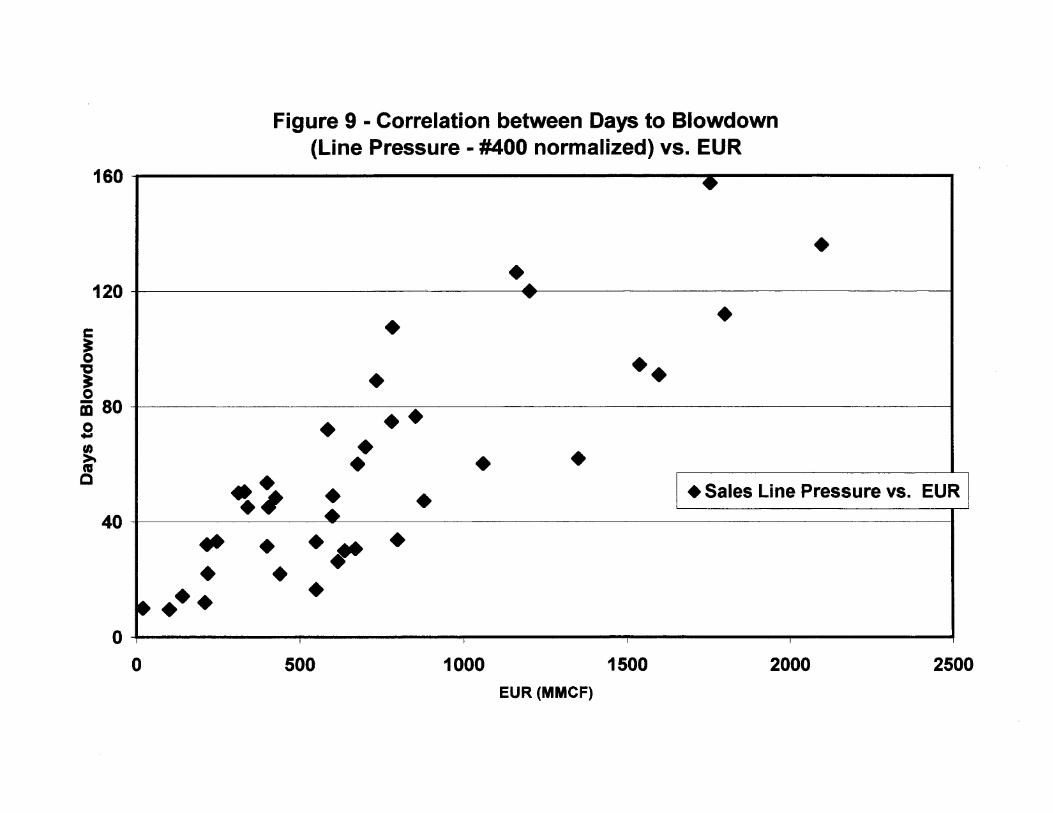
• Figure 9 shows a strong correlation between Time to WHP blowdown (days)
plotted versus Ultimate recovery (EUR, MMCF).
• A sizeable percentage of Barnett gas wells need artificial lift (at various times in
the well life cycle) to either prolong a flowing condition, or to overcome hydraulic
forces that impede gas flow & wellbore unloading. Common options are:
o Swabbing, Flow intermitter, capillary or velocity strings, plunger lift,
compression, rod pump, gas-lift & ESP.
10
FIELD CO-PRODUCTION & FRACTURE DEWATERING PHASE
• High-rate gas / water Co-Production (80-500 BWPD) was previously untested in
this reservoir, and only recently become a viable option, to due more drilled
acreage encountering marginal reservoir quality.
• Aggressive Co-Production in gas wells (using below-perforation ESP’s w/
variable-speed drives) was the featured approach of this project, drawing on
experience and success from south Texas and New Mexico Permian Basin in
fractured reservoirs.
• ESP designs were finalized after data were gathered from the first two project
phases (Lab Core & Flowing Pressure Analyses).
• Two candidate wells for ESP testing were chosen in:
o Northern, less prolific area where the Barnett can produce three phases.
o Near the main (Southern) Barnett area, but in a specific location of high
liquid production and some non-flowing wells.
• Other Co-Production methods utilized by Republic are:
o Rod pump in three (3) Barnett wells
o Plunger lift in seven (7) Barnett wells.
RESULTS
• Even with all the pre-planning, there was operational difficulty getting good ESP
tests in the 30-day period, with allotted funding. High volumes of liquid were
removed to recover gas from non-flowing wells, but in uneconomic proportions.
o Northern well cum. test production: 1400 MCF, 7259 BW
o Southern well cum. test production: 260 MCF, 3240 BW
• Northern well encountered a csg. problem and was set above-perfs, had
problems with gas-locking, and downhole cycling of fluid in recirculation pump
system.
• Southern well test was cut short by producing large sand volumes, even with a
gradually increased drawdown using a variable-speed drive.
• The more extreme approach of downhole sand-control combined with “super
sand pump” ESP’s would be required for permanent installations with high
drawdowns. Economics of sand-control + variable-speed controlled ESP are
marginal at < $3.00 / mcf gas price.
11
• Overall, pro-active conventional dewatering has been a success for Republic
Energy in the Barnett Shale:
o Since early 2001, 12 gas wells have required aggressive lifting.
o Gas well dewatering has produced approx. 209.3 MMCF, 500 BC and
46,713 BW since early 2001 (12 wells).
o Approx. undiscounted gross revenues from this approach ($3.00 gas,
82% NRI, $1 bbl disposal) are $477,000.
o Capital investment has been approx. $202,000 total from (2) ESP tests, 3
rod pumps and 7 plunger lift systems.
o Incremental EUR’s are over 330 MMCF / well for the rod pumped wells
(3), and approx. 90 MMCF for the plunger lifted wells (7) on average.
Discussion of ResultsLABORATORY CHARACTERIZATION PHASE
The purpose of this phase was to conduct petrographic examination, fluid sensitivity
studies and additive evaluation for enhanced flowback on the Barnett Shale. The
samples spanned the Upper Barnett, Forestburg, five members of the Lower Barnett (A,
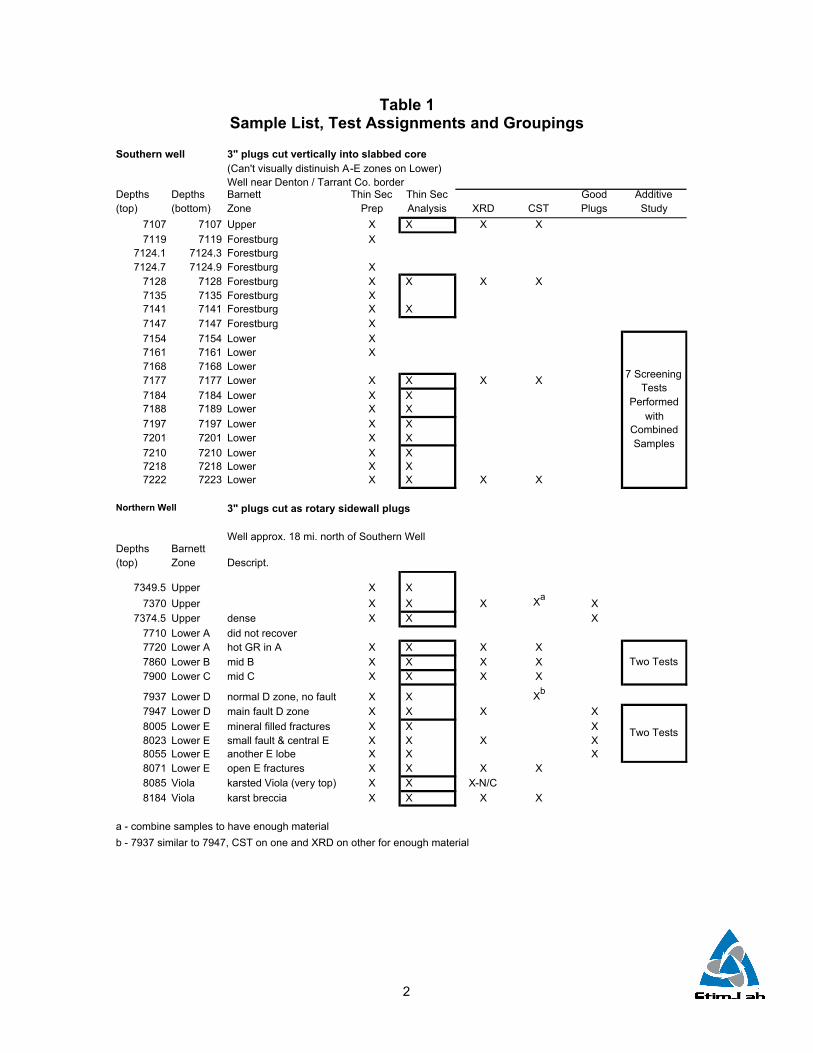
B, C, D and E) and the Viola beneath the Lower Barnett (Table 1 and Figure 2). X-ray
diffraction (XRD), thin section (TS) analysis were performed on the various core plug
samples to classify the samples and group them for further testing. Figure 3 shows the
approximate locations of the Northern and Southern wells within the field, where core
material was obtained for testing.
Further testing (with the same core) included fluid sensitivity by the capillary suction time
(CST) testing method and flow studies with ground Barnett formation material to
evaluate various additives from different suppliers on their ability to enhance and speed
recovery of gas production following hydraulic fracture stimulation with water.
Laboratory procedures for Capillary Suction Tests and the Flowback Additive Studies
are described in detail in Appendix 1.
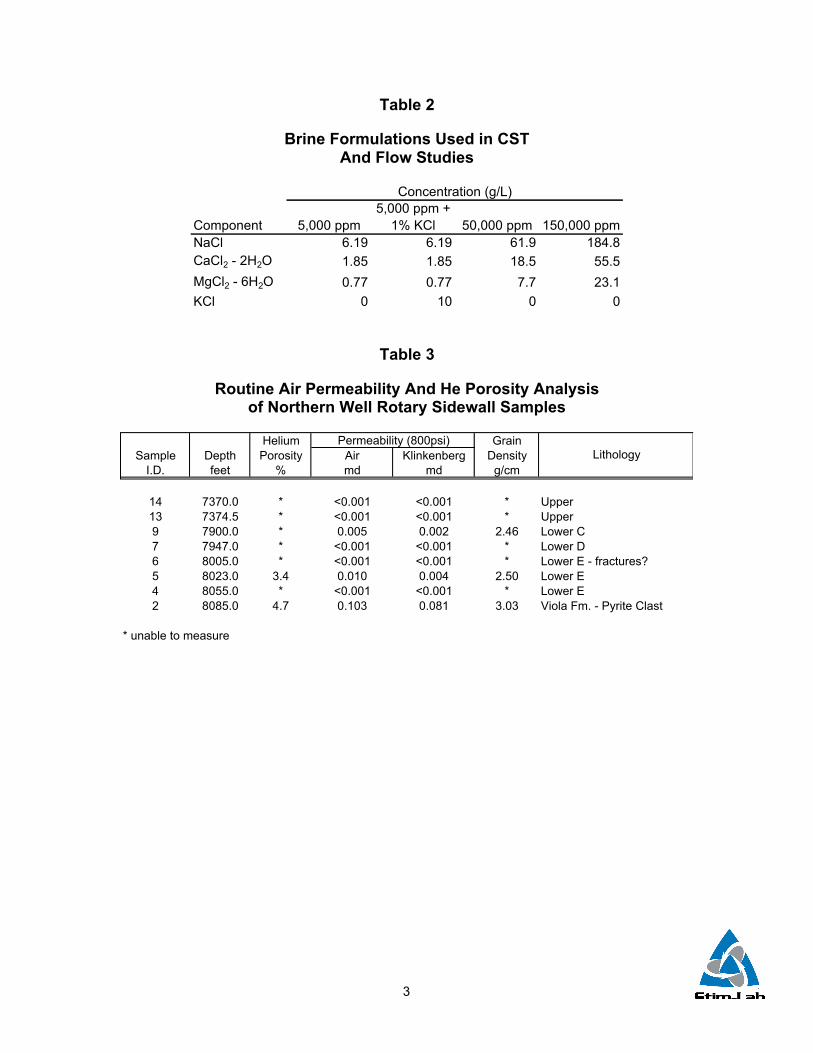
Table 2 shows different brines formulations used for testing, based on typical produced
water used in water fracs in the Barnett. These fluids spanned the range of conditions
encountered, from freshwater to an extreme of 150,000 ppm brine (which in some
cases, this high salinity flowback water from other wells is used for fracing).
12
Table 3 gives the results of the routine air permeability and Helium porosity
measurements. All shale zone samples showed less than 0.01 md permeability. This
suggests that matrix permeability is not the primary source production and only acts as
desorption storage similar to coal. Based on these results it was decided to conduct
fluid sensitivity and flow studies using ground shale samples.
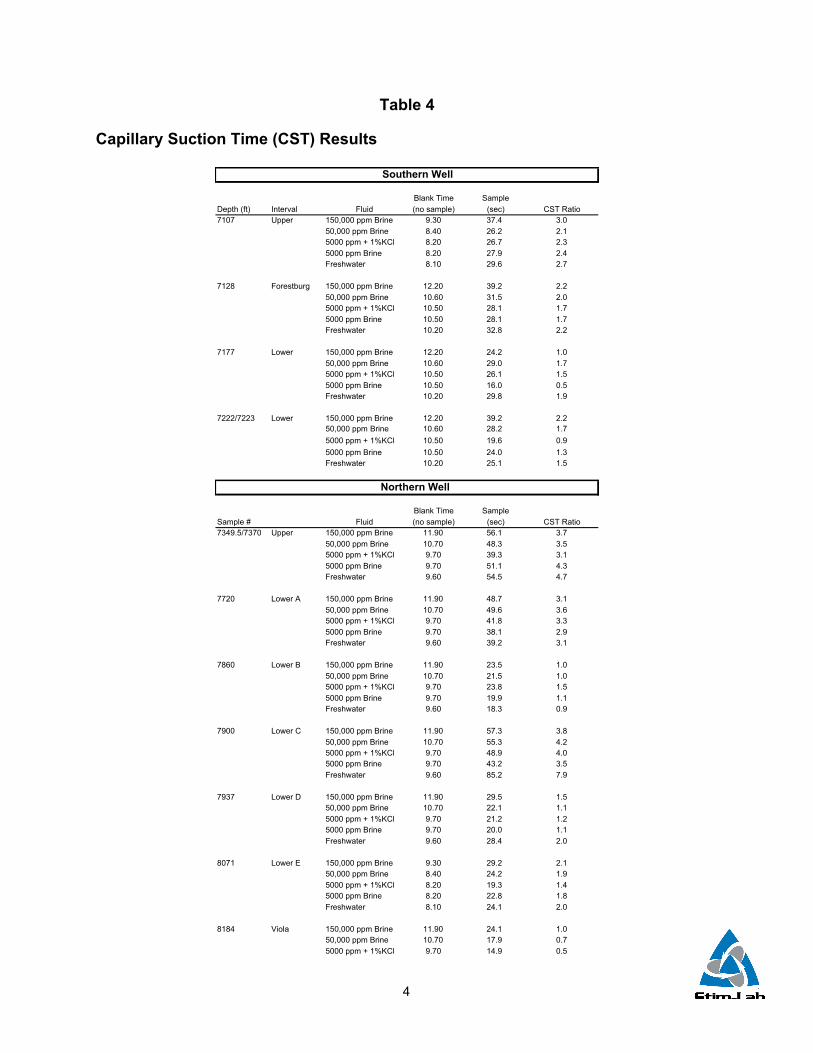
Table 4 gives the results of the capillary suction time (CST) tests. Fluids evaluated
represented several potential cases for fluid exposure based on available and potential
fracturing fluid sources. The samples for CST tests were grouped as given in Table 1.
Typical values for CST ratio vary from 0.5 for no sensitivity to >45 for extreme sensitivity.
However, the values must be compared to a control (usually freshwater) for evaluating
results for any sample. Most of the samples evaluated showed little fluid sensitivity to
brief (<1 hour exposure) to the various fluids tested. Only one sample from the Lower
Barnett C zone in the Northern well showed any fluid sensitivity and this was only to
freshwater. Addition of as little as 5,000 ppm salinity controlled this sensitivity.
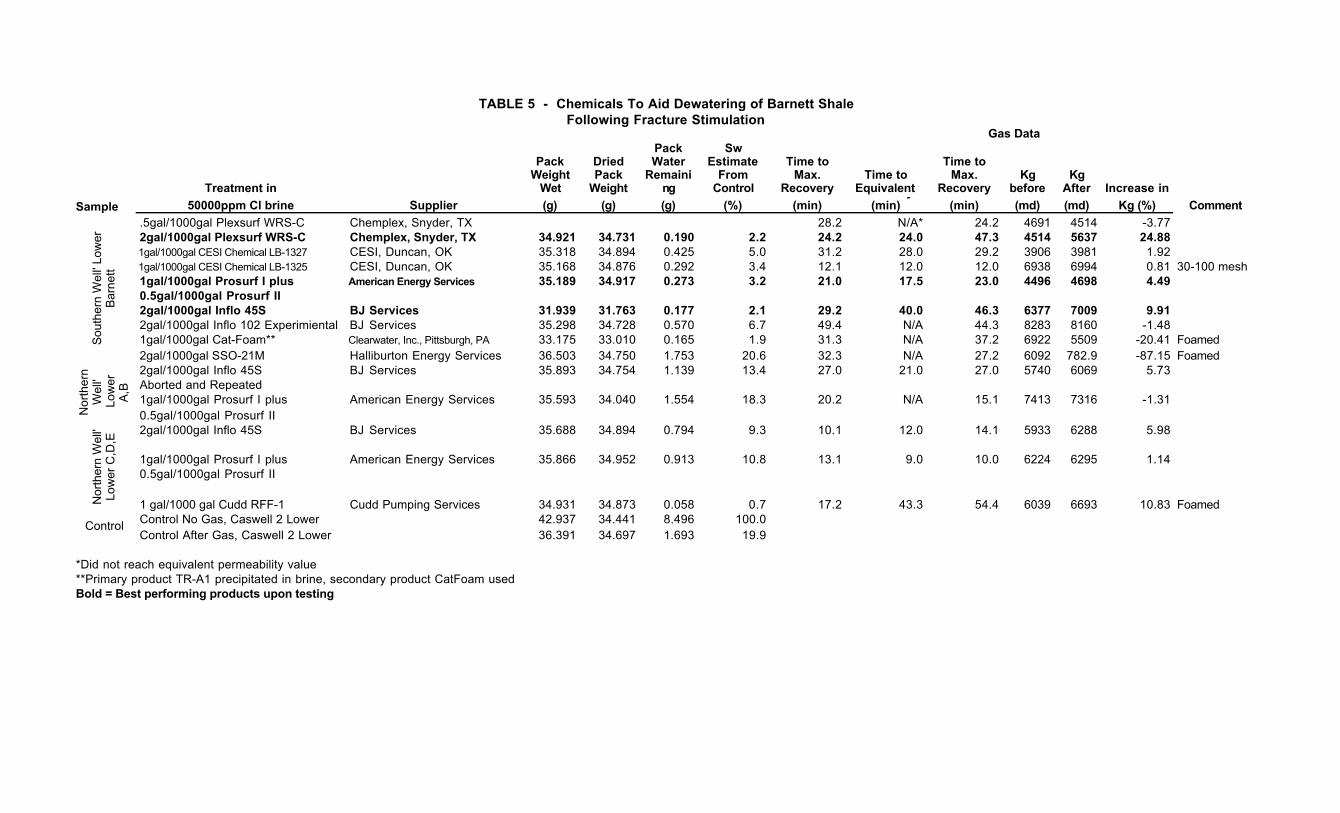
Table 5 shows the flow study results. Initial testing results showed it was most valid to
rely on Time to gas recovery and Amount of water remaining in the pack compared to a
control for evaluating the various products. Time to recovery is compared. This is the
time at the point where the relative permeability first stabilizes. Equivalent time to
recovery gives the time to the point where the gas permeability following treatment
reached the same relative permeability value as the pretreatment gas flow. A shorter
value for equivalent recovery time would indicate enhanced load water recovery. A
higher relative permeability may also result due to the lower water saturation (Sw). A
time for equivalent recovery is not given if the post treatment gas flow failed to reach the
pretreatment gas permeability.
Nine (9) products were evaluated in the initial screening tests with the composite Lower
Barnett samples from the Southern well. Water recovery was good for all products
compared to the controls. However, the controls were conducted with composite
samples from the Lower Barnett Northern well core plugs. Therefore, for the Southern
well screening tests it would be best to compare relative results for the different products
and reserve control comparison to the Northern well tests.
13
Plexsurf WRS-C from Chemplex was evaluated at two concentrations to determine if
increasing the concentration improved effectiveness. Since the treatments were
performed on the same pack, only one retained water mass was measured at the end.
At the 0.5 gal/1000 gal concentration, the treatment proved ineffective at improving the
relative gas permeability. Increasing the concentration to 2 gal/1000 gal increased
relative permeability, but it did not shorten the time to recovery. This may be due to a
slight increase in viscosity of the solution (not measured) with the higher additive
concentration lengthening the fluid displacement time with gas. Unfortunately, budgeting
did not allow for evaluation of all candidates at several concentrations.
Two products created foam upon gas return flow. These were SSO-21 and CatFoam.
The foam trapped gas within the core resulting in reduced retained relative gas
permeability. Two products were selected from the initial screening for further study with
the Northern Well Lower Barnett samples. These products were American Energy
Services Prosurf I and II combination and BJ Services Inflo 45S which both improved the
relative gas permeability and had low retained water saturation within the pack. The
Plexsurf WRS-C was not chosen to continue as it only performed at four times its
recommended concentration.
Evaluation of the two products in the two groups of composite samples from the
Northern Well showed less water recovery than the Southern Well samples - indicating
that the character of the formation and/or age of the samples affected the water retention
properties. Compared to the control samples both additives lowered the retained water
compared to the control. The AES Plexsurf product was slightly less effective than the
BJ 45S product in improving the relative permeability. Neither dominated in decreasing
time to equivalent recovery with BJ product favored in the A,B sub zones and the AES
product in the C,D,E sub zones.
Conclusions from tests performed indicate that the Barnett shale most likely produces
from a fracture network as matrix permeability is extremely low. The Barnett shale is not
extremely water sensitive and that the current practice of fracturing with available water
with low salinity most likely creates little flow impairment. Additives to improve water
recovery and therefore lower water saturations with net improvement in relative gas
permeability may be beneficial and should be further explored in larger scale laboratory
14
tests and/or field scale evaluations where conditions can be controlled to provide
reasonable comparisons.
FLOWING PRESSURE ANALYSIS OF PRODUCED LIQUIDS PHASE
As described in detail previously, over 41% of sampled Barnett wells make over
80 bbl/MMCF water after being on production, whereupon adequate fracture dehydration
does not occur with the available reservoir energy. It is quite clear that liquids in the
reservoir and wellbore suppress Shale gas ultimate recoveries, and liquids are one of
the primary factors (both in the form of large volume waterfracs and formation water
influx)) leading to the current percentages of underperforming wells (see Specific
Production Problems list, Page 4).
The actual origin of liquids, and their impact in relation to important factors (like geologic
structure, stratigraphy and tectonics), is a matter of much debate and speculation
amongst experienced the Barnett Shale operators. The data developed within this study
are arguably the most complete, most robust and best integrated, to begin to define and
analyze: Field liquids / production problems, Provide spatial patterns for problems, and
Incorporate operational and production solutions to solve these problems and improve
well production and EUR’s. Key parameters worthy of analysis and understanding are:
• Field Chlorides trends by well, and groupwise versus gas production
• Fractured well flowback and total liquid recovery versus production
• Correlation between WHP blowdown time versus gas production
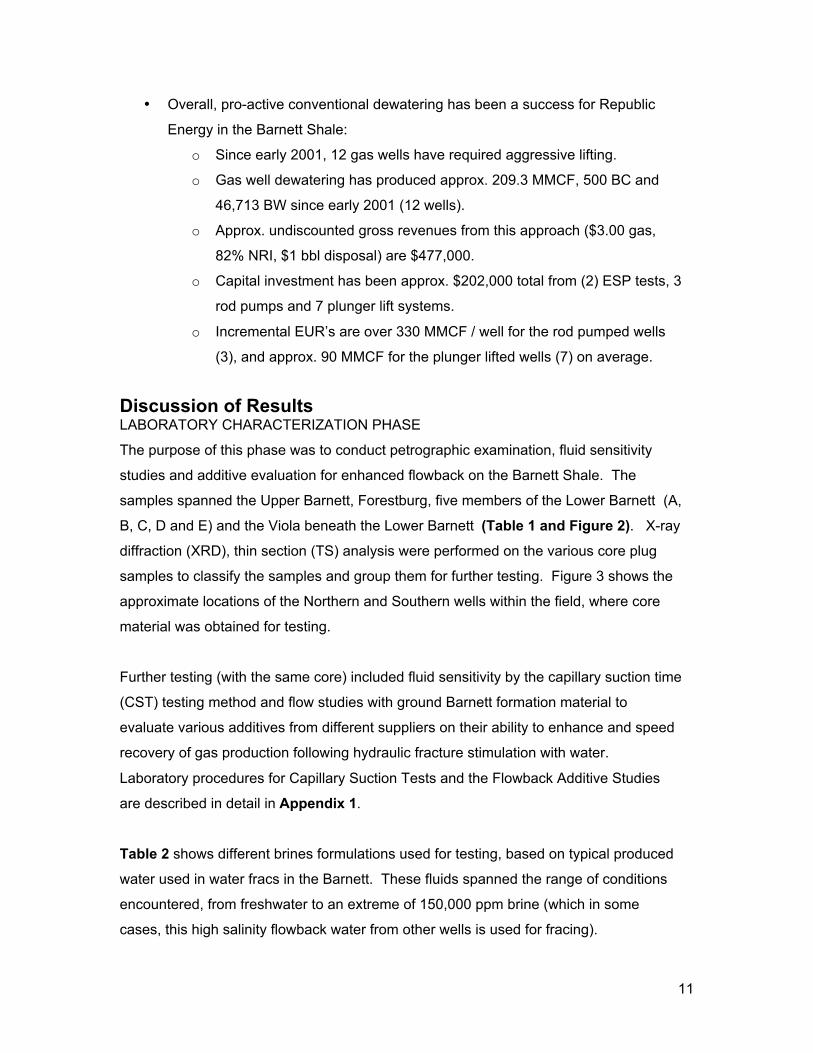
Chlorides
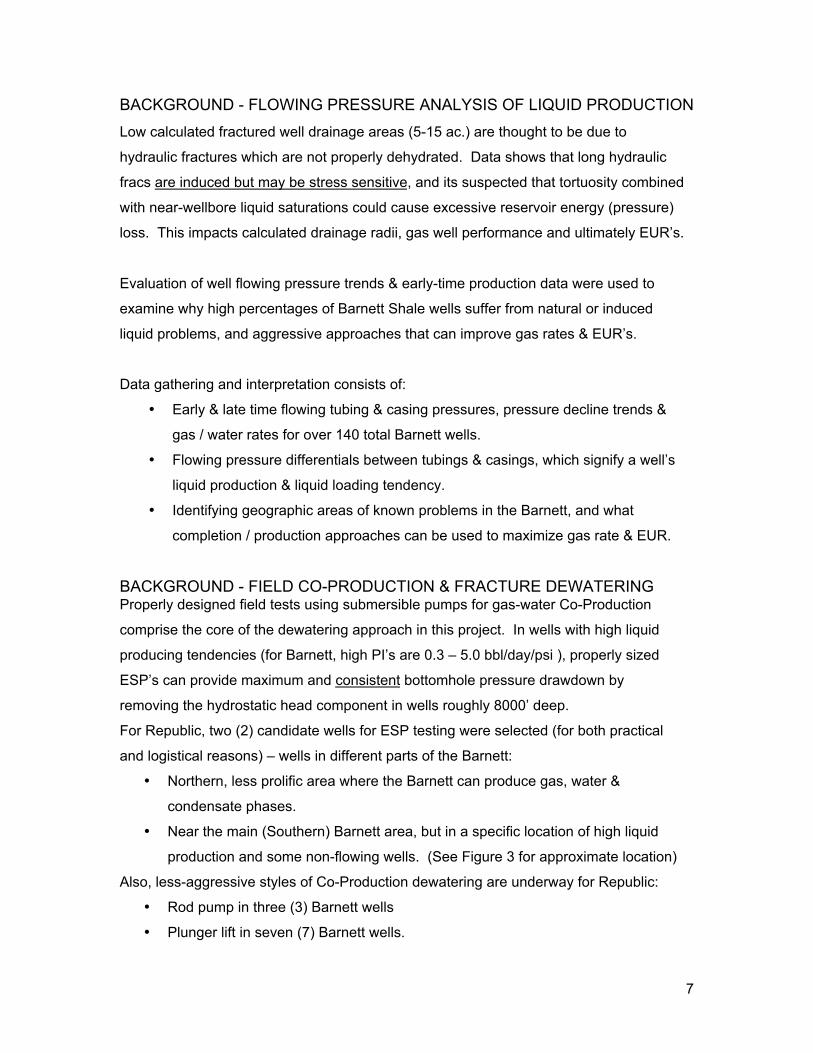
Spatially across the field, patterns in chlorides values versus time are very reliable
correlating variable with well performance and gas ultimate recovery. Data from Figure
4 shows robust data sets from all across the currently active Barnett area. Data from
Figures 4 (1) – 4 (5) detail the spatial pattern of chlorides trend both by areas (labeled
#1-5 on Figure 4) and chlorides trends versus EUR (Figure 5).
Referring to Figure 4 for placement of trend areas:
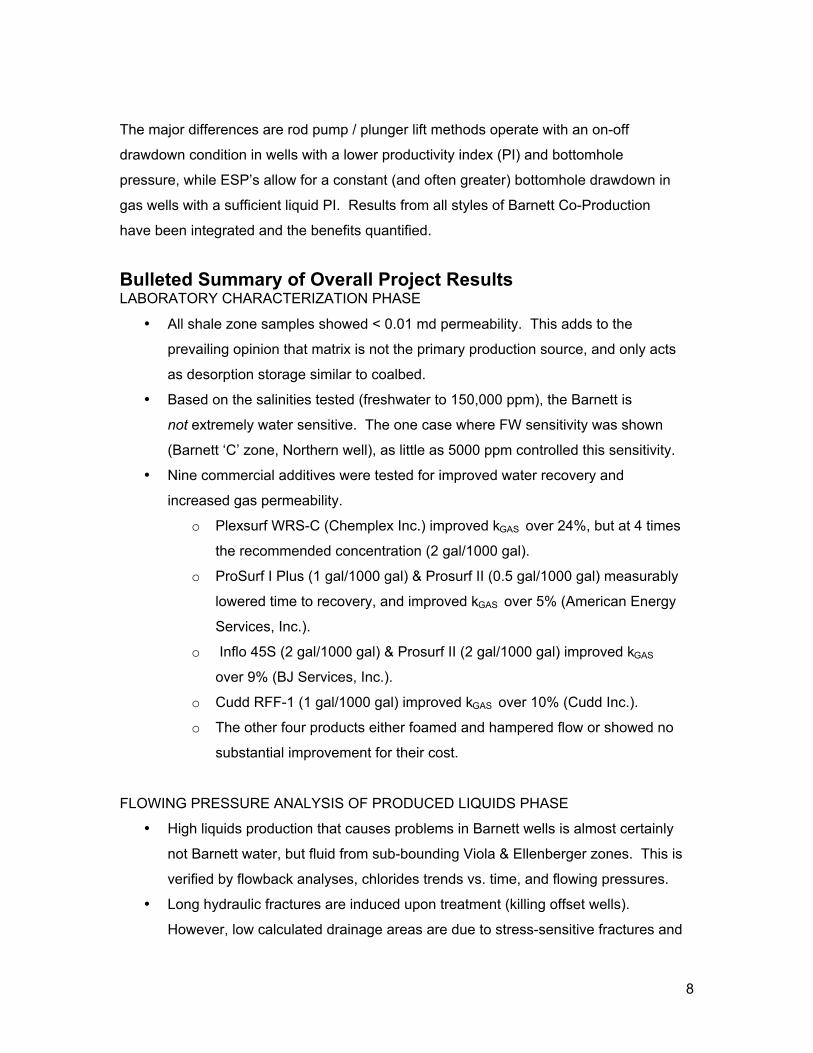
• Figure 4 (1) – A depletion-style dry gas area with a low chlorides trend over time.
These are high EUR wells and strong performers.
15
• Figure 4 (2) – A depletion-style dry gas area having some variability in liquids,
but a relatively flat chlorides trend over time. These are high EUR wells and
strong performers.
• Figure 4 (3) – A high liquids, gas/water/condensate producing area and an area
with quite different reservoir characteristics. These are low-to-marginal EUR
wells, and showed a much higher chlorides slope over time.
• Figure 4 (4) – A wide group of wells on the edge of a known high liquids, variable
production area of the Barnett. These are low-to-marginal EUR wells, showing
aggressive chlorides trends, especially when compared to Locations 1 & 2.
• Figure 4 (5) – This is a group of high chlorides, high slope trending wells in an
area of known liquids production. These are low EUR wells, mixed with some
non-flowing wells. Interestingly, most wells in this area had an IP > 1100 MCFD,
but rapidly declined.
• Chlorides sampling program specifics: All wellhead samples, pulled in 25-ml
bottles, all analyzed by the same laboratory. Sampling Program Frequency:
o Frac fluid itself (either from frac pit or working tanks during the job)
o Every 8 hours during flowback
o 1st five days down sales line (5 samples)
o Normally at 30, 60, 90 day etc. intervals
This type of program allowed for some repeatability and a respectably large data set
from over 80 Barnett Shale wells (sometimes 20 data pts. for a given well). The figures
above don’t include all wells, but the group with the most complete data sets.
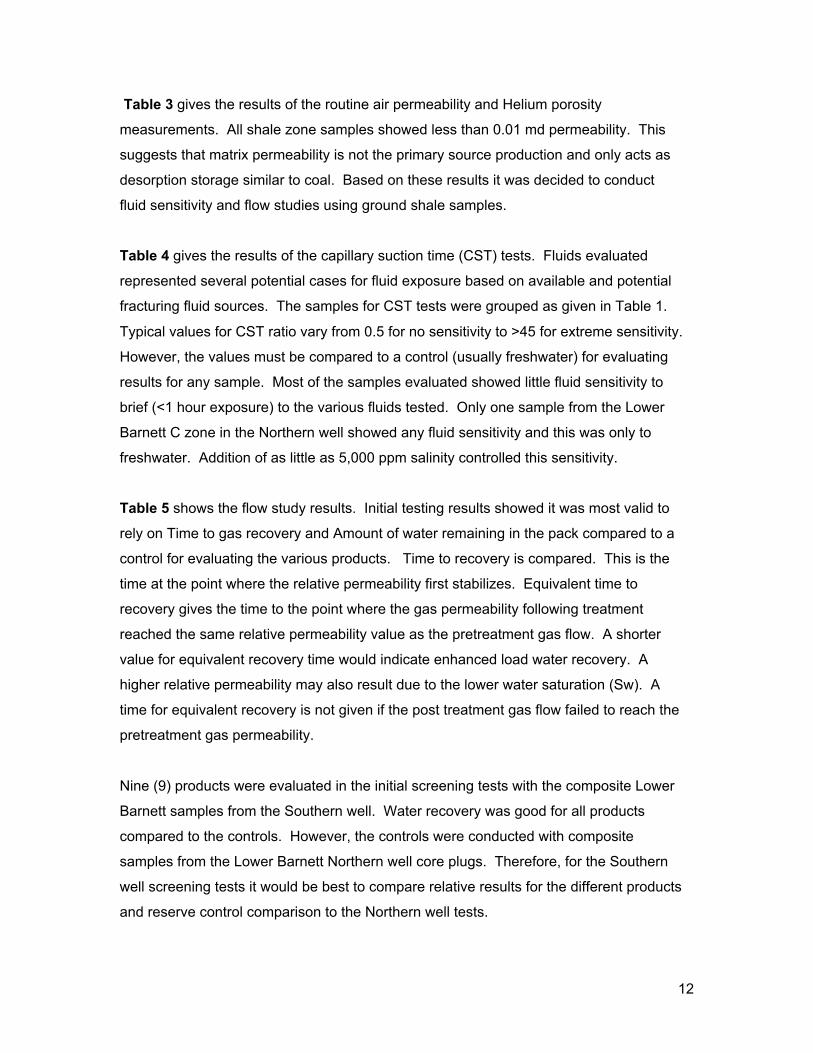
• Figure 5 shows the strong correlation between maximum chlorides value reached
(max. minus a 5000 ppm frac fluid baseline value) and EUR. As a rule in this
data set, wells projected over 1 BCF will have chlorides < 50,000 ppm. It is our
opinion that wells having > 50,000-70,000 ppm chlorides (especially early in the
well life) are communicating with lower bounding zones, by porosity bands,
faulting, fractures or karsted Viola and Ellenberger zones.
16
Liquid Recovery Versus Production
EUR is strongly inversely related to Frac Loadwater Recovery (bbl) and to Total Load
Recovery (flowback + production water, bbl) – FOR SOME WELLS. In a “normal”
reservoir, high load recovery after fracture is a good sign. Often, a 65% load recovery is
thought of as optimal. However, in a dual-porosity, fractured system – fracture load
recovery analysis often sends mixed signals to operators.
• Figures 6 & 7 look at Frac Loadwater and Total Load (Frac Load + Cumulative
Water), respectively.
o They show < 1BCF wells make > 10,000 bbl Frac Loadwater and >
20,000 bbl Total Load.
o No well > 1 BCF makes over 8,000 bbl Frac Loadwater or over 18,000 bbl
Total Load.
o A considerable number of wells lie somewhere in between this spectrum,
mainly due to early-time data & sample size (n = 60).
• Figure 8, Gas Rate versus GLR (scf/bbl liquid), shows a bi-modal distribution and
two types of Barnett wells, when examined across the field as a whole. Given all
the reservoir variability, two or three general trends are not surprising.
WHP Blowdown Over Time Versus Ultimate Recovery
Possibly the most dramatic and telling correlation developed in this project is Figure 9,
Correlation between Days to Blowdown vs. EUR (MMCF). While line pressures vary,
they don’t vary too far (#320-450) to make a basic correlation. Line pressures were
normalized, and project ultimate recoveries were plotted.
• This graph, especially when considered with all available liquids & chlorides
data, shows that Barnett production is a function of the following:
o Porosity and permeability
o Zonal communication
o Fracture conductivity (& pressure-dependent conductivity)
o Liquids in the reservoir and inside the wellbore
Underperforming Barnett wells normally blowdown to line pressure in less than 30 days,
and need assistance with liquid removal pro-actively to attain an economic well EUR.
17
FIELD CO-PRODUCTION & FRACTURE DEWATERING
For wells already drilled within the Barnett Shale, as well as for future wells in many
areas – proactive and aggressive gas / water Co-Production is the best option for
moving underperforming wells into the “acceptable” part of the EUR continuum. This is
especially true in a firm gas price environment (> $3.00 / mcf), where prices allow
operators to take production approaches that were uneconomic at lesser gas prices.
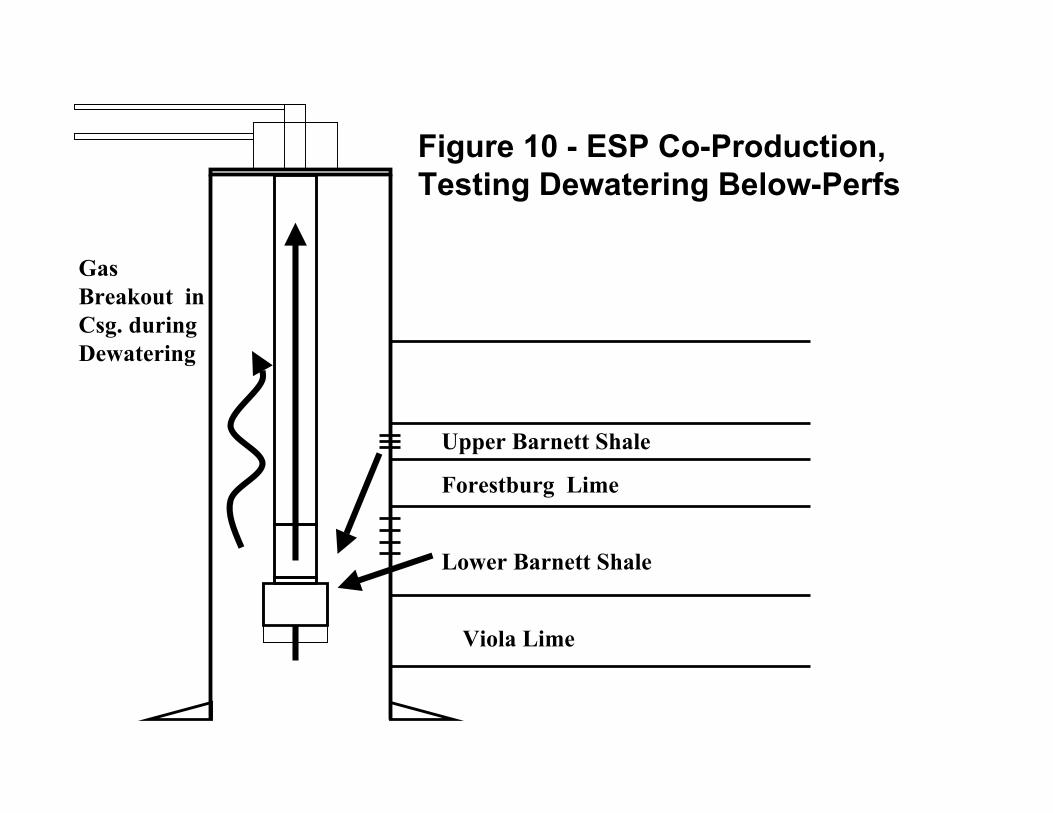
One main project objective was to feature high rate Co-Production dewatering using
electric submersible pump (ESP) below perforations. The basic premise of moving
maximum water to unload wellbore, to liberate trapped gas and lower reservoir pressure
to allow desorbed gas production, was basically untested in this reservoir until now.
Aggressive Co-Production (using plungers and rod pumps) has been successful for
Republic Energy, but dewatering with ESP (30-day tests) was not an economic success.
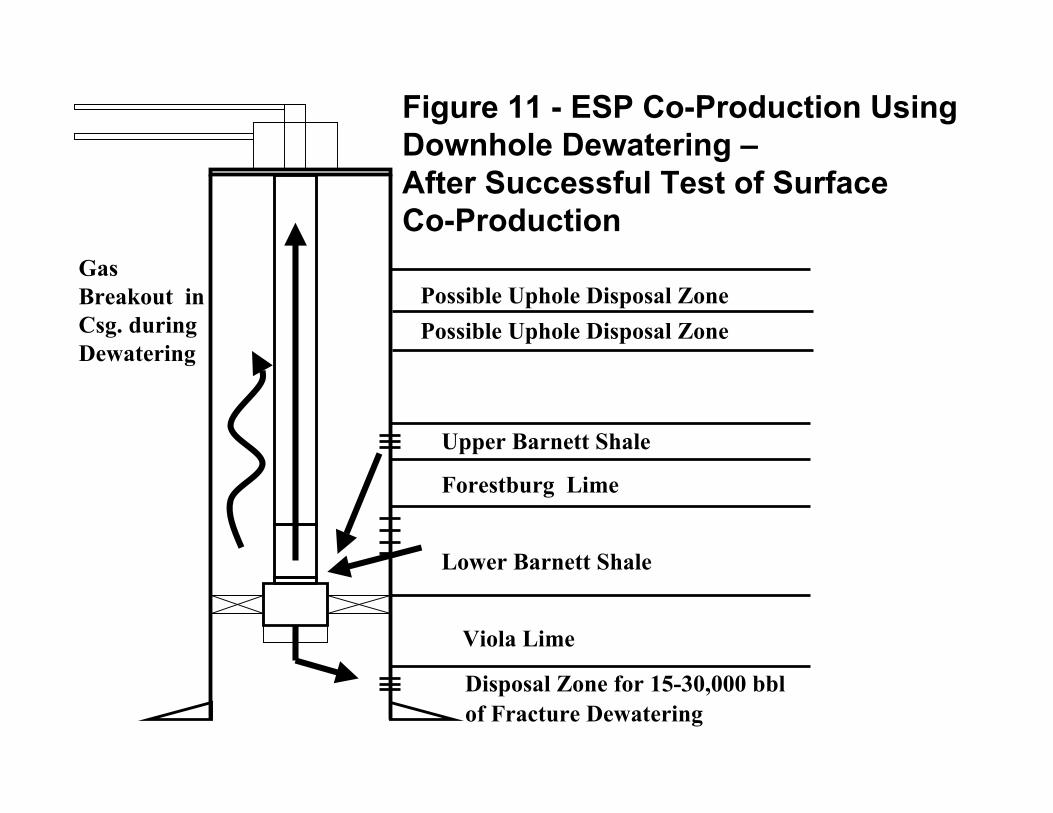
Figures 10 and 11 show the general schematic of plans. After first successfully proving
Barnett Shale dewatering benefits, it was planned to enhance economics and water-
handling feasibility by moving water (regardless of water source) back into a lower
bounding zone while Co-Producing gas. This has been proven successful in some oil
and gas provinces.
After evaluating candidate wells and gathering data from the other project phases for
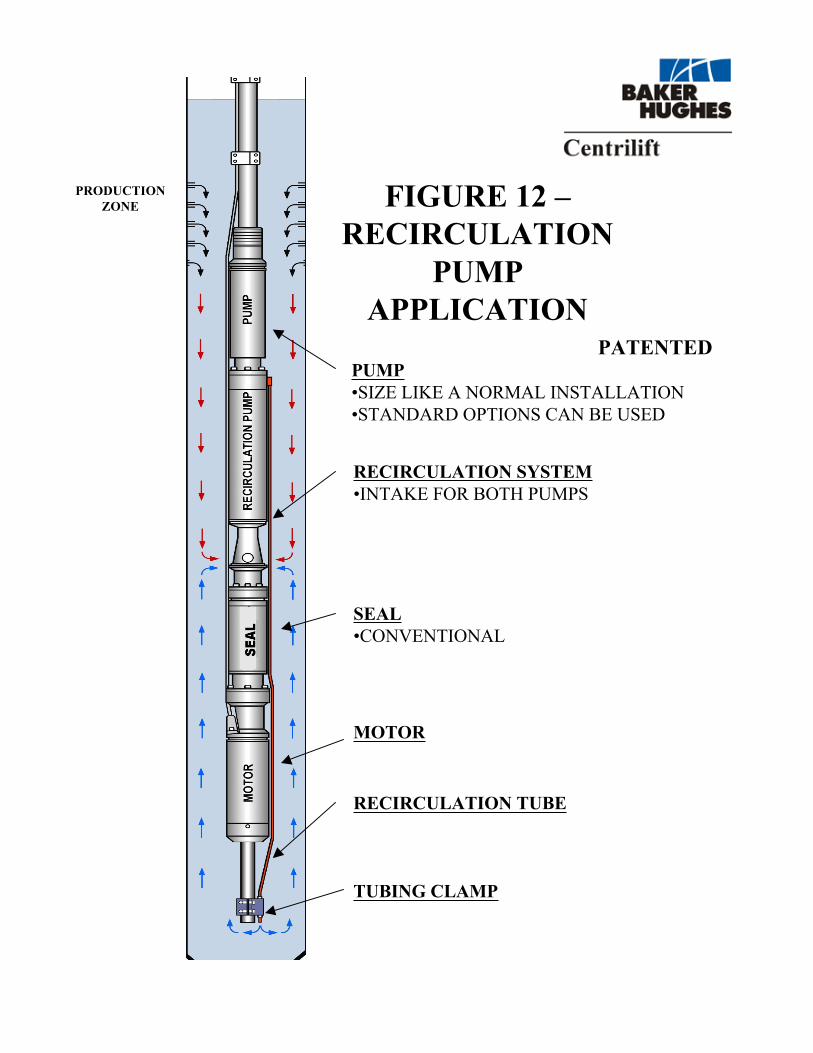
months, the following ESP approach was set into motion using Baker-Hughes Centrilift’s
system. A recirculation system was chosen instead of a shrouded ESP, for purposes of
motor cooling and ability to fit inside 5.5”, #17 N-80 production casing (a standard for
Barnett completions since 1999, up from 4.5” prior). At near 8000’, with concerns about
solids / sand / fluids, this was recognized as a challenging environment for all personnel
involved. The recirculation system is shown in Figure 12.
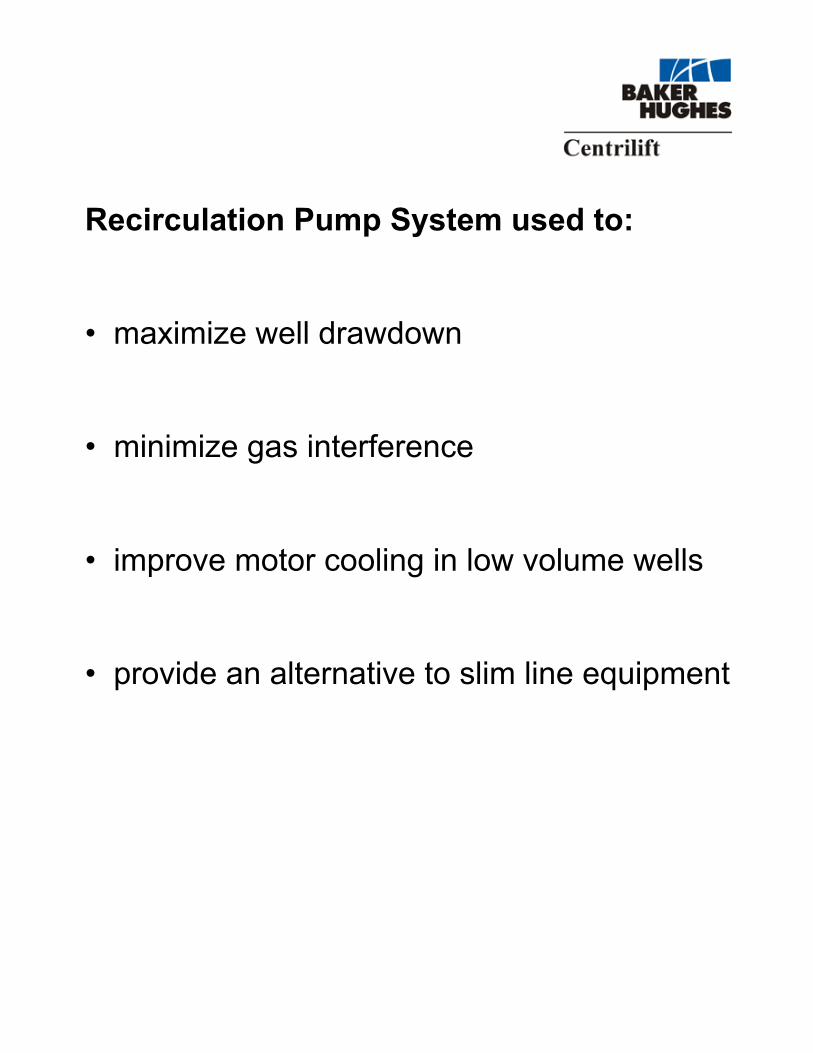
• Designed to: Maximize drawdown & minimize gas interference, improve motor
cooling and provide an alternative to ‘slim-line’ equipment.
Results & Timeline (ESP)
Two candidate wells were: Northern well (same well rotary sidewall cores were cut for
analysis), & Well near main (Southern) Barnett area, but in a specific location of high
liquid production and some non-flowing wells.
18
• February-May 2001- Identify problem geographical areas and high liquid PI
areas. Decide on two candidate wellbores.
• August-November 2001- Design below-perfs ESP’s with CentriliftTM to dewater
gas wells, drawing on experience from other gas well dewatering basins.
• November 2001-February 2002 - Wait for proper timing for core acquisition, and
proper timing for installation & operation.
• March-April 2002 – Prepare locations & piping for installation. Perform wellwork
and begin 30-day ESP dewatering tests.
• April-May 2002 – Pull ESP, and evaluate operational & production data.
Even with all the pre-planning, we still encountered operational difficulty in getting good
ESP tests during the 30-day period, and with the funding allotted. We made gas from
non-flowing Barnett gas wells, and moved a high amount of liquid to recover the gas, but
in uneconomic proportions.
NORTHERN WELL –
Pre-test condition: Dead (loaded, non-flowing new drill well)
Initial ‘co-production’ test rates: 120-160 MCFD, 300-400 BWPD
Estimated Design PI (bbl/day/psi drawdown) = 0.3
Actual PI (bbl/day/psi drawdown) = 0.5 – 0.2
Cumulative test production: 1400 MCFD, 7259 BW
Operational problems: Stuck unit above most of Barnett perfs due to casing abnormality.
Decision was made to set unit at top part of Barnett zone, just above abnormality.
Setting above perfs was not preferential, in a gassy environment. Had problems with
gas-locking, and downhole cycling of fluid in recirculation pump system.
SOUTHERN WELL –
Pre-test condition: Dead (loaded, non-flowing for 12 months, Year 2000 well)
Initial ‘co-production’ test rates: 80 MCFD, 450 BWPD
Estimated Design PI (bbl/day/psi drawdown) = 0.2
Actual PI (bbl/day/psi drawdown) = 4.0 – 5.0 ! (very high for a Barnett well)
Cumulative test production: 260 MCFD, 3240 BW
Operational problems: Set unit below perfs. ESP would not move consistent fluid, even
with over 7000’ of fluid in wellbore and a very high initial PI. ESP appeared to move
19
solids, may have had casing failure. Well test cut short by producing large sand
volumes, even with a gradually increased drawdown using a variable-speed drive.
ESP teardown showed solids damage, even using Centrilift’s best “super sand pump”.
With good / complete well tests, the reservoir probably would have responded favorably
– given the well PI’s and the gas well history from the Southern well (prior cum 143
MMCF, IP 1200 MCFD).
Results (Plunger lift and Rod Pump Methods)
• Overall, pro-active Co-Production dewatering has been a success for Republic
Energy in the Barnett Shale:
o Since early 2001, 12 gas wells have required aggressive lifting.
o Gas well dewatering has produced approx. 209.3 MMCF, 500 BC and
46,713 BW since early 2001 (12 wells).
o Approx. undiscounted gross revenues from this approach ($3.00 gas,
82% NRI, $1 bbl disposal) are $477,000.
o Capital investment has been approx. $202,000 total from (2) ESP tests, 3
rod pumps and 7 plunger lift systems.
o Incremental EUR’s are over 330 MMCF / well for the rod pumped wells
(3), and approx. 90 MMCF for the plunger lifted wells (7) on average*.
(*Note incremental production and EUR estimates are subject to judgemental factors).
While these methods also have operational challenges (especially with solids &
corrosive fluids on rod wells), aggressive conventional dewatering is successful at
improving well revenue and EUR. This is especially true taking non-flowing (loaded and
dead) Barnett wells and improving EUR’s in the 200-450 MMCF* range with rod pumps.
20
Conclusions & RecommendationsThis is the first comprehensive Barnett Shale project which provides a model for other
area operators, developing the link between: Rock characteristics, Fieldwide flowback,
flowing pressure and chlorides trends, and the effect of conventional & high-rate
dewatering on well performance. Republic Energy has had good success with their
dewatering program in terms of improving production and EUR, but economics of high-
rate dewatering are best supported by a + $3.00/mcf gas price environment, due to
associated costs of liquid handling and downhole challenges (especially rod and ESP).
The project had three objectives:
• Focus on improving gas recovery in wells that don’t have benefit of well-
connected natural fracture system.
• Characterizing mechanisms that control gas & water recovery in the reservoir at
the pore level – using reservoir core.
• Testing reservoir drawdown limits and effect of maximum water removal, known
as gas/water ‘Co-Production’ using Electric Submersible Pump (along w/ other lift
methods like plunger lift and rod pump).
These objectives were achieved using three separate phases: Laboratory, Flowing
Pressure Analysis, and Field Operations Design and Testing.
Barnett rock has an extremely tight matrix, often naturally fractured, and is not
(surprisingly) extremely water sensitive. It shares fracture and cleating characteristics
with some coals, and has an apparent tertiary production mechanism (methane
molecule desorption) at low reservoir pressure when properly dehydrated. Two
commercial products were shown to enhance loadwater recovery and gas permeability
recovery on core in the laboratory.
A sizeable percentage of Barnett wells suffer from liquid loading problems and poor
fracture dehydration. Analysis of fieldwide flowing pressures, flowback and produced
water trends, as well as chlorides trends show this to be the case. There is strong
evidence that the source of high liquids production is bounding Viola or Ellenberger
zones.
21
Aggressive and pro-active Co-Production dewatering improves wells that don’t behave
like a typical flowing, troublefree gas wells. Dewatering with rod pump has been shown
to improve EUR’s roughly 330 MMCF / well, and plunger lift 90 MMCF / well, on average
(for the 12 wells tested in this project)*.
High ESP-style drawdowns are required to properly remove water from high PI wells, to
liberate trapped gas as shown successful in other gas/water basins. Even with detailed
pre-planning, we encountered operational ESP problems and well tests were not
adequate to prove / disprove the concept of liberating trapped gas within pore spaces
and lowering reservoir pressure (at least in our two candidate wellbores). Gas was
recovered with this method, but in uneconomic proportions.
Recommendations
• Fracturing wells with clean freshwater appears non-damaging, but further
evaluation of alternatives high-volume (+1 MM gal.) waterfracs in marginal rock
quality areas is recommended.
• Field tests should be conducted with the two best-performing commercial
loadwater recovery additives, to enhance early-time fracture dehydration.
• In areas of marginal rock quality to be drilled or areas where far-field
communication (vertical & lateral) is suspected, operator should prepare to move
high water volumes very early in the life of the gas well to maximize EUR and
performance of the asset.
• The choice of dewatering method is best suited to a case-by-case basis,
regarding which artificial lift method performs best to maximize gas.
• Regarding ESP, the extreme approach of downhole sand-control combined with
“super sand pump” ESP is probably required for permanent installations with high
drawdowns. Economics of sand-control + variable-speed controlled ESP are
marginal at < $3.00 / mcf gas price.
22
AcknowledgmentsThanks to all personnel at Republic Energy, Inc. (Dallas, Texas) for allowing me the
opportunity to developed a project that will benefit not only Republic, but hopefully other
Shale Gas operators who are constantly trying to maximize production from
unconventional reservoirs. Thanks also to David Burnett (GPRI), Texas A&M, Dan Crow
and Jeff Knight of Centrilift, Mike Conway and Ron Himes of StimLab (Duncan, Ok.).
Thanks to Craig Barbour, Mike Murphy, Jim Sizemore and Julie Connor of Champion
Chemical (Healdton, OK.) for their expertise, as well as countless samples and data
points run in their lab and in the field. Thanks to the Texas Bureau of Economic Geology
for allowing access to Barnett core.
Thanks for the gracious support and funding from Joel Morrision of Penn State
University, the U.S. Dept. of Energy, and the entire Stripper Well Consortium for
supporting this integrated and ambitious project. Jason Lacewell, 817-946-7753,
References1. Lancaster, D.E., McKetta, S.F., Hill, R.E., Guidry, F.K. and J.E. Jochen. “Reservoir
evaluation, completion techniques, and recent results from Barnett Shaledevelopment in the Fort Worth Basin”, paper SPE 24884, Washington, D.C. 1992.
2. Willberg, D.M., Steinsberger, N., Hoover, R., Card, R.J. and J. Queen. “Optimizationof Fracture Cleanup Using Flowback Analysis”, paper SPE 39920, Denver, Co.,1998.
3. Siebrits, E., Elbel, J.L., Diyashev, I.R., Griffin, L.G., Demetrius, S.L., Davidson, B.M.,Steinsberger, N.P. and D.G. Hill. “Refracture reorientation enhances gas productionin Barnett Shale Tight Gas Wells”, paper SPE 63030, Dallas, Tx. 2000.
4. Hill, N.C. and D.E. Lancaster. “Reservoir characterization of the Clough Area,Barnett Shale, Wise County, Texas”, S.A. Holditch & Associates, Inc. Topical reportto the Gas Research Institute, July 1999.
5. Gidley, J.L., Holditch, S.A., Nierode, D.E. and R.W. Veatch. Recent Advances inHydraulic Fracturing, SPE Monograph series, Richardson, Tx. (1989) p. 46, 141,251.
6. Holditch, S.A.. “Factors affecting water blocking and gas flow from hydraulicallyfractured gas wells ”, paper SPE / AIME 7561, Houston, Tx. 1978.
7. Allen, T.O. and A.P. Roberts, Production Operations Volume 2, 4th Edition, OGCI,Tulsa, Ok. (1993) p. 6-3 through 6-8.
2
Table 1Sample List, Test Assignments and Groupings
Southern well 3" plugs cut vertically into slabbed core (Can't visually distinuish A-E zones on Lower) Well near Denton / Tarrant Co. border
Depths (top)
Depths (bottom)
Barnett Zone
Thin Sec Prep
Thin Sec Analysis XRD CST
Good Plugs
Additive Study
7107 7107 Upper X X X X 7119 7119 Forestburg X
7124.1 7124.3 Forestburg 7124.7 7124.9 Forestburg X
7128 7128 Forestburg X X X X 7135 7135 Forestburg X 7141 7141 Forestburg X X 7147 7147 Forestburg X 7154 7154 Lower X 7161 7161 Lower X 7168 7168 Lower 7177 7177 Lower X X X X 7184 7184 Lower X X 7188 7189 Lower X X 7197 7197 Lower X X 7201 7201 Lower X X 7210 7210 Lower X X 7218 7218 Lower X X 7222 7223 Lower X X X X
Northern Well 3" plugs cut as rotary sidewall plugs
Well approx. 18 mi. north of Southern Well Depths (top)
Barnett Zone Descript.
7349.5 Upper X X 7370 Upper X X X X
7374.5 Upper dense X X X 7710 Lower A did not recover 7720 Lower A hot GR in A X X X X 7860 Lower B mid B X X X X 7900 Lower C mid C X X X X 7937 Lower D normal D zone, no fault X X X b
7947 Lower D main fault D zone X X X X 8005 Lower E mineral filled fractures X X X 8023 Lower E small fault & central E X X X X 8055 Lower E another E lobe X X X 8071 Lower E open E fractures X X X X 8085 Viola karsted Viola (very top) X X X-N/C 8184 Viola karst breccia X X X X
a - combine samples to have enough material b - 7937 similar to 7947, CST on one and XRD on other for enough material
Two Tests
X a
7 Screening Tests
Performed with
Combined Samples
Two Tests
3
Table 2
Brine Formulations Used in CSTAnd Flow Studies
Table 3
Routine Air Permeability And He Porosity Analysisof Northern Well Rotary Sidewall Samples
Component 5,000 ppm5,000 ppm +
1% KCl 50,000 ppm 150,000 ppmNaCl 6.19 6.19 61.9 184.8CaCl2 - 2H2O 1.85 1.85 18.5 55.5
MgCl2 - 6H2O 0.77 0.77 7.7 23.1
KCl 0 10 0 0
Concentration (g/L)
Helium GrainSample Depth Porosity Air Klinkenberg Density
I.D. feet % md md g/cm
14 7370.0 * <0.001 <0.001 * Upper13 7374.5 * <0.001 <0.001 * Upper9 7900.0 * 0.005 0.002 2.46 Lower C7 7947.0 * <0.001 <0.001 * Lower D6 8005.0 * <0.001 <0.001 * Lower E - fractures?5 8023.0 3.4 0.010 0.004 2.50 Lower E4 8055.0 * <0.001 <0.001 * Lower E2 8085.0 4.7 0.103 0.081 3.03 Viola Fm. - Pyrite Clast
* unable to measure
Permeability (800psi)Lithology
4
Table 4
Capillary Suction Time (CST) Results
Blank Time Sample Depth (ft) Interval Fluid (no sample) (sec) CST Ratio 7107 Upper 150,000 ppm Brine 9.30 37.4 3.0
50,000 ppm Brine 8.40 26.2 2.1 5000 ppm + 1%KCl 8.20 26.7 2.3 5000 ppm Brine 8.20 27.9 2.4 Freshwater 8.10 29.6 2.7
7128 Forestburg 150,000 ppm Brine 12.20 39.2 2.2 50,000 ppm Brine 10.60 31.5 2.0 5000 ppm + 1%KCl 10.50 28.1 1.7 5000 ppm Brine 10.50 28.1 1.7 Freshwater 10.20 32.8 2.2
7177 Lower 150,000 ppm Brine 12.20 24.2 1.0 50,000 ppm Brine 10.60 29.0 1.7 5000 ppm + 1%KCl 10.50 26.1 1.5 5000 ppm Brine 10.50 16.0 0.5 Freshwater 10.20 29.8 1.9
7222/7223 Lower 150,000 ppm Brine 12.20 39.2 2.2 50,000 ppm Brine 10.60 28.2 1.7 5000 ppm + 1%KCl 10.50 19.6 0.9 5000 ppm Brine 10.50 24.0 1.3 Freshwater 10.20 25.1 1.5
Blank Time Sample Sample # Fluid (no sample) (sec) CST Ratio 7349.5/7370 Upper 150,000 ppm Brine 11.90 56.1 3.7
50,000 ppm Brine 10.70 48.3 3.5 5000 ppm + 1%KCl 9.70 39.3 3.1 5000 ppm Brine 9.70 51.1 4.3 Freshwater 9.60 54.5 4.7
7720 Lower A 150,000 ppm Brine 11.90 48.7 3.1 50,000 ppm Brine 10.70 49.6 3.6 5000 ppm + 1%KCl 9.70 41.8 3.3 5000 ppm Brine 9.70 38.1 2.9 Freshwater 9.60 39.2 3.1
7860 Lower B 150,000 ppm Brine 11.90 23.5 1.0 50,000 ppm Brine 10.70 21.5 1.0 5000 ppm + 1%KCl 9.70 23.8 1.5 5000 ppm Brine 9.70 19.9 1.1 Freshwater 9.60 18.3 0.9
7900 Lower C 150,000 ppm Brine 11.90 57.3 3.8 50,000 ppm Brine 10.70 55.3 4.2 5000 ppm + 1%KCl 9.70 48.9 4.0 5000 ppm Brine 9.70 43.2 3.5 Freshwater 9.60 85.2 7.9
7937 Lower D 150,000 ppm Brine 11.90 29.5 1.5 50,000 ppm Brine 10.70 22.1 1.1 5000 ppm + 1%KCl 9.70 21.2 1.2 5000 ppm Brine 9.70 20.0 1.1 Freshwater 9.60 28.4 2.0
8071 Lower E 150,000 ppm Brine 9.30 29.2 2.1 50,000 ppm Brine 8.40 24.2 1.9 5000 ppm + 1%KCl 8.20 19.3 1.4 5000 ppm Brine 8.20 22.8 1.8 Freshwater 8.10 24.1 2.0
8184 Viola 150,000 ppm Brine 11.90 24.1 1.0 50,000 ppm Brine 10.70 17.9 0.7 5000 ppm + 1%KCl 9.70 14.9 0.5
Northern Well
Southern Well
Treatment in
Pack Weight
Wet
Dried Pack
Weight
Pack Water
Remaining
Sw Estimate
From Control
Time to Max.
RecoveryTime to
Equivalent
Time to Max.
RecoveryKg
beforeKg
After Increase in
Sample 50000ppm Cl brine Supplier (g) (g) (g) (%)Control (min)
Recovery (min)
Treatment (min) (md) (md) Kg (%) Comment
.5gal/1000gal Plexsurf WRS-C Chemplex, Snyder, TX 28.2 N/A* 24.2 4691 4514 -3.772gal/1000gal Plexsurf WRS-C Chemplex, Snyder, TX 34.921 34.731 0.190 2.2 24.2 24.0 47.3 4514 5637 24.881gal/1000gal CESI Chemical LB-1327 CESI, Duncan, OK 35.318 34.894 0.425 5.0 31.2 28.0 29.2 3906 3981 1.921gal/1000gal CESI Chemical LB-1325 CESI, Duncan, OK 35.168 34.876 0.292 3.4 12.1 12.0 12.0 6938 6994 0.81 30-100 mesh1gal/1000gal Prosurf I plus American Energy Services 35.189 34.917 0.273 3.2 21.0 17.5 23.0 4496 4698 4.490.5gal/1000gal Prosurf II2gal/1000gal Inflo 45S BJ Services 31.939 31.763 0.177 2.1 29.2 40.0 46.3 6377 7009 9.912gal/1000gal Inflo 102 Experimiental BJ Services 35.298 34.728 0.570 6.7 49.4 N/A 44.3 8283 8160 -1.481gal/1000gal Cat-Foam** Clearwater, Inc., Pittsburgh, PA 33.175 33.010 0.165 1.9 31.3 N/A 37.2 6922 5509 -20.41 Foamed2gal/1000gal SSO-21M Halliburton Energy Services 36.503 34.750 1.753 20.6 32.3 N/A 27.2 6092 782.9 -87.15 Foamed2gal/1000gal Inflo 45S BJ Services 35.893 34.754 1.139 13.4 27.0 21.0 27.0 5740 6069 5.73Aborted and Repeated1gal/1000gal Prosurf I plus American Energy Services 35.593 34.040 1.554 18.3 20.2 N/A 15.1 7413 7316 -1.310.5gal/1000gal Prosurf II2gal/1000gal Inflo 45S BJ Services 35.688 34.894 0.794 9.3 10.1 12.0 14.1 5933 6288 5.98
1gal/1000gal Prosurf I plus American Energy Services 35.866 34.952 0.913 10.8 13.1 9.0 10.0 6224 6295 1.140.5gal/1000gal Prosurf II
1 gal/1000 gal Cudd RFF-1 Cudd Pumping Services 34.931 34.873 0.058 0.7 17.2 43.3 54.4 6039 6693 10.83 FoamedControl No Gas, Caswell 2 Lower 42.937 34.441 8.496 100.0Control After Gas, Caswell 2 Lower 36.391 34.697 1.693 19.9
*Did not reach equivalent permeability value**Primary product TR-A1 precipitated in brine, secondary product CatFoam usedBold = Best performing products upon testing
Gas Data
TABLE 5 - Chemicals To Aid Dewatering of Barnett ShaleFollowing Fracture Stimulation
Control
Nor
ther
n W
ell'
Low
er
A,B
Nor
ther
n W
ell'
Low
er C
,D,E
Sou
ther
n W
ell'
Low
er
Bar
nett
Viola Lime
Lower Barnett (220-700’ gross)
Upper Barnett (50-75’ gross ht.)
Figure 2 - Stratigraphic Column & Completion
Forestburg Lime
A
B
C
D
E members
Ellenberger
GR Trace0 150
Marble Falls Lime
5.5” csg.,2.375” tbg.
15 MI.
Basin MarginHigh-Liquidsareas
Current Barnett area
“Northern Well”Core
“Southern Well”Core
N
Figure 3 – Downhole corelocations & high liquids areas
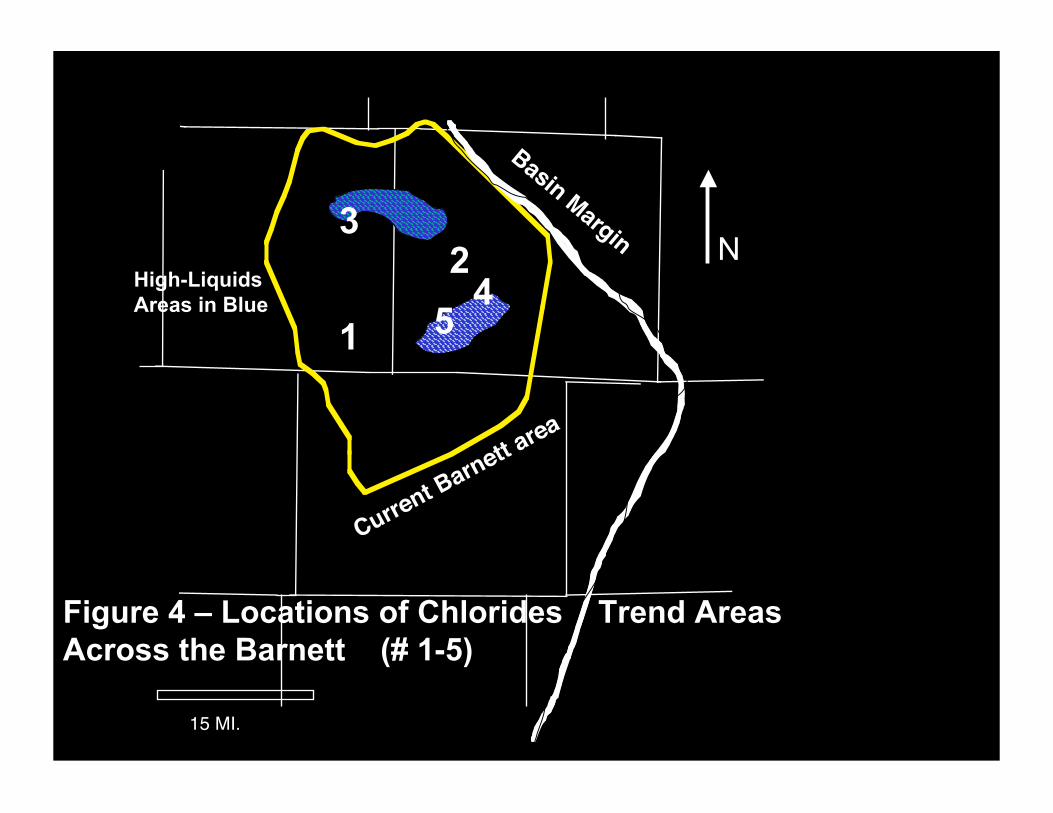
15 MI.
Basin MarginHigh-LiquidsAreas in Blue
Current Barnett area
N
Figure 4 – Locations of Chlorides Trend AreasAcross the Barnett (# 1-5)
32
5 14
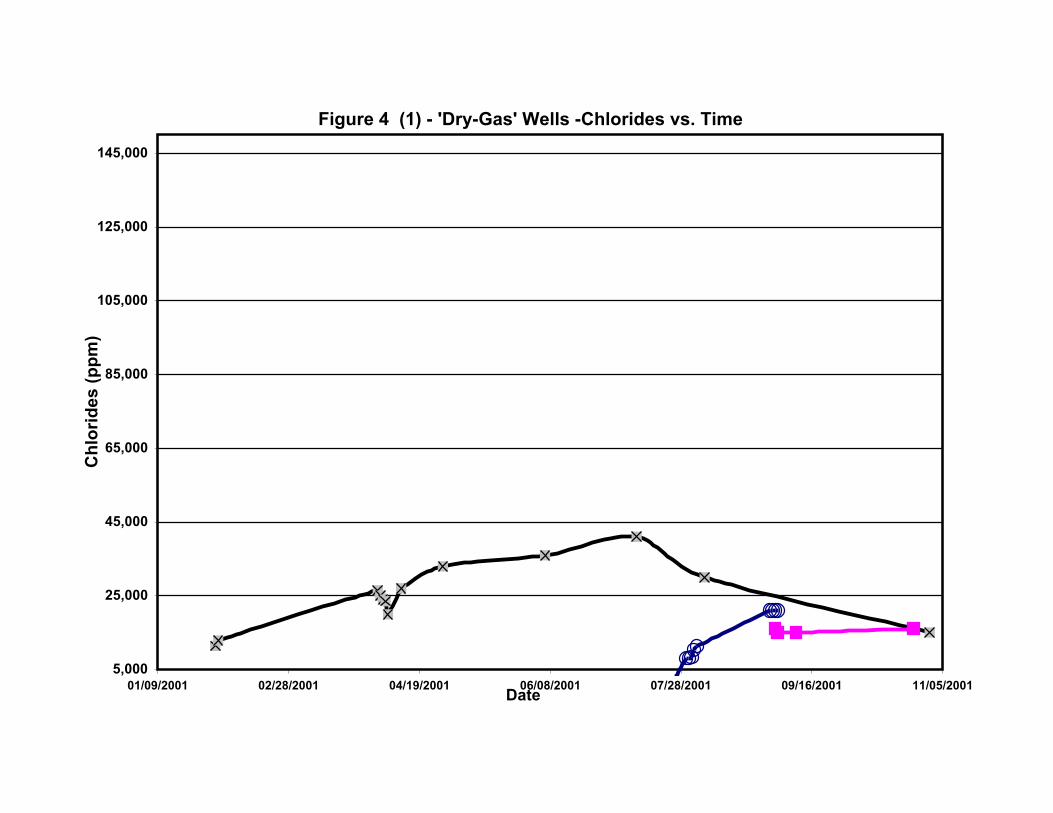
Figure 4 (1) - 'Dry-Gas' Wells -Chlorides vs. Time
5,000
25,000
45,000
65,000
85,000
105,000
125,000
145,000
01/09/2001 02/28/2001 04/19/2001 06/08/2001 07/28/2001 09/16/2001 11/05/2001Date
Ch
lori
des
(p
pm
)
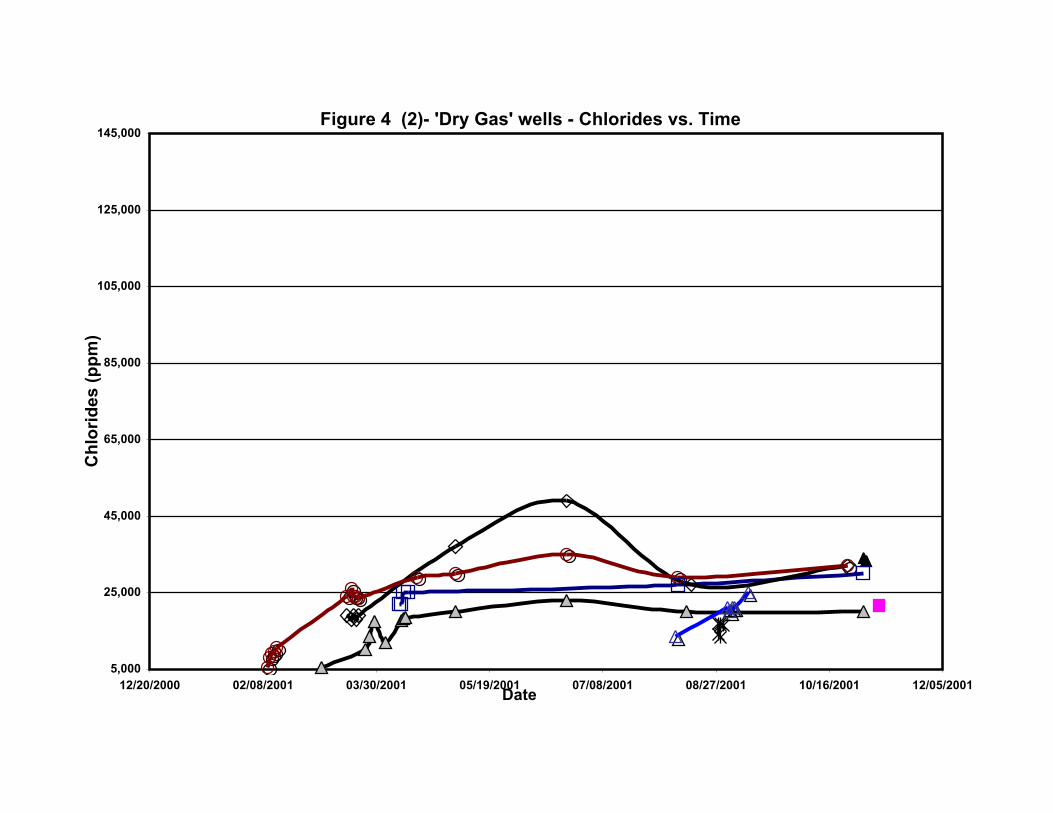
Figure 4 (2)- 'Dry Gas' wells - Chlorides vs. Time
5,000
25,000
45,000
65,000
85,000
105,000
125,000
145,000
12/20/2000 02/08/2001 03/30/2001 05/19/2001 07/08/2001 08/27/2001 10/16/2001 12/05/2001Date
Ch
lori
des
(p
pm
)
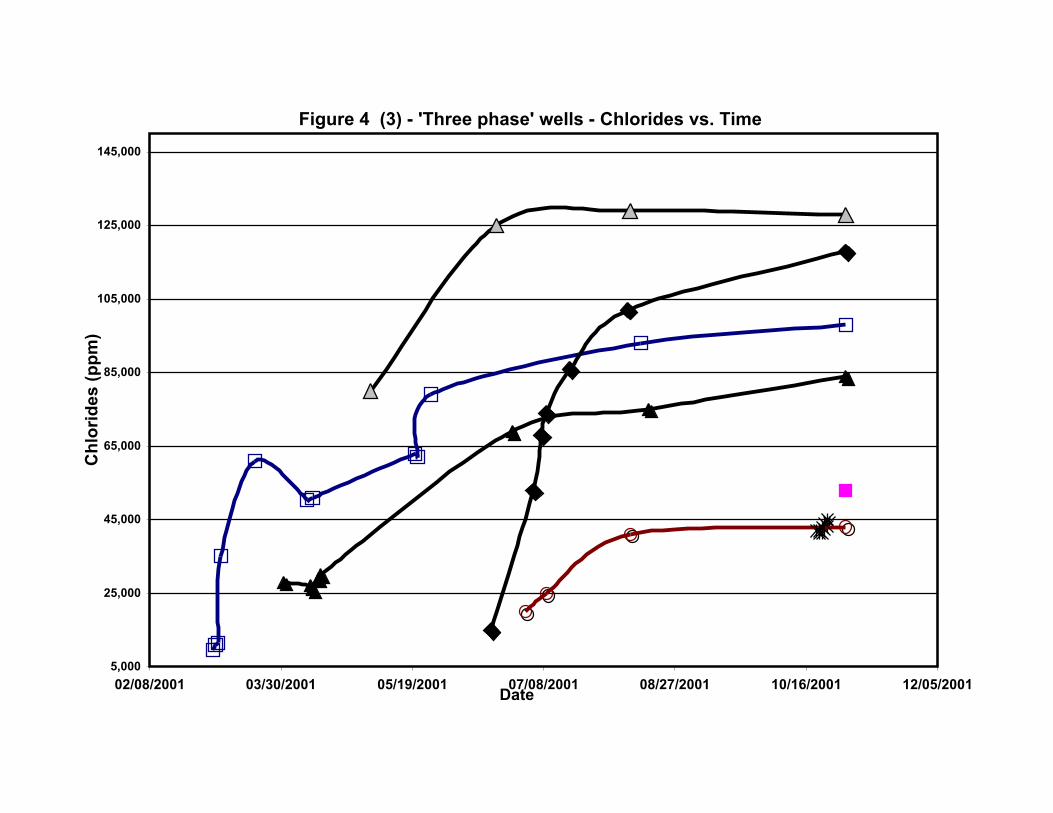
Figure 4 (3) - 'Three phase' wells - Chlorides vs. Time
5,000
25,000
45,000
65,000
85,000
105,000
125,000
145,000
02/08/2001 03/30/2001 05/19/2001 07/08/2001 08/27/2001 10/16/2001 12/05/2001Date
Ch
lori
des
(p
pm
)
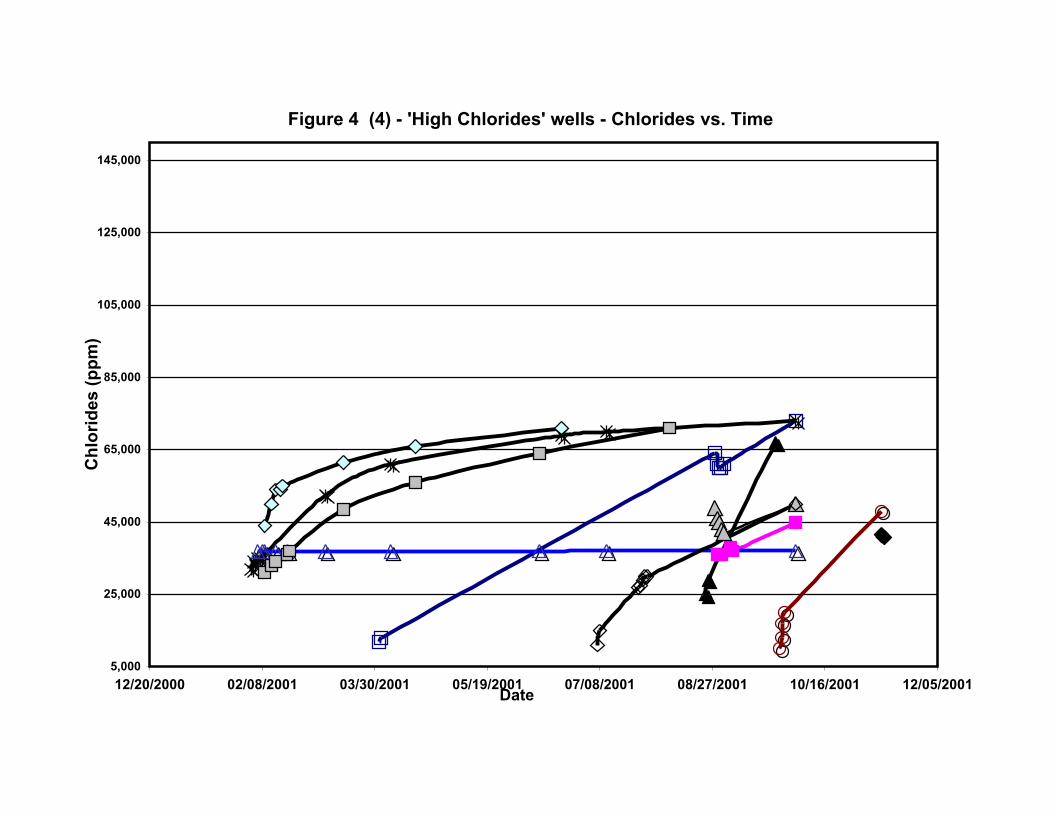
Figure 4 (4) - 'High Chlorides' wells - Chlorides vs. Time
5,000
25,000
45,000
65,000
85,000
105,000
125,000
145,000
12/20/2000 02/08/2001 03/30/2001 05/19/2001 07/08/2001 08/27/2001 10/16/2001 12/05/2001Date
Ch
lori
des
(p
pm
)
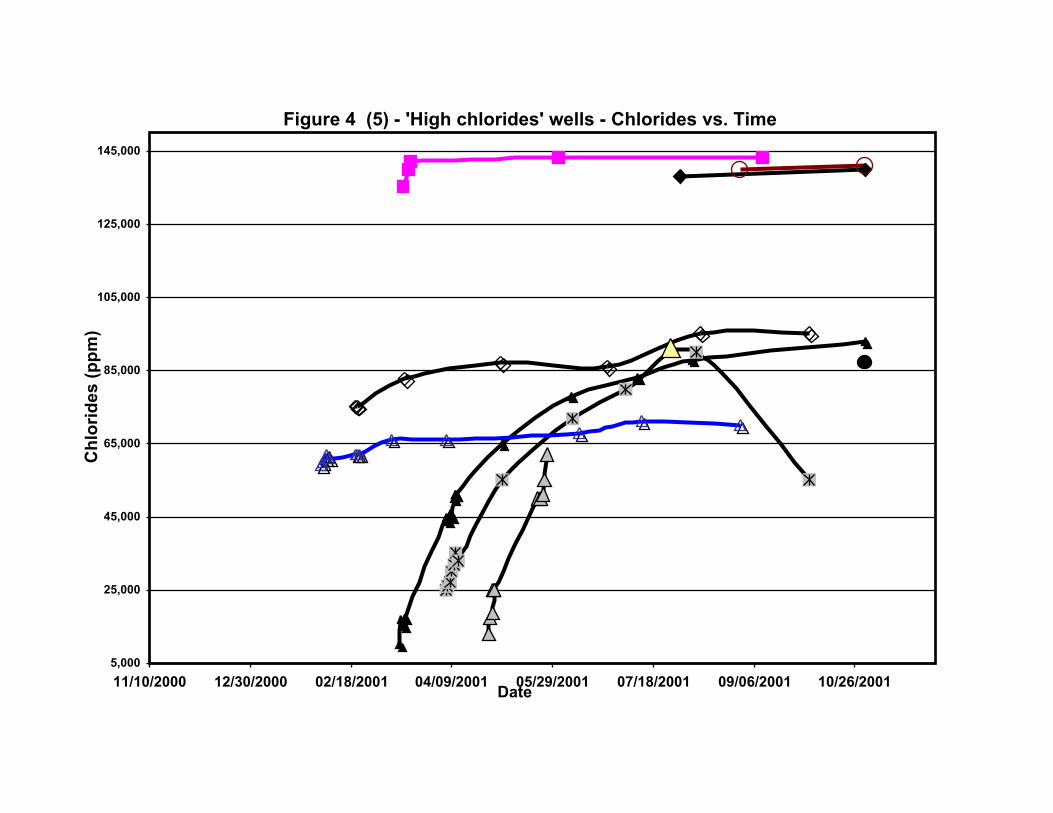
Figure 4 (5) - 'High chlorides' wells - Chlorides vs. Time
5,000
25,000
45,000
65,000
85,000
105,000
125,000
145,000
11/10/2000 12/30/2000 02/18/2001 04/09/2001 05/29/2001 07/18/2001 09/06/2001 10/26/2001Date
Ch
lori
des
(p
pm
)
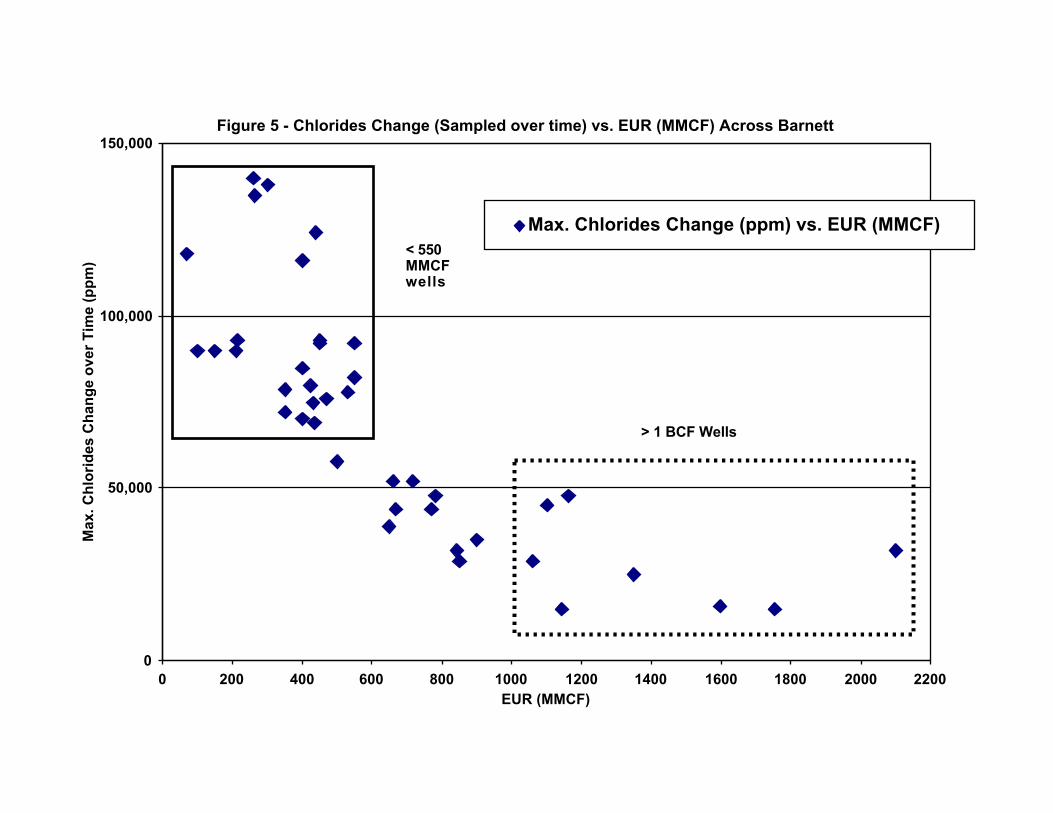
Figure 5 - Chlorides Change (Sampled over time) vs. EUR (MMCF) Across Barnett
0
50,000
100,000
150,000
0 200 400 600 800 1000 1200 1400 1600 1800 2000 2200EUR (MMCF)
Max
. Ch
lori
des
Ch
ang
e o
ver
Tim
e (p
pm
)
Max. Chlorides Change (ppm) vs. EUR (MMCF)
> 1 BCF Wells
< 550 MMCF wells
Viola Lime
Lower Barnett Shale
Forestburg Lime
Upper Barnett Shale
Figure 10 - ESP Co-Production,Testing Dewatering Below-Perfs
GasBreakout inCsg. duringDewatering
Disposal Zone for 15-30,000 bblof Fracture Dewatering
Viola Lime
Lower Barnett Shale
Forestburg Lime
Upper Barnett Shale
Possible Uphole Disposal Zone
Possible Uphole Disposal Zone
Figure 11 - ESP Co-Production UsingDownhole Dewatering –After Successful Test of SurfaceCo-Production
GasBreakout inCsg. duringDewatering
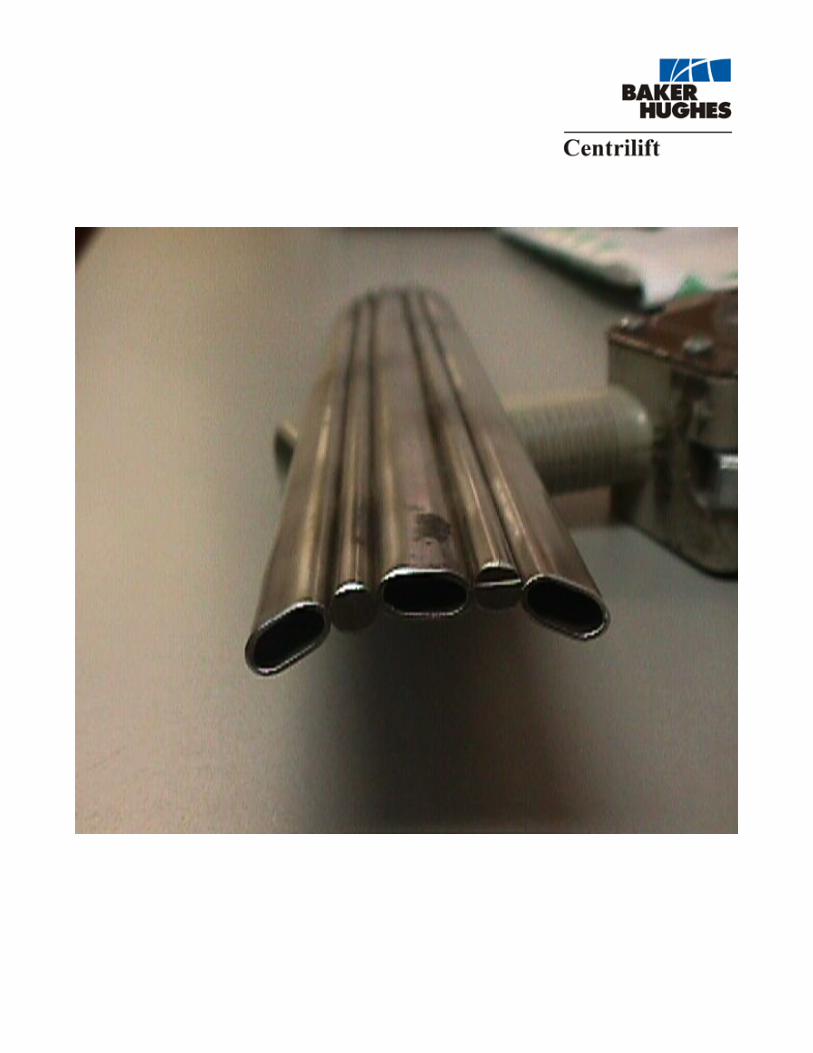
PRODUCTION ZONE FIGURE 12 –
RECIRCULATIONPUMP
APPLICATIONPATENTED
PUMP•SIZE LIKE A NORMAL INSTALLATION•STANDARD OPTIONS CAN BE USED
RECIRCULATION SYSTEM•INTAKE FOR BOTH PUMPS
SEAL•CONVENTIONAL
MOTOR
RECIRCULATION TUBE
TUBING CLAMP
Recirculation Pump System used to:
• maximize well drawdown
• minimize gas interference
• improve motor cooling in low volume wells
• provide an alternative to slim line equipment
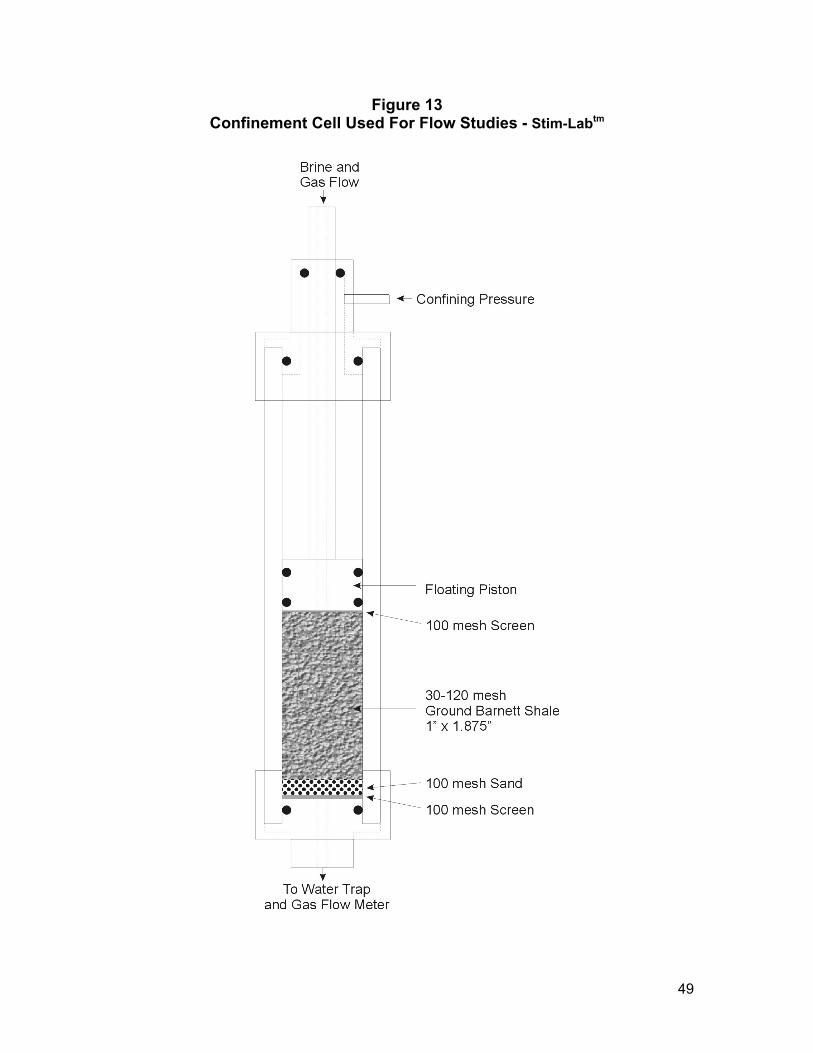
49
Figure 13Confinement Cell Used For Flow Studies - Stim-Labtm
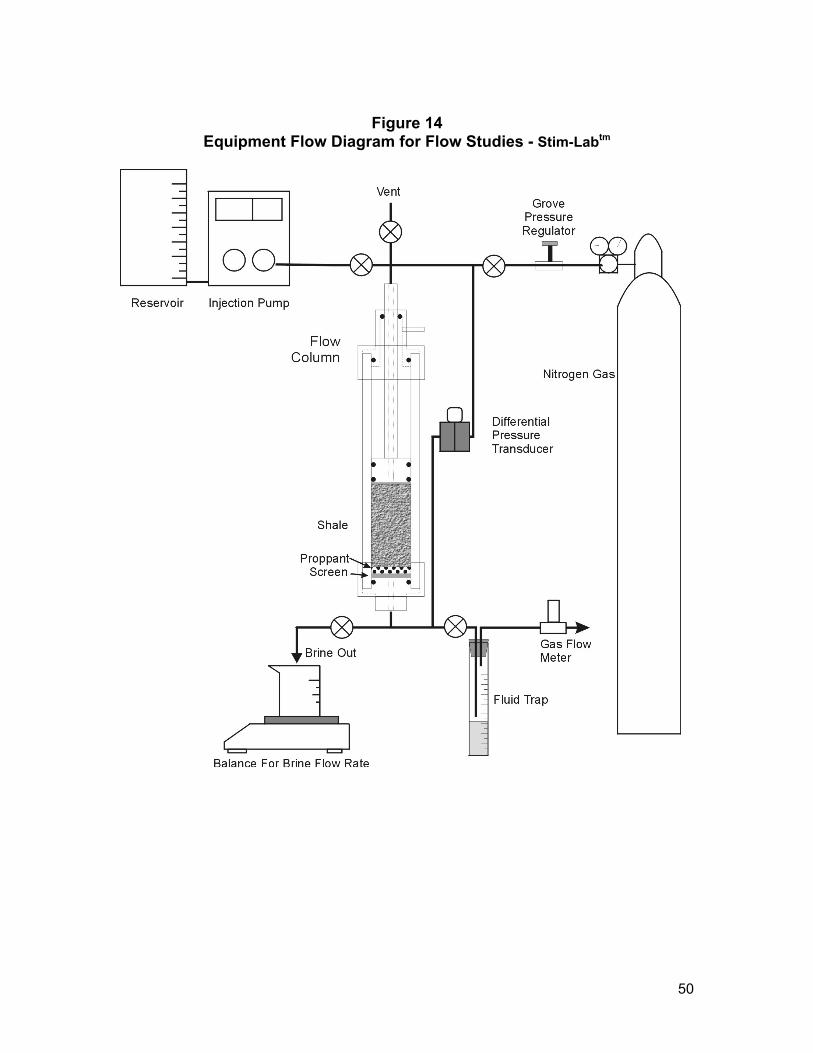
50
Figure 14Equipment Flow Diagram for Flow Studies - Stim-Labtm
46
Appendix I
Capillary Suction Time Tests
Capillary suction time (CST) tests are performed using the Fann model 44000 CST
timer. CST tests measure the retention of fluid by a slurry of the ground formation rock
in the fluid to be evaluated. The slurry is placed in a funnel atop a chromatography
paper. The timer measures the time for the fluid to be extracted from the slurry by
adsorption into the chromatography paper. Sensors start the timer when the fluid
reaches approximately 0.25" from the funnel and stop the timer at a distance of 1" from
the funnel. Fluids that disperse clays in the formation slurry form a clay colloid (mud),
which resists extraction of the fluid, and give long CST times. Fluids that do not form a
colloid are easily extracted and give short CST times. A correction is made in the
measurement for the viscosity of the fluid and fluid/paper interactions for comparison of
fluids with the same core material. This is done by measuring the time for the fluid alone
without formation material to be adsorbed. This is called the blank time. Three CST
times are measured for each rock/fluid combination and averaged. The data is
presented as a ratio of the CST time minus the blank time divided by the blank time.
High CST ratios indicate increased colloid formation and more potential formation
damage. Value differences for CST ratio of less than about 0.5 are usually within
experimental error and are not considered significant. Magnitude of the value for CST
ratio will vary depending on grain size distribution, and the amount of clay and silt within
the rock sample. Therefore, the values cannot be compared between rock samples
except in relative terms to two control fluids. These are usually a high saline solution,
such as 6% KCl, and freshwater.
Formation samples are prepared by crushing the rock to less than 70 mesh in size. The
crushed rock is then mixed with the fluid to be tested at a ratio of 1 gram to 20 ml. The
slurry is mixed rapidly for 15 -20 minutes. A 5 ml portion of the slurry is extracted and
placed into the CST funnel with a new sheet of paper. The CST time is recorded and
the measurement made two more times with fresh paper for each measurement. The
times are averaged. A blank time is measured for each fluid in triplicate for each box of
chromatography paper. The blank time is then used in the calculation of the CST ratio.
47
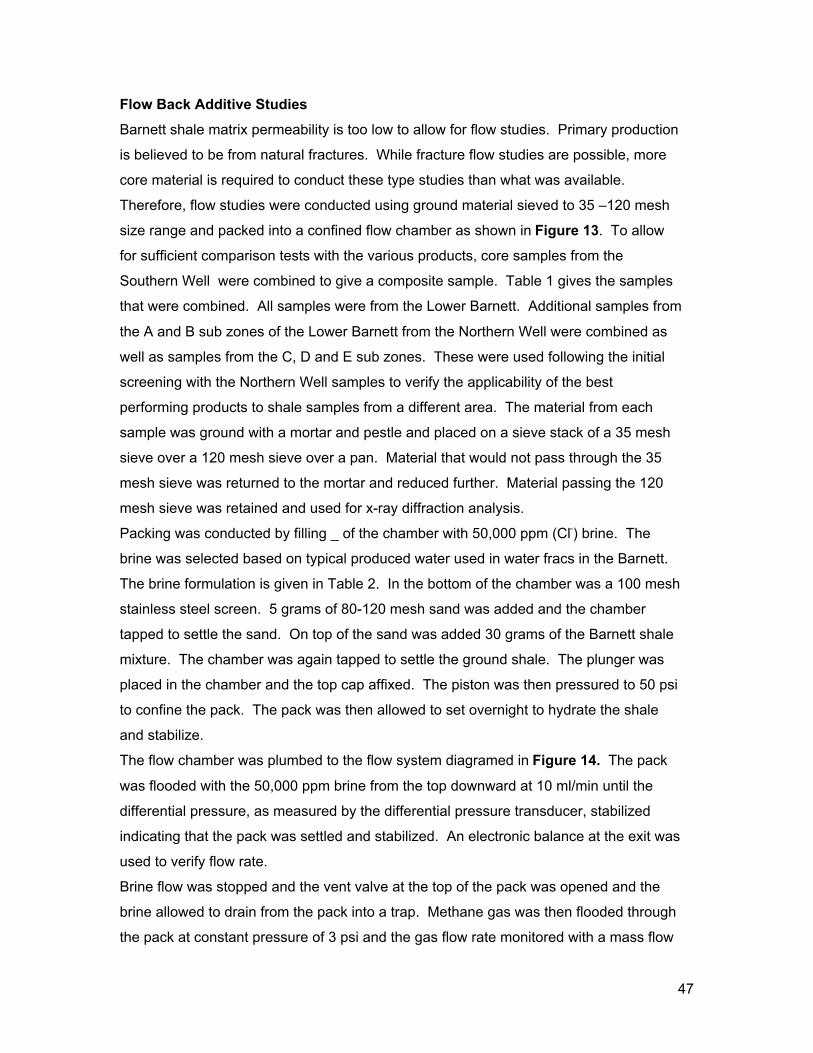
Flow Back Additive Studies
Barnett shale matrix permeability is too low to allow for flow studies. Primary production
is believed to be from natural fractures. While fracture flow studies are possible, more
core material is required to conduct these type studies than what was available.
Therefore, flow studies were conducted using ground material sieved to 35 –120 mesh
size range and packed into a confined flow chamber as shown in Figure 13. To allow
for sufficient comparison tests with the various products, core samples from the
Southern Well were combined to give a composite sample. Table 1 gives the samples
that were combined. All samples were from the Lower Barnett. Additional samples from
the A and B sub zones of the Lower Barnett from the Northern Well were combined as
well as samples from the C, D and E sub zones. These were used following the initial
screening with the Northern Well samples to verify the applicability of the best
performing products to shale samples from a different area. The material from each
sample was ground with a mortar and pestle and placed on a sieve stack of a 35 mesh
sieve over a 120 mesh sieve over a pan. Material that would not pass through the 35
mesh sieve was returned to the mortar and reduced further. Material passing the 120
mesh sieve was retained and used for x-ray diffraction analysis.
Packing was conducted by filling _ of the chamber with 50,000 ppm (Cl-) brine. The
brine was selected based on typical produced water used in water fracs in the Barnett.
The brine formulation is given in Table 2. In the bottom of the chamber was a 100 mesh
stainless steel screen. 5 grams of 80-120 mesh sand was added and the chamber
tapped to settle the sand. On top of the sand was added 30 grams of the Barnett shale
mixture. The chamber was again tapped to settle the ground shale. The plunger was
placed in the chamber and the top cap affixed. The piston was then pressured to 50 psi
to confine the pack. The pack was then allowed to set overnight to hydrate the shale
and stabilize.
The flow chamber was plumbed to the flow system diagramed in Figure 14. The pack
was flooded with the 50,000 ppm brine from the top downward at 10 ml/min until the
differential pressure, as measured by the differential pressure transducer, stabilized
indicating that the pack was settled and stabilized. An electronic balance at the exit was
used to verify flow rate.
Brine flow was stopped and the vent valve at the top of the pack was opened and the
brine allowed to drain from the pack into a trap. Methane gas was then flooded through
the pack at constant pressure of 3 psi and the gas flow rate monitored with a mass flow
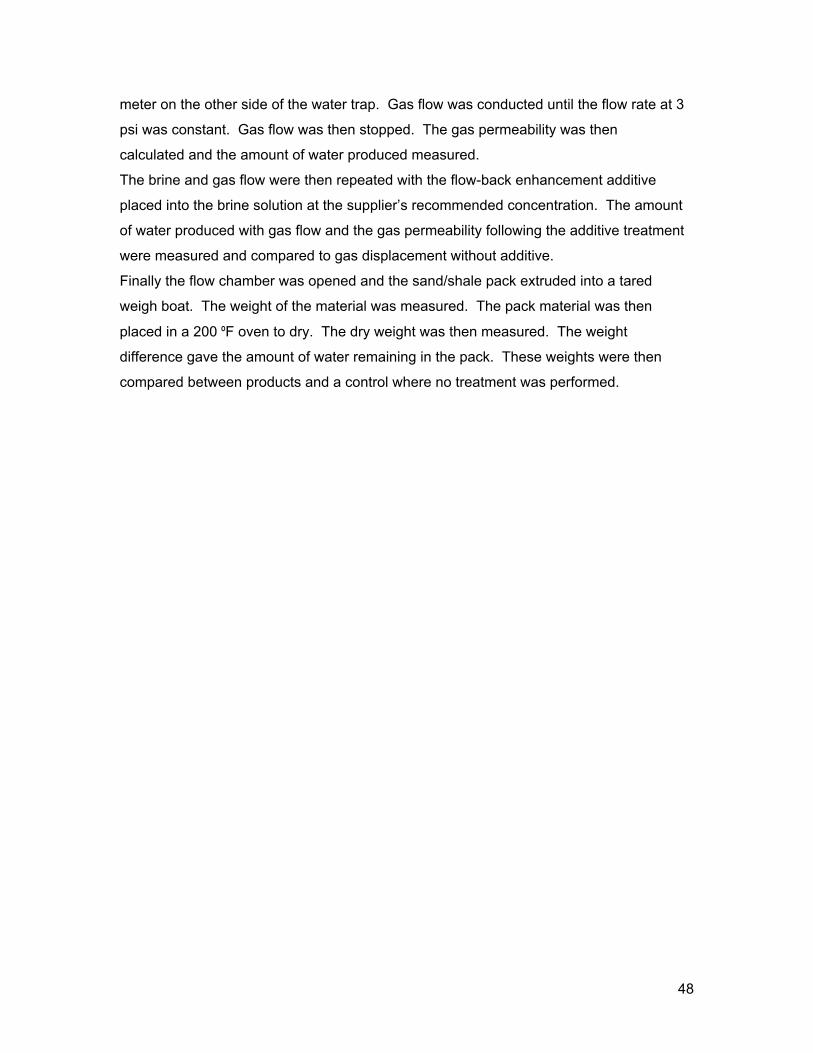
48
meter on the other side of the water trap. Gas flow was conducted until the flow rate at 3
psi was constant. Gas flow was then stopped. The gas permeability was then
calculated and the amount of water produced measured.
The brine and gas flow were then repeated with the flow-back enhancement additive
placed into the brine solution at the supplier’s recommended concentration. The amount
of water produced with gas flow and the gas permeability following the additive treatment
were measured and compared to gas displacement without additive.
Finally the flow chamber was opened and the sand/shale pack extruded into a tared
weigh boat. The weight of the material was measured. The pack material was then
placed in a 200 ºF oven to dry. The dry weight was then measured. The weight
difference gave the amount of water remaining in the pack. These weights were then
compared between products and a control where no treatment was performed.
Recommended