Embed Size (px)
Citation preview
Louisiana State UniversityLSU Digital Commons
LSU Master's Theses Graduate School
4-8-2019
Picture Cued and Speech Production CuedApproaches for Speech Sound LearningMichelyve C. PetitLouisiana State University and Agricultural and Mechanical College, [email protected]
Follow this and additional works at: https://digitalcommons.lsu.edu/gradschool_theses
Part of the Speech and Hearing Science Commons, and the Speech Pathology and AudiologyCommons
This Thesis is brought to you for free and open access by the Graduate School at LSU Digital Commons. It has been accepted for inclusion in LSUMaster's Theses by an authorized graduate school editor of LSU Digital Commons. For more information, please contact [email protected].
Recommended CitationPetit, Michelyve C., "Picture Cued and Speech Production Cued Approaches for Speech Sound Learning" (2019). LSU Master'sTheses. 4934.https://digitalcommons.lsu.edu/gradschool_theses/4934
PICTURE CUED AND SPEECH PRODUCTION CUED APPROACHES FOR SPEECH
SOUND LEARNING
A Thesis
Submitted to the Graduate Faculty of the
Louisiana State University and
Agricultural and Mechanical College
in partial fulfillment of the
requirements for the degree of
Master of Arts
in
The Department of Communication Sciences and Disorders
by
Michelyve Petit
B.S., Drexel University, 2014
May 2019
ii
ACKNOWLEDGEMENTS
I want to first thank God for providing me with all that I needed to complete this thesis. I am grateful beyond
measure to serve You and proclaim Your faithfulness. Thank You for grace and more grace from start to finish.
To the Department of Communication Sciences and Disorders, thank you for my thorough preparation and guidance
these past three years; I am humbled to have grown and blossomed in what is an enriching and nurturing
department.
To Louisiana Key Academy, thank you for creating a space for this project and allowing Dr. Norris and I to work
with your bright students. To the principal, school founders, teachers, and speech pathologists, it was truly a joy to
become a part of your educational team and I look forward to watching LKA flourish.
To Mrs. Wheeler and the graduate clinicians implementing treatment, thank you for your support and patience. I am
grateful for your hard work which brought this project to life.
To my thesis committee members, Dr. Hoffman and Dr. Chung, thank you. You both provided me with direction
and insight within your respective areas of expertise that helped to make this project comprehensive. It could not
have been done without you.
To my mom, dad, sisters, and brothers, I am eternally grateful to have you as my support group. Mama, you have
been my inspiration and motivation to do the right thing and try my hardest. For this and so much more, I love you
and thank you. Dad, your words of grace and wisdom were warmly received and encouraged me on the hard days,
thank you for being the best dad in the world!
To my amazing friends, Rochelle Young, Rebecca Dorsa, Ariel Johnson, “Yeni,” Tyjuan Bovie, Sidney Morgan,
and all who were steadfast in encouraging and motivating me, thank you.
Lastly, to Dr. Norris, I was overjoyed and nervous when you agreed to be my thesis advisor. My nerves quickly
dissipated as your patience, care, and understanding assured me that we were undertaking a worthy project. Working
alongside you has been the highlight of my time at LSU. I learned about not only speech-language pathology,
intervention, and research, but also the beauty of balance. Balance is not only what is seen when matters are level,
but in the preceding flexibility needed to restore and maintain balance. I have watched you do this with skill,
intellect, and wit! I am honored to call myself your student and sincerely thank you for all that you have taught me.
iii
TABLE OF CONTENTS
ACKNOWLEDGEMENTS………………………………………………………………………………………..…..ii
LIST OF TABLES ………….……………....………….……………………………………......................................iv
LIST OF FIGURES …….………………..……………………………………………………....................................v
ABSTRACT………..….….…………………………………………………………….……………………………..vi
CHAPTER 1. LITERATURE REVIEW ………………………………………………………………..…..........…...1
Speech Sound Disorders and Reading…………………….………………..…….….……….……………….….2
Dyslexia, SSD, and Phonological Awareness………….………………………..…….….....…………………...3
Phonological Representations………………..……………….…………............................................………….6
Interventions for Phonological Awareness and Articulation.……………..…….........................................…….8
Concrete Visual Representations………………….……….……………………………………….…………….9
Acoustic Characteristics of R and S……………………..……………………….……………..………...…….15
Acoustic Analysis……………………………………………………………………………………………….16
Questions of the Study……………………………………………………….………..………………….….….17
CHAPTER 2. METHODS……………..…………..…………………………..…………………….……...….....….18
Participants………………..……………………………………………………………………………….........18
Test Instruments………….………………………………………….………………………...…....……..........19
CHAPTER 3. MATERIALS………………………………………………………………………………………….21
Alternating Treatment Design…………………………………………..………………………………………22
Feedback/ Hierarchy Prompt……………………………………………………………………………………25
CHAPTER 4. PROCEDURE……….……………..…………………….………………………....………….......….27
MPF Card Procedure…………………………………………………………………………………………….28
Plain Picture Procedure…………………………………………...………………..……………………………30
Data Analysis Procedure………………………………………………………………………………………...32
Analyzing Question Outcomes…….………………………………………………………………………….…33
CHAPTER 5. RESULTS…………..……………...………………………………………..……….……….……….35
Question 1……………………………………………………………………………………………………..35
Question 2………….…………………….………………………………………………………..……….….41
Question 3……….……………….…………………………………………………………………………....42
Question 4……….…………….……………………………………………………………………..…….….44
CHAPTER 6. DISCUSSION………………...……………………………………...…..……………………………47
Limitations………………..……….………………………………………………....................…..…………50
CHAPTER 7. FUTURE STUDIES………………………………………………………………………………..…53
Concluding remarks……………....………………………………………………………………..…….…..54
CHAPTER 8. REFERENCES………….…………………………………………….………………………..……..55
APPENDIX. SCRIPTS FOR LANGUAGE ELICITATION TASK…………….…...………………………..…..…61
VITA…………………………………………………….…………………………..………………………..………62
iv
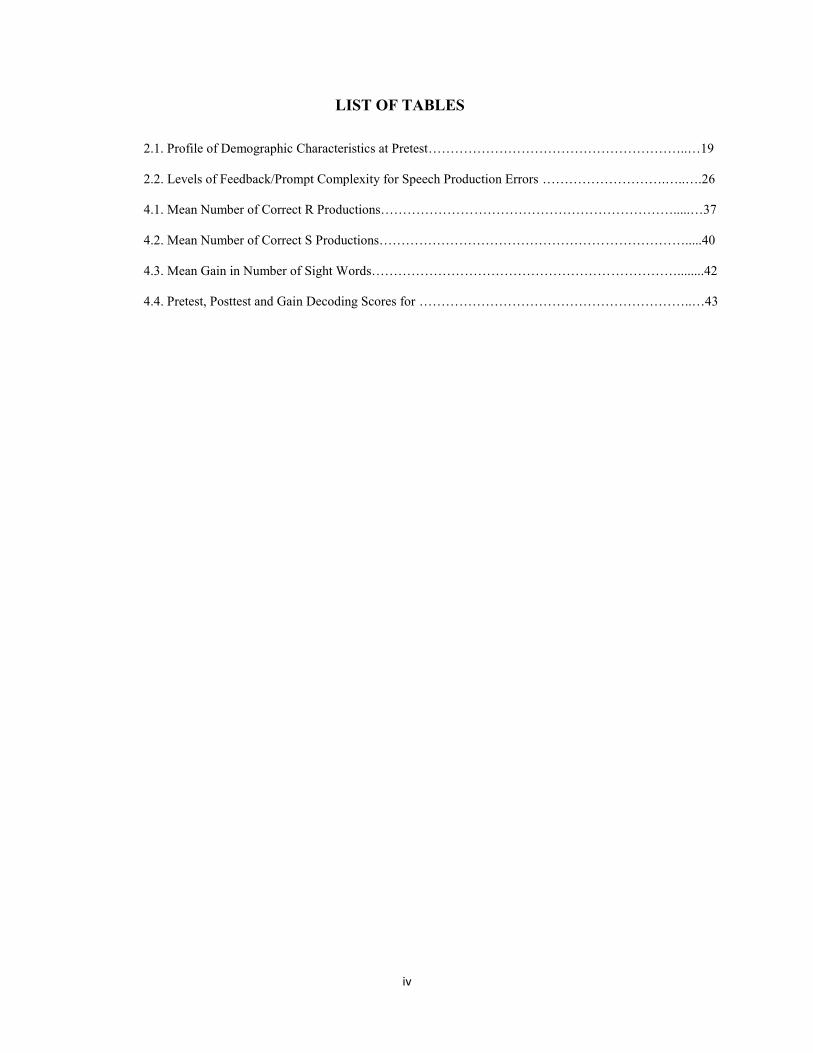
LIST OF TABLES
2.1. Profile of Demographic Characteristics at Pretest…………………………………………………..…19
2.2. Levels of Feedback/Prompt Complexity for Speech Production Errors ……………………….…..….26
4.1. Mean Number of Correct R Productions………………………………………………………….....…37
4.2. Mean Number of Correct S Productions…………………………………………………………….....40
4.3. Mean Gain in Number of Sight Words……………………………………………………………........42
4.4. Pretest, Posttest and Gain Decoding Scores for ……………………………………………………..…43
v
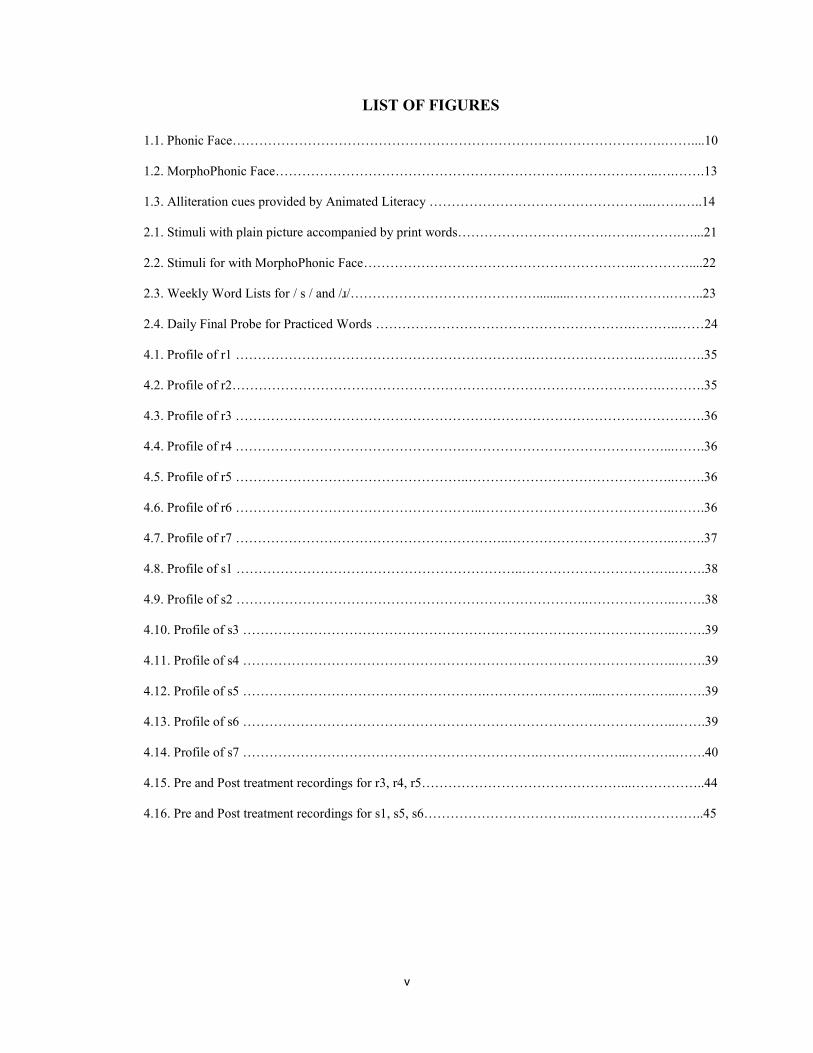
LIST OF FIGURES
1.1. Phonic Face……………………………………………………………….…………………….……....10
1.2. MorphoPhonic Face………………………………………………………….………………..….…….13
1.3. Alliteration cues provided by Animated Literacy …………………………………………...…….…..14
2.1. Stimuli with plain picture accompanied by print words…………………………….…….……….…...21
2.2. Stimuli for with MorphoPhonic Face……………………………………………………..…………....22
2.3. Weekly Word Lists for / s / and /ɹ/……………………………………..........………….……….……..23
2.4. Daily Final Probe for Practiced Words ………………………………………………….………..……24
4.1. Profile of r1 ………………………………………………………….…………………….……..…….35
4.2. Profile of r2…………………………………………………………………………………….……….35
4.3. Profile of r3 …………………………………………………………………………………………….36
4.4. Profile of r4 …………………………………………….………………………………………...…….36
4.5. Profile of r5 ……………………………………………..………………………………………..…….36
4.6. Profile of r6 ………………………………………………..……………………………………..…….36
4.7. Profile of r7 ……………………………………………………..………………………………..…….37
4.8. Profile of s1 ………………………………………………………..……………………………..…….38
4.9. Profile of s2 ……………………………………………………………………..………………..…….38
4.10. Profile of s3 ……………………………………………………………………………………..…….39
4.11. Profile of s4 ……………………………………………………………………………………..…….39
4.12. Profile of s5 ……………………………………………….……………………...……………..…….39
4.13. Profile of s6 ……………………………………………………………………………………..…….39
4.14. Profile of s7 ………………………………………………………….………………...………..…….40
4.15. Pre and Post treatment recordings for r3, r4, r5………………………………………...……………..44
4.16. Pre and Post treatment recordings for s1, s5, s6……………………………..………………………..45
vi
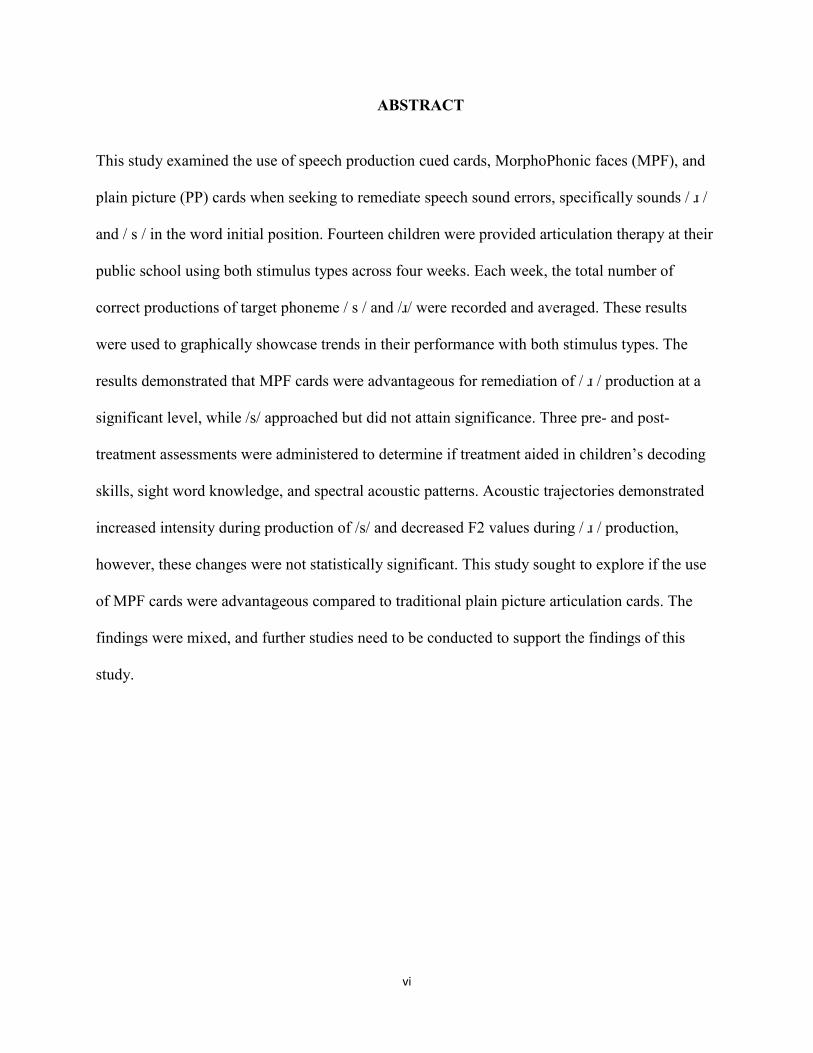
ABSTRACT
This study examined the use of speech production cued cards, MorphoPhonic faces (MPF), and
plain picture (PP) cards when seeking to remediate speech sound errors, specifically sounds / ɹ /
and / s / in the word initial position. Fourteen children were provided articulation therapy at their
public school using both stimulus types across four weeks. Each week, the total number of
correct productions of target phoneme / s / and /ɹ/ were recorded and averaged. These results
were used to graphically showcase trends in their performance with both stimulus types. The
results demonstrated that MPF cards were advantageous for remediation of / ɹ / production at a
significant level, while /s/ approached but did not attain significance. Three pre- and post-
treatment assessments were administered to determine if treatment aided in children’s decoding
skills, sight word knowledge, and spectral acoustic patterns. Acoustic trajectories demonstrated
increased intensity during production of /s/ and decreased F2 values during / ɹ / production,
however, these changes were not statistically significant. This study sought to explore if the use
of MPF cards were advantageous compared to traditional plain picture articulation cards. The
findings were mixed, and further studies need to be conducted to support the findings of this
study.
1
CHAPTER 1. LITERATURE REVIEW
There is a strong relationship between speech sound disorders (SSD) and reading
disabilities. Children with SSD at preschool are more likely to have difficulty learning to read,
and if a comorbid language disorder is present, the reading deficits may persist into adulthood
(Conti-Ramsden, Botting, & Faragher, 2001; Lewis & Freebairn, 1992). Speech sound disorders
manifest early as difficulty with phonemic awareness (Raitano, Pennington, Tunick, Boada, &
Shriberg, 2004) and are predictive of continuing difficulty with both decoding and reading
fluency (Durand, Loe, Yeatman, & Feldman, 2013). However, the relationship between speech
sound disorders and reading deficits is complex, with only a moderate correlation between SSD
and reading difficulties, which has initiated research to explore subtypes of SSD.
Discovery of subtypes may lead to greater ability to predict, assess and treat SSD
subtypes that negatively impact reading. It has been shown that typical speech-language
intervention has no effect on literacy (Gillon & Dodd, 1995; Justice, 2006). However,
phonological awareness training has been shown to benefit early reading and speech production
(Denne, Langdown, Pring & Roy, 2005), suggesting that literacy instruction can benefit speech
as well. This study will examine changes in speech sound production for children with dyslexia
when presented speech production cues (i.e., printed letters representing articulators within a
face), thus linking speech sounds directly to reading. Our first prediction that these speech
production cues will improve speech production. Our second prediction is that the presentation
of articulation stimuli in groups of either short vowel words (CVC or CVCC spelling patterns) or
long vowel words (CVVC or CVCe spelling patterns) will result in improvements in decoding
these patterns. The third prediction is that sight word recognition of words in which the spelling
and meaning are superimposed in the pictures will result in sight word learning for target words.
2
The fourth and final prediction is that changes in production perceived by a listener will generate
positive acoustic change shown in spectrographic analysis.
Speech Sound Disorders and Reading
Three decades of research have consistently shown a relationship between SSD and
reading difficulties. One body of literature showed that those with reading disabilities are likely
to have a history of or current SSD. Bird, Bishop, and Freeman (1995) compared children with
SSD with and without comorbid language disorders to typically developing peers. Both groups
of SSD children performed below controls on phonological awareness, as well as reading and
writing non-words and real words. The children with more severe SSD at school entry were of
particular risk. The researchers suggested articulation and reading problems may both arise from
poor ability to analyze syllables into smaller phonological units. Lewis and Freebairn (1992)
used a cross-sectional design to examine individuals with a history of preschool SSD at
preschool, grade school, adolescence and adulthood. At all age levels, those with a history of
SSD performed more poorly than peers on measures of phonology, reading and spelling. Those
with a history of comorbid language disorders performed more poorly than SSD alone. More
recently, Gallagher, Frith and Snowling (2003) found that of children with a family history of
dyslexia. 57% showed reading problems in first grade as well as significantly slower speech and
language development. The severity of the speech and language delay predicted individual
differences in reading development. Other studies report similar findings linking SSD to reading
disabilities (Bishop & Adams, 1990; Catts, 1993; Larrivee & Catts, 1999).
Longitudinal studies have shown that children with SSD are at-risk for reading
disabilities. Scarborough (1990) found that both delays in syntactic and speech sound
development at 30 months were prevalent in children with later reading disabilities. However,
3
receptive (speech discrimination) skills were not impaired, consistent with the findings of Mann
and Ditunno (1990) and arguing against the proposal that both are caused by an incomplete or
distorted perception of language input. Stothard, Snowling, Bishop, Chipchase, and Kaplan
(1998) followed up at adolescence on children who had speech and language delays at
kindergarten. Those whose speech and language problems had resolved were similar to peers on
vocabulary and language comprehension but performed significantly worse on phonological
processing (non-word reading, spoonerisms) and word reading and spelling. Those with
persistent speech and language problems performed poorly on all measures of oral and written
language.
Overby et al. (2012) found that 25% of children with SSD only in kindergarten showed
poor reading in first-second grade, even though vocabulary skills were average. Of those with
comorbid language impairment, 66% showed reading problems. Leitao and Fletcher (2004)
measured phonological processing and literacy skills of children with SSD from age 5-6 to 12-
13. During the first three years of school, children with SSD showed developmental and non-
developmental speech errors, weaker phonological awareness, and delayed development of
reading accuracy and spelling. By the end of primary school, they continued to show difficulty
with reading and spelling, particularly those with non-developmental speech errors. The
researchers suggested that weak phonological representations underlie both SSD and reading
deficits.
Dyslexia, SSD, and Phonological Awareness
Dyslexia is a specific learning disability, with a prevalence ranging from 5-10 percent
making it the most common subtype of learning disabilities. The reading deficit is
neurobiologicaI in origin and inconsistent with other cognitive abilities, resulting in persistent
4
difficulties despite adequate cognitive abilities and the provision of effective instruction.
Dyslexia affects accurate and/or fluent word recognition, spelling and decoding abilities. Over
time, poor reading may lead to secondary consequences including difficulty with reading
comprehension, poor vocabulary growth and limitations in the acquisition of background
knowledge, further exacerbating the core problem. The core difficulties are believed to result
from a deficit in the phonological component of language with a phonological awareness deficit
considered the hallmark difficulty (Lyon, Shaywitz & Shaywitz, 2003).
Several studies have shown that children with SSD are at-risk for poor phonological
awareness abilities at school age. Rvachew, Chiang, and Evans (2007) looked at types of speech
sound errors and phonological awareness skills at prekindergarten and kindergarten. No specific
pattern of errors predicted phonological awareness abilities at the end of kindergarten, although
those who achieved age-appropriate articulation skills also achieved age-appropriate
phonological awareness abilities. Raitano, Pennington, Tunick, Boada, and Shriberg (2004)
showed that both children with SSD only and SSD with language impairment performed poorly
on phonological awareness tasks compared to typically developing peers. In contrast with
Rvachew et al. (2007), even those whose speech had normalized had poorer performance in
phonological awareness.
Studies consistently show a relationship between SSD and poor phonemic awareness, but
a paradox is shown in that not all children with SSD have phonological awareness deficits, and
not all children showing phonological awareness deficits have a history of SSD. This has led
researchers to look for subtypes of SSD. Rvachew and Grawburg (2006) conducted an analysis
to determine variables that may contribute to poor phonological awareness skills in SSD,
5
including speech perception, articulation and receptive vocabulary. Results showed that poor
speech perception and/or poor receptive vocabulary were most predictive of phonemic awareness
skills, and phonemic awareness skills were the best predictor of early literacy skills. Articulation
did not have a direct impact on phonemic awareness. Ravachew (2007) followed up, identifying
children in prekindergarten who had SSD and poor phonological processing (PP) skills (i.e.,
speech perception and phonological awareness for rime and onset), SSD and good phonological
processing, and children with typical speech. At the end of first grade, the original tests were re-
administered as well as measures of sight words and non-word decoding. Only the SSD-low PP
group had lower non-word decoding skills, while both SSD groups continued to display
articulation delays.
Preston and Edwards (2010) used a picture-naming task to test for typical sound changes,
atypical sound changes and distortions of speech. Receptive vocabulary also was measured.
These were used to predict performance on phonological awareness tasks. Results indicated that
lower vocabulary scores and atypical sound errors predicted phonological awareness abilities.
Others have shown that for both children with and without SSD, vocabulary is the best predictor
of phonological awareness skills (Bishop & Adams, 1990; Elbro et al., 1998; Metsala, 1999;
Rvachew, 2006; Rvachew & Grawburg, 2006; Rvachew, Nowak, & Cloutier, 2004). This
finding is important because vocabulary is the source of the development of phonological
representations, which has led many researchers to identify poor phonological representations as
the underlying cause of both SSDs and phonological awareness deficits, and consequently
dyslexia (Elbro, Borstrom, & Peterson, 1998; Larrivee & Catts, 1999; Perfetti & Hart, 2002;
Rvachew, 2007; Rvachew & Grawburg, 2006; Sutherland & Gillon, 2005; Swan & Goswami,
1997).
6
Phonological Representations
Speech sounds can be described according to phonetic features, such as voicing,
placement, or manner of production. Morais (1991) proposes that features that are similar (e.g.,
unvoiced stops) enable children to organize speech input into phonological representations that
can be cognitively constructed, stored and retrieved. At the same time, differences in features
must be perceived to differentiate the sounds of the language. The child’s system must function
as an efficient pattern finder, capable of segmenting the speech signal into features,
discriminating speech sounds from each other, and organizing them into phonological categories
by both similarities and differences.
Phonological categories are language specific and in adult language they differentiate all
of the words of the language. For example, the /d/ and /t/ phonemes are distinctive categories
because there are pairs of words that differ by only one feature (dug/tug; die/tie; down/town), in
this case the voicing contrast of these phonemes. This system of distinctive features needs to be
constructed by every child, emerging developmentally with both increasing age and new
vocabulary words that provide the input for data comparison and sorting. As vocabulary
increases, children gain a broader range of data from which to abstract sound contrasts, patterns,
and sound combinations or sequences that form words (Metsala, 1999). These are referred to as
phonological representations. Metsala (1999) suggested that children with larger vocabularies
have more adult-like phonological representations in their features and organization because they
have stored similar-sounding words differentially. This is a gradual process that for most
children is nearly adult-like by kindergarten (Kilminster & Laird, 1978). During the period of
acquisition, the phonological representations undergo continuous changes that result in sound
substitutions and deviations from the adult ideal (e.g., “tat” for “cat” or “wawa” for “water”).
7
These predictable patterns, known as phonological processes, can be observed in both children
with typical and atypical speech sound development (Edwards, 1992; Edwards & Shriberg,
1983). Problems arise when speech sounds persist beyond the age of normalcy or are atypical in
nature (Bernthal, Bankson, & Flipsen, 1988; Preston et al., 2013).
Sutherland and Gillon (2007) proposed that children who either have poorly formed
phonological representations or difficulty accessing good-quality representations of words would
perform poorly on phonological awareness tasks and as a result, experience difficulty learning to
read. In tasks requiring processing of phonological information, children with SSD performed
poorly on those requiring them to judge correct and incorrect word productions, recognize newly
learned non-words, and perform phonological awareness tasks. They concluded poorly specified
phonological representations can have a negative impact on listening, speaking, articulation,
phonological awareness, and decoding.
For children with SSD, many researchers propose that a combination of genetic and
environmental factors may contribute to poorly formed phonological representations resulting in
both SSD and reading disabilities. This is supported by the finding that poor phonemic
awareness is associated with more atypical speech sound errors and lower receptive vocabulary
(Preston & Edwards, 2010). Furthermore, reading disabilities also are characterized by poor
vocabulary development. This effect may be indirect in that vocabulary contributes to young
children's phonological awareness, which in turn contributes to their word recognition
(Goswami, 2001; Nagy, 2005). Those with poor word recognition read less and understand less
of what they read, resulting in fewer vocabulary words learned from reading than their peers
(Beck, McKeowen, & Kucan, 2002).
8
Interventions for Phonological Awareness and Articulation
A few researchers have explored the outcome of treatment targeting either articulation or
phonological awareness on outcomes in both domains. Hesketh, Adams, Nightingale and Hall
(2000) provided either articulation-based or metaphonologically-based (i.e., phonological
awareness) therapy for 10 sessions to 61 children aged 3;1 to 5;0 with speech sound disorders.
Results showed both groups showed significant improvement in both domains with no group
differences. Follow-up three months later showed no group differences, although there was a
trend for the metaphonological group to make more long-term changes in one measure of
phonological awareness.
Denne, Langdown, Pring, and Roy, P. (2005) randomly assigned 20 children to control
and treatment groups who received 20 hours of small group therapy in phonological awareness.
The treatment group made significant gains in phonological awareness, but smaller and
nonsignificant changes in speech production. They cautioned that children may need a therapy
approach that targeted speech production more directly.
Most phonological awareness treatments as well as articulation therapy do not
incorporate visual symbols. Phonological awareness training typically includes activities such as
rhyming, listening for sounds in word positions, and segmenting sounds in words. However, the
National Reading Panel’s review of research revealed that the most effective training in
phonological awareness for at-risk children occurred when letters were used to teach these
concepts (Ehri et al., 2001). Further, studies on infant speech perception show that visual speech
productions by the speaker enhances phoneme discrimination as well as determining phoneme
boundaries in speech (Teinonen, Aslin, Alku, & Csibra, 2008), suggesting that from early stages
children rely on the visual cues of speech for information about phonemes. Castiglioni-Spalten
9
and Ehri (2003) found that kindergarten children learned to segment and recognize words better
when they were taught to monitor articulatory gestures. Attention to the mouth of the therapist
modeling speech sound productions is a basic cuing system used in a wide range of articulation
therapies. However, even with articulatory gestures, speech sound productions are fleeting and
difficult for children with SSD to perceive and manipulate auditorily. This has led some
researcher to explore using an iconic visual symbol to provide a stable and lasting representation
of a phoneme. The concrete visual representation provides the child with a stable means to view
and reflect on the phoneme.
Concrete Visual Representations
Pieretti, Kaul, and Zarchy (2014) compared a multimodal program termed FONEMZ
with traditional articulation therapy. Originally developed for the deaf and hard of hearing,
FONEMZ targets articulation by emphasizing phonemic awareness using a different color and
shape to represent each phoneme in English. Some of the symbols partially resemble their
corresponding letters, some resemble the shape of the mouth during the production of the sound,
and some resemble the International Phonetic Alphabet (IPA) symbol for the sound. The
disassociation between alphabetical letters and FONEMZ symbols was done purposefully to
eliminate confusion between the concept of a letter name and letter sound. There is a distinct
FONEMZ symbol for each phoneme, a one-to-one relationship that is purportedly easier to grasp
than English spelling which uses 250 different letters or letter combinations to symbolize 40
phonemes. The visual symbol of FONEMZ theoretically provides a visual and concrete
representation to anchor the sound in memory.
Two four-year-old children with severely unintelligible speech characterized by multiple
sound substitutions, distortions and omissions were selected for treatment. Both had poor
10
phonological awareness skills. A multiple baseline treatment design across 20 biweekly sessions
was used to target three phonemes, with one phoneme receiving language therapy only (control),
one receiving FONEMZ after a baseline of language therapy only, and one receiving traditional
articulation after baseline. Results showed that greater gains in articulation were made for the
phoneme treated using the FONEMZ approach, and that changes were also shown for
phonological awareness and early literacy skills. They concluded that the visual component of
the FONEMZ symbol increased the accuracy of phoneme production and also resulted in
improvements in phoneme awareness and letter recognition.
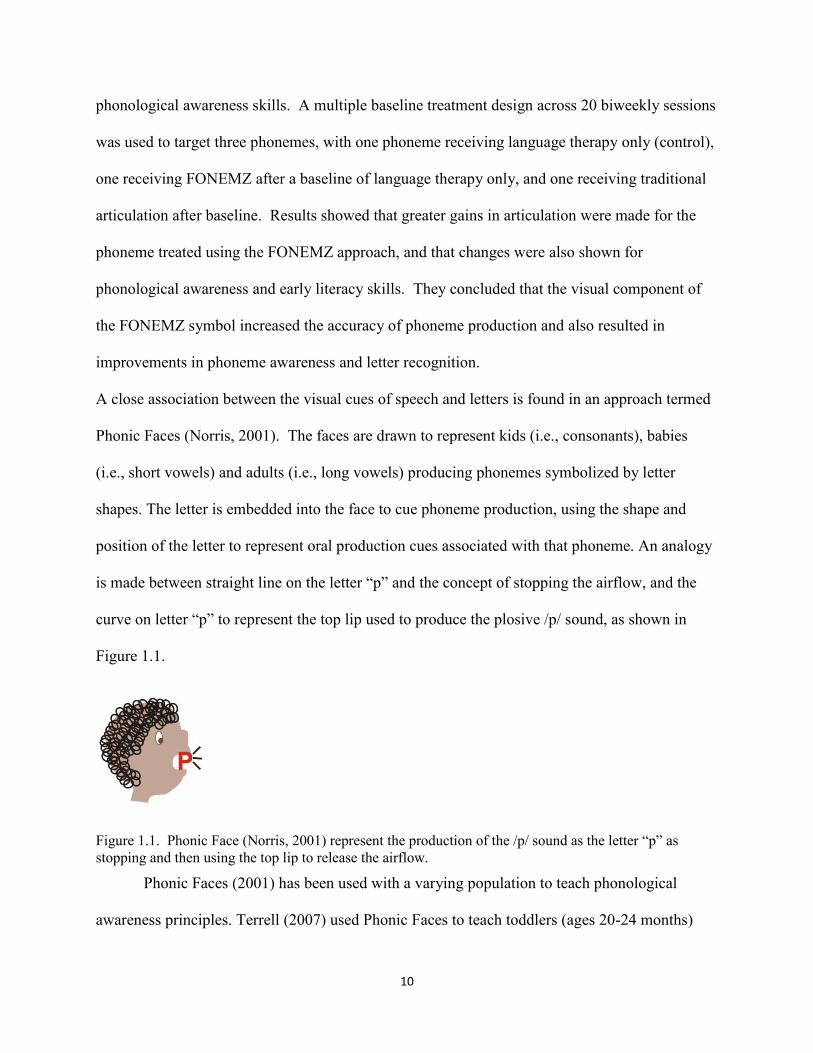
A close association between the visual cues of speech and letters is found in an approach termed
Phonic Faces (Norris, 2001). The faces are drawn to represent kids (i.e., consonants), babies
(i.e., short vowels) and adults (i.e., long vowels) producing phonemes symbolized by letter
shapes. The letter is embedded into the face to cue phoneme production, using the shape and
position of the letter to represent oral production cues associated with that phoneme. An analogy
is made between straight line on the letter “p” and the concept of stopping the airflow, and the
curve on letter “p” to represent the top lip used to produce the plosive /p/ sound, as shown in
Figure 1.1.
Figure 1.1. Phonic Face (Norris, 2001) represent the production of the /p/ sound as the letter “p” as
stopping and then using the top lip to release the airflow.
Phonic Faces (2001) has been used with a varying population to teach phonological
awareness principles. Terrell (2007) used Phonic Faces to teach toddlers (ages 20-24 months)
11
phonological awareness skills. Sixteen toddlers in daycare programs were tested using letter
awareness tasks (finding letters, identifying letters, discriminating letters) and phoneme
awareness tasks (sound/letter correspondence, identifying sounds, discriminating sounds,
producing sounds). The toddlers were read alphabet books (i.e., each page containing a letter and
3-4 pictured objects that began with the phoneme, as in “b” depicted with “ball,” “bed,” and
“boy”) with some letters embedded in Phonic Faces and some not. Results showed that toddlers
made significantly greater gains for letters embedded in Phonic Faces (p<.007) in both sound
awareness and letter awareness, specifically in finding any letters on Phonic Faces cards, finding
specific letters on Phonic Faces cards, and producing sounds from Phonic Faces cards. These
findings demonstrate that Phonic Faces were effective in increasing phonological awareness
skills. McInnis (2008) found similar results for toddlers taught using sight words containing
Phonic Faces (i.e., MorphoPhonic Faces) as the initial sound accompanied by pictures depicting
the meaning drawn into the remaining letters. The toddlers not only learned more words in this
condition but also showed evidence of abstracting and using the alphabetic principle. That is, the
cues provided by the analogy between the letter and the sound production resulted in the toddlers
associating the phoneme represented by the letter with new, untaught words.
A study by Powell, Hartman, Hoffman, and Norris, (2007) showed that more
MorphoPhonic Faces (MPF) words were learned daily by poor readers compared to plain words,
and greater gains were made in phonemic awareness. Similar results were found by Williams
(2013) for 1st graders with poor reading skills. While the number of words learned daily did not
differ between MPF and plain words, better short and long-term retention occurred for words
learned using MPF. Greater improvement in measures of phonemic awareness, letter-sounds,
and decoding also showed the predicted increases in alphabet skills. Qualitative analyses
12
revealed that words from all grammatical classes were learned but while some words were
learned by all, there was a continuum of increasingly more difficult words to picture that resulted
in the most abstract words (i.e., of, could) that were learned by none of the subjects. Brown
(2014) compared word learning for kindergarten children under conditions of MPF and plain
print words. Word learning was minimal under both conditions with no significant differences
for word type. However, alphabet skills did improve significantly.
Brazier-Carter (2008) recruited four Head Start teachers from an urban population to read
either Phonic Faces alphabet storybooks or emergent reading books to their class for 15-20
minute sessions daily for 6 weeks. The same storybook was read five times per week. The
alphabet storybooks centered on one specific phoneme, which was pictured using the Phonic
Face character producing the sound as a natural part of the story (Peter makes the /p/ sound as
popcorn is heard and seen popping). Instances of the letter/sound also occur throughout the text
so that children can be encouraged to listen for the sound, sound in word position, rhyming
words, and other phonological awareness abilities (i.e., “Peter popped popcorn - /p/ /p/ /p/”).
Teachers were trained to exploit these opportunities for letter and phoneme awareness
throughout the reading of the book. In the emergent reading book condition, books were chosen
from the Wright Group Sunshine series (Wright Group, 1990-1998). These books have high
repetition of words and sentences, and control group teachers were taught to reference the letters
and sounds in these repeated words throughout the book reading. One week prior to the
storybook reading intervention, the Head Start teachers participated in four 30-minute trainings
that focused on one topic per session, including: phonemic awareness (initial sound, rhyme, and
sound segmenting), print referencing (letter name, letter sound, book conventions), vocabulary
13
(definitions, picture explanations, personal experiences), and narrative (retelling, questions,
paraphrasing/explaining).
The results of Brazier-Carter (2008) showed that teachers using the Phonic Faces books
made significantly more references to phonemic awareness and print referencing than the
emergent reading book group. They also made significantly more references to meaning
(vocabulary and story elaboration) than with the emergent reading books. These results show that
using Phonic Faces cues improved teachers’ consistency for referencing and teaching pre-
reading skills, such as phonemic awareness and print awareness, but not at the expense of
meaning. Furthermore, when the Phonic Faces books were used, the students made significantly
greater gains in vocabulary, print concepts, and phonemics awareness.
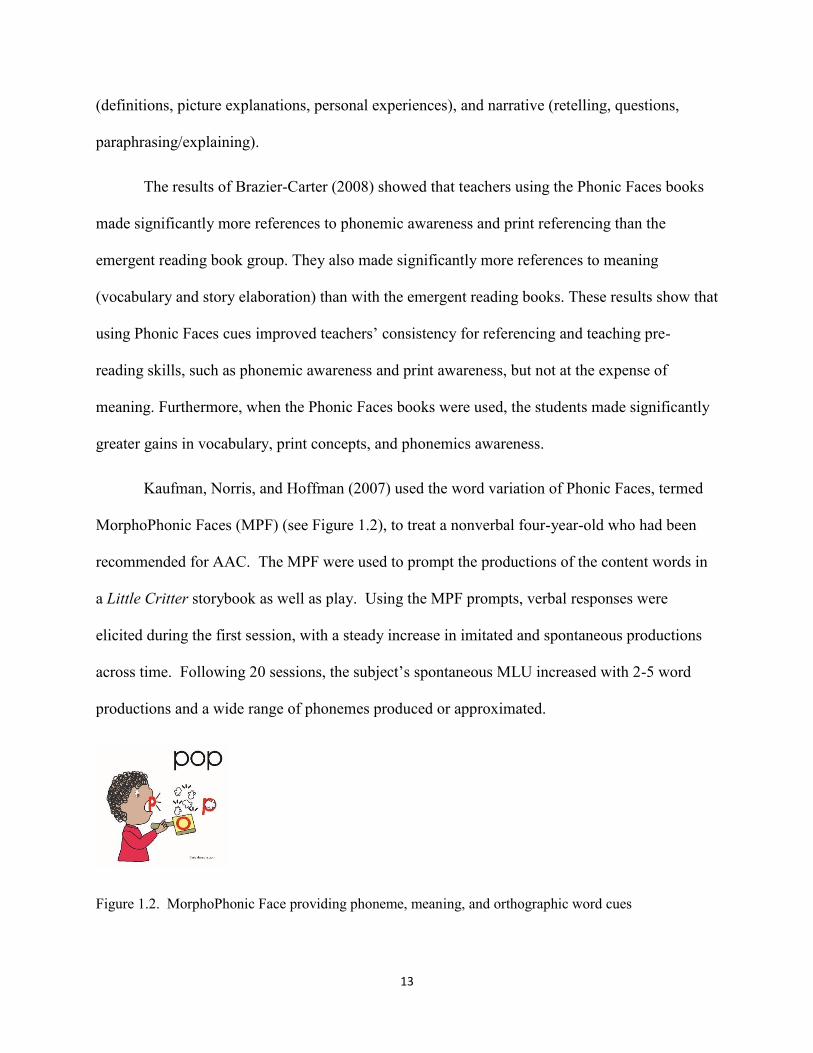
Kaufman, Norris, and Hoffman (2007) used the word variation of Phonic Faces, termed
MorphoPhonic Faces (MPF) (see Figure 1.2), to treat a nonverbal four-year-old who had been
recommended for AAC. The MPF were used to prompt the productions of the content words in
a Little Critter storybook as well as play. Using the MPF prompts, verbal responses were
elicited during the first session, with a steady increase in imitated and spontaneous productions
across time. Following 20 sessions, the subject’s spontaneous MLU increased with 2-5 word
productions and a wide range of phonemes produced or approximated.
Figure 1.2. MorphoPhonic Face providing phoneme, meaning, and orthographic word cues
14
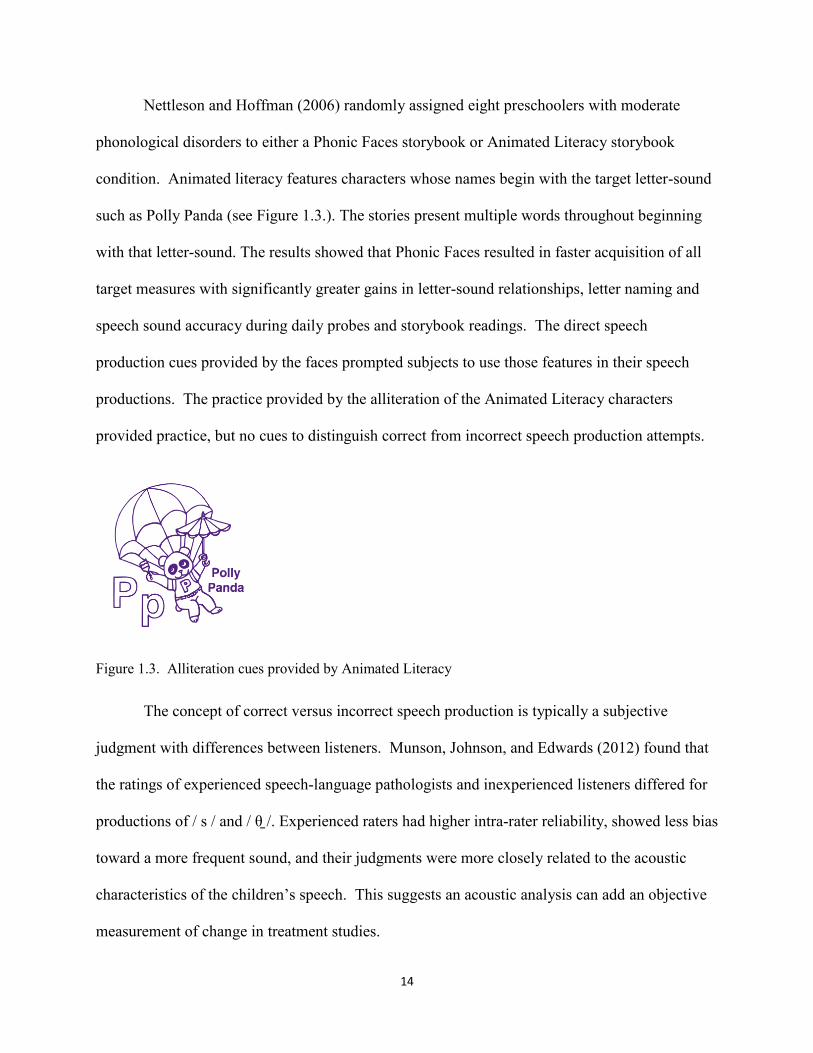
Nettleson and Hoffman (2006) randomly assigned eight preschoolers with moderate
phonological disorders to either a Phonic Faces storybook or Animated Literacy storybook
condition. Animated literacy features characters whose names begin with the target letter-sound
such as Polly Panda (see Figure 1.3.). The stories present multiple words throughout beginning
with that letter-sound. The results showed that Phonic Faces resulted in faster acquisition of all
target measures with significantly greater gains in letter-sound relationships, letter naming and
speech sound accuracy during daily probes and storybook readings. The direct speech
production cues provided by the faces prompted subjects to use those features in their speech
productions. The practice provided by the alliteration of the Animated Literacy characters
provided practice, but no cues to distinguish correct from incorrect speech production attempts.
Figure 1.3. Alliteration cues provided by Animated Literacy
The concept of correct versus incorrect speech production is typically a subjective
judgment with differences between listeners. Munson, Johnson, and Edwards (2012) found that
the ratings of experienced speech-language pathologists and inexperienced listeners differed for
productions of / s / and / θ̠ /. Experienced raters had higher intra-rater reliability, showed less bias
toward a more frequent sound, and their judgments were more closely related to the acoustic
characteristics of the children’s speech. This suggests an acoustic analysis can add an objective
measurement of change in treatment studies.
15
Acoustic Characteristics of R and S
The production of / ɹ / has historically been described as a phoneme that carries a one-to-
many ratio in terms of variations of production. It can be produced with a retroflexed or bunched
lingual configuration as it articulates with the palatal vault (Espy-Wilson, Boyce, Jackson,
Narayanan, Alwan, A., 2000). Furthermore, because of r’s predilection to be influenced by
surrounding vowels, variation can occur dependent on its position (i.e., prevocalic, postvocalic,
or syllabic). Acoustically, / ɹ / is characterized by a stable acoustic pattern of F3 that decreases
to match or meet the value of F2 (Stevens, 1999; Epsy-Wilson et al., 2000). Dalston (1975)
found that correct production of word initial / ɹ / with a mean F3 of 2500 Hz in both children and
adults could help delineate / ɹ / from “w”, a common substitution pattern. To best define the
acoustic properties of / ɹ /, Epsy-Wilson et al. (2000) set forth the properties of ɹ-ness as low F3
and smaller F3-F2). This suggests that F3-F2 and F3 can be compared to the norm established
by Dalston (1975) as a more objective measure of the correct production of / ɹ /.
When determining the acoustic characteristics of the / s / phoneme, the current literature
on the accurate production of / s / is varied. Flipsen, Shriberg, Weismer, Karlsson and
McSweeny (1999) studied the speech acoustic patterns of 26 adolescent children to generate
reference data to better guide speech disorders research. One finding from this study was that / s /
can be characterized by extraction of midpoint value. Historically, research extracting values
from / s / production have used a version of Fourier transform (e.g., FTT and DFT) or linear
predicative coding to examine the frequency and intensity trajectory of / s /. An alternative that
uses a single value (i.e., center of gravity), as opposed to a trajectory, to acoustically describe / s
/ was found by Abdelatty, Ali, and Muelle (1998). Using acoustic analysis, Holliday, Reidy,
Beckman, and Edwards (2015) found that / s / and /th/ will overlap in children’s production due
16
to covert contrast; a phenomenon where a child is able to accurately perceive a sound, yet their
production will be judged as incorrect. This suggests that an external cue such as contrasting the
speech production cues provided by the / s / and /th/ Phonic Faces may assist the child in
establish a phonetic category for distinction between similar sounding fricatives (i.e. / θ/̠ and /s/).
Acoustic Analysis
Acoustic Analysis of / ɹ /. For phoneme / ɹ /, boundaries were established using the criteria set
forth by Peterson and Lehiste (1960) and (Chaney, 1988) analyzing the spectrogram for the
directional shift in F2. Once the onset and offset were bound, using time as an axis, the spectrum
was marked at the center of the formant band and the second and third formant frequency were
extracted from this midpoint. F3 was analyzed and compared to pre- and post-treatment for
positive acoustic change. We would expect for subjects to show a lower F3, to indicate
increased rhoticity and perceptual accuracy. F3-F2 values were taken pre- and post-treatment, in
addition to a comparing post-treatment F3 to the norm (F3=2500Hz) set forth by Dalston (1975).
Acoustic analysis of / s /. Current literature on optimal acoustic characteristics of English
fricatives is ongoing. The most common measures for identification remain higher spectral mean,
defined peaks, and larger overall amplitude compared to voiced fricatives (Maniwa et al., 2008).
For this study, phoneme / s / was analyzed using the Pratt program. Phoneme boundaries were
established on the basis of the presence of turbulent aperiodic frequencies. After each phoneme
was bound, center of gravity was extracted by creating a spectral slice and intensity was
automatically generated.
17
Summary
The studies exploring use of drawings that provide a visual iconic representation of
phonemic production features suggest they may provide a useful cue that enables children to
formulate more accurate speech sound productions. They also suggest that using letter and
word-based cues for articulation may simultaneously prompt word recognition and word pattern
learning, thus addressing literacy as part of the treatment outcomes of therapy for speech sound
disorders.
The questions of this study therefore are:
1. Will subjects produce more correct productions of isolated words beginning with a target
phoneme (/ s / or / ɹ /) when the words are elicited using pictures that incorporate speech
production cues?
2. Will subjects recognize more of the written sight words for words practiced using
MorphoPhonic Faces pictures than plain print pictures?
3. Will subjects show better ability to decode nonsense words with patterns that were
practiced in the treatment lessons?
4. Will subjects who demonstrate improved productions according to listener perception
also show changes in acoustic formant trajectories for / ɹ / and intensity for / s /
phonemes?
18
CHAPTER 2. METHODS
This study compared gains in the number of correct productions of target phonemes (i.e.,
either / ɹ / or / s /) under elicitation conditions of either plain clip art pictures or pictures that provide
speech production cues (i.e., MorphoPhonic Faces). Productions were elicited in imitated and
spontaneous daily probes across four treatment weeks (i.e., 5 to 11 sessions depending on
Individualized Education Program requirements and absences). In addition, pre-treatment and
post-treatment performance on decoding and sight word recognition were compared. Students
receiving treatment for speech sound disorders were instructed using both plain and MPF pictures
in an alternating treatment design. Participants received treatment two to three times weekly in 8-
minute sessions within a school.
Participants
Graduate Students. The students implementing the intervention were nine masters level graduate
students. Each graduate student implemented two short (approximately eight minute) intervention
sessions weekly with the same child. Since children were seen two to four times weekly, two
different students may have seen the children each week (i.e., one on Tuesday/Thursday and one
on Monday/Wednesday). A PhD researcher trained the students in the treatment procedures and
served as a fidelity checker along with the course supervisor for the practicum. She also modeled
the procedures as needed and alerted the course supervisor when students were having difficulty
with implementation, in which case the graduate student clinician was given additional training.
Participants with Speech Sound Disorders. The participants were 14 elementary students in an
urban school, ranked among the lowest achieving elementary schools in the state. The school was
predominantly African American (61.6%). All of the students received free or reduced lunch. The
participants ranged in age from 6;2 to 12;4 years (mean 8;7, including 11 males and 3 females. To
19
be included in the study, students must have no known significant visual or hearing loss according
to school records. Students were tested prior to the beginning of intervention for sight words
recognized and word decoding. Results show the groups were comparable in reading skill levels.
The characteristics of subjects are profiled in Table 2.1.
Table 2.1 Profile of Demographic Characteristics, Decoding, and Sight Word Test at Pretest.
Group
Mean Age
Gender Race Mean Pretest Score
Male Female AA
C Decoding Sight Words
/ ɹ / phoneme 9;1
4 3 2 5 16.4/40 19.8/64
/ s / phoneme 8;4
7 0 3 4 13.0/40 18.4/60
Test Instruments
Abbreviated Phonics Inventory. The abbreviated phonics inventory is comprised of five items
adapted from an informal phonics Inventory. The items assessed the phonic patterns present in
the stimulus words used in this study. The first two items asked the participants to 1) name the
vowels, and 2) name the short vowel heard in five named real words (strip, bunk, trap, block, and
bread). The last three items required participants to read ten nonsense words for each of the word
patterns, including test item 3) short vowels in CVC constructions; 4) long vowels in double vowel
CVVC patterns; and 5) long vowels in CVCe patterns.
Sight Word List. For each phoneme (/ɹ / and / s /) a sight word list was created comprised of 24
MPF words and 24 PP words used during intervention. The words included CVC, CVVC, CVCe
patterns. In addition, 13 additional words containing the practiced patterns but not exposed to in
intervention were included in the sight word list. Students were given 3 seconds to recognize the
words.
20
Contextualized Speech Elicitation and Acoustic Analysis Task. Four story pictures for each
phoneme (initial / s / and / ɹ /) were created by the researcher to elicit productions of the target
sound (/s/ or / ɹ /) in sentences to be used for acoustic analysis of phoneme production. Six subjects
were asked to look at a color picture while the researcher read aloud a 20-25-word story script that
corresponded with the picture. The child was immediately asked to retell the story that was audio
recorded. Each script contained 12 words beginning with the target phoneme, resulting in
potentially 48 words the child could produce in retellings (e.g., “A small sad girl named Sam sat
in the sun. Some soap was spilled on her seat. Sam started to sob”). See Appendix A for the pictures
and scripts.
The acoustic analysis was conducted using the PRATT program to create text grids and
subsequent acoustic boundaries for initial / s / and / ɹ / in words. Measurements taken were a)
center frequencies of the second and third formants for phoneme / ɹ / and b) center of gravity and
intensity for phoneme / s /. Literature has indicated difficulties in extracting frequencies from
audio recordings with adequate acoustic power and spectral bandwidth to accurately delineate
resonant frequencies (Hoffman et al., 1983; Huggins, 1980) but these recordings provided a rough
measure of acoustic change. For the purposes of this study, F3, F3-F2 and F3 for / ɹ / will be
compared to the norms established by Dalston (1975).
21
CHAPTER 3. MATERIALS
Plain Picture Stimuli Cards (PP): Plain Picture stimuli were comprised of 24 / s / words including
12 short vowel CVC picture word cards and 12 long vowel CVVC or CVCe pattern words cards
for each phoneme. The pictures were accompanied by the printed word in 45-point font. The
words displayed in a single set as seen in Figure 1. All words in a set adhered to either the short
or long vowel pattern.
Figure 2.1. Stimuli with plain pictures accompanied by printed words.
MorphoPhonic Faces Stimuli Cards (MPF): MorphoPhonic Faces stimuli cards were comprised of
24 / s / words and 24 / ɹ / words, including 12 short vowel CVC picture word cards and 12 long
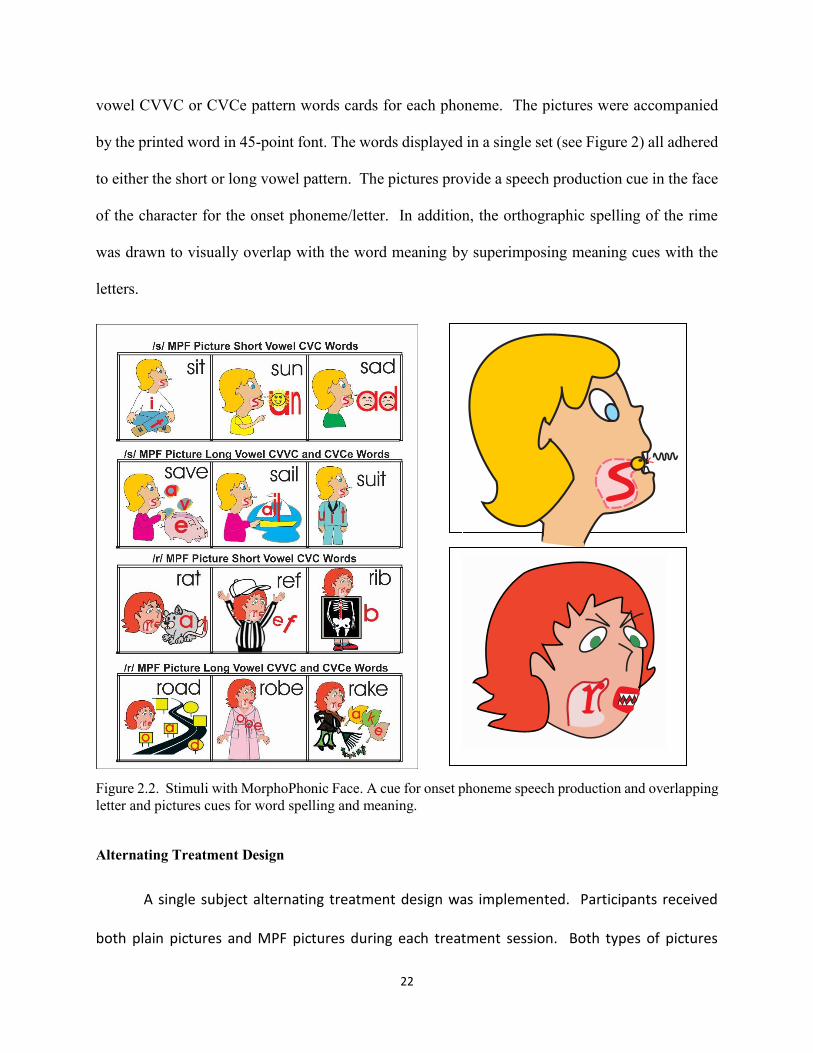
22
vowel CVVC or CVCe pattern words cards for each phoneme. The pictures were accompanied
by the printed word in 45-point font. The words displayed in a single set (see Figure 2) all adhered
to either the short or long vowel pattern. The pictures provide a speech production cue in the face
of the character for the onset phoneme/letter. In addition, the orthographic spelling of the rime
was drawn to visually overlap with the word meaning by superimposing meaning cues with the
letters.
Figure 2.2. Stimuli with MorphoPhonic Face. A cue for onset phoneme speech production and overlapping
letter and pictures cues for word spelling and meaning.
Alternating Treatment Design
A single subject alternating treatment design was implemented. Participants received
both plain pictures and MPF pictures during each treatment session. Both types of pictures
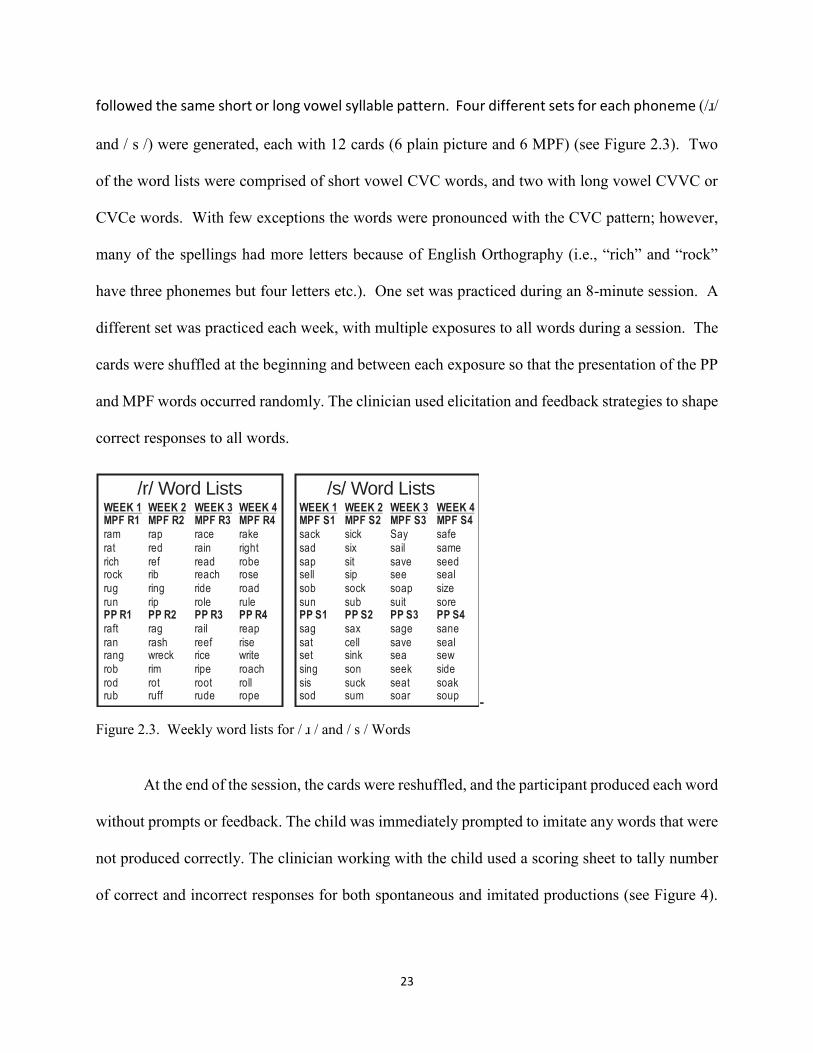
23
followed the same short or long vowel syllable pattern. Four different sets for each phoneme (/ɹ/
and / s /) were generated, each with 12 cards (6 plain picture and 6 MPF) (see Figure 2.3). Two
of the word lists were comprised of short vowel CVC words, and two with long vowel CVVC or
CVCe words. With few exceptions the words were pronounced with the CVC pattern; however,
many of the spellings had more letters because of English Orthography (i.e., “rich” and “rock”
have three phonemes but four letters etc.). One set was practiced during an 8-minute session. A
different set was practiced each week, with multiple exposures to all words during a session. The
cards were shuffled at the beginning and between each exposure so that the presentation of the PP
and MPF words occurred randomly. The clinician used elicitation and feedback strategies to shape
correct responses to all words.
WEEK 1MPF R1
PP R1
ramratrichrockrugrun
raftranrangrobrodrub
WEEK 2MPF R2
PP R2
rapredrefribringrip
ragrashwreckrimrotruff
WEEK 3MPF R3
PP R3
racerainreadreachriderole
railreefriceriperootrude
WEEK 4MPF R4
PP R4
rakerightroberoseroadrule
reaprisewriteroachrollrope
WEEK 1MPF S1
PP S1
sacksadsapsellsobsun
sagsatsetsingsissod
WEEK 2MPF S2
PP S2
sicksixsitsipsocksub
saxcellsinksonsucksum
WEEK 3MPF S3
PP S3
Saysailsaveseesoapsuit
sagesaveseaseekseatsoar
WEEK 4MPF S4
PP S4
safesameseedsealsizesore
sanesealsewsidesoaksoup
/r/ Word Lists /s/ Word Lists
-
Figure 2.3. Weekly word lists for / ɹ / and / s / Words
At the end of the session, the cards were reshuffled, and the participant produced each word
without prompts or feedback. The child was immediately prompted to imitate any words that were
not produced correctly. The clinician working with the child used a scoring sheet to tally number
of correct and incorrect responses for both spontaneous and imitated productions (see Figure 4).
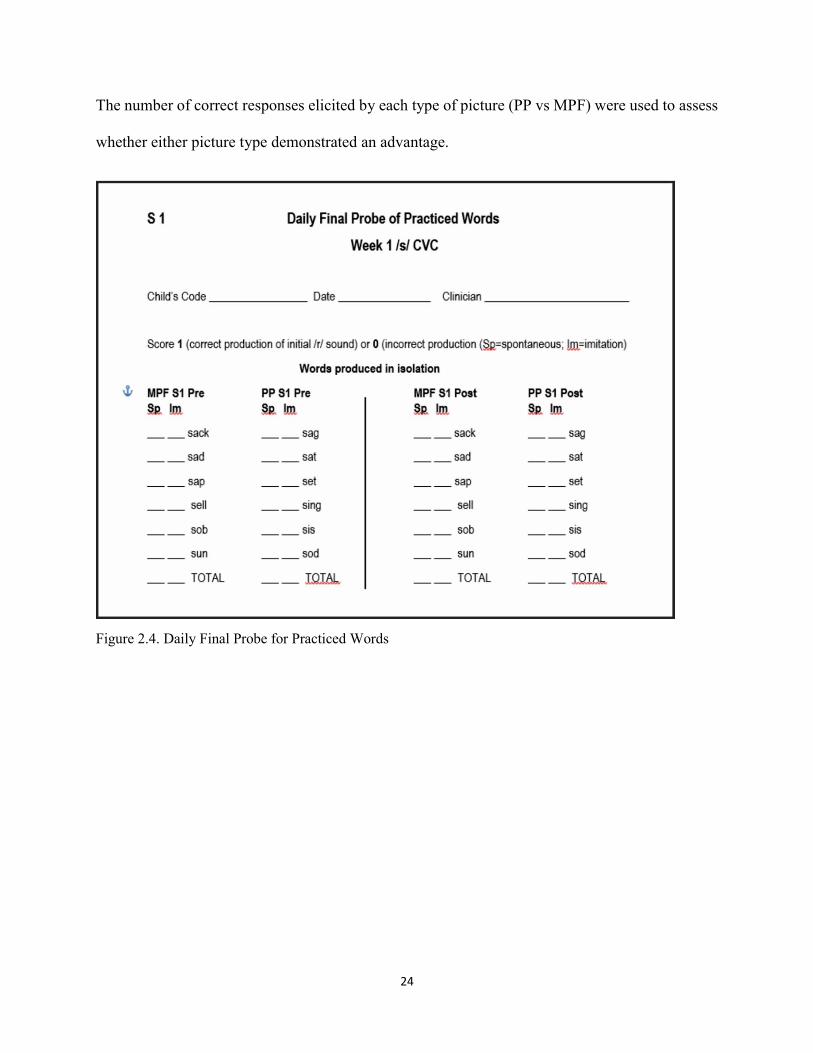
24
The number of correct responses elicited by each type of picture (PP vs MPF) were used to assess
whether either picture type demonstrated an advantage.
Figure 2.4. Daily Final Probe for Practiced Words
25
Feedback/Prompt Hierarchy
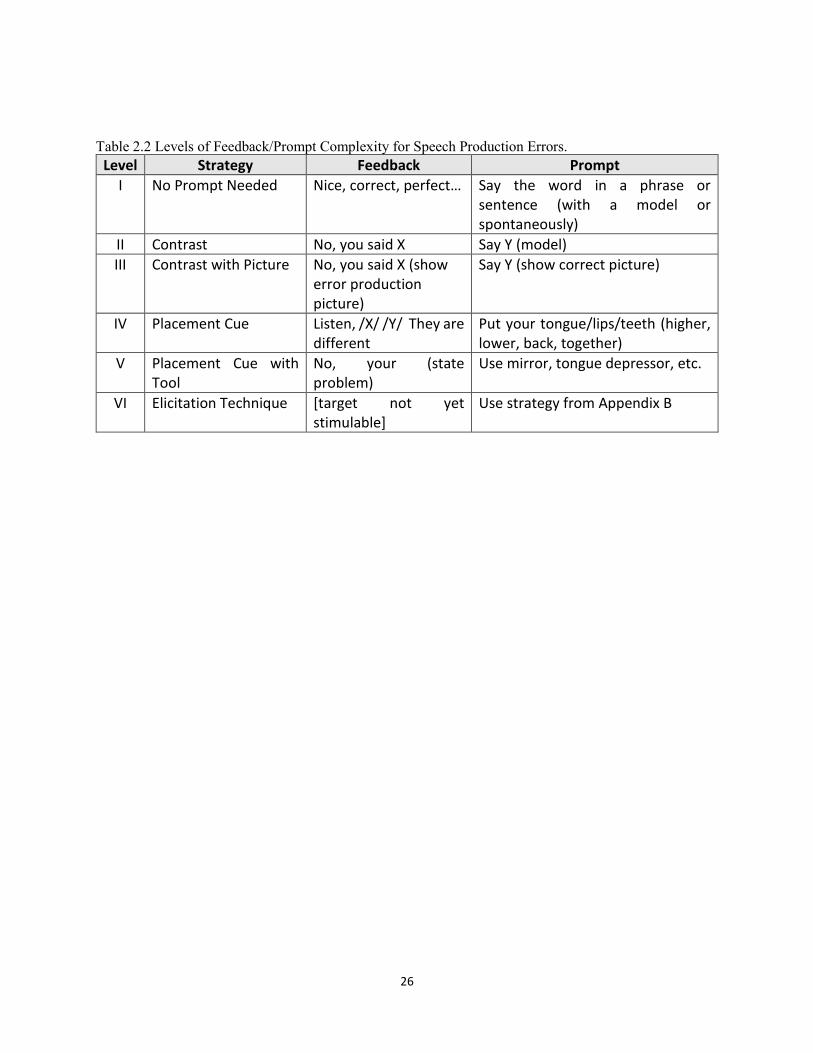
To elicit correct sound productions, Feedback/Prompt Hierarchy profiled in Table 2.2)
will be used for sounds in isolation as well as sounds in words, phrases and sentences. The first
level is a spontaneous or self-corrected production, indicating the child is ready to try the word in
a phrase. The next four prompts are used when the sound is stimulable but the child does not
have a good representation of the correct production or has habituated an incorrect production.
These include Level II, giving feedback to make the child aware of his attempted production and
modeling and requesting a correction [child: θæt/sat. Adult: You said θæt; Remember your / s /
sound and say /sæt/.
Level III is similar, however it provides a visual reminder of the difference that the child
can look at and think about before responding, giving time to plan a different motor response that
is within the child’s repertoire. Level IV provides speech production cues (i.e., “Remember to
keep your teeth together,” “Pull you tongue back a bit”) that remind the child how to produce the
target sound. Level V uses a tool like a mirror, tongue depressor or lollipop to remind the child
how to place the articulators and to view their incorrect attempt. Level VI is to use an elicitation
technique when the target is not yet stimulable using the above feedback and prompts, such as
shaping the “s” from a “t” by holding the “t” for the last repetition (i.e., t...t...t... tssss).
Suggested elicitation techniques are found in Appendix B.
For Level III, Contrast with Picture, clinicians were given Phonic Faces (Norris, 2001) of
the / s /, / θ/, / ɹ / and /w/ letter-phonemes. The use of the contrasts to enable participants to
compare their production to the target productions was modeled.
26
Table 2.2 Levels of Feedback/Prompt Complexity for Speech Production Errors.
Level Strategy Feedback Prompt
I No Prompt Needed Nice, correct, perfect… Say the word in a phrase or sentence (with a model or spontaneously)
II Contrast No, you said X Say Y (model)
III Contrast with Picture No, you said X (show error production picture)
Say Y (show correct picture)
IV Placement Cue Listen, /X/ /Y/ They are different
Put your tongue/lips/teeth (higher, lower, back, together)
V Placement Cue with Tool
No, your (state problem)
Use mirror, tongue depressor, etc.
VI Elicitation Technique [target not yet stimulable]
Use strategy from Appendix B
27
CHAPTER 4. PROCEDURE
Consent Forms. The proposed study, including the consent form, underwent IRB review and
received approval prior to the initiation of the study. The school speech-language pathologist
conducted an initial screening to identify elementary students who met the criteria of a
misarticulation of either the / ɹ / or / s / phoneme comprised of a substituted phoneme or a
distortion. The school distributed the consent form to eligible students. Those students whose
parents returned a consent form met with the primary investigator to discuss the study and sign a
Child Assent form. A time then was arranged for students with consent and assent to complete the
pretest battery.
Pretest – Posttest. The school was consulted regarding times when the pretest battery could be
administered to students. A quiet room in the school was used to conduct the assessments. Most
students were able to complete the battery on a single session, but a second session was scheduled
if needed. At the end of the study, the same procedure was followed for collection of posttest data.
Training. Training was conducted to clinicians implementing the treatment to assure fidelity in
implementation of the treatment as well as improving interrater judgment of either correct or
incorrect production of the target phonemes. Clinicians were provided written instructions and
shown a video of the implementation. Questions were answered and instructions reviewed. The
PhD researcher was present for the first two weeks of the study, modeling the procedure for
clinicians with their subjects, and then observing the clinician and providing corrective feedback.
The researcher made additional observations during the final two weeks. During all weeks, the
treatment implementation was observed by a certified SLP who was supervising the clinicians,
attending training sessions, and working closely with the researchers.
28
Presentation of the Cards. Each week a different set of cards were used to elicit sound productions
as shown in Figure 3. The sets have 6 MPF pictures and 6 PP which were presented in random
order. If time allows, shuffle again before a second presentation of the cards are practiced. This
should continue until the post-session probe, at which time the cards are shuffled once again before
the probe begins.
MPF Card Procedure
The following presentation was used to elicit words for both the / s / and / ɹ / phonemes on the
MPF cards.
Sound in Isolation / s /. Participants were presented with an MPF card from the weekly card set.
The examiner pointed to the Phonic Face at the beginning of the word. Clinician stated, “This is
Ester. Look at the letter “s” in her mouth. It is shaped like a tongue that is curled like a snake’s
body. See how the head of the snake is right behind her teeth? The sound the snake says, /s:/, is
going straight out of her mouth – see the wavy line of air? Listen when I say her sound /s:/. My
tongue is right behind my teeth but not touching so the air can go out and make the sound like a
snake. So when you make the / s / sound you need to keep the “s” or the snake’s head up high in
your mouth, behind your teeth, and only let the air out, not your tongue. Let me hear you try it.”
If the child’s production was correct 5 times out of 8, clinician moved on to the first word of the
week 1 card set. If not, the sound was shaped after each attempt using the Feedback/Prompt
Hierarchy and then move on to the elicit the words using Sound in Word procedures.
Sound in Isolation / ɹ /. Participants were presented with a MPF card from that week’s card set.
The examiner pointed to the Phonic Face at the beginning of the word. The clinician would say,
“This is Arlene. Look at the letter “r” in her mouth. It is shaped like a tongue that is up in the
back of the mouth, touching the back top teeth (say “eeee” to find that spot). But then you will
29
see the tip of the tongue go up toward the top of her mouth but not touch anything and her lips
point to show her teeth, making a growling sound /ɚ/. This is like the / ʃ / sound (say /ʃ/) to find
the spot. Feel your lips when you say / ʃ /; they are pointed, and your teeth show. But Arlene is
mean, so she isn’t quite like / ʃ /, she has her voice on so she can growl / ɚ /. So, when you make
the / ɹ / sound you need to hold the back of your tongue where you make the /i/ sound and the tip
of your tongue up and show your teeth like you are growling.” The name of the PF, Arlene, was
also used to prompt a correct production because the transition from /ɹ / to / l / within the name
moved the tongue into the correct position for / ɹ / for many of the children.
If the child’s production is correct 5 times out of 8, move on to the first word of that week’s card
set. If not, shape the sound after each attempt using the Feedback/Prompt Hierarchy and then
move on to the elicit the words using Sound in Word procedures. Suggested strategies: The word
“ear” may help the child find the correct / ɹ / position. “Say the /i/ sound. Now keep touching your
tongue on your teeth in back but move just your tongue tip up and point your lips (show the three
features on Arlene). If the child has difficulty with tongue tip placement, the words “sure” may
help. “Say eee. Now say the silly word esh.” This should place the tongue and lips in the correct
position for / ɹ /. “Now say it again but turn on your mean voice, ‘esher.’ Now hold your mouth
in that position and say “sure.” Now hold your mouth in that position and just say / ɚ /).
Sound in Word for MPF Words. The first MPF card of the set was presented (i.e., 6 MPF words
and 6 PP words in each set), beginning with the first set of CVC short vowel words. The clinician
would use the following prompt:
“All of these words have three sounds, a beginning, middle and ending sound. All of the words
begin with the / s / sound.” The child was then asked to point to the first picture, “sit” (see first
picture in Figure 2.2), specifically to Ester. “This is Ester. She makes the / s / sound. The rest of
the letters in the word are hiding in the picture. The vowels are short vowels. Together, they say
30
the name of the word. Ester says / s / and the letters “i” (point to “i” on shirt) says /i/ and “t” (point
it “t” on jeans) says /t/. Together, the letters say / sɪt /. Now you look at Ester’s mouth and keep
the head of the snake behind your teeth and say the word.”
If an error in production occurred clinician would say,
“Remember, the sound the snake makes /s: / is going straight out of her mouth – see the wavy line
of air? Listen when I say her words, / s:æk/, /s:sæd/, /s: ɑb/. My tongue is right behind my teeth
but not touching so the air can go out and make the sound like a snake. You need to keep the “s”
or the snake’s head up high in your mouth, behind your teeth, and only let the air out, not your
tongue.”
The child would be asked to try the word again. Several attempts were made to elicit the correct
production, or obtain three consecutive correct productions, following, the child was to move on
to the next word. “Great, that was Ester’s sound. Let’s try the next word” or “Pretty close. Let’s
try the next word.” This was continued through the set of cards, using the above procedure only
for the 6 MPF words.
Sound in Phrases and Sentences. If the child readily produced the sound in the word correctly with
minimal prompts (Levels I or II), the word was recast in a 2-3-word phrase and the child was asked
to repeat the phrase (“Sit down.” or “Ester sits down.”) If other / s / sounds in the phrase were
produced incorrectly (Ester, sits), corrective feedback was provided, and the child was asked to try
again. If the child readily produced the sound in phrases, the child was to create a sentence using
the target pictured word. Feedback was provided when appropriate.
Plain Picture Procedure
Sound in Isolation / s /. Sounds on PP cards will be treated like traditional articulation therapy
cards. The first PP card of the set were presented (i.e., 6 PP words and 6 MPF words in each set),
beginning with the first set of CVC short vowel words. Clinician would say, “This word begins
31
with the /s: / sound. Watch how I make the sound.” Participants were given a model of the target
sound. The clinician would use the following prompt:
“My tongue is right behind my teeth but not touching so the air can go out and make the sound
like a snake. So when you make the / s / sound you need to keep your tongue up high in your
mouth, behind your teeth but not touching, and only let the air out, not your tongue. Let me hear
you try it.”
If the child’s production was correct 5 times out of 8, they progressed on to the first word of the
week 1 card set. If not, the sound was shaped after each attempt using the Feedback/Prompt
Hierarchy and child was to move on and begin to elicit the words using Sound in Word procedures.
Sound in Word. The child was presented with the first of 12 word cards that began with the short
vowel sound (complexity Stage A). The clinician would say, “All of these words begin with the
/s/ sound.” This was done while pointing to the picture. Production was modeled by stating the
word with an exaggerated / s / production.
“My tongue is right behind my teeth but not touching so the air can go out and make the sound
like a snake. You need to keep your tongue up high in your mouth, behind your teeth, and only
let the air out, not your tongue.”
The child was asked to produce the first word, sit. If an error in production occurred, the sound
was shaped using the Feedback/Prompt Hierarchy. When the child produced the word three
consecutive times, they moved on to the next word. “Great that was a good / s: / sound. Let’s try
the next word.” When the third word in the row was produced correctly, the child was asked if
they could say the preceding three word-cards without help. Feedback was provided as needed.
Sound in Phrases and Sentences. If the child readily produced the sound in the word correctly with
minimal prompts (Levels I or II), the word was recast in a 2-3-word phrase and the child was asked
to repeat the phrase (i.e. “Sit down” “Ester sits down.”) If other / s / sounds in the phrase were
32
produced incorrectly (Ester, sits), corrective feedback was provided and the child was asked to try
again. If the child readily produced the sound in phrases, the child was to create a sentence using
the target pictured word and provide feedback as appropriate.
Probe. A probe was administered at the end of each session during the final minute. At the end
of each word set (or as far as the child progressed during the session) the subject was asked to
say each word with the correct target sound. If an incorrect production occurred, the child was
asked to imitate the work and a correct production was modeled. The clinician then calculated
the percent target phonemes correct. This summation of data was collected for each session.
Data Analysis Procedure
Speech Perception Reliability. An inter-rater reliability training was completed prior to the
initiation of the study. Graduate clinicians were asked to listen to audio recordings of 70
productions of phonemes / s / and / ɹ / in the initial position of words from students who attended
Key Academy. Repetitions of each recording were allowed once and each graduate clinician was
asked to rate the production as correct or incorrect. Inter-rater reliability for / s / was .84 and .92
for / ɹ /. This demonstrated high interrater reliability under quiet conditions that were free from
distractions. Note that these conditions were not characteristic of judgements made in the school
setting where the study was conducted.
Test Score Reliability. The test administrator scored the pre- and post-assessments and weekly
score sheets. Test sheets were scanned and digitally copied to a secure drive. Raw scores were
added from the protocol scoring pages and each list was checked twice by a graduate researcher.
Entry of scores into excel data files was completed by the graduate researcher and PhD
committee member.
33
Fidelity. The intervention sessions for the 14 participants were staggered throughout the week
(Monday through Thursday). Depending on the number of times a child was seen weekly in
accord with their Individualized Education Program (IEP), the same clinician provided
intervention to the same participant twice weekly but an additional clinician might see the child a
third or fourth day. At least ¼ of the sessions were observed by either the PhD researcher or the
MA supervisor, both holding clinical certification from the American Language-Speech-Hearing
Association (ASHA). While observing, if needed, the fidelity checkers would model the
appropriate teaching technique and provide corrective feedback as needed. No video or written
records of interventions were obtained because of logistics. Multiple sessions occurred
simultaneously throughout the school building with each session lasting only 8 minutes.
However, each clinician-child dyad was observed for part of a session each week by one or both
fidelity checkers.
Analyzing Question Outcomes
Question 1. Visual inspection of graphs of daily probes for the MPF and PP responses for each
subject were used to determine patterns of correct and incorrect responses across time. The mean
number of correct responses for each condition (r MPF, r PP, s MPF, s PP) averaged across the
seven subjects for / s / and / ɹ /, respectively, were tested for significant differences.
Question 2. The mean gain scores for sight words to which subjects were exposed but not directly
taught during treatment using MPF pictures that overlapped picture and print were compared to
the PP words where the printed word was presented separately from the picture. A 2x2 Two-
Factor (pre-post x group; MPF, PP) ANOVA was used to test for condition differences.
34
Question 3. The mean gain scores for phonic patterns to which subjects were exposed during
treatment using MPF pictures (that overlapped picture and print) were compared to the PP words
(where the printed word was presented separately from the picture.) A 2x2 Two-Factor (time x
group; MPF, PP) ANOVA with repeated measures on one factor was conducted to test for
condition differences.
Question 4. A spectrographic analysis was examined for indications of change reflecting more
adult-like productions of speech, including lower 2nd formant frequency and a lower 3rd formant
frequency for / ɹ / productions, and an increase in intensity and spectral centroid for / s /
productions. t-tests were used to compare these values pre- and post-treatment.
35
CHAPTER 5. RESULTS
Fourteen students received an alternating treatments for either a / s / or / ɹ / speech sound
production. There were 7 subjects for each speech sound (i.e., / s / or / ɹ /). Six of the stimulus
training cards were presented as plain pictures and 6 were presented as MorphoPhonic pictures
that provided speech sound cues. At the end of the session, a probe was conducted where the
spontaneous productions elicited for the 12 pictures were judged for correctness of production.
Question 1
The first question asked whether a greater number of correct spontaneous productions
would result when the picture presented a speech production cue (i.e., MPF). If the MPF
condition was more effective for an individual child, we would expect to see MPF words
produced at increasingly higher rates of correct production compared to the PP words across
sessions.
Results for / ɹ /. The seven children receiving treatment for / ɹ / averaged ten sessions
(range 7-12 sessions; �̅� = 10.28, SD = 1.7). Figures 4.1 through 4.7. profile probe results across
11 sessions. Examination of Figure 4.1 shows that correct responses never rose above 2 out of 6
for the plain picture condition (reached twice), while the MPF condition achieved 2 correct three
times, 3 correct once and 4 correct once. The last four sessions showed correct responses were
rising for MPF while the child achieved 0 for the plain print words for the final six sessions.
Figure 4.2. shows that subject r2 made steady progress under both picture conditions, but that
greater accuracy was shown for the MPF pictures for all but two sessions.
Figure 4.1. Profile of subject r1 Figure 4.2. Profile of subject r2
36
Figure 4.3. shows that Subject 3 produced more correct responses (i.e., 5 out of 6) to the MPF
picture for 3 of seven sessions attended while the plain pictures elicited one more correct
response on the final probe. Figure 4.4. showed a higher level of correct responses for 6 of the
sessions for MPF while 5 of the sessions favored the plain pictures.
Figure 4.5. shows an initial advantage for the MPF pictures, achieving 6 out of 6 at session 4 but
then decreasing while plain print held an advantage for three sessions. Both final sessions
favored MPF. Figure 4.6. showed similar variability that started with 6 of 6 correct for both
Figure 4.5. Profile subject r5 Figure 4.6. Profile of subject r6
Figure 4.3. Profile of subject r3 Figure 4.4. Profile of subject r4
37
picture types and then dropped to 0 and then back up to 5. This patterns occurred twice within
the ten sessions. Within this variability, the MPF had a greater number of correct responses (5)
or ties (3) for 8 out of 10 sessions.
Figure 4.7 showed that Subject r7 showed a fairly steady increase in correct responses for
both conditions except for a drop in session 7 for MPF. MPF elicited more correct responses for
the final two sessions. None of these patterns followed the predicted steady increase in correct
productions for either picture condition. To determine if one condition showed overall better
results, the mean gain scores across subjects were compared.
Table 4.1 shows the mean gain for subjects in the MPF and Plain Picture conditions. The
subject means show an advantage to the MPF condition for all seven subjects who accurately
produced the target phoneme an average of 3.23 of 6 productions (SD = 1.14) for MPF. In
contrast, when using PP cards, the same children accurately produced target phonemes an
average of 2.81 of 6 productions (SD = 1.10).
Table 4.1. Mean Number of Correct / ɹ / Productions for Subjects in the MPF and PP Picture Conditions
*condition generating the greatest number of correct productions
Subject r1 r2 r3 r4 r5 r6 r7 Mean StDev
MPF 1.18* 4.27* 4.38* 3.83* 4.22* 2.5* 3.23* 3.23 1.14
PP 0.45 2.75 3.42 3.5 4.11 2.33 2.81 2.81 1.10
Figure 4.7. Profile of subject r7
38
A binomial test measures the probability that a sequence of events will happen by chance
alone. The binomial probability that all seven subjects would produce more correct productions
in response to the MPF stimuli is p < 0.008. This result indicates that the pictured representation
of tongue configuration for / ɹ / productions aided the subjects’ correct production of / ɹ /.
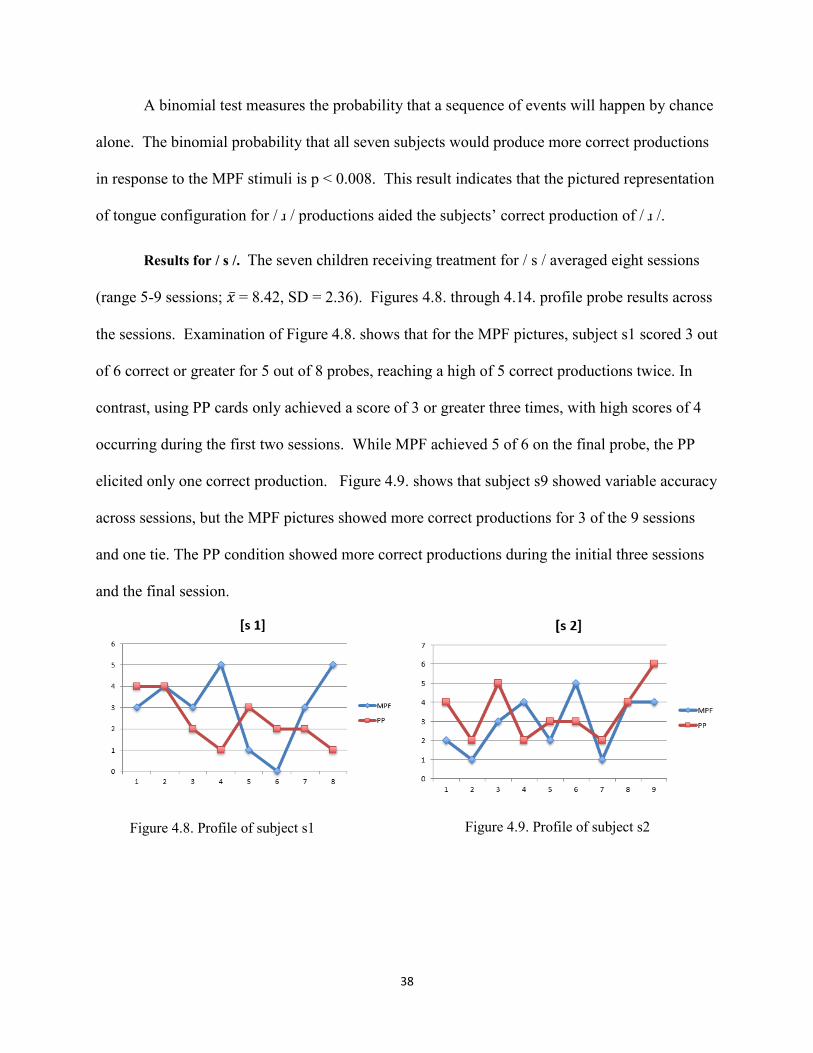
Results for / s /. The seven children receiving treatment for / s / averaged eight sessions
(range 5-9 sessions; �̅� = 8.42, SD = 2.36). Figures 4.8. through 4.14. profile probe results across
the sessions. Examination of Figure 4.8. shows that for the MPF pictures, subject s1 scored 3 out
of 6 correct or greater for 5 out of 8 probes, reaching a high of 5 correct productions twice. In
contrast, using PP cards only achieved a score of 3 or greater three times, with high scores of 4
occurring during the first two sessions. While MPF achieved 5 of 6 on the final probe, the PP
elicited only one correct production. Figure 4.9. shows that subject s9 showed variable accuracy
across sessions, but the MPF pictures showed more correct productions for 3 of the 9 sessions
and one tie. The PP condition showed more correct productions during the initial three sessions
and the final session.
Figure 4.8. Profile of subject s1 Figure 4.9. Profile of subject s2
39
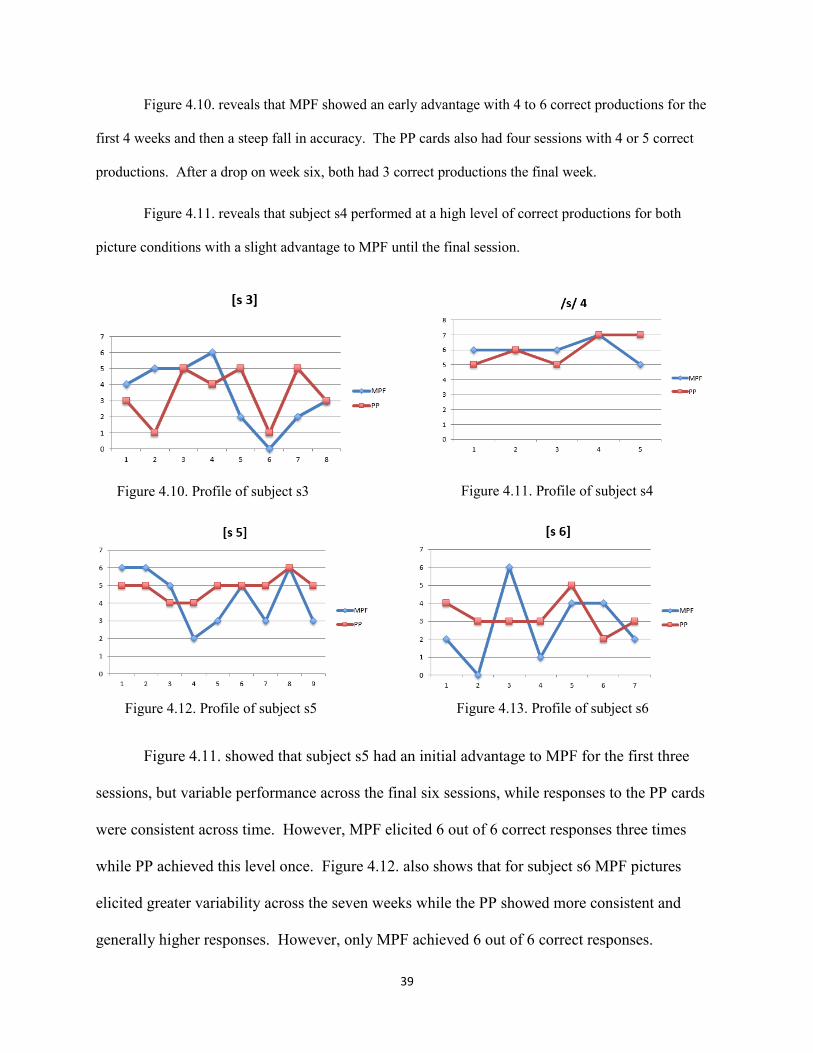
Figure 4.10. reveals that MPF showed an early advantage with 4 to 6 correct productions for the
first 4 weeks and then a steep fall in accuracy. The PP cards also had four sessions with 4 or 5 correct
productions. After a drop on week six, both had 3 correct productions the final week.
Figure 4.11. reveals that subject s4 performed at a high level of correct productions for both
picture conditions with a slight advantage to MPF until the final session.
Figure 4.11. showed that subject s5 had an initial advantage to MPF for the first three
sessions, but variable performance across the final six sessions, while responses to the PP cards
were consistent across time. However, MPF elicited 6 out of 6 correct responses three times
while PP achieved this level once. Figure 4.12. also shows that for subject s6 MPF pictures
elicited greater variability across the seven weeks while the PP showed more consistent and
generally higher responses. However, only MPF achieved 6 out of 6 correct responses.
Figure 4.10. Profile of subject s3 Figure 4.11. Profile of subject s4
Figure 4.12. Profile of subject s5 Figure 4.13. Profile of subject s6
40
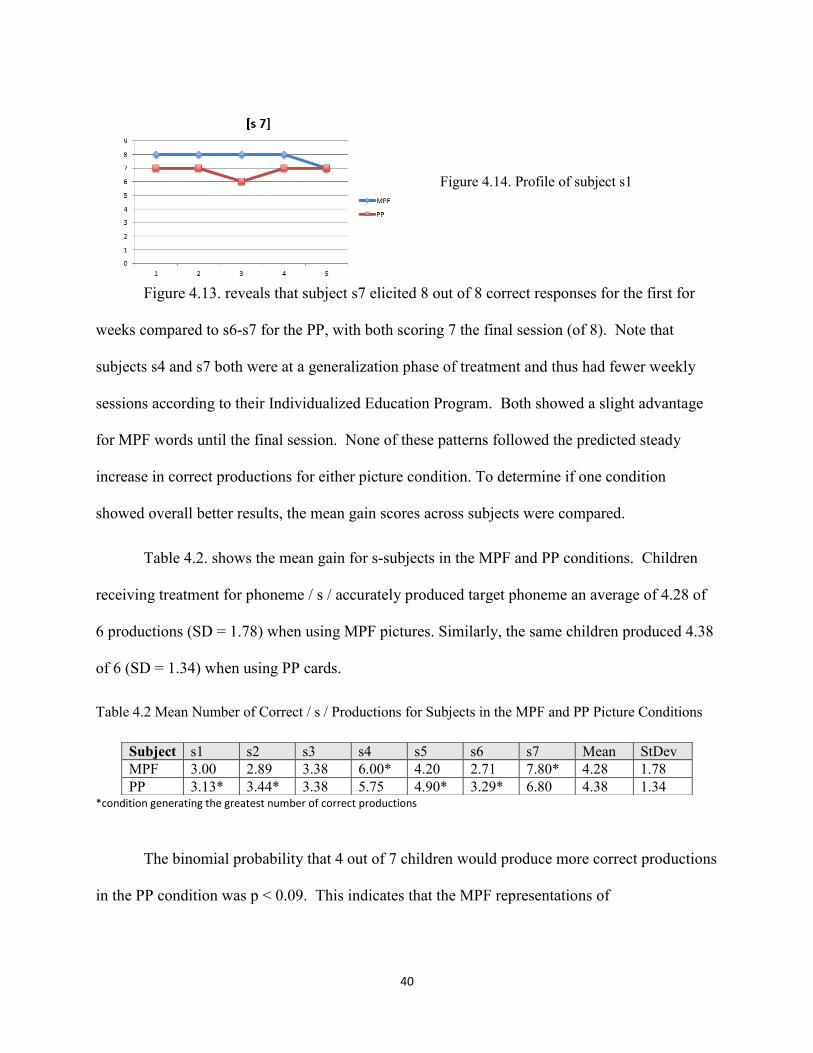
Figure 4.13. reveals that subject s7 elicited 8 out of 8 correct responses for the first for
weeks compared to s6-s7 for the PP, with both scoring 7 the final session (of 8). Note that
subjects s4 and s7 both were at a generalization phase of treatment and thus had fewer weekly
sessions according to their Individualized Education Program. Both showed a slight advantage
for MPF words until the final session. None of these patterns followed the predicted steady
increase in correct productions for either picture condition. To determine if one condition
showed overall better results, the mean gain scores across subjects were compared.
Table 4.2. shows the mean gain for s-subjects in the MPF and PP conditions. Children
receiving treatment for phoneme / s / accurately produced target phoneme an average of 4.28 of
6 productions (SD = 1.78) when using MPF pictures. Similarly, the same children produced 4.38
of 6 (SD = 1.34) when using PP cards.
Table 4.2 Mean Number of Correct / s / Productions for Subjects in the MPF and PP Picture Conditions
*condition generating the greatest number of correct productions
The binomial probability that 4 out of 7 children would produce more correct productions
in the PP condition was p < 0.09. This indicates that the MPF representations of
Subject s1 s2 s3 s4 s5 s6 s7 Mean StDev
MPF 3.00 2.89 3.38 6.00* 4.20 2.71 7.80* 4.28 1.78
PP 3.13* 3.44* 3.38 5.75 4.90* 3.29* 6.80 4.38 1.34
Figure 4.14. Profile of subject s1
41
/ s / production did not improve the subjects’ correction of / s /. The MPF representation for / s /
may have been interpreted as more of a cue to the auditory “hissiness” of the / s / and cue to
tongue placement at the alveolar ridge with a central tongue groove. Thus, children may have
perceived that they were producing the pictured sound as opposed to a distortion with similar
characteristics. This finding may attribute to the acoustic increase in intensity discussed later in
spectral analysis.
Summary. For Question 1 we predicted an advantage to MPF pictures because the faces provided
speech production cues that could prompt articulatory placement. All seven of the subjects
showed greater production accuracy with MPF pictures for the / ɹ / phoneme, an occurrence that
was unlikely to occur by chance alone. However, only three of the subjects showed greater or
equal accuracy with MPF pictures for the / s / phoneme, suggesting the picture cue didn’t
sufficiently prompt important features critical to an accurate production of / s /.
Question 2
For the second question we asked whether subjects would recognize more sight words to which
they were exposed via the MPF picture words compared to the PP pictures accompanied by the
printed words. If the spelling of the words superimposed into the pictures on the MPF resulted in
incidental learning without direct instruction, greater gain scores from pretest to posttest in favor
of the MPF words would be expected.
Table 4.3. profiles the number of sight words recognized at pretest and posttest for words
subjects were exposed to as MPF words and PP words. The means showed the subjects knew
more MPF words at pretest, more PP words at posttest, with a total score higher for MPF words.
The differences in all cases are small.
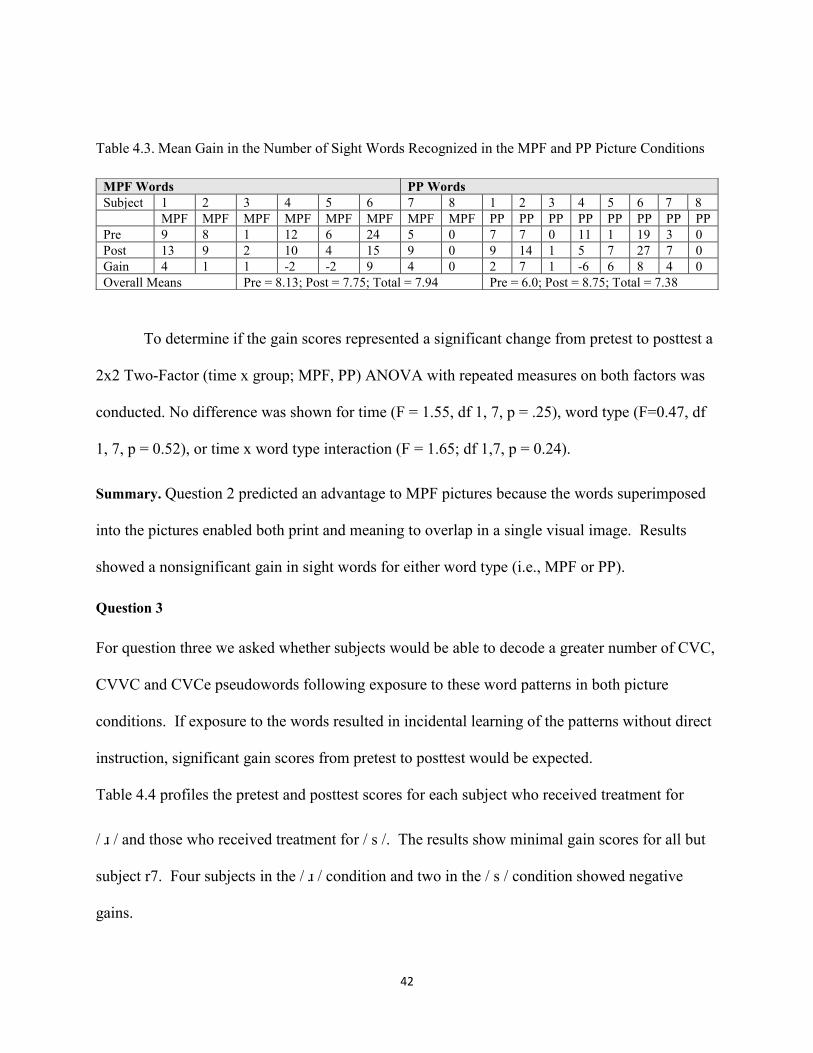
42
Table 4.3. Mean Gain in the Number of Sight Words Recognized in the MPF and PP Picture Conditions
To determine if the gain scores represented a significant change from pretest to posttest a
2x2 Two-Factor (time x group; MPF, PP) ANOVA with repeated measures on both factors was
conducted. No difference was shown for time (F = 1.55, df 1, 7, p = .25), word type (F=0.47, df
1, 7, p = 0.52), or time x word type interaction (F = 1.65; df 1,7, p = 0.24).
Summary. Question 2 predicted an advantage to MPF pictures because the words superimposed
into the pictures enabled both print and meaning to overlap in a single visual image. Results
showed a nonsignificant gain in sight words for either word type (i.e., MPF or PP).
Question 3
For question three we asked whether subjects would be able to decode a greater number of CVC,
CVVC and CVCe pseudowords following exposure to these word patterns in both picture
conditions. If exposure to the words resulted in incidental learning of the patterns without direct
instruction, significant gain scores from pretest to posttest would be expected.
Table 4.4 profiles the pretest and posttest scores for each subject who received treatment for
/ ɹ / and those who received treatment for / s /. The results show minimal gain scores for all but
subject r7. Four subjects in the / ɹ / condition and two in the / s / condition showed negative
gains.
MPF Words PP Words
Subject 1 2 3 4 5 6 7 8 1 2 3 4 5 6 7 8
MPF MPF MPF MPF MPF MPF MPF MPF PP PP PP PP PP PP PP PP
Pre 9 8 1 12 6 24 5 0 7 7 0 11 1 19 3 0
Post 13 9 2 10 4 15 9 0 9 14 1 5 7 27 7 0
Gain 4 1 1 -2 -2 9 4 0 2 7 1 -6 6 8 4 0
Overall Means Pre = 8.13; Post = 7.75; Total = 7.94 Pre = 6.0; Post = 8.75; Total = 7.38
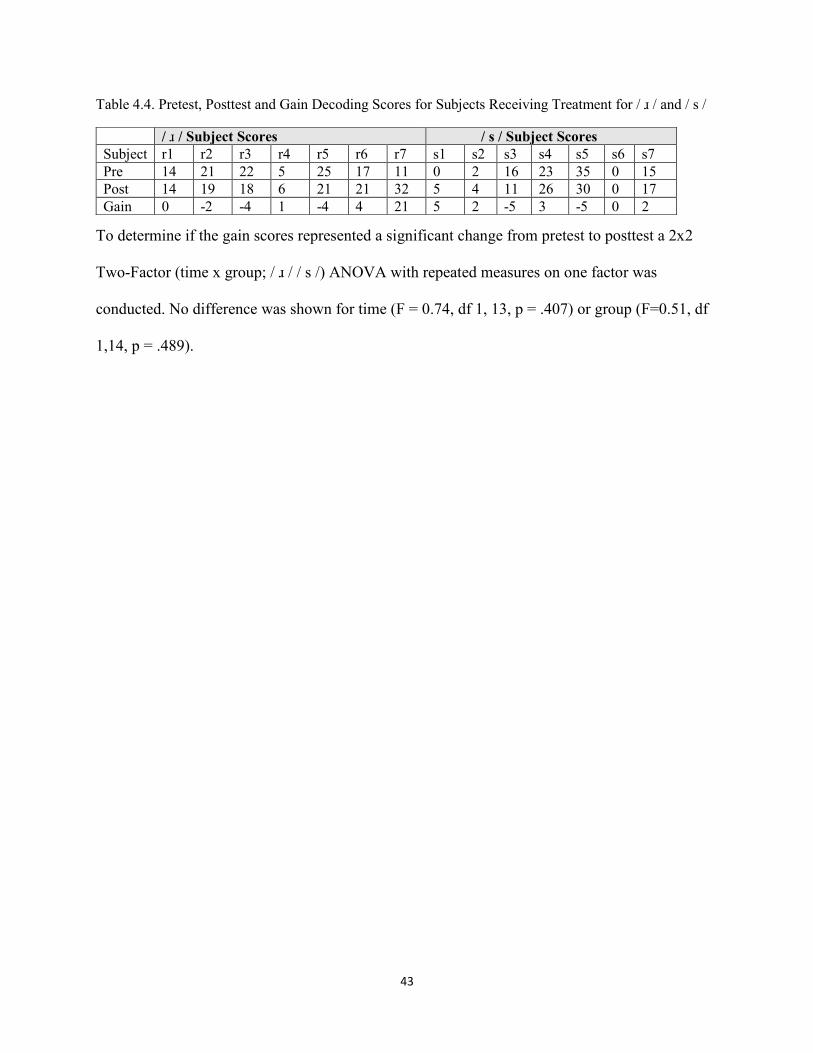
43
Table 4.4. Pretest, Posttest and Gain Decoding Scores for Subjects Receiving Treatment for / ɹ / and / s /
To determine if the gain scores represented a significant change from pretest to posttest a 2x2
Two-Factor (time x group; / ɹ / / s /) ANOVA with repeated measures on one factor was
conducted. No difference was shown for time (F = 0.74, df 1, 13, p = .407) or group (F=0.51, df
1,14, p = .489).
/ ɹ / Subject Scores / s / Subject Scores
Subject r1 r2 r3 r4 r5 r6 r7 s1 s2 s3 s4 s5 s6 s7
Pre 14 21 22 5 25 17 11 0 2 16 23 35 0 15
Post 14 19 18 6 21 21 32 5 4 11 26 30 0 17
Gain 0 -2 -4 1 -4 4 21 5 2 -5 3 -5 0 2
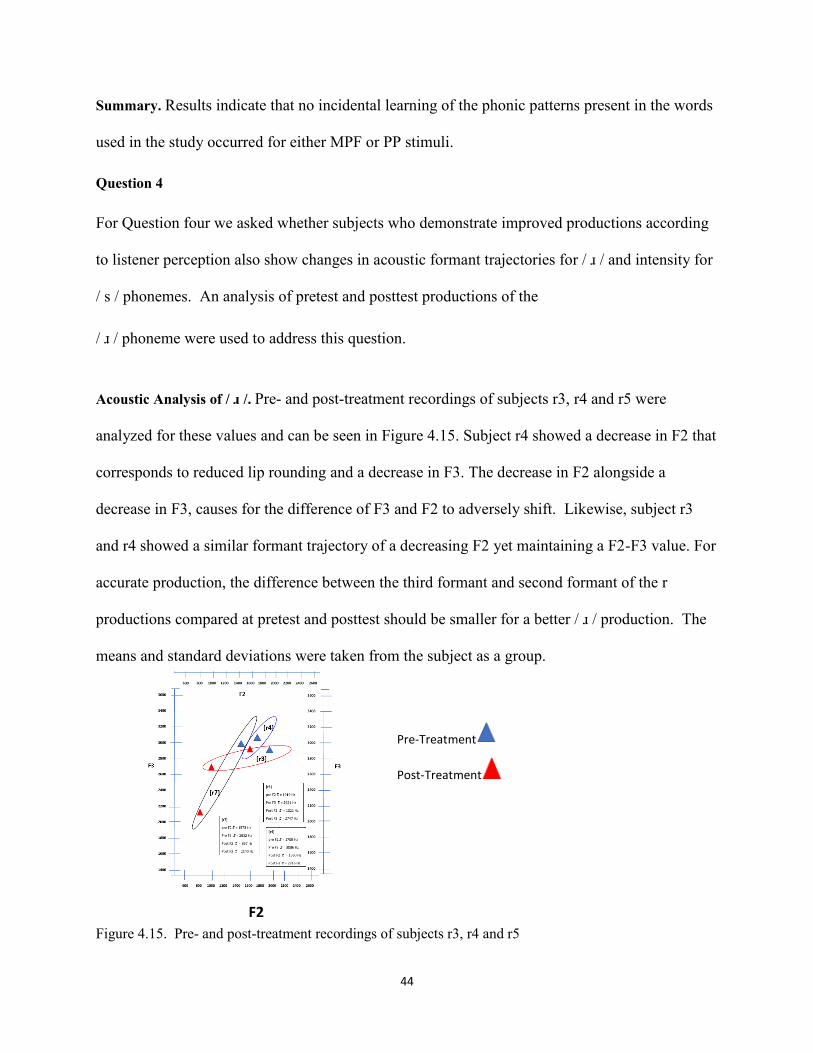
44
Summary. Results indicate that no incidental learning of the phonic patterns present in the words
used in the study occurred for either MPF or PP stimuli.
Question 4
For Question four we asked whether subjects who demonstrate improved productions according
to listener perception also show changes in acoustic formant trajectories for / ɹ / and intensity for
/ s / phonemes. An analysis of pretest and posttest productions of the
/ ɹ / phoneme were used to address this question.
Acoustic Analysis of / ɹ /. Pre- and post-treatment recordings of subjects r3, r4 and r5 were
analyzed for these values and can be seen in Figure 4.15. Subject r4 showed a decrease in F2 that
corresponds to reduced lip rounding and a decrease in F3. The decrease in F2 alongside a
decrease in F3, causes for the difference of F3 and F2 to adversely shift. Likewise, subject r3
and r4 showed a similar formant trajectory of a decreasing F2 yet maintaining a F2-F3 value. For
accurate production, the difference between the third formant and second formant of the r
productions compared at pretest and posttest should be smaller for a better / ɹ / production. The
means and standard deviations were taken from the subject as a group.
Figure 4.15. Pre- and post-treatment recordings of subjects r3, r4 and r5
Pre-Treatment
Post-Treatment
F2
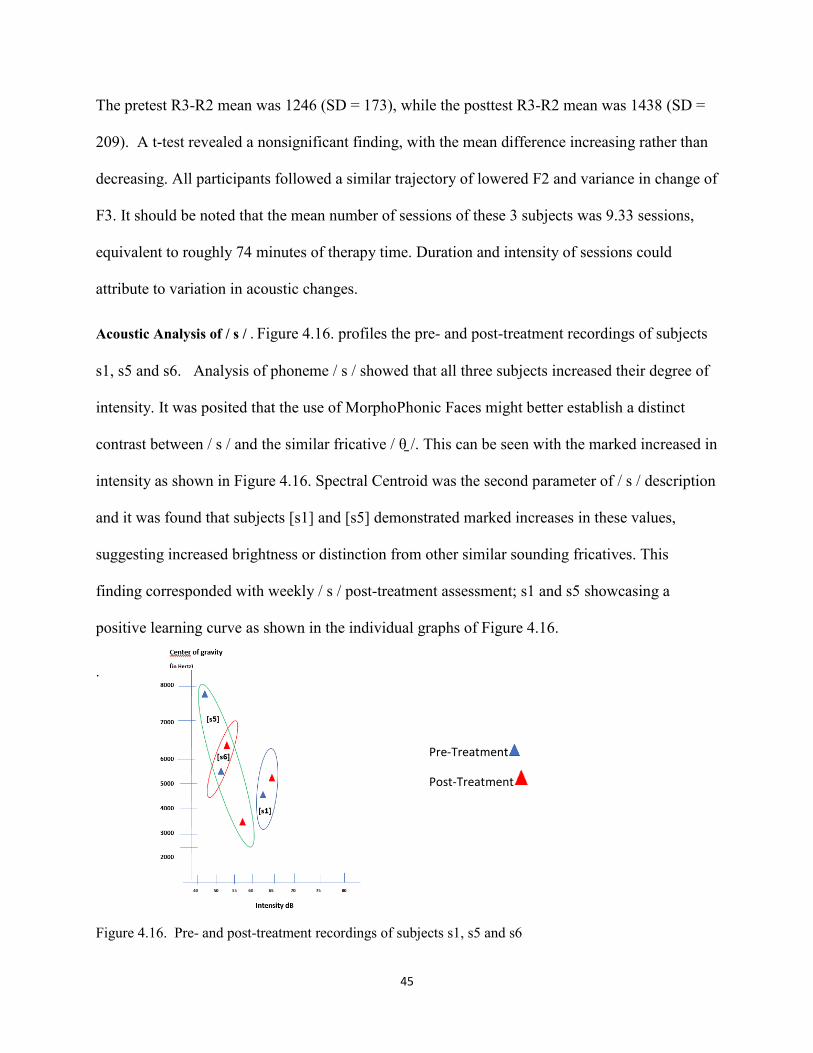
45
The pretest R3-R2 mean was 1246 (SD = 173), while the posttest R3-R2 mean was 1438 (SD =
209). A t-test revealed a nonsignificant finding, with the mean difference increasing rather than
decreasing. All participants followed a similar trajectory of lowered F2 and variance in change of
F3. It should be noted that the mean number of sessions of these 3 subjects was 9.33 sessions,
equivalent to roughly 74 minutes of therapy time. Duration and intensity of sessions could
attribute to variation in acoustic changes.
Acoustic Analysis of / s / . Figure 4.16. profiles the pre- and post-treatment recordings of subjects
s1, s5 and s6. Analysis of phoneme / s / showed that all three subjects increased their degree of
intensity. It was posited that the use of MorphoPhonic Faces might better establish a distinct
contrast between / s / and the similar fricative / θ ̠/. This can be seen with the marked increased in
intensity as shown in Figure 4.16. Spectral Centroid was the second parameter of / s / description
and it was found that subjects [s1] and [s5] demonstrated marked increases in these values,
suggesting increased brightness or distinction from other similar sounding fricatives. This
finding corresponded with weekly / s / post-treatment assessment; s1 and s5 showcasing a
positive learning curve as shown in the individual graphs of Figure 4.16.
.
Figure 4.16. Pre- and post-treatment recordings of subjects s1, s5 and s6
Pre-Treatment
Post-Treatment
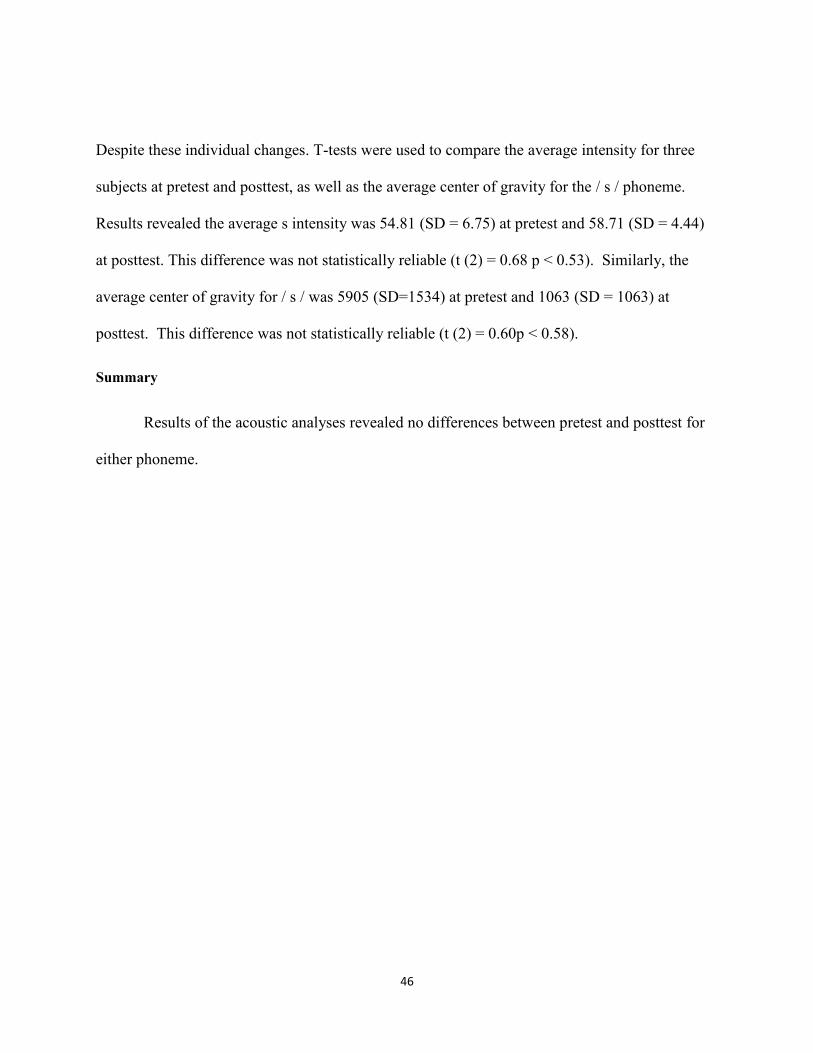
46
Despite these individual changes. T-tests were used to compare the average intensity for three
subjects at pretest and posttest, as well as the average center of gravity for the / s / phoneme.
Results revealed the average s intensity was 54.81 (SD = 6.75) at pretest and 58.71 (SD = 4.44)
at posttest. This difference was not statistically reliable (t (2) = 0.68 p < 0.53). Similarly, the
average center of gravity for / s / was 5905 (SD=1534) at pretest and 1063 (SD = 1063) at
posttest. This difference was not statistically reliable (t (2) = 0.60p < 0.58).
Summary
Results of the acoustic analyses revealed no differences between pretest and posttest for
either phoneme.
47
CHAPTER 6. DISCUSSION
This study examined the effects of two picture types on the speech sound productions of
children with dyslexia and comorbid misarticulations of the / s / and / ɹ / phonemes. Two
premises were assumed in the choice of MorphoPhonic Faces as a picture type that may hold
advantages over the traditional plain picture cards. The first is that the onset phoneme of a word
is pictured as a face with the letter representing key speech production features such as tongue
placement (for both / s / and / ɹ /) and manner as in the waving line to indicate tumbling air
emanating from between the teeth of the / s / face. The second is that the MPF cards establish an
association between speech sound production and literacy. Letters represent the position of
articulators, and thus promote letter-sound associations. Letters are also superimposed with
pictures suggesting the meaning of the words for the rime elements, a format that in previous
studies has shown positive outcomes for sight word learning (McInnis, 2008; Powell, Hartman,
Hoffman, & Norris, 2007; Terrell, 2007; Williams, 2013). Finally, the words practiced within
each session all conformed to either a common short vowel pattern (CVC or CVCC) or a long
vowel pattern (CVVC or CVCe) that could be exploited by talking about the patterns and
examining them in the word spelling as part of the lesson. These advantages could be beneficial
to the many children with concomitant reading disabilities and speech sound disorders, including
the children with dyslexia in this study.
The first question of this study asked whether the speech production cues provided by the
MPF pictures would prompt more accurate speech productions than traditional articulation
pictures. All 14 subjects received both types of pictures during the same treatment session, with
six MPF and six PP stimulus cards. The results for this question were mixed. All seven children
produced a greater number of correct / ɹ / productions in response to the MPF pictures than the
48
PP pictures. In contrast, no advantage was found for the MPF pictures for the / s / phoneme.
One explanation is that a common substitution for / ɹ / is the /w/ phoneme. The picture for the
MPF / ɹ / depicts the side of the tongue positioned toward the back of the mouth with the tongue
tip elevated. This does not resemble the position of the /w/ phoneme and following a few
demonstrations of the differences by the clinician, the picture alone may prompt recognition. In
addition, the character’s name, Arlene, was used to help children find the correct tongue tip
elevation because the transition from the / ɹ / to the /l/ phonemes when saying the name guided
the / ɹ / into the tongue tip elevated position.
In contrast, the MPF picture was less successful in cuing the correct production for the / s
/ phoneme. The MPF shows the tongue high in the mouth directing the airstream past the teeth,
thus providing placement and manner cues. However, unlike the /w/ - / ɹ / contrast, most error
productions for / s /, such as /θ/ or a distortion of / s /, are similarly produced as fricatives with
high front tongue placement. The MPF does not picture the central tongue groove characteristic
of a correct / s / production. The four students who had fewer correct productions for MPF / s /
were highly variable in their accuracy, with profiles that fluctuated between 0 to 6 correct across
sessions while showing more stable productions for PP. More research is needed to more
definitively determine whether pictured speech production cues facilitate correct articulation and
if there is a differential effect between phonemes.
The second question asked whether greater sight word learning would occur for the MPF
words without direct instruction. The overlapping print and pictures depicting the word meaning
were a prominent part of the picture cue in the MPF condition and have been shown to prompt
word recognition in children as young as two (McInnis, 2008). Both picture types additionally
presented the printed word in the top right hand corner of the card. In this study, despite repeated
49
exposure to the printed words, results showed that students failed to acquire significantly more
sight words for either the MPF or PP words to which they were exposed. However, two
important differences between this study and others (McInnis, 2008; Powell, Hartman, Hoffman,
& Norris, 2007; Terrell, 2007; Williams, 2013) are time and direct instruction. For example,
McInnis provided explicit direct instruction on the same 16 words (8 MPF and 8 PP) during 15-
20 minute sessions three times weekly for 6 weeks (i.e., 18 sessions). That totaled 4.5 to 6 hours
of focused sight word learning instruction. In contrast, subjects in this study received 5 to 12
treatment sessions of approximately 8 minutes each, for a total of 40 to 96 minutes focused on
articulation. Furthermore, the picture set was changed each week so the 6 MPF and 6 PP words
were only seen 2 to 4 times (16 to 32 minutes of incidental exposure). Future studies need to
explore sight word learning concomitant with articulation therapy under conditions of longer
sessions, direct focus on both articulation and sight words, and consistent exposure to the same
words across time.
Similar considerations also pertain to the third question, or whether incidental learning of
orthographic patterns would occur as a result of exposure to words following short and long
vowel patterns. The patterns were present in all of the word cards but were not highlighted or
explained. Therefore, it would have been surprising if children noticed, learned and generalized
the patterns at posttest. Only one subject, who also made the greatest change in articulation of
the / ɹ / phoneme, made a notable change in decoding. Seven of the children made no gain or
decreased in decoding nonsense words, a finding that is not surprising for students with dyslexia.
The fourth question asked whether improved speech sound productions according to
listener perception would show similar changes in a spectrographic analysis of pretest and
posttest speech samples. The results from the six subjects were nonsignificant. For production of
50
/ ɹ /, frequencies F2 and F3 were analyzed for changes that would indicate increased rhoticity.
For all three subjects, F2 and F3 values simultaneously decreased. Ideally, as one formant
decreases, the other would increase so that the difference between F2 and F3 values became
smaller; conversely, the opposite occurred. Subjects r3, r4, and r5 showed decreases in both F2
and F3 values. Thus, positive spectral changes in production accuracy were not achieved.
According to the literature, / ɹ / is notoriously difficult to acquire with its emergence beginning at
age three to mastery occurring at age six (Smit et al., 1990). Distortion of / ɹ / is common among
adolescents who display residual speech errors despite years of therapy (Preston & Edwards,
2007). Given the typical amount of time needed to master this speech sound, it follows that
approximately nine sessions of articulation treatment would be unlikely to result in changes that
generalized from the treatment session to the spontaneous speech sample used for the acoustic
analysis. This suggests that an increase in duration and intensity of treatment would be required
to facilitate a lasting and stable production of /r.
In contrast, the values analyzed for production of / s / demonstrated minimal, though
positive acoustic changes. Intensity and Spectral centroid values increased for all three subjects
and showed that overall treatment, both PP and MPF, facilitated a positive, though not
statistically significant, learning curve for accurate / s / production. Though the MPF
demonstrated limitations in visual representation of the lingual central groove, the wavy line
image provided a cue that could explain the increase of intensity during / s / productions. Similar
to / ɹ /, more sessions would be needed to identify a stable acoustic pattern of sound productions.
Limitations
Setting. The school where the study took place provides articulation therapy to students
via a supervisor and student clinicians from the university. This provided a sizable population of
51
subjects who had Individualized Education Programs for either the / ɹ / or / s / phoneme. All
students received individual therapy focused on the target sound. However, it also imposed
restrictions. The school used the 10-minute articulation treatment model that generally
amounted to 8 minutes of actual treatment including the probe. Treatment took place in the
hallway outside of classrooms throughout the school. Several sessions took place
simultaneously and so monitoring for fidelity was difficult. The typical interruptions found in
schools occurred with relative frequency, including announcements, bells, distracting noises, and
students in the hallway during transitions and bathroom breaks. Students were seen for two-to-
four sessions weekly based on their Individual Education Programs, with those displaying higher
levels of correct productions receiving less time. This school is a 12-month school, designed to
lessen the effects of long vacations on retaining learning for children with dyslexia. However,
this results in breaks of one to two weeks distributed across the school year so it was not possible
to provide treatment for longer than four weeks. Although efforts were made to find quiet
locations for pre- and post-testing, for many subjects the available rooms were shared and noise
and distractions were issues. Each of these factors presented potential threats to the reliability of
findings.
Clinicians. The clinicians who implemented the treatment were nine masters students
completing a supervised practicum, including six who were participating in their first clinical
experience. Before the study began, training was provided to judge speech sound productions
for correctness. Although this resulted in high interrater reliability, these judgments were made
in a quiet environment using audio recordings. Making these judgements in a potentially noisy
and distracting environment to children with variable attention to the task increased the
52
possibility of error in judgements, especially with inexperienced raters (Munson, Johnson, &
Edwards, 2012).
The clinicians also were provided training in the procedures, including watching a
videotape, receiving written instructions, and receiving modeling with their child from the
researcher. However, clinicians differed in skill levels, enthusiasm, and ability to elicit speech
sounds from children who were not stimulable during treatments. Although one researcher and a
supervisor were present to model, provide feedback, and reinstruct as needed, the eight-minute
sessions did not allow for one-to-one supervision of the nine masters students daily. In addition,
clinicians were scheduled for either Monday-Wednesday or Tuesday-Thursday sessions at the
school. Therefore, 12 of the 14 subjects were seen by two different clinicians during the week,
potentially introducing inconsistency of treatment implementation.
Sight Word Task Administration. Two issues may have contributed to the finding that
several subjects decreased word recognition at posttest. First, the 48 words used in treatment
plus 16 control words presented a challenging task for children with dyslexia. The words were
printed on a single page with four columns of 16 words printed in 24-point font. This many
words may have been visually distracting and overwhelming to a child with dyslexia. Individual
flash cards may have elicited responses that were more reliable.
Secondly, during pretesting the researcher administered some of the sight word tests to
subjects while the clinicians administered others due to time constraints. The task required
subjects to read the word lists without prompts within three seconds per word. The finding that
several scores at posttest decreased from pretest suggests that clinicians may have allowed more
than three seconds, thus allowing time for subjects to decode the words.
53
CHAPTER 7. FUTURE STUDIES
Given the short period of treatment with minimal total minutes (ranging from 40 to 92
minutes) and the many potential threats to reliability and validity, this study should be
considered a pilot study. All of the procedures, materials, and measures were unique to this
study and were generated by the student researcher and mentor within the semester of the study,
precluding an early start to the treatment and leaving only five weeks to pretest subjects and
implement four weeks of treatment before the student clinician practicum was over. It is
encouraging that despite the many challenges encountered, participants receiving treatment for /
ɹ / showed higher levels of production for MPF pictures on daily probes. The study revealed
several changes that could be implemented to explore the questions of this study in the future
with greater fidelity. These include:
a) Implementing the study for a minim duration of six weeks;
b) Lengthening sessions to minimally 30 minutes;
c) Maintaining the same clinician for all treatment sessions across subjects;
d) Providing a longer period of training prior to study initiation;
e) Implementing the study with fewer subjects in a clinical setting where noise and other
distractions can be better controlled;
f) Weekly recordings of speech sound productions from both stimulus types for acoustic
analysis;
g) Establishing a baseline of the subjects’ speech sound productions before
implementing treatment, including a more complete description of the type(s) of
errors exhibited and level of stimulability;
54
h) Providing direct instruction to both speech sound productions and print during the
session.
Concluding remarks
This pilot study showed indications that the use of speech production cues aided in the
production of word initial / ɹ / over the span of 4 weeks of 8-minute intervention sessions. The
duration of treatment was not long enough to produce a stable and positive acoustic change;
however, the results are promising for both / s / and / ɹ / given that mean changes demonstrated a
perceptual change in production accuracy. A future study is needed to explore the efficacy of
picture placement cues needed for remediation of / s /. In addition, a study that explores the
effects of longer treatment implementation with greater control over external factors to further
explore the efficacy of pictured speech production cues in speech sound remediation is
warranted.
55
CHAPTER 8. REFERENCES
Abdelatty, A.M.A, Ali; J. Van der Spiegel, J. & Muelle, P. (1998). An acoustic-phonetic
feature-based system for the automatic recognition of fricative consonants. In
Proceedings of the 1998 IEEE International Conference on Acoustics, Speech and Signal
Processing, ICASSP '98(2), 961-964.
Beck, I., McKeowen, M., & Kucan, L. (2002). Bringing Words to Life. NY: Guilford Press
Bird, J., Bishop, D. V. M., & Freeman, N. H. (1995). Phonological awareness and literacy
development in children with expressive phonological impairments. Journal of Speech,
Language, and Hearing Research, 38, 446–462. doi:10.1044/jshr.3802.446.
Bishop, D. V. M., & Adams, C. (1990). A prospective study of the relationship between specific
language impairment, phonological disorders and reading retardation. Journal of Child
Psychology and Psychiatry, 31(7), 1027-1050.
Castiglioni-Spalten, M.L., & Ehri, L.C. (2003). Phonemic awareness instruction: Contribution of
articulatory segmentation to novice beginners’ reading and spelling. Scientific Studies of
Reading, 7, 25-52.
Catts, H.W. (1993). The relationship between speech‐language impairments and reading
disabilities. Journal of Speech and Hearing Research, 36, 948–958.
Conti-Ramsden, G., Botting, N., & Faragher, B. (2001). Psycholinguistic markers for specific
language impairment (SLI). Journal of Child Psychology and Psychiatry and Allied
Disciplines, 42, 741–748.
Cunningham, A.E., & Stanovich, K.E. (1998). Early reading acquisition and its relation to
reading experience and ability 10 years later. Developmental Psychology, 33, 934–945.
Dalston R. (1975). Acoustic characteristics of English /w,r,l/ spoken correctly by young children
and adults. Journal of the Acoustical Society of America (57). 462–469.
56
Denne, M., Langdown, N., Pring, T., & Roy, P. (2004). Treating children with expressive
phonological disorders: does phonological awareness therapy work in the clinic?
International Journal of Language & Communication Disorders. 40, 493-504.
Durand, V. N., Loe, I. M., Yeatman, J. D., & Feldman, H. M. (2013). Effects of early language,
speech, and cognition on later reading: a mediation analysis. Frontiers in psychology, 4-
11.
Edwards, M. L. (1992). In support of phonological processes. Language, Speech and Hearing
Services in Schools, 23, 233–240.
Edwards, M. L., & Shriberg, L. D. (1983). Phonology: Applications in communicative
disorders. San Diego, CA: College-Hill Press.
Ehri, L. C., Nunes, Willows, D. M., Schuster, B. V., Yaghoub-Zadeh, Z., & Shanahan, T. (2001).
Phonemic awareness instruction helps children learn to read: Evidence from the
National Reading Panel’s meta-analysis. Reading Research Quarterly, 36, 250-287.
Elbro, C., Borstrom, I., and Peterson, .DK.(1998). Predicting dyslexia from kindergarten: The
importance of distinctness of phonological representations of lexical items. Reading
Research Quarterl, 33,1,36–60.
Espy-Wilson, C. Y., Boyce, S. E., Jackson, M., Narayanan, S., & Alwan, A. (2000). Acoustic
modeling of American English/r. The Journal of the Acoustical Society of America,
108(1), 343-356.
Flipsen Jr, P., Shriberg, L., Weismer, G., Karlsson, H., & McSweeny, J. (1999). Acoustic
characteristics of/ s /in adolescents. Journal of Speech, Language, and Hearing Research,
42(3), 663-677.
Hesketh, A., Adams, C., Nightingale, C., & Hall, R. (2005). Phonological awareness therapy and
articulatory training approaches for children with phonological disorders: a comparative
outcome study. International Journal of Language & Communication Disorders. 35,
337-354.
Hoffman, P.R., Stager, S., & Daniloff, R.G. (1983). Perception and Production of Misarticulated
/r/. Journal of Speech, Language and Hearing Association, 48, 210-215.
57
Holliday, J. J., Reidy, P. F., Beckman, M. E., & Edwards, J. (2015). Quantifying the robustness
of the English sibilant fricative contrast in children. Journal of Speech, Language, and
Hearing Research, 58(3), 622-637.
Gallagher, A., Frith, U., & Snowling, M.J. (2000). Precursor to literacy delay among children at
genetic risk of dyslexia. Journal of Child Psychology and Psychiatry, 41, 202–213.
Gillon, G., & Dodd, B. (1995). The Effects of Training Phonological, Semantic, and Syntactic
Processing Skills in Spoken Language on Reading Ability. Language, Speech, and
Hearing Services in Schools, 26, 58-68. doi:10.1044/0161-1461.2601.58
Gosse, C.S., Hoffman, L.M., & Invernizzi, M.A. (2012). Overlap in speech-language and reading
services for kindergartners and first graders. Language, Speech, and Hearing Services in
Schools, 43, 66-80. doi:10.1044/0161-1461(2011/10-0056)
Goswami U (2001), Early phonological development and the acquisition of literacy. In S.
Neuman and D. Dickinson (Eds), Handbook of Research in Early Literacy for the 21st
Century, 111-125
Justice. L. M. (2006). Evidence-based practice, response to intervention, and the prevention of
reading difficulties. Language, Speech, and Hearing Services in Schools, 37, 284-297.
doi:10.1044/0161-1461(2006/033)
Kaufman, E., Norris, J.A., & Hoffman, P.R. ASHA convention, Boston, MA, November 2007.
Kilminster, M.G., & Laird, M.M. (1978) Articulation Development in Children Aged Three to
Nine Years, Australian Journal of Human Communication Disorders, 6:1, 23-30, DOI:
10.3109/asl2.1978.6.issue-1.04
Larrivee, L. S., & Catts, H. W. (1999). Early reading achievement in children with expressive
phonological disorders. American Journal of Speech-Language Pathology, 8, 118-128.
doi:10.1044/1058-0360.0802.118
58
Leitao, S., & Fletcher, J. (2004). Literacy outcomes for students with speech impairment: Long-
term follow-up. International Journal of Language and Communication Disorders, 39,
245–256.
Lewis, B. A., & Freebairn, L. (1992). Residual effects on preschool phonology disorders in grade
school, adolescence, and adulthood. Journal of Speech, Language, and Hearing
Research, 35, 819-831. doi:10.1044/jshr.3504.819.
Lyon, G. R., Shaywitz S. E., & Shaywitz, B. A. (2003). A definition of dyslexia. Annals of
Dyslexia, 53, 1, 1-14.
Mann, V. A., & Ditunno, P. (1990). Phonological deficiencies: Effective predictors of future
reading problems. In G. Pavlides (Ed.), Perspectives on dyslexia, 2, 105-131).
McGowan, R. S., Nittrouer, S., & Manning, C. J. (2004). Development of [j] in young,
midwestern, American children. The Journal of the Acoustical Society of America,
115(2), 871-84.
Metsala, J.L. (1999). Young children’s phonological awareness and non-word repetition as a
function of vocabulary development. Journal of Educational Psychology, 91(1):3
Morais, J. (1991). Constraints on the development of phonemic awareness. In Brady, S. &
Shankweiler, D. (Eds.), Phonological process in literacy (pp. 5–27). Hillsdale, NJ:
Lawrence Erlbaum Associates.
Munson, B., Johnson, J.M., & Edwards, J. (2012). The Role of Experience in the Perception of
Phonetic Detail in Children’s Speech: A Comparison between Speech-Language
Pathologists and Clinically Untrained Listeners. American Journal of Speech-Language
Pathology, (21), 124-139). https://doi.org/10.1044/1058-0360(2011/11-0009)
Nettleton, S., & Hoffman, P.R. Comparison of Phonic Faces vs Animated Literacy Alphabets in
Preschool Phonological Intervention. ASHA convention, Miami, FL, November 2006.
59
Nagy, W. (2005). Why vocabulary instruction needs to be long-term and comprehensive. In E. H.
Hiebert and M. L. Kamil (Eds.), Teaching and learning vocabulary: Bringing research to
practice (pp. 27–44). Mahwah, NJ: Lawrence Erlbaum.
Norris, J. A. (2001). Phonic faces cards. Baton Rouge, LA: Elementory.
Overby, M. S., Trainin, G., Bosma Smit, A., Bernthal, J. E., & Nelson, R. (2012). Preliteracy
speech sound production skill and later literacy outcomes: A study using the Templin
Archive. Language, Speech, and Hearing Services in Schools, 43, 97-115.
doi:10.1044/0161-1461(2011/10-0064)
Perfetti, C. A., & Hart, L. (2002). The lexical quality hypothesis. In L. Vehoeven. C. Elbro, & P.
Reitsma (Eds.), Precursors of functional literacy (pp. 189-213). Amsterdam/Philadelphia:
John Benjamins.
Pieretti, R.A., Kaul, S.D., & Zarchy, R.M. (2014) Using a Multimodal Approach to Facilitate
Articulation, Phonemic Awareness, and Literacy in Young Children. Communication
Disorders Quarterly, 36, 131–141. https://doi.org/10.1177/1525740114545360
Preston, J.L., & Edwards, M.L. (2007). Phonological Processing Skills of Adolescents with
Residual Speech Sound Errors. Language, Speech & Hearing Services in Schools, 38,
297-308.
Preston, J.L., & Edwards, M.L. (2010). Phonological awareness and speech error types in
preschoolers with speech sound disorders. Journal of Speech, Language and Hearing
Research, 53, 44-60.
Raitano, N. A., Pennington, B. F., Tunick, R. A., Boada, R., & Shriberg, L. D. (2004). Pre-
literacy skills of subgroups of children with speech sound disorders. Journal of Child
Psychology and Psychiatry, 45, 821–835.
Rvachew S. (2007). Phonological Processing and Reading in Children with Speech Sound
Disorders. American Journal of Speech-Language Pathology,16(3), 260–270.
Sander, E.K. (1972). When are speech sounds learned? Journal of Speech, Language, and
Hearing Research (37), 55–63.
60
Scarborough, H.S. (1990). Very early language deficits in dyslexic children. Child
Development, 61, 1728–1743.
Smit, A.B., Hand, L, Freilinger, J.J., Bernthal, J.E., & Bird, A. (1990). The Iowa articulation
norms and its Nebraska replication. Journal of Speech, Language and Hearing Disorders,
55, 779–798.
Stevens, K. N. (1999). Acoustic Phonetics MIT Press, Cambridge, MA.
Stothard, S. E., Snowling, M. J., Bishop, D. V. M., Chipchase, B. B., & Kaplan, C. A. (1998).
Language-impaired preschoolers: A follow-up into adolescence. Journal of Speech,
Language, and Hearing Research, 41, 407–418.
Sutherland, D. & Gillon, G. T. (2007). Development of phonological representations and
phonological awareness in children with speech impairment. International Journal of
Language and Communication Disorders, 42, 2, 229-250.
Swan, D., & Goswami, U. (1997). Phonological awareness deficits in developmental dyslexia
and the phonological representations hypothesis. Journal of Experimental Child
Psychology, 66, 18–41.
Teinonen, T., Aslin, R. N., Alku, P., & Csibra, G. (2008). Visual speech contributes to phonetic
learning in 6-month-old infants. Cognition, 108, 850–855.
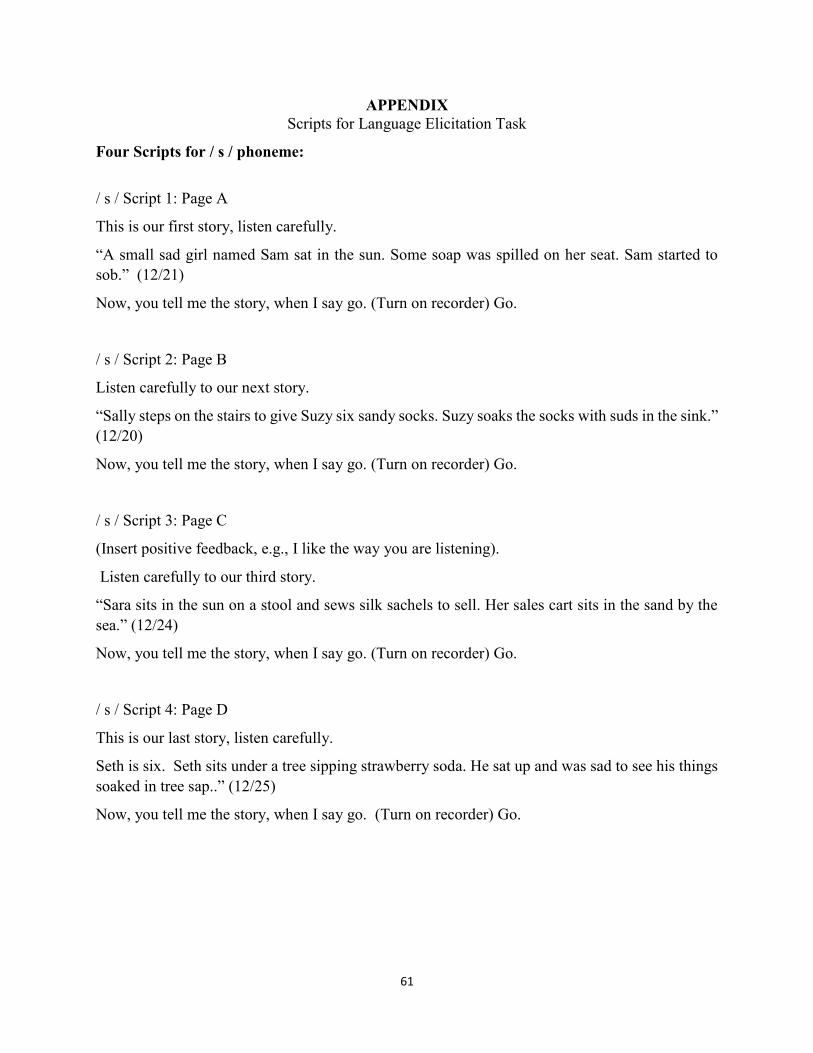
61
APPENDIX
Scripts for Language Elicitation Task
Four Scripts for / s / phoneme:
/ s / Script 1: Page A
This is our first story, listen carefully.
“A small sad girl named Sam sat in the sun. Some soap was spilled on her seat. Sam started to
sob.” (12/21)
Now, you tell me the story, when I say go. (Turn on recorder) Go.
/ s / Script 2: Page B
Listen carefully to our next story.
“Sally steps on the stairs to give Suzy six sandy socks. Suzy soaks the socks with suds in the sink.”
(12/20)
Now, you tell me the story, when I say go. (Turn on recorder) Go.
/ s / Script 3: Page C
(Insert positive feedback, e.g., I like the way you are listening).
Listen carefully to our third story.
“Sara sits in the sun on a stool and sews silk sachels to sell. Her sales cart sits in the sand by the
sea.” (12/24)
Now, you tell me the story, when I say go. (Turn on recorder) Go.
/ s / Script 4: Page D
This is our last story, listen carefully.
Seth is six. Seth sits under a tree sipping strawberry soda. He sat up and was sad to see his things
soaked in tree sap..” (12/25)
Now, you tell me the story, when I say go. (Turn on recorder) Go.
62
VITA
Michelyve Cynthia Petit first attended Drexel University where she earned her Bachelor of
Science in English in May, 2014. She began her Master of Arts degree in August 2016 at
Louisiana State University and will graduate in May of 2019. Her thesis was completed under
the guidance of Dr. Janet Norris. Upon graduation, Michelyve plans to work as a clinical fellow
speech-language pathologist in either a school or hospital setting.