Working togetherfor a safer world
European Transport Conference 2014
Session 7: Rail Planning and Policy
Frankfurt, 01 October 2014, 10.30-12.30h
Jack E. Doomernik
PERFORMANCE AND EFFICIENCY OF HIGH-SPEED RAIL SYSTEMS
Performance and efficiency of high-speed rail systems
• Policy context
• Research goal and methodology
• Model and data
• Results
• Conclusions
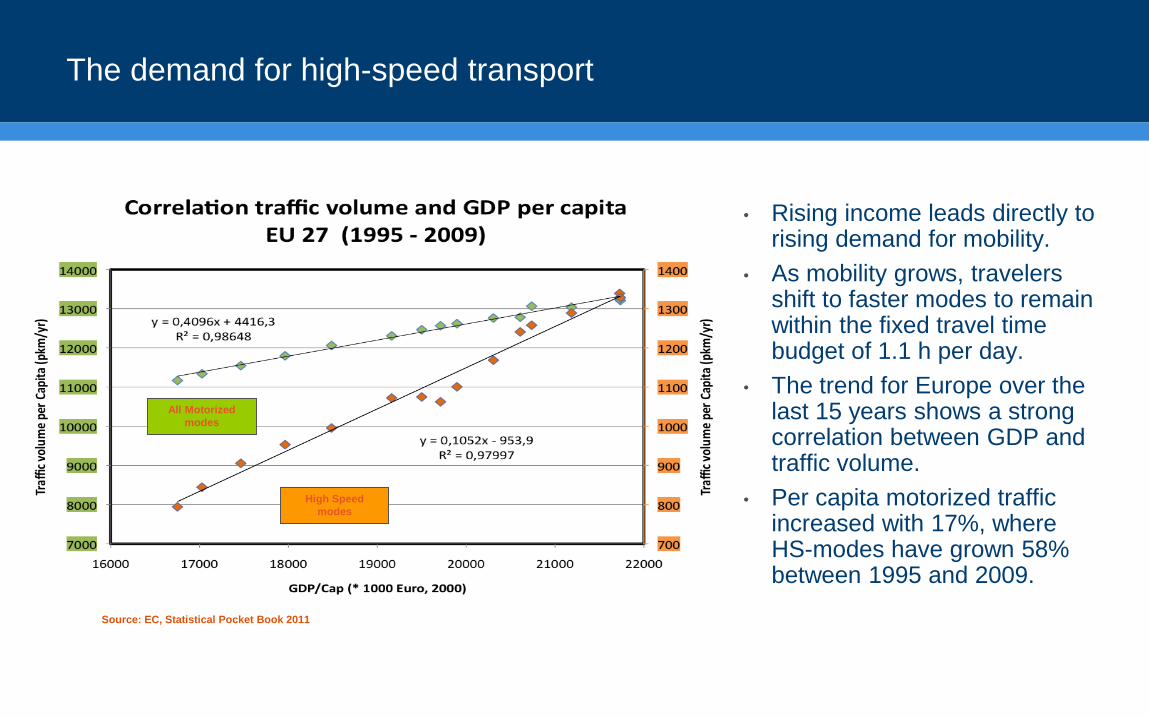
The demand for high-speed transport
• Rising income leads directly torising demand for mobility.
• As mobility grows, travelersshift to faster modes to remainwithin the fixed travel time budget of 1.1 h per day.
• The trend for Europe over the last 15 years shows a strong correlation between GDP andtraffic volume.
• Per capita motorized traffic increased with 17%, whereHS-modes have grown 58% between 1995 and 2009.
High Speed
modes
All Motorized
modes
Source: EC, Statistical Pocket Book 2011
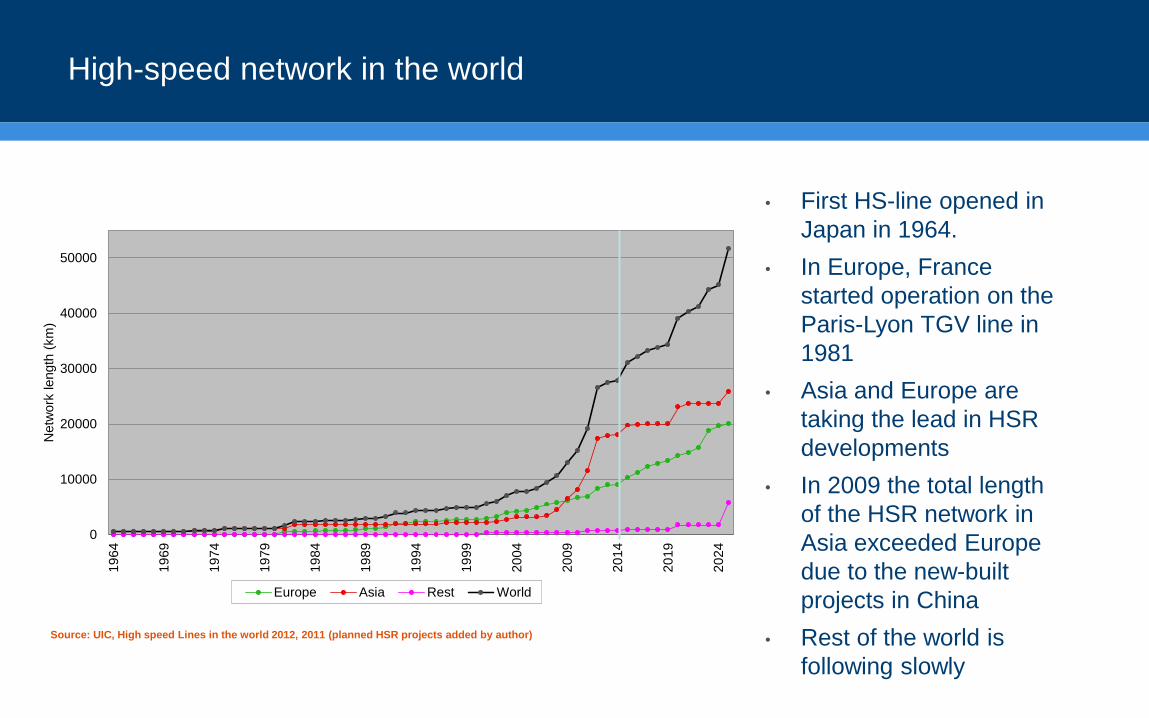
High-speed network in the world
0
10000
20000
30000
40000
50000
19
64
19
69
19
74
19
79
19
84
19
89
19
94
19
99
20
04
20
09
20
14
20
19
20
24
Netw
ork
length
(km
)
Europe Asia Rest World
• First HS-line opened in
Japan in 1964.
• In Europe, France
started operation on the
Paris-Lyon TGV line in
1981
• Asia and Europe are
taking the lead in HSR
developments
• In 2009 the total length
of the HSR network in
Asia exceeded Europe
due to the new-built
projects in China
• Rest of the world is
following slowly
Source: UIC, High speed Lines in the world 2012, 2011 (planned HSR projects added by author)
Why is assessment of actual HSR performance needed?
• The building of high-speed rail systems requires substantial investment and
efficient use of these capital-intensive assets is needed to justify the investments
made.
• Long-term performance forecasts for high-speed rail are a basic input for the
decision-making process, but in the operational stage, the assumptions need to be
validated based on the actual system performance.
• Improvement in production efficiency and service effectiveness is important to
optimize operational performance and productivity.
Research goal and methodology
Research goal:
• Identify the best high-speed rail practices in the world and clarify the efficiency of
the world’s major high-speed rail systems currently in operation.
Methodology overview:
• Efficiency comparison of four Asian (Japan, Taiwan, China, Korea) and four
European (France, Germany, Spain, Italy) networks between 2007 and 2012
• The efficiency is benchmarked using a 2-stage Network Data Envelopment
Analysis (NDEA) model
• Actual performance data and system characteristics regarding travel performance,
ridership, train fleet and network is used
• The Malmquist Productivity Index (MPI) is applied to capture the dynamics in
efficiency and technological change
• Production efficiency and service effectiveness scores are presented in
performance matrices
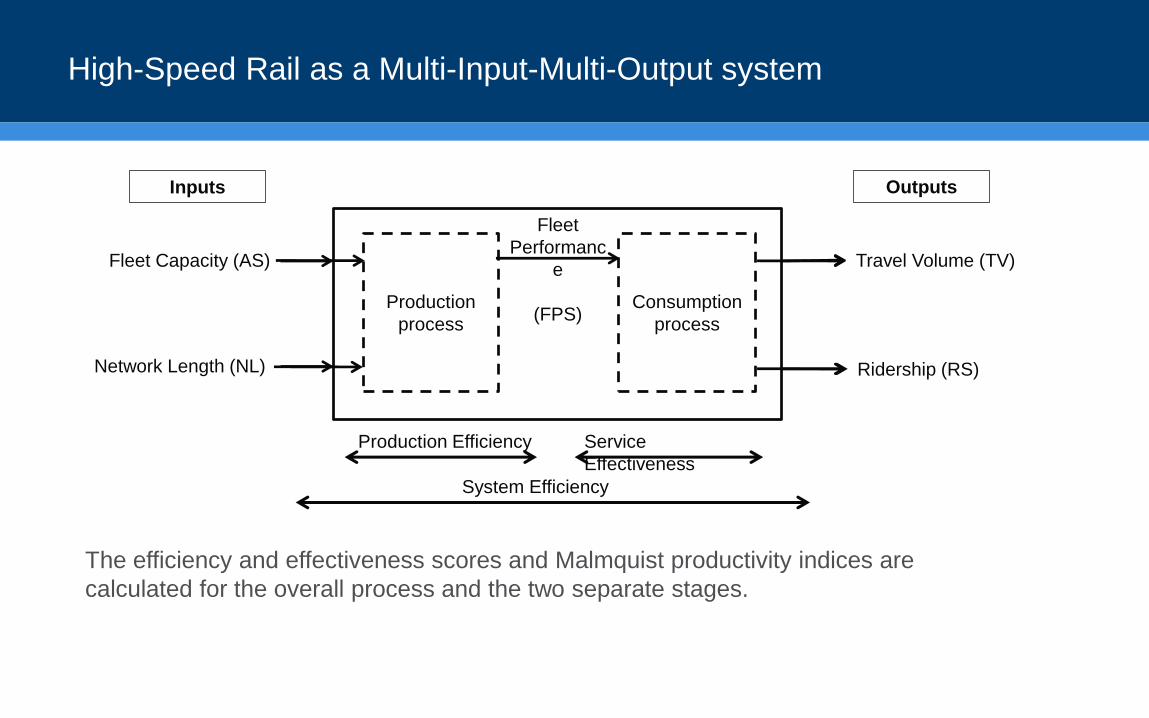
High-Speed Rail as a Multi-Input-Multi-Output system
Production
process
Fleet Capacity (AS)
Network Length (NL)
Travel Volume (TV)
Ridership (RS)
Fleet
Performanc
e
(FPS)Consumption
process
Production Efficiency Service
Effectiveness
System Efficiency
Inputs Outputs
The efficiency and effectiveness scores and Malmquist productivity indices are
calculated for the overall process and the two separate stages.
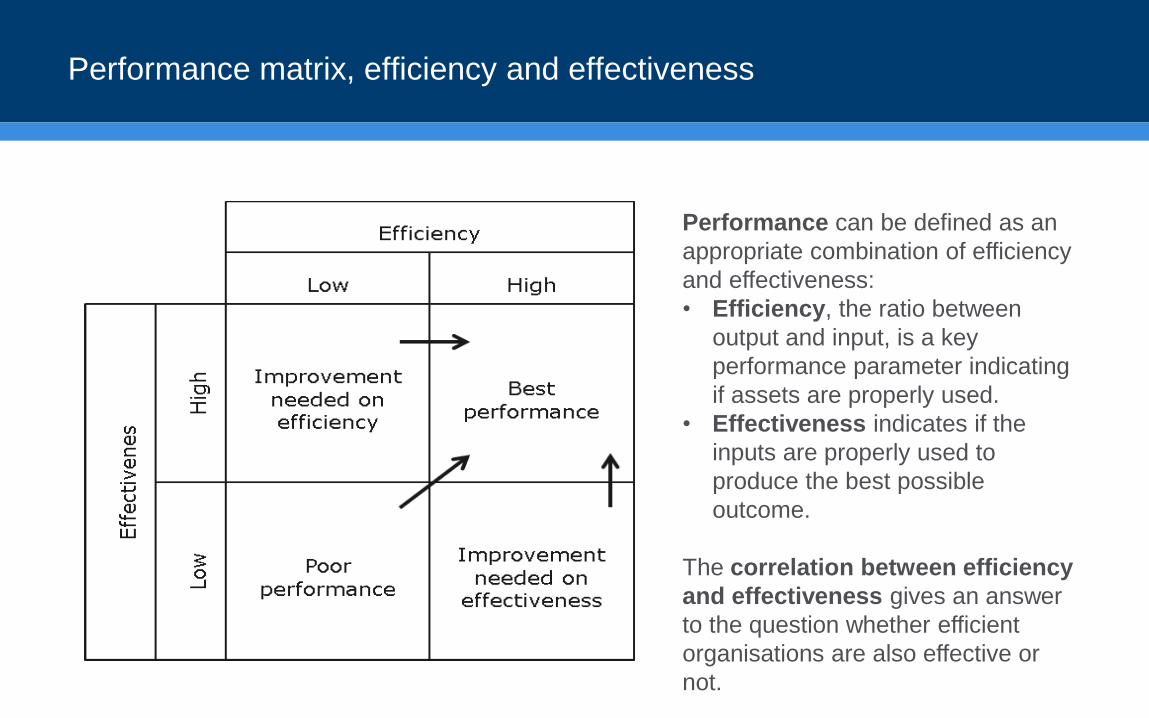
Performance matrix, efficiency and effectiveness
Performance can be defined as an
appropriate combination of efficiency
and effectiveness:
• Efficiency, the ratio between
output and input, is a key
performance parameter indicating
if assets are properly used.
• Effectiveness indicates if the
inputs are properly used to
produce the best possible
outcome.
The correlation between efficiency
and effectiveness gives an answer
to the question whether efficient
organisations are also effective or
not.
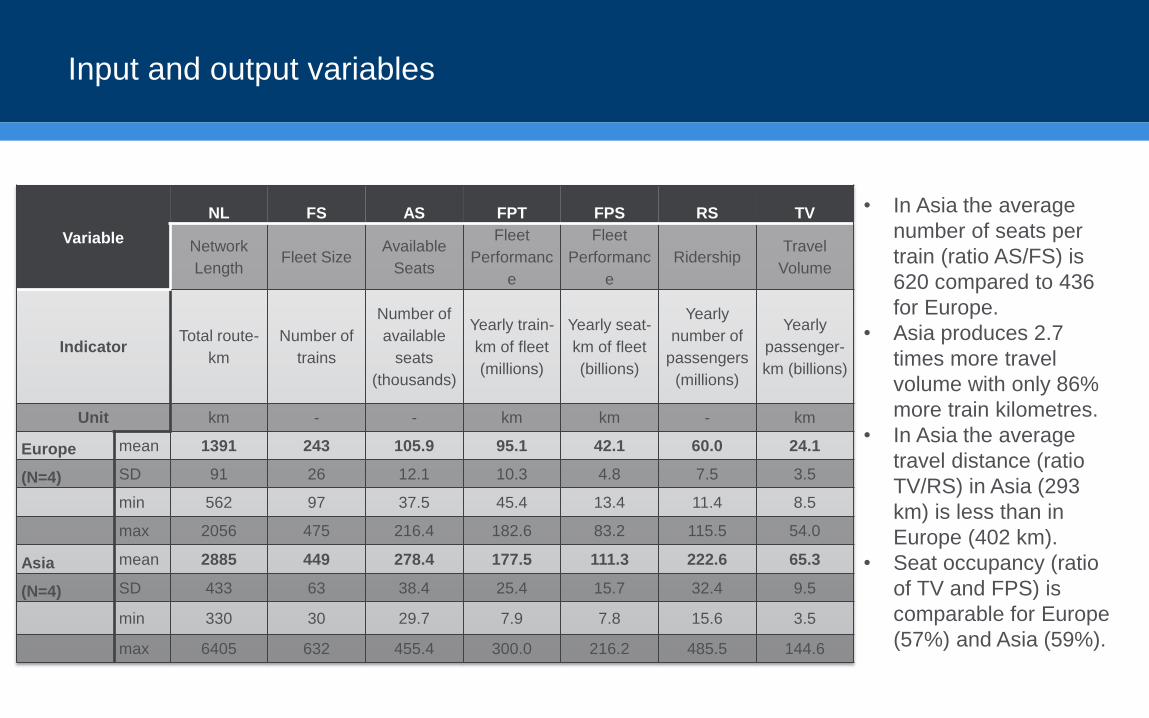
Input and output variables
Variable
NL FS AS FPT FPS RS TV
Network
LengthFleet Size
Available
Seats
Fleet
Performanc
e
Fleet
Performanc
e
RidershipTravel
Volume
IndicatorTotal route-
km
Number of
trains
Number of
available
seats
(thousands)
Yearly train-
km of fleet
(millions)
Yearly seat-
km of fleet
(billions)
Yearly
number of
passengers
(millions)
Yearly
passenger-
km (billions)
Unit km - - km km - km
Europe mean 1391 243 105.9 95.1 42.1 60.0 24.1
(N=4) SD 91 26 12.1 10.3 4.8 7.5 3.5
min 562 97 37.5 45.4 13.4 11.4 8.5
max 2056 475 216.4 182.6 83.2 115.5 54.0
Asia mean 2885 449 278.4 177.5 111.3 222.6 65.3
(N=4) SD 433 63 38.4 25.4 15.7 32.4 9.5
min 330 30 29.7 7.9 7.8 15.6 3.5
max 6405 632 455.4 300.0 216.2 485.5 144.6
• In Asia the average
number of seats per
train (ratio AS/FS) is
620 compared to 436
for Europe.
• Asia produces 2.7
times more travel
volume with only 86%
more train kilometres.
• In Asia the average
travel distance (ratio
TV/RS) in Asia (293
km) is less than in
Europe (402 km).
• Seat occupancy (ratio
of TV and FPS) is
comparable for Europe
(57%) and Asia (59%).
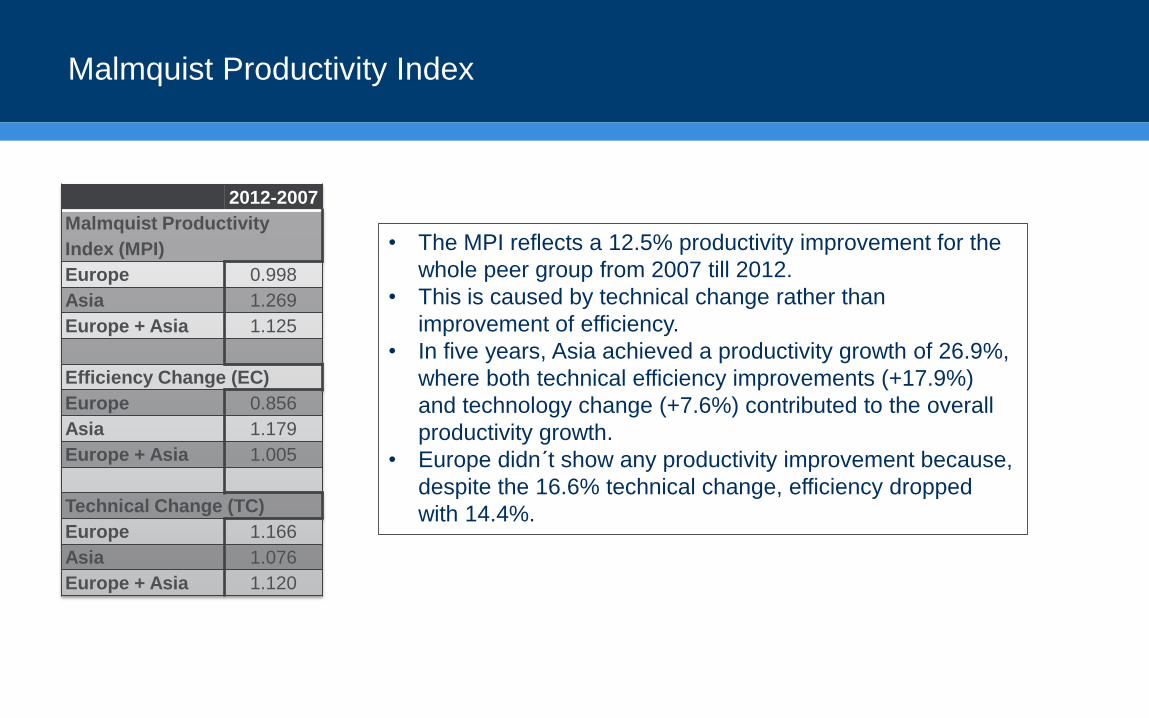
Malmquist Productivity Index
2012-2007
Malmquist Productivity
Index (MPI)
Europe 0.998
Asia 1.269
Europe + Asia 1.125
Efficiency Change (EC)
Europe 0.856
Asia 1.179
Europe + Asia 1.005
Technical Change (TC)
Europe 1.166
Asia 1.076
Europe + Asia 1.120
• The MPI reflects a 12.5% productivity improvement for the
whole peer group from 2007 till 2012.
• This is caused by technical change rather than
improvement of efficiency.
• In five years, Asia achieved a productivity growth of 26.9%,
where both technical efficiency improvements (+17.9%)
and technology change (+7.6%) contributed to the overall
productivity growth.
• Europe didn´t show any productivity improvement because,
despite the 16.6% technical change, efficiency dropped
with 14.4%.
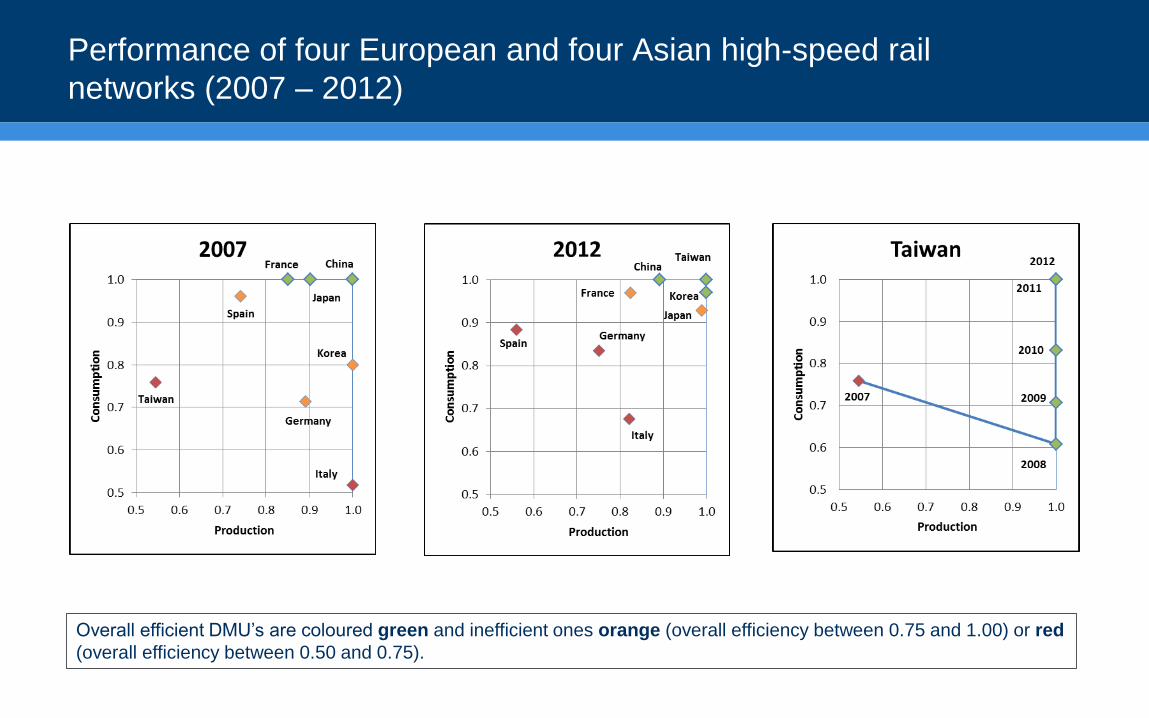
Performance of four European and four Asian high-speed rail
networks (2007 – 2012)
Overall efficient DMU’s are coloured green and inefficient ones orange (overall efficiency between 0.75 and 1.00) or red
(overall efficiency between 0.50 and 0.75).
Correlation coefficients between Production Efficiency and
Service Effectiveness
Region
CRS Model VRS Model
Service Effectiveness
Europe + Asia
Pro
du
ctio
nE
ffic
ien
cy
-0,091 -0,179
Europe -0,657 -0,661
Asia -0,170 -0,128
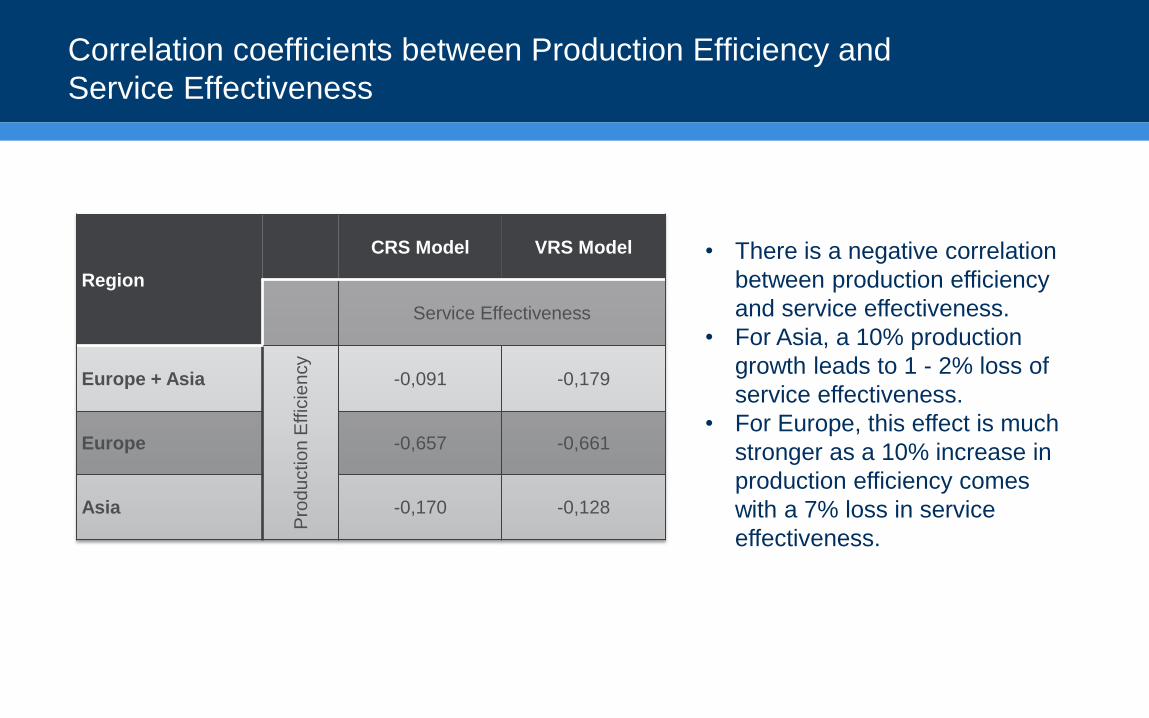
• There is a negative correlation
between production efficiency
and service effectiveness.
• For Asia, a 10% production
growth leads to 1 - 2% loss of
service effectiveness.
• For Europe, this effect is much
stronger as a 10% increase in
production efficiency comes
with a 7% loss in service
effectiveness.
The best high-speed rail practices on efficiency can be found in Asia
• The DEA model shows that Asian high-speed rail systems are fully efficient in the VRS
model and Asia outperforms Europe regarding production efficiency and service
effectiveness.
• Between 2007 and 2012, Asia achieved a productivity growth of 26.9%, while Europe
didn´t show any productivity improvement.
• Taiwan is the only DMU that has achieved a productivity index above unity in every
successive year. Year-on-year Taiwan has improved their service effectiveness
compared to others.
• Underperformer in Asia is China, that achieved to keep up efficiency, but shows a
decreasing technical change of 12.2%. China was able to be fully efficient in their
marketing process.
• In Europe, France is the best performer. Italy appears to be the worst performer and
Germany and Spain are in the middle of the spectrum.
• The results show a negative correlation between production efficiency and service
effectiveness. For Europe, this effect is much stronger than for Asia where a 10%
increase in production efficiency comes with a 7% loss in service effectiveness.
Lloyd’s Register and variants of it are trading names of Lloyd’s Register Group Limited, its subsidiaries and affiliates.
Copyright © Lloyd’s Register [Entity]. 2013. A member of the Lloyd’s Register group.
… thank you for your kind attention!
Jack Doomernik
Lloyd’s Register Antwerp University
Asset Management Consulting Applied Economics
T +31 (0)6 5338 9081
E [email protected] E [email protected]
W www.lr.org W www.uantwerpen.be
Working togetherfor a safer world
Recommended


![1.0 1.0 Introduction Introduction Introduction to ttooto ...shodhganga.inflibnet.ac.in/bitstream/10603/34636/6/06_chapter1.pdf · amino, epoxy, acrylic etc. [5]. ... and they are](https://img.pdfslide.us/doc/110x75/5b2ab3b47f8b9a86168b5329/10-10-introduction-introduction-introduction-to-ttooto-amino-epoxy-acrylic.jpg)