Premium Club Distributors Analysis
FY 2012

Direct13%
Distributors58%
LKA7%
NKA9%
Wholesalers12%
Other
Dis-tributor
s, 30%
PCD -
KHI; 23%
PCD - HYD; 5%
Total Volume UC: 16.1m
Distributor Volume UC: 9.4m
PCD Volume UC: 4.5m (28% of Total Vol.)
VOLUME SEGMENTS 2012 PCD SEGMENTS 2012
PCD KHI Volume UC: 3.7m
Incremental: 23% vs LY
PCD HYD Volume UC: 0.8m
Incremental: 5% vs LY

5 Year PCD Volume (UC) Trend
J & C BEVERAGES ABDUL LATEEF COLD AGENCY
ZIAUDDIN TRADERS
ANWAR COLD SIAL AGENCY -
100
200
300
400
500
600
700
800
900
1,000
562
125 166 153
104
619
181 177 160
111
638
212 195 150 141
689
208 232
203 195
873
431
319 309 292
2008 2009 2010 2011 2012
CAGR: 12%
CAGR: 36%
CAGR: 18%CAGR: 19% CAGR: 29%

LODHI DISTRIB-UTORS
HAJI DURR MOHAMMAD
USMAN AGENCY AHMED COLD AGENCY
AL-AMEEN & SONS -
50
100
150
200
250
300
151
88 80
115
68
125 116
101
149
89
146 136
119
231
105
186 175
129
171
120
247
196
142 134
215
2008 2009 2010 2011 2012
5 Year PCD Volume (UC) Trend
CAGR: 13%
CAGR: 22%
CAGR: 16%
CAGR: 4%CAGR: 33%

Area Wise Volume Comparison 2012
PCD DIST PCD KHI IND KHI PCD HYD IND HYD
PCD Vol % of Area
PackmixRGB - 250ML 29% 33% 27% 29% 35% 40%
RGB - 1000ML 3% 3% 4% 4% 2% 2%NR - 250ML 1% 0% 1% 0% 0% 0%
PET - 1500ML 28% 26% 29% 28% 24% 23%PET - 500ML 10% 11% 10% 10% 11% 11%
PET - 2250ML 17% 16% 18% 18% 14% 13%CAN - 330 ML 3% 2% 3% 3% 1% 1%
Pulpy - 350ML 1% 1% 1% 1% 1% 0%Pulpy - 1250ML 1% 1% 1% 1% 1% 0%Water - 500ML 3% 3% 2% 2% 4% 3%
Water - 1500ML 5% 5% 4% 5% 8% 6%Grand Total 100% 100% 100% 100% 100% 100%
47% 60% 23%

PACKMIX KHI PCD 2012
PACKMIX 2012 J&C ZIADDINABDUL LATEEF
ANWAR COLD
FRIENDS DLI LODHIHAJI
WAQASUSMAN AGENCY
AHMED COLD
SIAL AGENCY
HAJI DURR
RGB - 250ML 32% 42% 24% 15% 25% 20% 24% 34% 37% 30% 34% 7%RGB - 1000ML 3% 0% 2% 6% 9% 3% 6% 0% 7% 4% 3% 0%
NR - 250ML 0% 0% 0% 0% 0% 0% 0% 0% 0% 0% 0% 11%PET - 1500ML 27% 36% 21% 35% 28% 33% 29% 29% 29% 32% 28% 27%
PET - 500ML 12% 4% 10% 11% 10% 14% 11% 12% 5% 8% 10% 4%PET - 2250ML 20% 13% 13% 28% 21% 20% 23% 7% 17% 22% 19% 2%CAN - 330 ML 1% 1% 21% 1% 1% 1% 1% 1% 1% 1% 1% 5%
Pulpy - 350ML 0% 0% 1% 1% 1% 2% 1% 1% 0% 0% 1% 1%Pulpy - 1250ML 0% 0% 1% 1% 1% 2% 1% 1% 0% 0% 0% 0%Water - 500ML 1% 1% 4% 1% 2% 2% 1% 3% 1% 1% 1% 16%
Water - 1500ML 2% 3% 4% 1% 2% 4% 3% 11% 2% 2% 2% 27%Grand Total 100% 100% 100% 100% 100% 100% 100% 100% 100% 100% 100% 100%

PACKMIX 2012 F.W.Z KIRANAL-
AMEENHUNAIN
RGB - 250ML 32% 42% 34% 48%RGB - 1000ML 2% 0% 4% 0%
NR - 250ML 0% 0% 0% 0%PET - 1500ML 24% 21% 23% 31%
PET - 500ML 11% 14% 9% 9%PET - 2250ML 13% 16% 16% 7%CAN - 330 ML 2% 1% 1% 0%
Pulpy - 350ML 1% 1% 1% 0%Pulpy - 1250ML 1% 0% 1% 0%Water - 500ML 5% 3% 2% 1%
Water - 1500ML 9% 3% 8% 3%Grand Total 100% 100% 100% 100%
PACKMIX HYD PCD 2012

Financial Performance 2012
Total PCD KHI PCD HYD Total PCD KHI PCD HYD
Volume UC (000's) 4,582 3,779 804
Gross Revenue 1,263,286 1,044,520 218,765 275.69 276.42 272.25
Margin/Incentives 67,079 53,331 13,748 14.64 14.11 17.11Trade & Other Discounts 74,369 63,943 10,425 16.23 16.92 12.97
Total Discounts 141,448 117,275 24,173 30.87 31.04 30.08
Total Taxes 235,273 195,520 39,753 51.34 51.74 49.47
Net Sales Revenue 886,565 731,726 154,839 193.48 193.64 192.70
COGS 703,452 581,260 122,192 153.52 153.82 152.07
Gross Profit 183,112 150,465 32,647 39.96 39.82 40.63% Net Sales 20.65% 20.56% 21.08%
DME & OPEX 263,447 216,207 47,241 57.49 57.22 58.79
EBIT (80,335) (65,741) (14,594) -17.53 -17.40 -18.16Operating Margin - % -9.06% -8.98% -9.43%
Days Sales Outstanding 6 7 0
PCD AnalysisFY 2012
ABSOLUTE PER UC

Financial Performance 2012
Volume UC (000's)
Gross Revenue
Margin/IncentivesTrade & Other Discounts
Total Discounts
Total Taxes
Net Sales Revenue
COGS
Gross Profit% Net Sales
DME & OPEX
EBITOperating Margin - %
Days Sales Outstanding
PCD AnalysisFY 2012 ABSOLUTE PER UC
873
240,496 275.46
14,278 16.3512,199 13.9726,477 30.33
45,713 52.36
168,306 192.77
131,642 150.78
36,664 41.9921.78%
49,258 56.42
(12,594) -14.42-7.48%
1
J & C BEVERAGES Observations & Recommendations:
- Highest volume achiever in the group
- Maintaining a good pack-mix & DSO
- Could increase the sales of Juice to increase availability due to the size of its operations & also to have a positive impact on its NSR
- Would be ideal if all freight is through Self-Carriage

Financial Performance 2012
Volume UC (000's)
Gross Revenue
Margin/IncentivesTrade & Other Discounts
Total Discounts
Total Taxes
Net Sales Revenue
COGS
Gross Profit% Net Sales
DME & OPEX
EBITOperating Margin - %
Days Sales Outstanding
PCD AnalysisFY 2012
Observations & Recommendations:
- Maintaining a positive volume growth in the last 5 years
- High focus on RGB 250ml
- One of the lowest discounts in the group
- NSR can improve greatly if ratio of PET 500ml is increased.
- About average DSO for a distributor
- Would be ideal if all freight is through Self-Carriage
ABSOLUTE PER UC319
87,708 275.20
4,402 13.813,834 12.038,236 25.84
16,652 52.25
62,819 197.11
47,601 149.36
15,218 47.7524.23%
18,416 57.78
(3,197) -10.03-5.09%
7
ZIAUDDIN TRADERS

Financial Performance 2012
Volume UC (000's)
Gross Revenue
Margin/IncentivesTrade & Other Discounts
Total Discounts
Total Taxes
Net Sales Revenue
COGS
Gross Profit% Net Sales
DME & OPEX
EBITOperating Margin - %
Days Sales Outstanding
PCD AnalysisFY 2012
Observations & Recommendations:
- Exceptional increase in volume (107%) on last year.
- Major seller of CAN 330ml on high discounts
- High GSR & higher COGs leading to lower GP.
- Most loss making PCD Distributor
- Remove highly discounted CAN outlets to bring the impact of better GSR till bottom-line.
ABSOLUTE PER UC431
139,691 324.29
6,581 15.2817,605 40.8724,186 56.15
26,490 61.50
89,015 206.65
77,692 180.36
11,323 26.2912.72%
28,462 66.07
(17,139) -39.79-19.25%
1
ABDUL LATEEF COLD

Financial Performance 2012
Volume UC (000's)
Gross Revenue
Margin/IncentivesTrade & Other Discounts
Total Discounts
Total Taxes
Net Sales Revenue
COGS
Gross Profit% Net Sales
DME & OPEX
EBITOperating Margin - %
Days Sales Outstanding
PCD AnalysisFY 2012
Observations & Recommendations:
- 52% increase in volume over last year
- One of the least loss making PCD
- High focus on FC packs & lower than average ratio of RGB 250ml
- One of the highest DSO amongst the group
- Should increase the ratio of RGB 250ml while decreasing PET 2250ml.
- Should also work on reducing the DSO
ABSOLUTE PER UC309
81,352 263.29
3,755 12.154,386 14.198,141 26.35
15,641 50.62
57,570 186.32
45,189 146.25
12,381 40.0721.51%
15,853 51.31
(3,472) -11.24-6.03%
10
ANWAR COLD

Financial Performance 2012
Volume UC (000's)
Gross Revenue
Margin/IncentivesTrade & Other Discounts
Total Discounts
Total Taxes
Net Sales Revenue
COGS
Gross Profit% Net Sales
DME & OPEX
EBITOperating Margin - %
Days Sales Outstanding
PCD AnalysisFY 2012
Observations & Recommendations:
- Inducted in PCD in 2012- Has done well so far on
volume achievement, discounts & profitability
- DSO is very high for a new distributor & needs to decrease further
- Year 2013 will test the financial muscle & strength of FDN as a mega distributor will be vital for the success of huge area provided for its distribution network
ABSOLUTE PER UC370
99,122 267.90
4,880 13.196,003 16.23
10,884 29.42
18,728 50.62
69,510 187.87
54,653 147.71
14,857 40.1621.37%
20,026 54.12
(5,168) -13.97-7.44%
10
FRIENDS DISTIBUTION

Financial Performance 2012
Volume UC (000's)
Gross Revenue
Margin/IncentivesTrade & Other Discounts
Total Discounts
Total Taxes
Net Sales Revenue
COGS
Gross Profit% Net Sales
DME & OPEX
EBITOperating Margin - %
Days Sales Outstanding
PCD AnalysisFY 2012
Observations & Recommendations:
- Inducted in PCD in 2012- Discounts are the
lowest so far as DLI hasn’t been meeting its targets hence incentives were only given in 2 months in 2012
- Due to this, profitability is skewed in its favor
ABSOLUTE PER UC359
99,952 278.10
2,980 8.292,378 6.625,357 14.91
18,537 51.57
76,058 211.62
56,340 156.76
19,719 54.8625.93%
19,815 55.13
(96) -0.27-0.13%
6
DLI LOGISTIX LIMITED

Financial Performance 2012
Volume UC (000's)
Gross Revenue
Margin/IncentivesTrade & Other Discounts
Total Discounts
Total Taxes
Net Sales Revenue
COGS
Gross Profit% Net Sales
DME & OPEX
EBITOperating Margin - %
Days Sales Outstanding
PCD AnalysisFY 2012
Observations & Recommendations:
- Maintaining a positive volume growth in the last 5 years & a healthy pack-mix
- DSO is one of the highest & needs to come down in 2013 to reduce the riskiness of operations
- Discounts are on the higher side & need to reduce drastically to make Lodhi a profitable distributor
ABSOLUTE PER UC247
66,628 269.50
3,449 13.954,961 20.078,410 34.02
12,545 50.74
45,673 184.74
37,198 150.46
8,475 34.2818.56%
13,368 54.07
(4,893) -19.79-10.71%
12
LODHI DISTRIBUTORS
Financial Performance 2012
Volume UC (000's)
Gross Revenue
Margin/IncentivesTrade & Other Discounts
Total Discounts
Total Taxes
Net Sales Revenue
COGS
Gross Profit% Net Sales
DME & OPEX
EBITOperating Margin - %
Days Sales Outstanding
PCD AnalysisFY 2012
Observations & Recommendations:
- Newly inducted in 2012 - Sales of Water 1500ml are
very high , but GSR is somewhat mitigated by having a higher ratio of RGB 250ml.
- DSO is the highest of the group which is a warning signal for operational flexibity of the distributor
- NSR can improve with lesser ratio of Water in the Packmix.
- 2013 will be crucial
ABSOLUTE PER UC106
29,045 273.04
1,722 16.181,504 14.143,226 30.32
5,204 48.92
20,616 193.80
16,292 153.15
4,324 40.6520.97%
6,315 59.37
(1,991) -18.72-9.66%
17
HAJI WAQAS

Financial Performance 2012
Volume UC (000's)
Gross Revenue
Margin/IncentivesTrade & Other Discounts
Total Discounts
Total Taxes
Net Sales Revenue
COGS
Gross Profit% Net Sales
DME & OPEX
EBITOperating Margin - %
Days Sales Outstanding
PCD AnalysisFY 2012
Observations & Recommendations:
- Lower than average volume growth over 5 years in the group
- Low ratio of PET 500ml in the pack-mix
- Really high DSO for an established distributor.
- Need to improve on the pack-mix by including PET 500ml
ABSOLUTE PER UC142
38,412 269.77
1,818 12.771,858 13.053,676 25.82
7,334 51.51
27,402 192.45
20,893 146.74
6,508 45.7123.75%
7,936 55.73
(1,427) -10.02-5.21%
13
USMAN AGENCY

Financial Performance 2012
Volume UC (000's)
Gross Revenue
Margin/IncentivesTrade & Other Discounts
Total Discounts
Total Taxes
Net Sales Revenue
COGS
Gross Profit% Net Sales
DME & OPEX
EBITOperating Margin - %
Days Sales Outstanding
PCD AnalysisFY 2012 ABSOLUTE PER UC
134
35,840 267.87
1,870 13.981,924 14.383,794 28.36
6,822 50.99
25,223 188.52
19,646 146.83
5,578 41.6922.11%
7,300 54.56
(1,723) -12.88-6.83%
5
AHMED COLD AGENCY Observations & Recommendations:
- Only PCD whose volume growth is negative (since 2 consecutive years) which is alarming
- Discounts are good however, due to high pack-mix of PET 2250ml, GSR is low
- Focus more on PET 500ml or CAN 330ml to improve NSR

Financial Performance 2012
Volume UC (000's)
Gross Revenue
Margin/IncentivesTrade & Other Discounts
Total Discounts
Total Taxes
Net Sales Revenue
COGS
Gross Profit% Net Sales
DME & OPEX
EBITOperating Margin - %
Days Sales Outstanding
PCD AnalysisFY 2012 ABSOLUTE PER UC
292
80,970 276.83
4,795 16.394,287 14.669,081 31.05
15,385 52.60
56,504 193.18
44,390 151.77
12,114 41.4221.44%
16,652 56.93
(4,538) -15.52-8.03%
13
SIAL AGENCY Observations & Recommendations:
- Average PCD size with good growth levels (mostly funded by CCBPL to improve the infrastructure & build necessary resources)
- Quite a decent pack-mix is being maintained.
- However, DSO is very high & for a distributor that is growing by more than 40% on average this should really be lower
Financial Performance 2012
Volume UC (000's)
Gross Revenue
Margin/IncentivesTrade & Other Discounts
Total Discounts
Total Taxes
Net Sales Revenue
COGS
Gross Profit% Net Sales
DME & OPEX
EBITOperating Margin - %
Days Sales Outstanding
PCD AnalysisFY 2012 ABSOLUTE PER UC
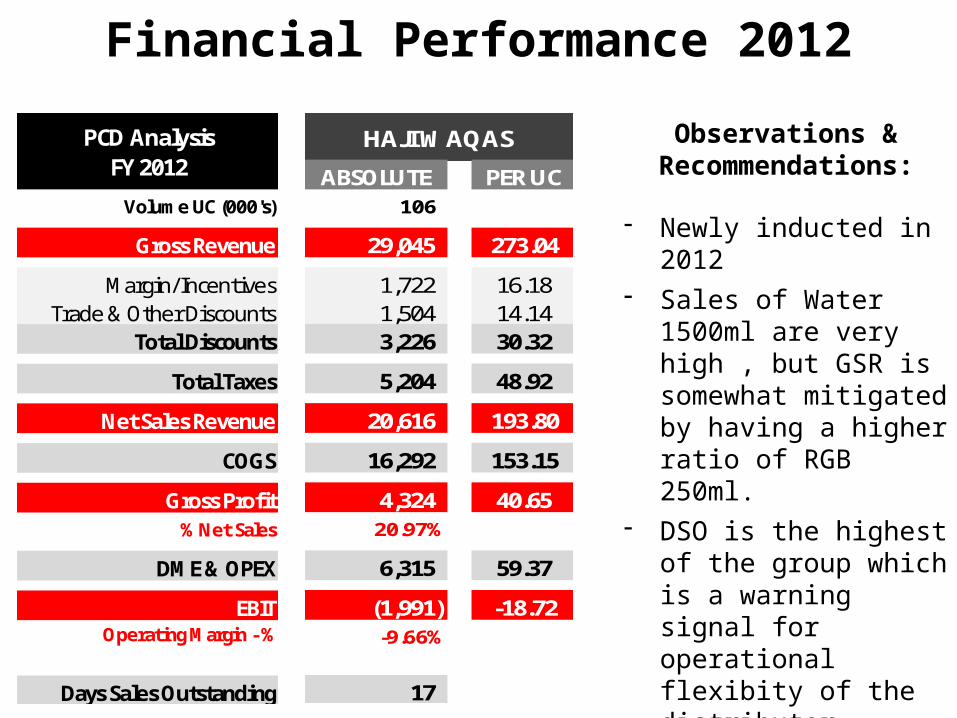
196
45,305 231.73
2,802 14.333,005 15.375,807 29.70
6,469 33.09
33,029 168.94
29,726 152.04
3,303 16.9010.00%
12,806 65.50
(9,503) -48.61-28.77%
18
HAJI DURR Observations & Recommendations:
- Lower than average volume growth over 5 years in the group
- Outlier of all PCDs in terms of pack-mix (Extremely high proportion of NR & Water) that is hampering its NSR.
- In outstation hence higher freight as well is incurred as well as highest AR recovery times
- Need to change the pack-mix drastically

Financial Performance 2012
Volume UC (000's)
Gross Revenue
Margin/IncentivesTrade & Other Discounts
Total Discounts
Total Taxes
Net Sales Revenue
COGS
Gross Profit% Net Sales
DME & OPEX
EBITOperating Margin - %
Days Sales Outstanding
PCD AnalysisFY 2012
Observations & Recommendations:
- Highest volume achiever in HYD PCD
- A fairly new distributor & the biggest in HYD
- Sale of Water is High like the average pack-mix of HYD
- Can really improve on profitability on focusing more on PET 500ml and lesser on Water
ABSOLUTE PER UC429
115,735 269.63
7,091 16.526,208 14.46
13,299 30.98
20,682 48.18
81,753 190.46
65,277 152.08
16,476 38.3820.15%
25,245 58.81
(8,769) -20.43-10.73%
0
F.W.Z ENTERPRISES
Financial Performance 2012
Volume UC (000's)
Gross Revenue
Margin/IncentivesTrade & Other Discounts
Total Discounts
Total Taxes
Net Sales Revenue
COGS
Gross Profit% Net Sales
DME & OPEX
EBITOperating Margin - %
Days Sales Outstanding
PCD AnalysisFY 2012
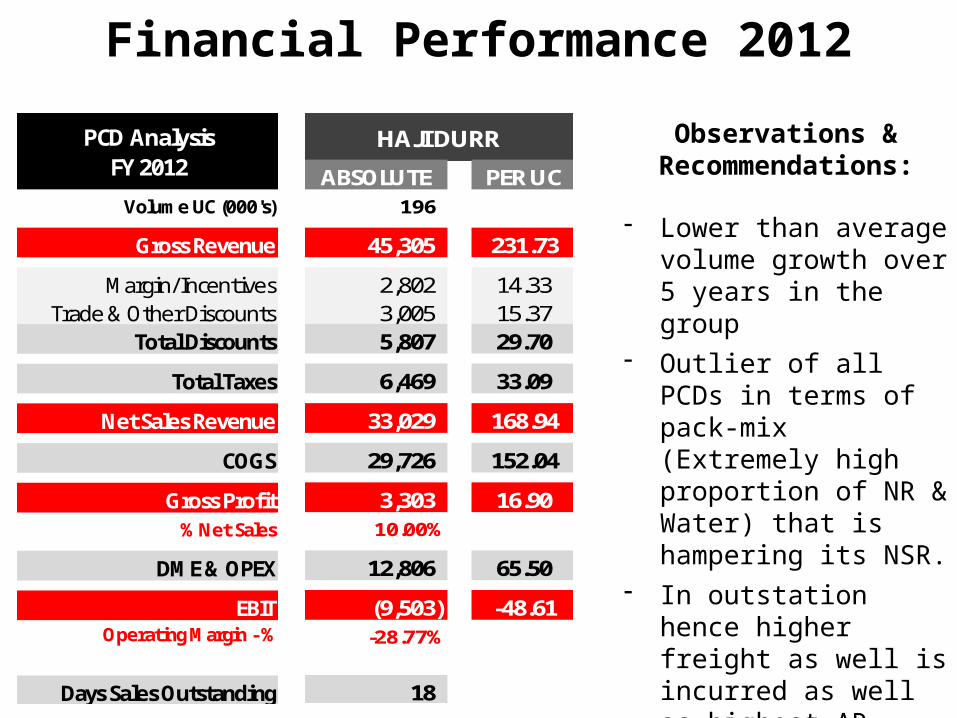
Observations & Recommendations:
- One of the smallest PCD of the group with one of the best NSRs mainly due to lower water contribution
- Maintaining a good pack-mix & DSO
- Year 2013 will truly portray the true strength of the distributor to sustain the demands in far flung areas
ABSOLUTE PER UC80
22,920 285.13
1,571 19.54403 5.01
1,974 24.55
4,299 53.48
16,647 207.09
12,546 156.08
4,101 51.0224.63%
4,860 60.45
(759) -9.44-4.56%
1
KIRAN BEVERAGE

Financial Performance 2012
Volume UC (000's)
Gross Revenue
Margin/IncentivesTrade & Other Discounts
Total Discounts
Total Taxes
Net Sales Revenue
COGS
Gross Profit% Net Sales
DME & OPEX
EBITOperating Margin - %
Days Sales Outstanding
PCD AnalysisFY 2012 ABSOLUTE PER UC
215
57,960 268.97
3,623 16.812,887 13.406,511 30.21
10,559 49.00
40,890 189.75
32,362 150.18
8,527 39.5720.85%
12,389 57.49
(3,862) -17.92-9.44%
-
AL-AMEEN & SONS Observations & Recommendations:
- Maintaining a good volume growth 79% vs. last year
- Discounts are good however, due to high pack-mix of Water, GSR is low
- Focus more on PET 500ml or CAN 330ml to improve NSR

Financial Performance 2012
Volume UC (000's)
Gross Revenue
Margin/IncentivesTrade & Other Discounts
Total Discounts
Total Taxes
Net Sales Revenue
COGS
Gross Profit% Net Sales
DME & OPEX
EBITOperating Margin - %
Days Sales Outstanding
PCD AnalysisFY 2012
Observations & Recommendations:
- The smallest PCD of the group
- Maintaining a good pack-mix & DSO
- Recommended to increase the volume to & cover a bigger area for better profitably
- Year 2013 will truly portray the true strength of the distributor to sustain the demands in far flung areas
ABSOLUTE PER UC78
22,151 282.39
1,463 18.65927 11.81
2,389 30.46
4,213 53.71
15,549 198.23
12,006 153.06
3,543 45.1722.79%
4,747 60.52
(1,204) -15.35-7.74%
1
HUNAIN DISTRIBUTOR

THANKS
Recommended