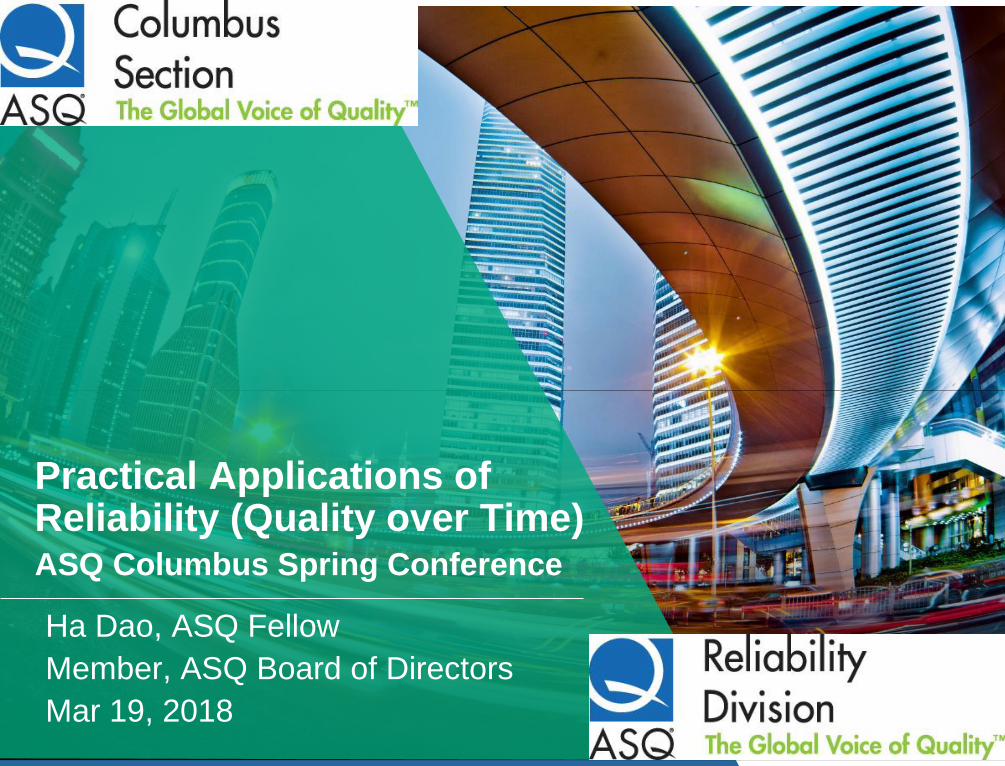
Practical Applications of Reliability (Quality over Time)ASQ Columbus Spring Conference
Ha Dao, ASQ Fellow
Member, ASQ Board of Directors
Mar 19, 2018
2
Disclaimer
Disclaimer: Reference in this presentation to any
commercial product, process, or service by trade name,
trademark, manufacturer, developer, or otherwise is for
informational purposes only and does not imply
endorsement, recommendation, or favoring by ASQ. ASQ
does not make any warranty, express or implied, and
disclaims any legal liability or responsibility, for the
accuracy, completeness, or usefulness of any information,
commercial product, process, or service referenced in this
presentation. Views expressed in this presentation are
those of the speaker and not, necessarily, of ASQ.
3
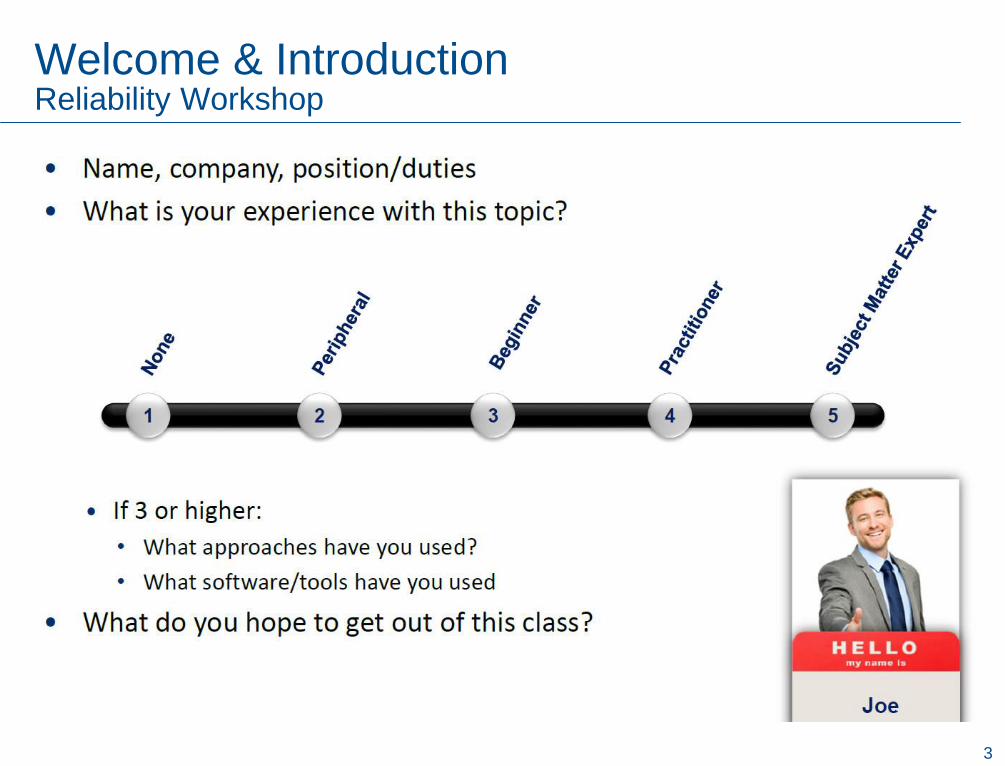
Welcome & IntroductionReliability Workshop

4
Ha Dao, ASQ FellowMember, ASQ Board of [email protected] - (937) 710-3054
Ha Dao, an ASQ Fellow, is the Technical Quality Manager for Emerson. He is responsible
for the development and deployment of an enterprise approach to Quality, Reliability and
Customer Experience.
Ha is an experienced Quality Professional. His certifications include Shainin Red X Master,
Shainin Red X Reliability Engineer, Six Sigma Master Black Belt, Exemplar Global Certified
QMS Lead Auditor, ASQ Certified Six Sigma Black Belt, CQE & CQA. Ha holds a BSME
and a Master of Science in Management Science. With over 25 years of diversified
experience, he has worked for General Motors, Delphi Corporation, UTC Aerospace and
SSA & Company (formerly Six Sigma Academy).
Ha is very active in the professional societies and provides many services to the
communities. His work has earned many awards and recognitions, including:
➢ National Director, ASQ Board of Directors (2013-2018)
➢ Co-Chair, ASQ Strategic Planning Committee (2016)
➢ Chair, ASQ Strategy Deployment Committee (2014-2018)
➢ Member, The Conference Board Quality Council (2013)
➢ Member, Board of Examiners, The Partnership for Excellence (2013)
➢ Chair, ASQ Automotive Division (2009-2011)
➢ Outstanding Engineers & Scientist Award, Affiliate Societies of Dayton, 2007
➢ ASQ Fellow, American Society for Quality (ASQ), 2005
5
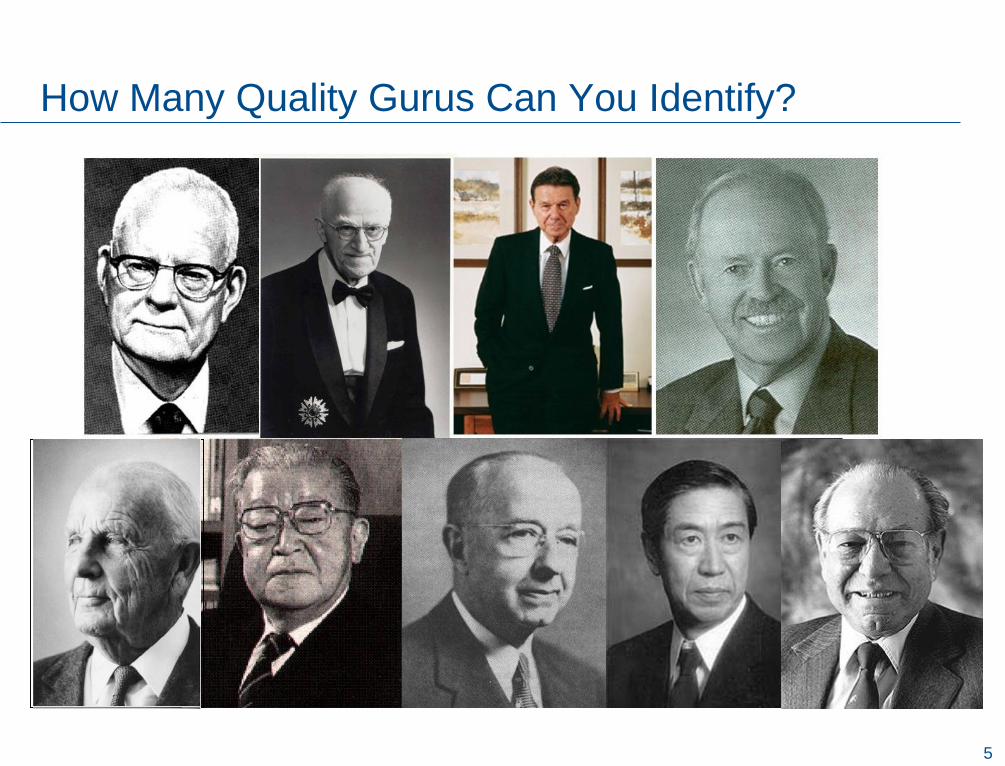
How Many Quality Gurus Can You Identify?
6
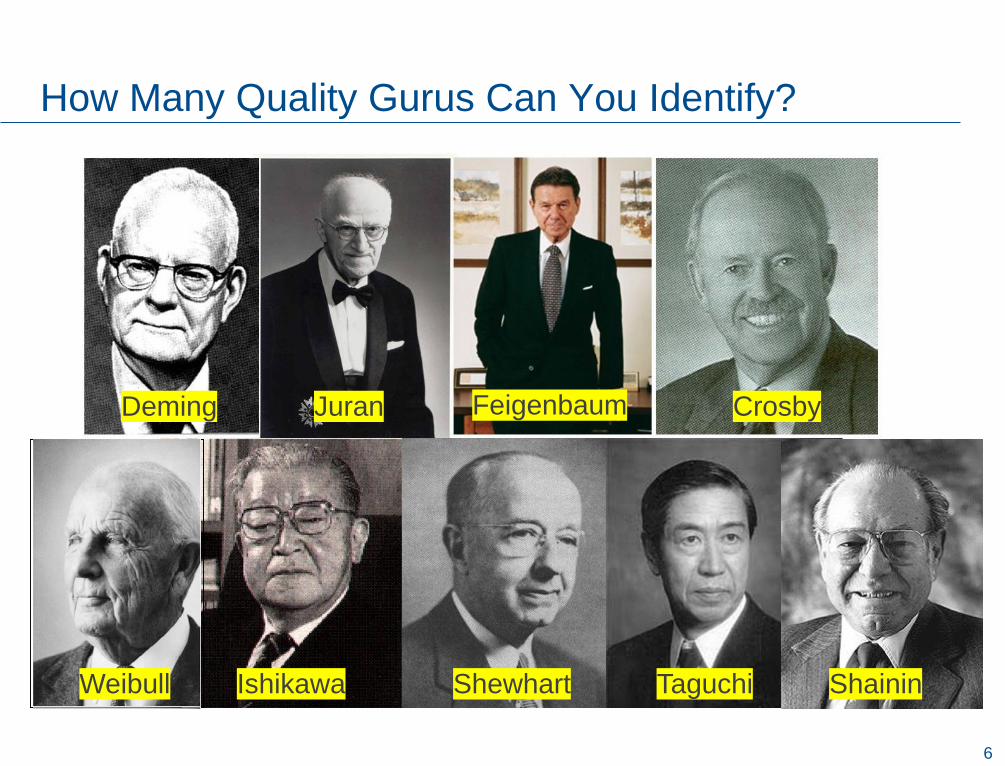
How Many Quality Gurus Can You Identify?
Deming Juran Feigenbaum Crosby
Weibull Ishikawa Shewhart Taguchi Shainin
7
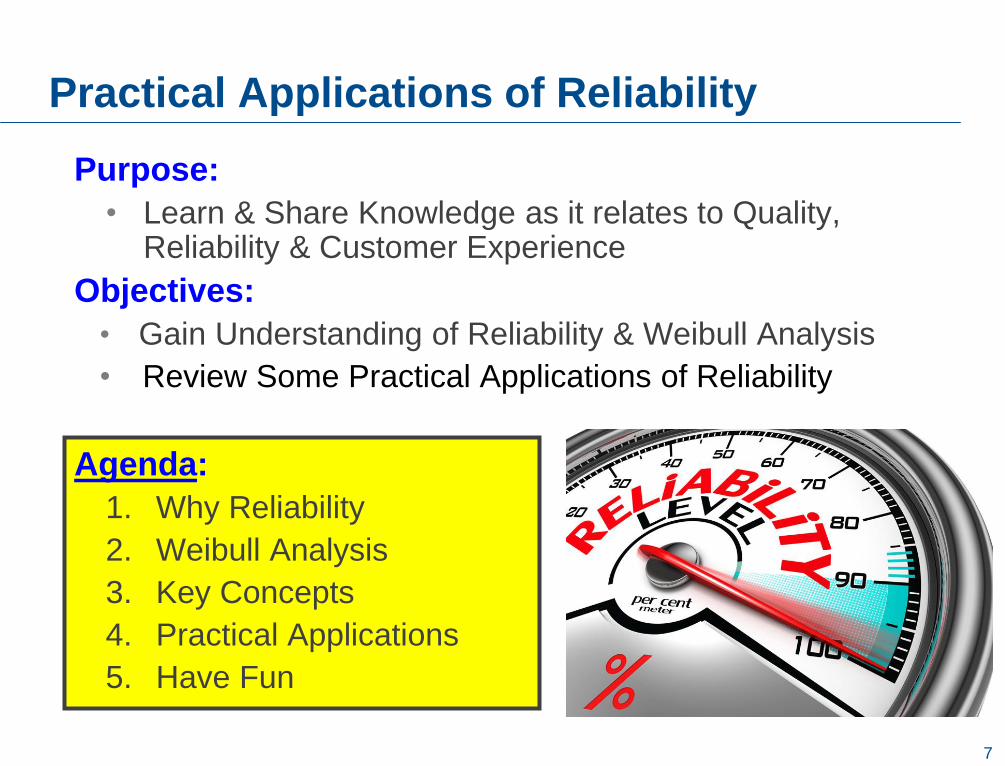
Purpose:
• Learn & Share Knowledge as it relates to Quality, Reliability & Customer Experience
Objectives:
• Gain Understanding of Reliability & Weibull Analysis
• Review Some Practical Applications of Reliability
Practical Applications of Reliability
Agenda:
1. Why Reliability
2. Weibull Analysis
3. Key Concepts
4. Practical Applications
5. Have Fun
8
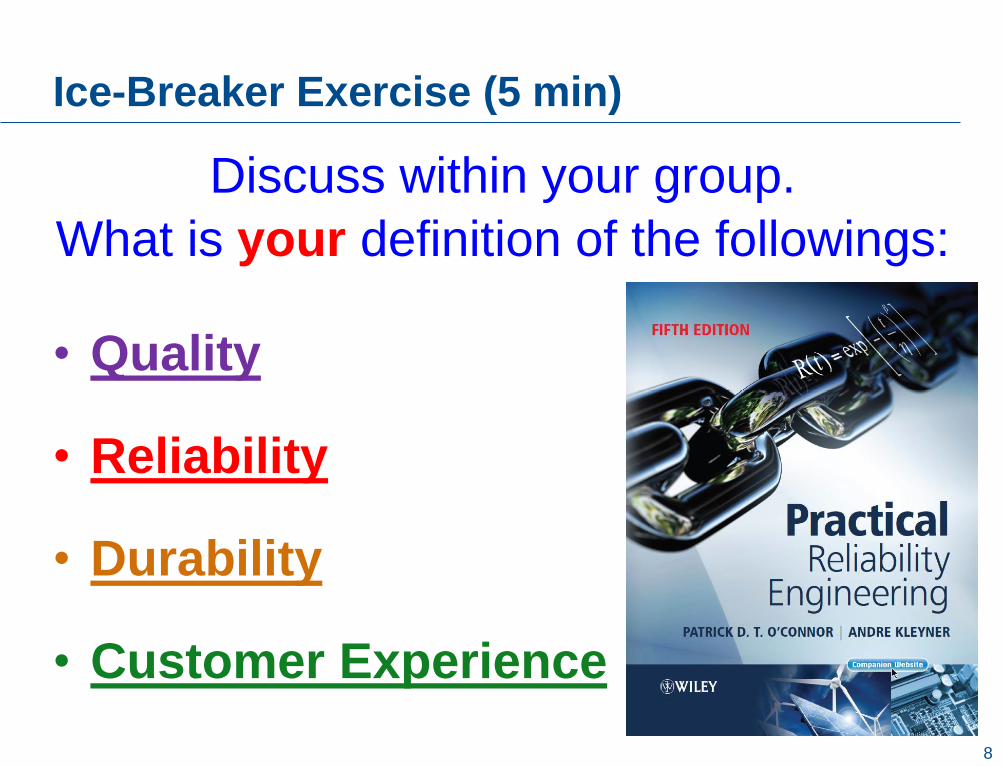
Ice-Breaker Exercise (5 min)
• Quality
• Reliability
• Durability
• Customer Experience
Discuss within your group.
What is your definition of the followings:
9
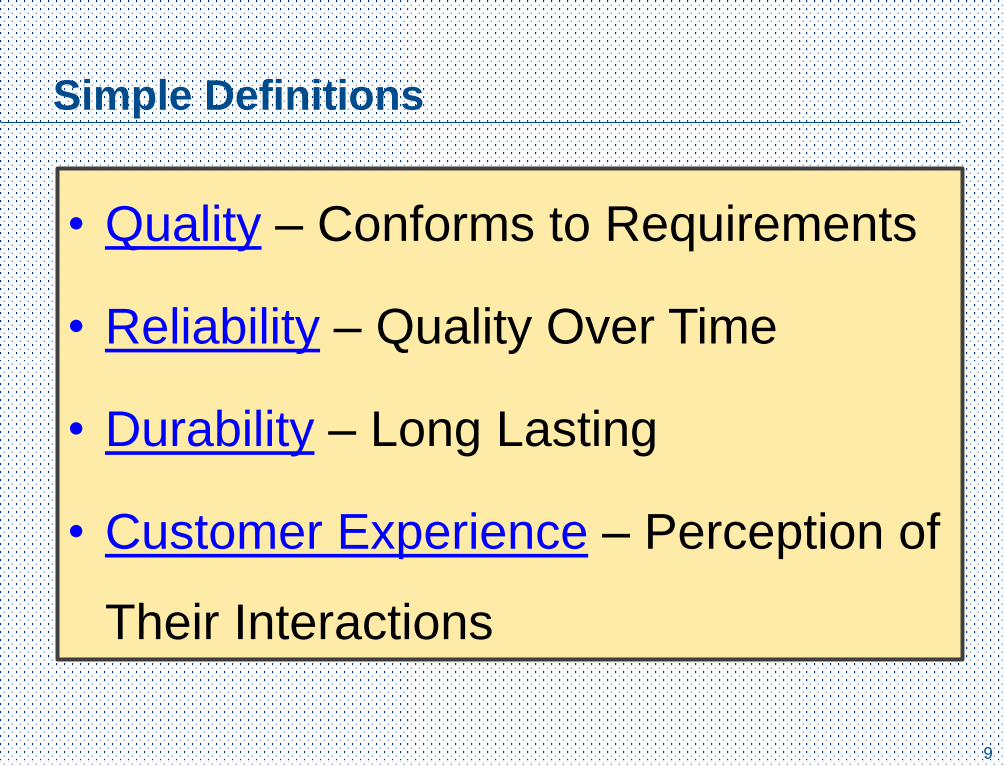
Simple Definitions
• Quality – Conforms to Requirements
• Reliability – Quality Over Time
• Durability – Long Lasting
• Customer Experience – Perception of
Their Interactions

10
What is Reliability?
Reliability is the probability that a product will perform its intended function successfully for a specified period of time, under specified operating conditions, in a manner
that meets or exceeds customer expectations. (Reliability is often considered quality over time).
Reliability Engineering (RE) provides the Consistent Capability to Analyze, Predict, Prevent and Protect
Failures over the life of the product.
What will Fail? When will it Fail? Why will it Fail?
Design for Reliability (DfR) applies tools and techniques to ensure the a robust design is to operate reliably within
the distribution of stresses and variability of product, process, and environment encountered.
11
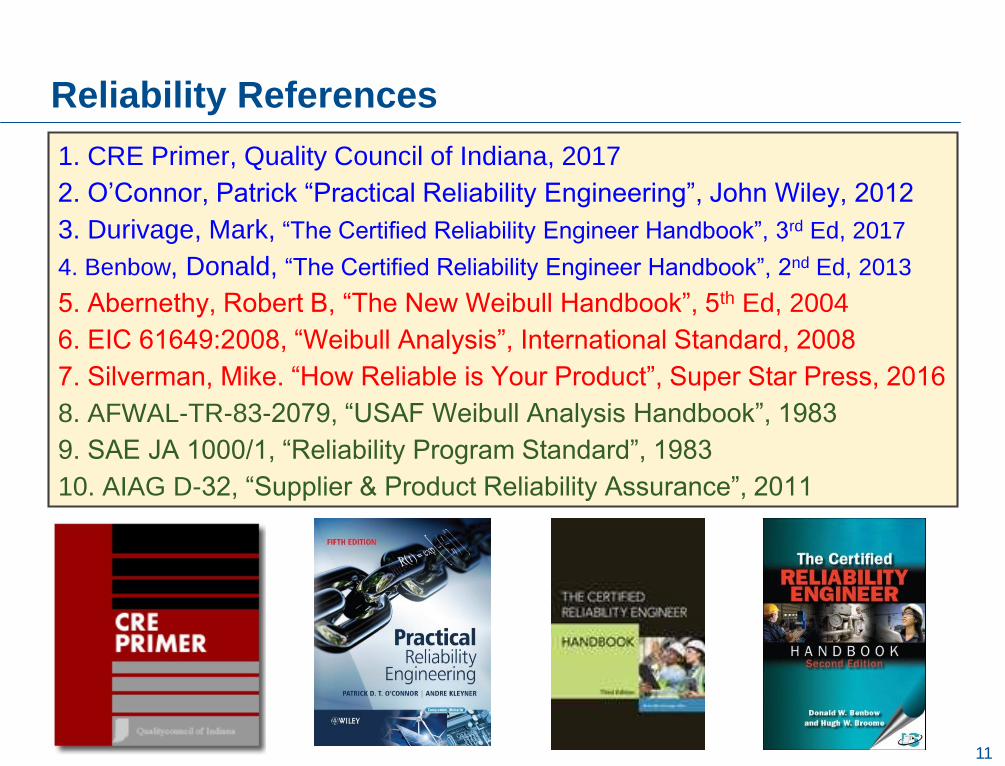
Reliability References
1. CRE Primer, Quality Council of Indiana, 2017
2. O’Connor, Patrick “Practical Reliability Engineering”, John Wiley, 2012
3. Durivage, Mark, “The Certified Reliability Engineer Handbook”, 3rd Ed, 2017
4. Benbow, Donald, “The Certified Reliability Engineer Handbook”, 2nd Ed, 2013
5. Abernethy, Robert B, “The New Weibull Handbook”, 5th Ed, 2004
6. EIC 61649:2008, “Weibull Analysis”, International Standard, 2008
7. Silverman, Mike. “How Reliable is Your Product”, Super Star Press, 2016
8. AFWAL-TR-83-2079, “USAF Weibull Analysis Handbook”, 1983
9. SAE JA 1000/1, “Reliability Program Standard”, 1983
10. AIAG D-32, “Supplier & Product Reliability Assurance”, 2011
12
Why Reliability
Ha Dao
13
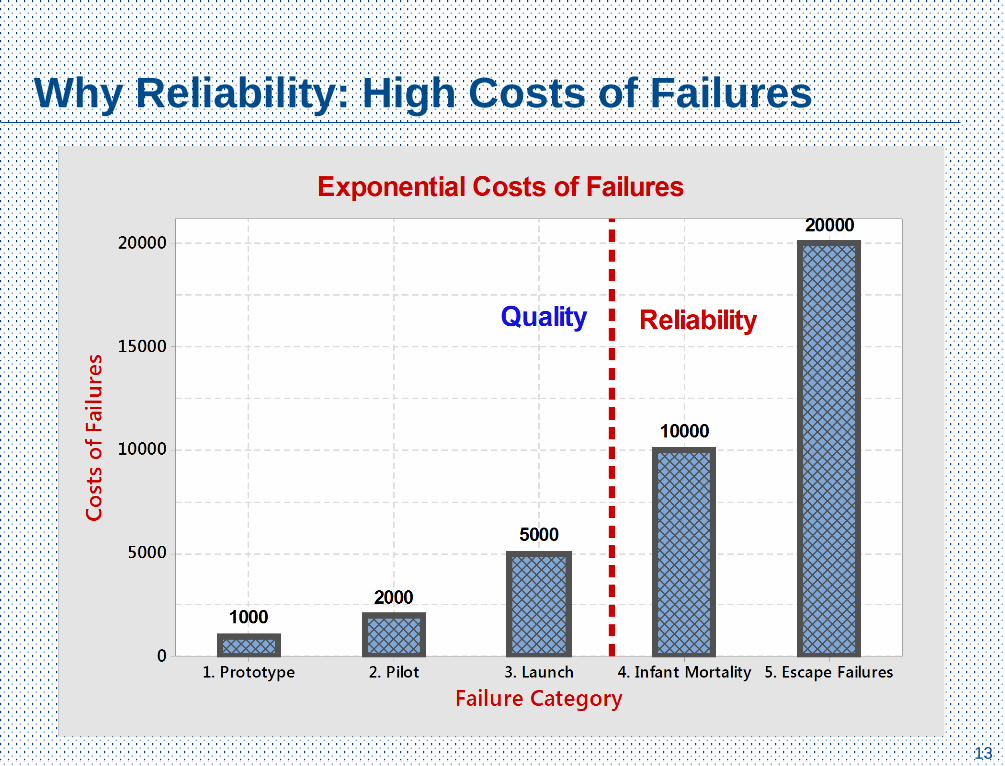
Why Reliability: High Costs of Failures

14
15
16
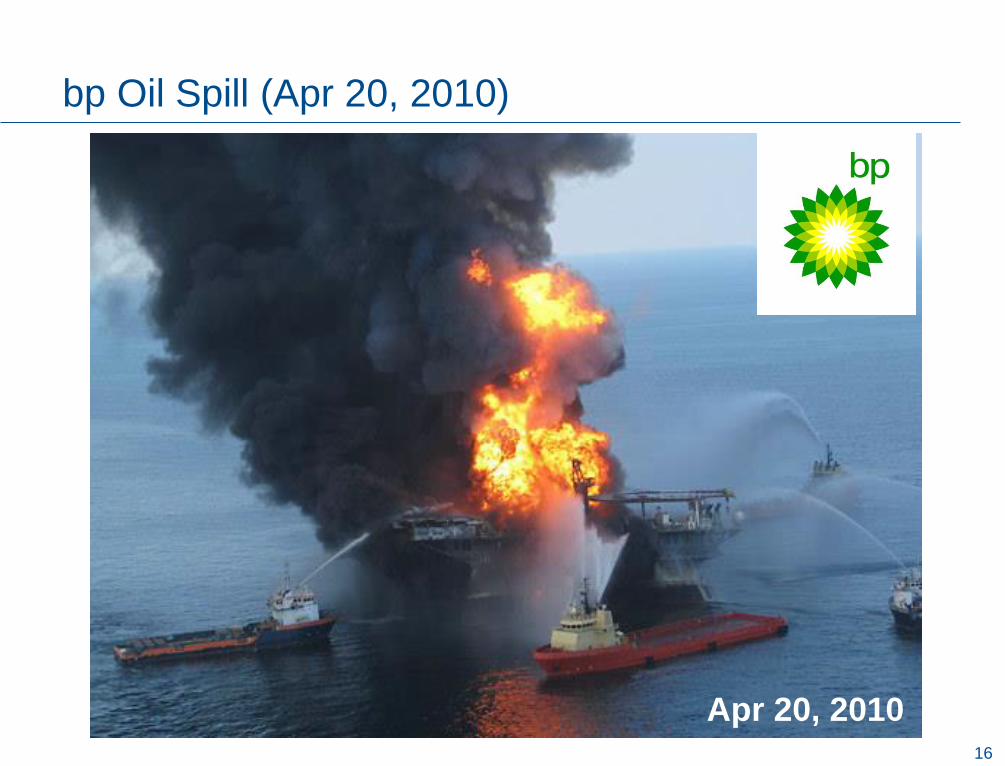
bp Oil Spill (Apr 20, 2010)
Apr 20, 2010
17
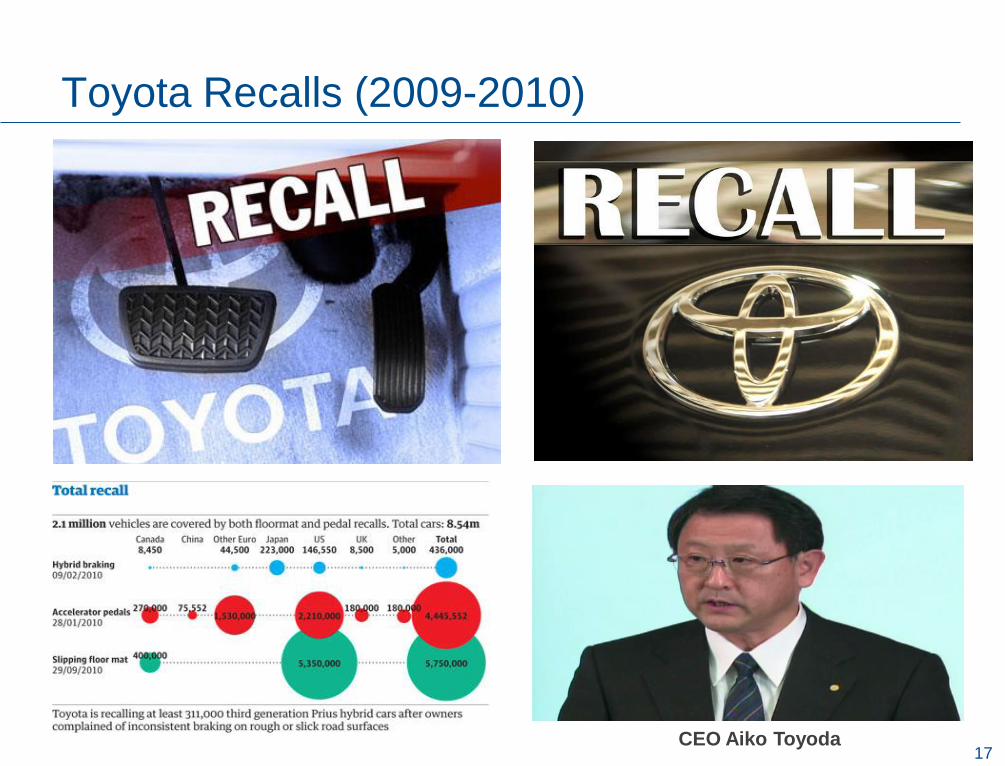
Toyota Recalls (2009-2010)
CEO Aiko Toyoda
18
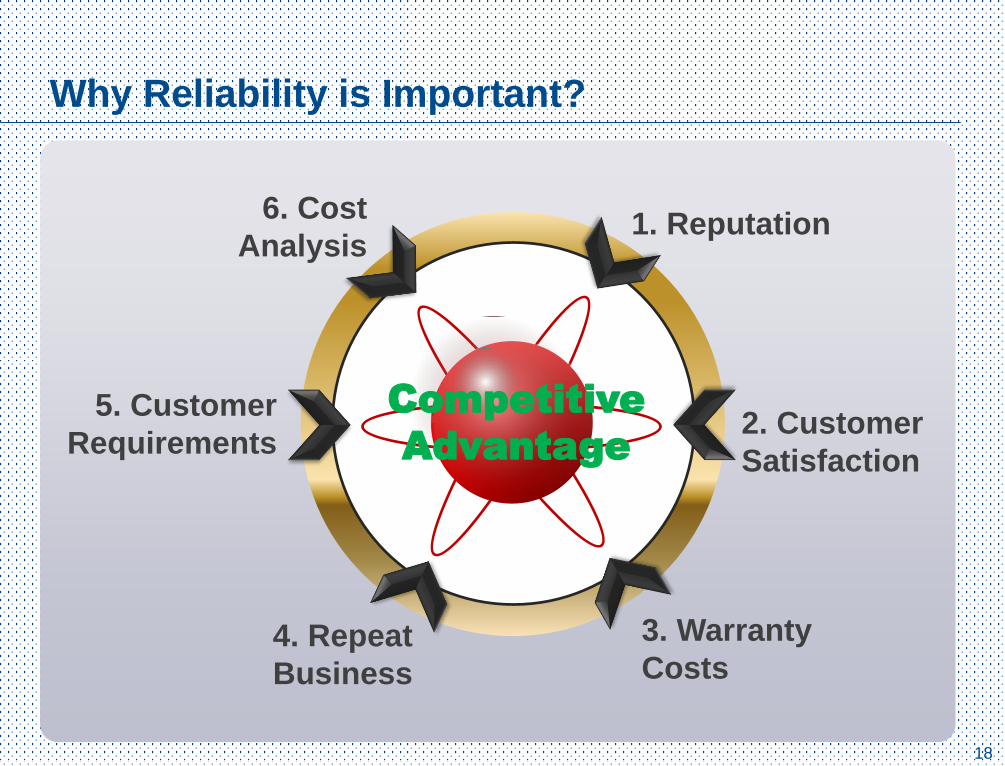
Why Reliability is Important?
1. Reputation
Competitive
Advantage
4. Repeat
Business
5. Customer
Requirements
6. Cost
Analysis
2. Customer
Satisfaction
3. Warranty
Costs
19
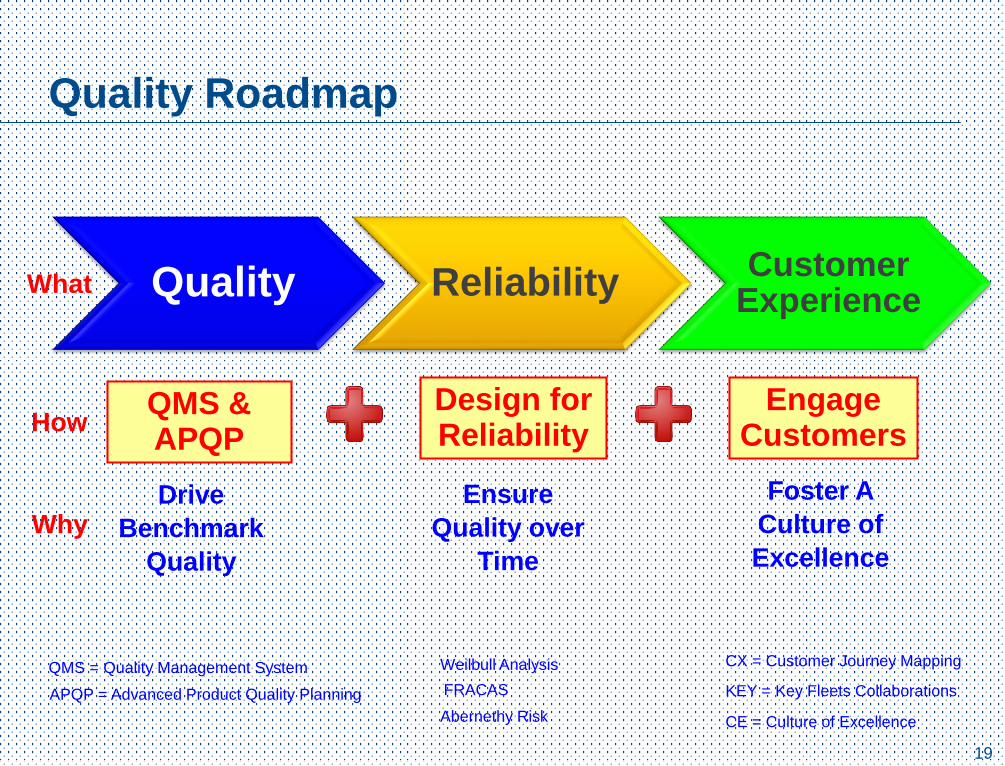
Quality Roadmap
APQP = Advanced Product Quality Planning
QMS = Quality Management System Weilbull Analysis
Quality ReliabilityCustomer
ExperienceWhat
QMS & APQP
Design for Reliability
Engage CustomersHow
Drive
Benchmark
Quality
Ensure
Quality over
Time
Foster A
Culture of
Excellence
Why
CE = Culture of Excellence
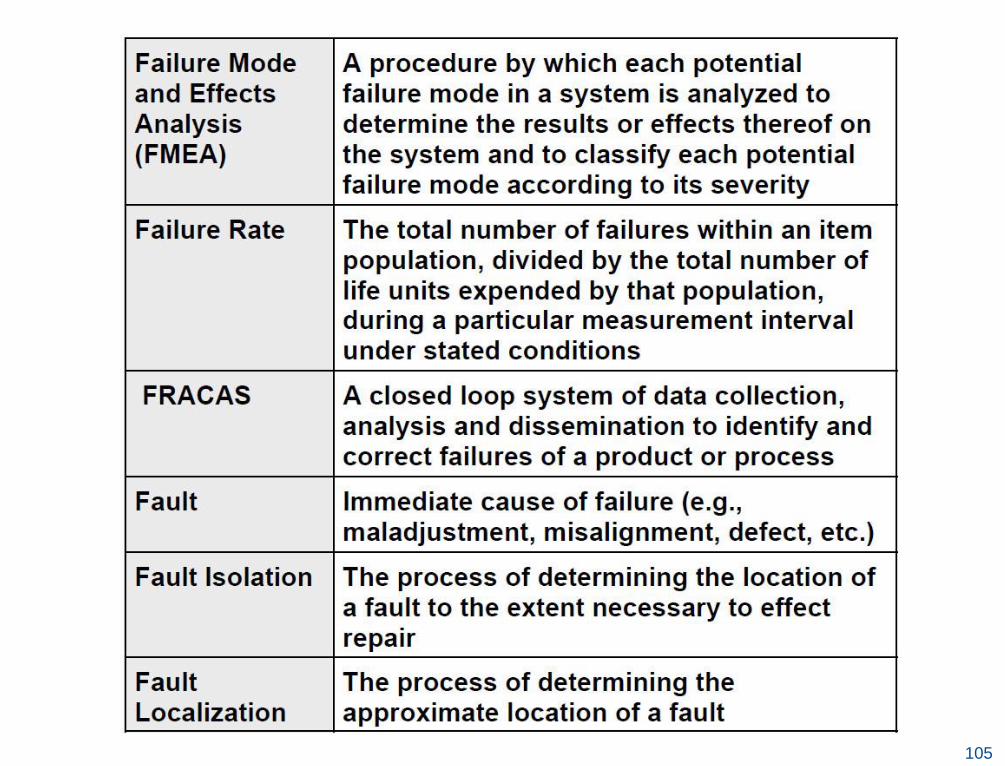
FRACAS
Abernethy Risk
CX = Customer Journey Mapping
KEY = Key Fleets Collaborations
20
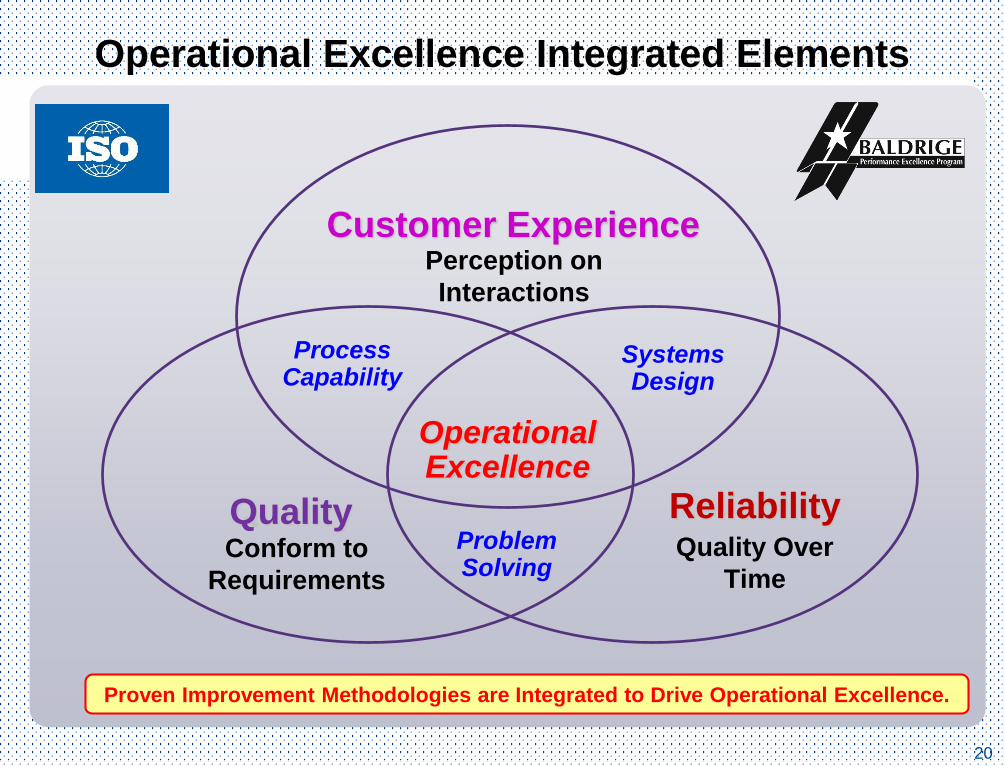
ProcessCapability
Problem Solving
SystemsDesign
Operational Excellence
Operational Excellence Integrated Elements
Customer ExperiencePerception on
Interactions
QualityConform to
Requirements
ReliabilityQuality Over
Time
Proven Improvement Methodologies are Integrated to Drive Operational Excellence.
21
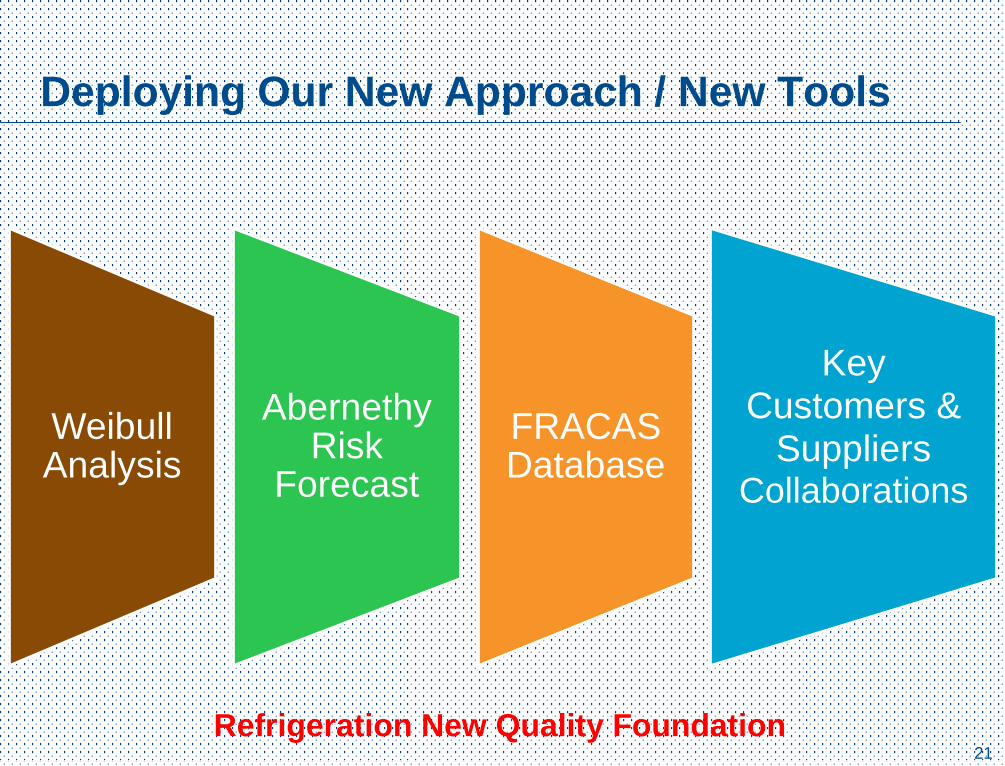
Deploying Our New Approach / New Tools
Weibull Analysis
Abernethy Risk
Forecast
FRACAS Database
Key Customers &
SuppliersCollaborations
Refrigeration New Quality Foundation
22
Weibull Analysis
Ha Dao
23

24
What is Weibull?
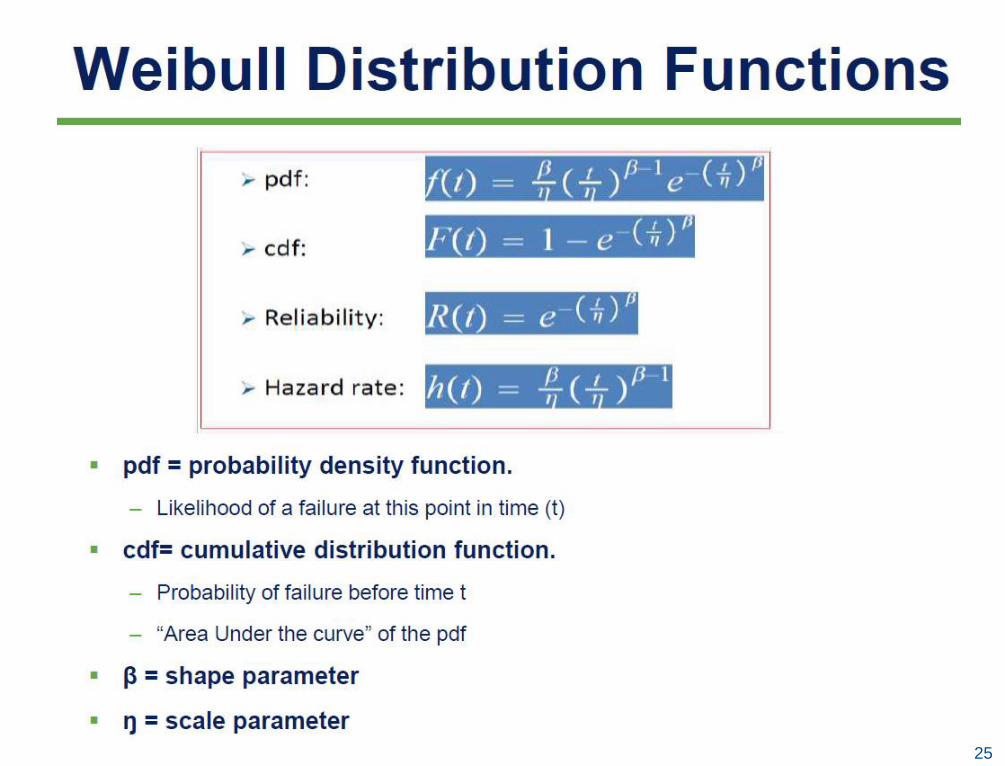
25
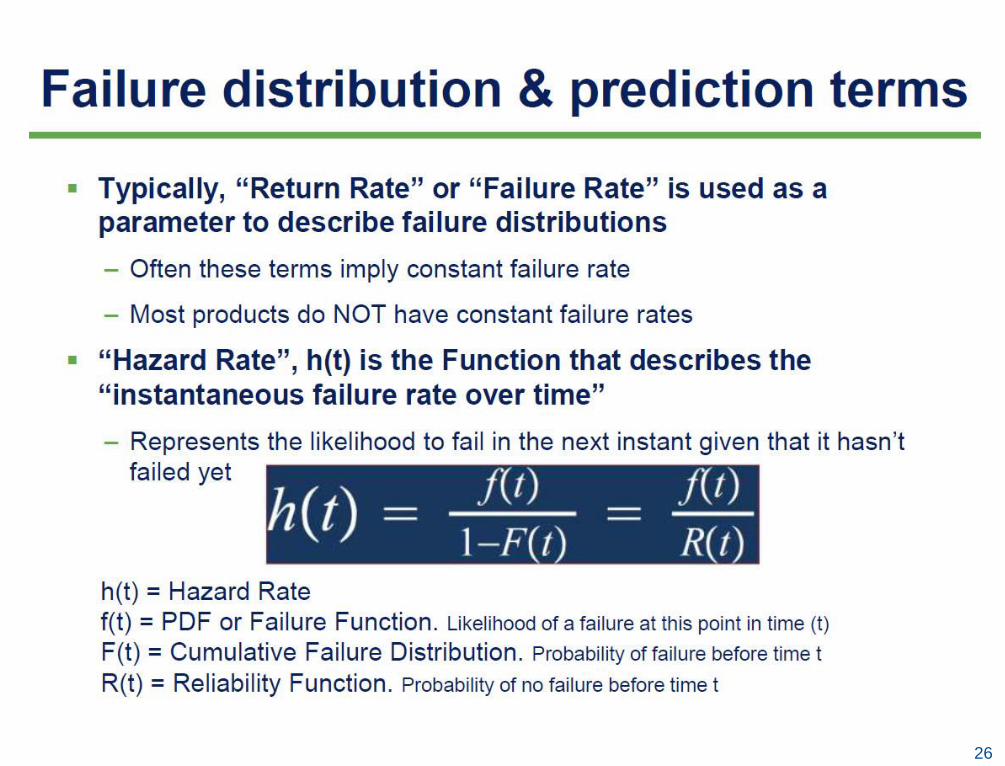
26
27
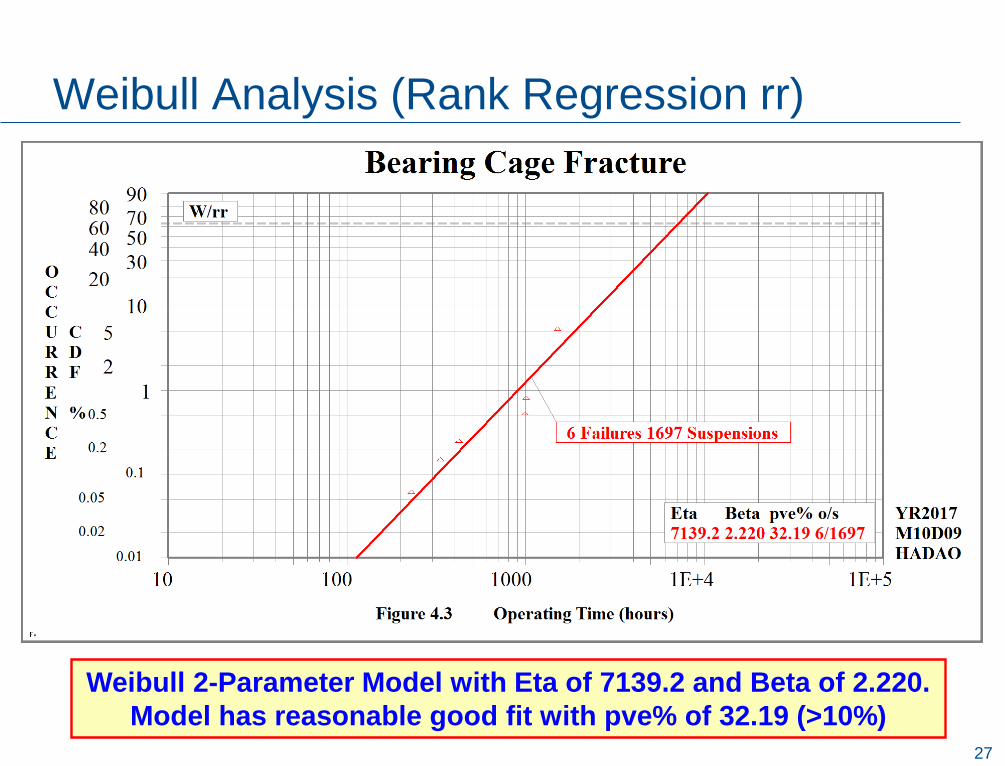
Weibull Analysis (Rank Regression rr)
Weibull 2-Parameter Model with Eta of 7139.2 and Beta of 2.220.
Model has reasonable good fit with pve% of 32.19 (>10%)
28
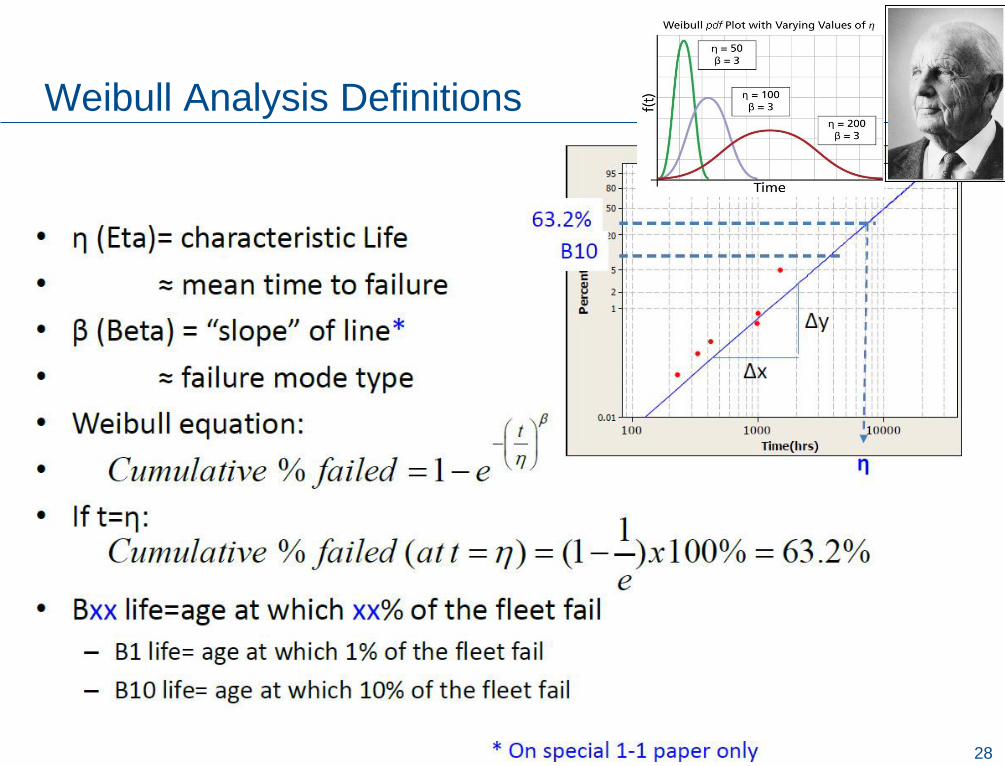
Weibull Analysis Definitions
29
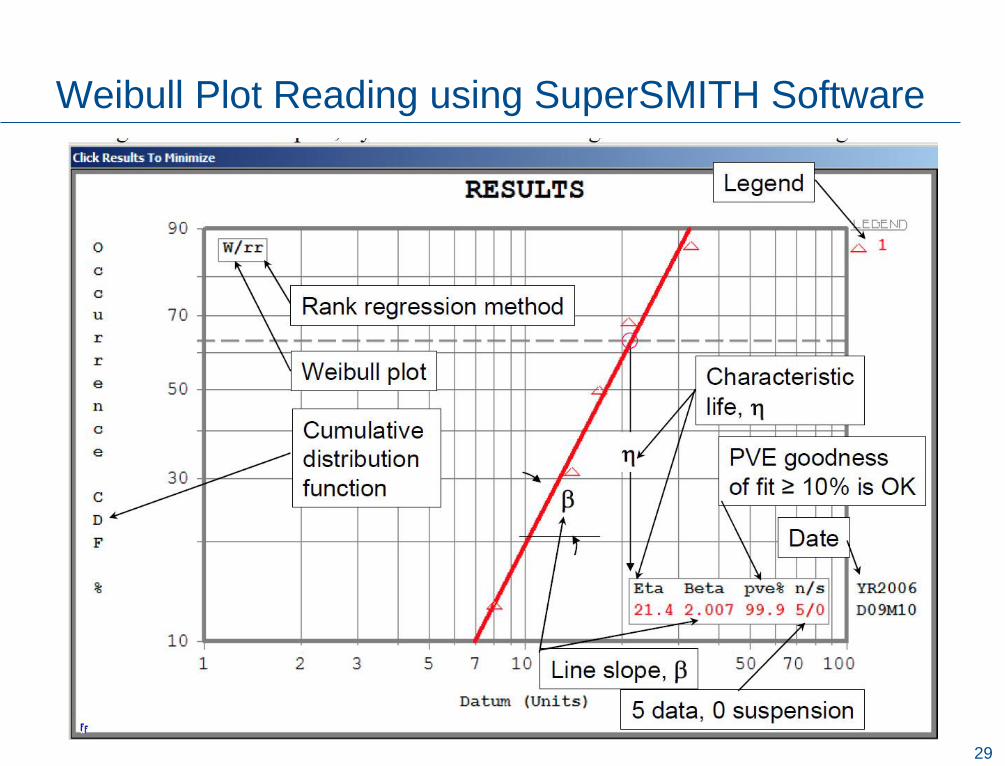
Weibull Plot Reading using SuperSMITH Software
30
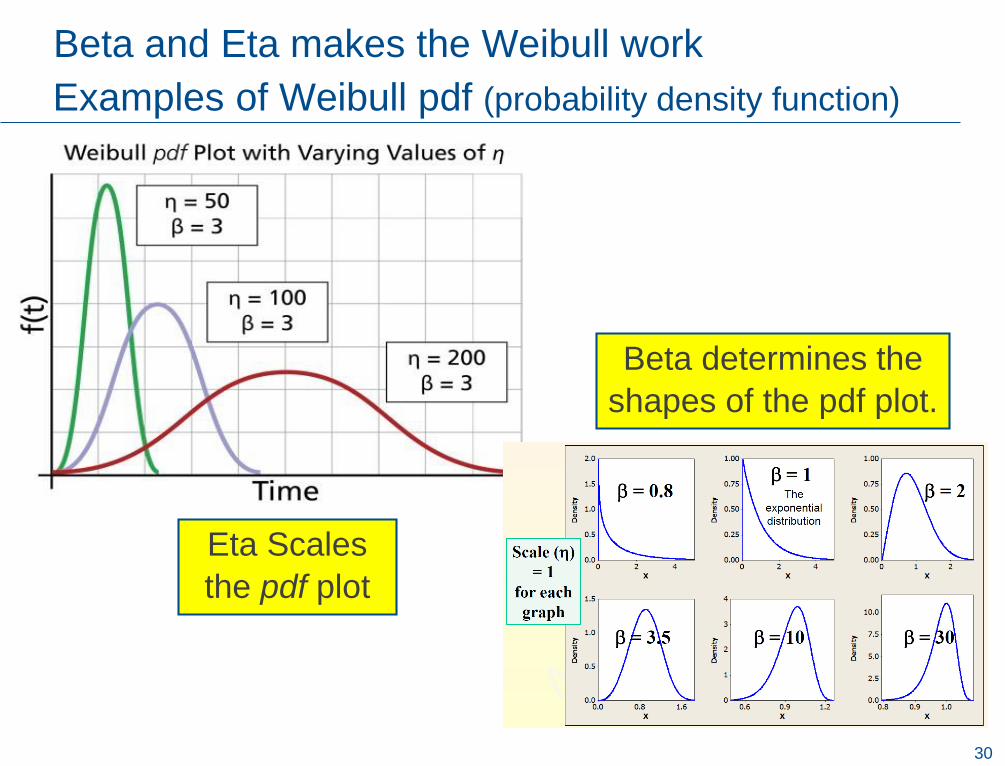
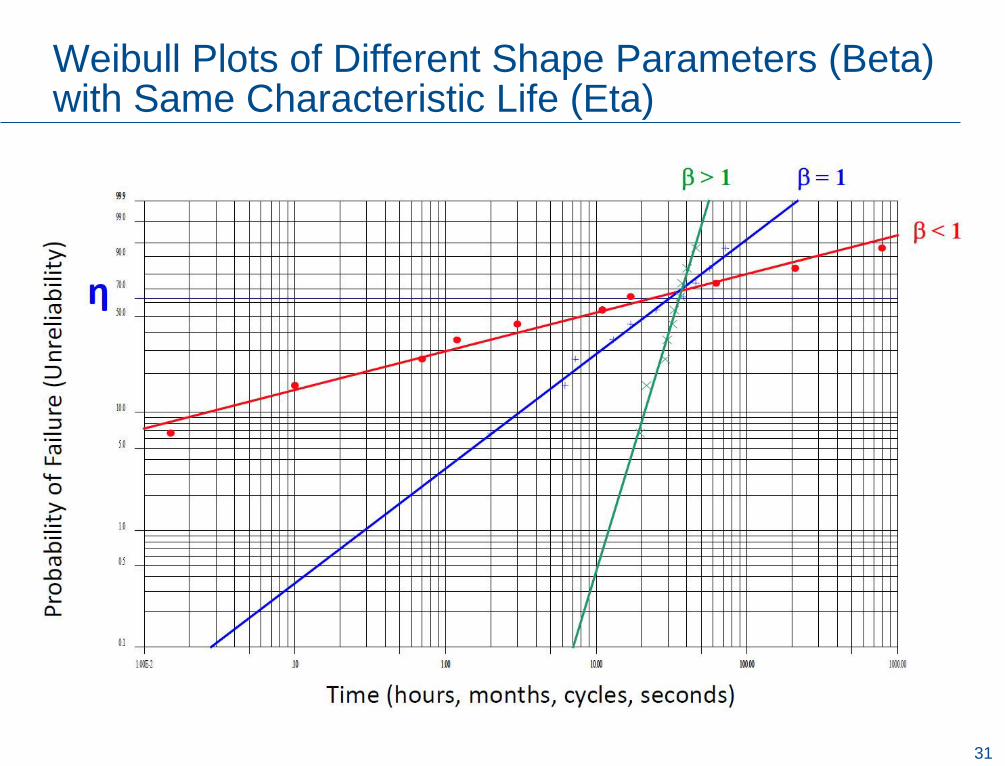
Examples of Weibull pdf (probability density function)
Eta Scales
the pdf plot
Beta determines the
shapes of the pdf plot.
Beta and Eta makes the Weibull work
31
Weibull Plots of Different Shape Parameters (Beta)with Same Characteristic Life (Eta)
32
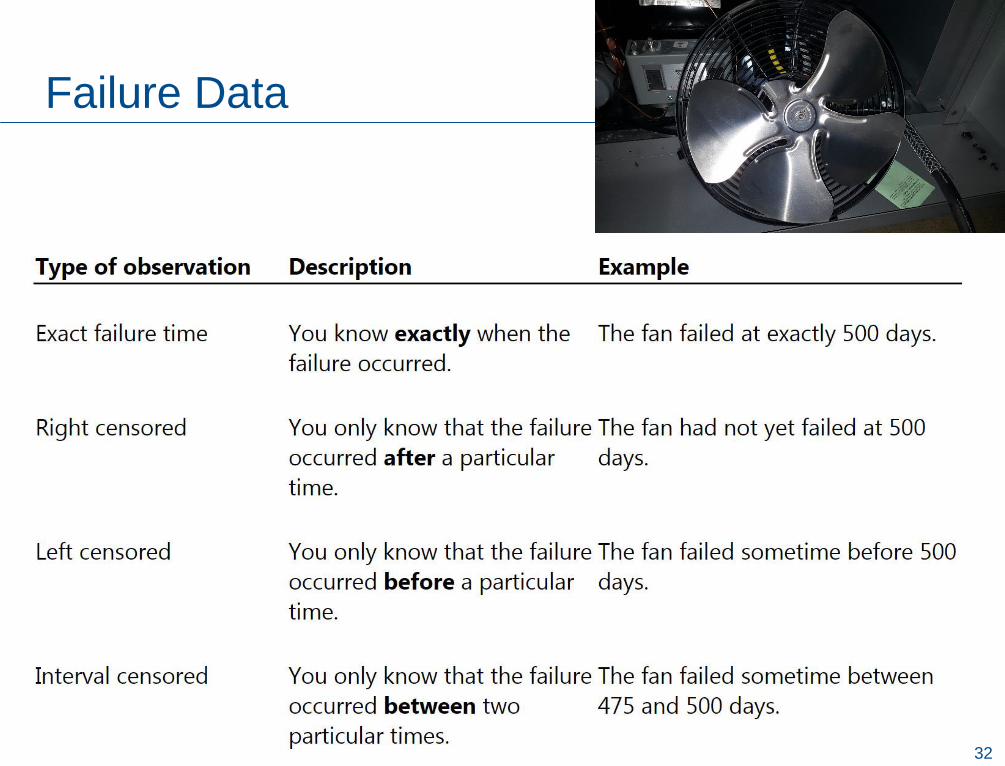
Failure Data
33
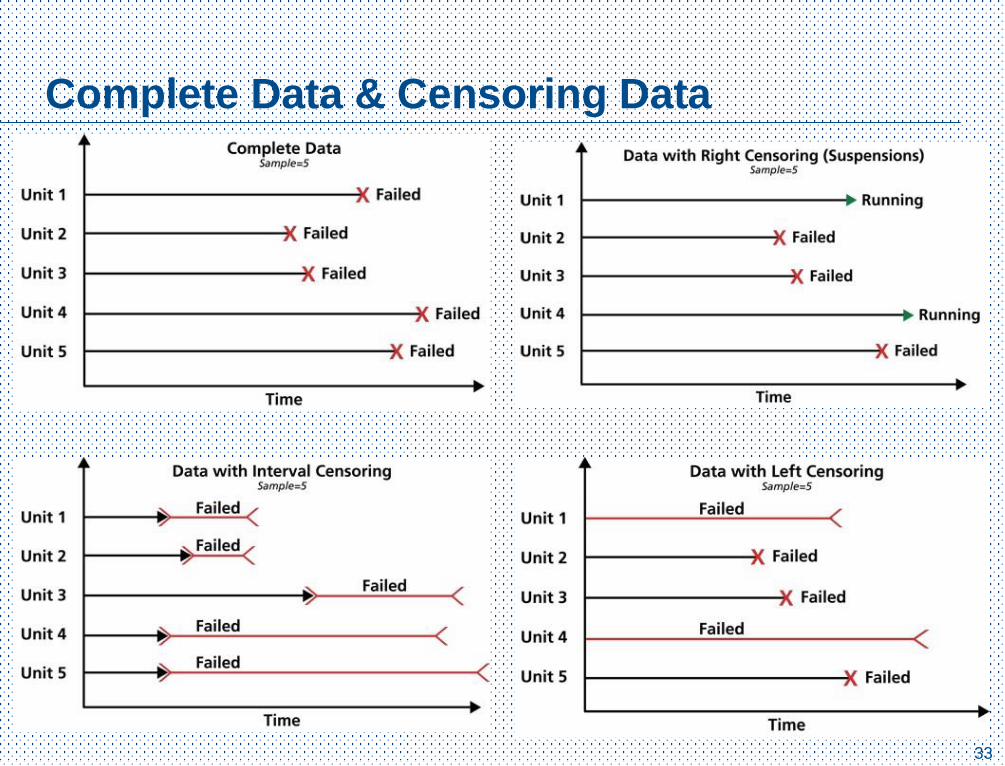
Complete Data & Censoring Data

34
Least Square (LSXY) vs Maximum Likelihood (MLE)
• Least squares estimates (LSXY) are calculated by fitting a regression line to the points in a probability plot. The line is formed by regressing time to failure or log(time to failure) on the transformed percent.
• Maximum likelihood estimates (MLE) are calculated by maximizing the likelihood function. The likelihood function describes for each set of distribution parameters the chance that the true distribution has these parameters based on the sample.
Major advantages of each method:
• Least squares:
• The probability plot has a better graphical display because the line is fitted to the points.
• For small or heavily censored samples, LSXY is more accurate than MLE. MLE tends to overestimate the shape parameter for a Weibull distribution and underestimate the scale parameter in other distributions. Therefore, MLE will tend to overestimate the low percentiles .
• Maximum likelihood:
• Distribution parameter estimates are more precise than LSXY.
• When there are few failures, MLE enables you to perform analyses.
• When there is only one failure and some right censored observations, maximum likelihood parameter estimates may exist.
• MLE has attractive mathematical qualities.
When possible, both methods should be tried. If the results are consistent, then there is more support for your conclusions. Otherwise, you may want to use the more conservative estimates
or consider the advantages of both approaches and choose one based on your problem.
35
Paper Clips Bending Exercise
Ha Dao
36
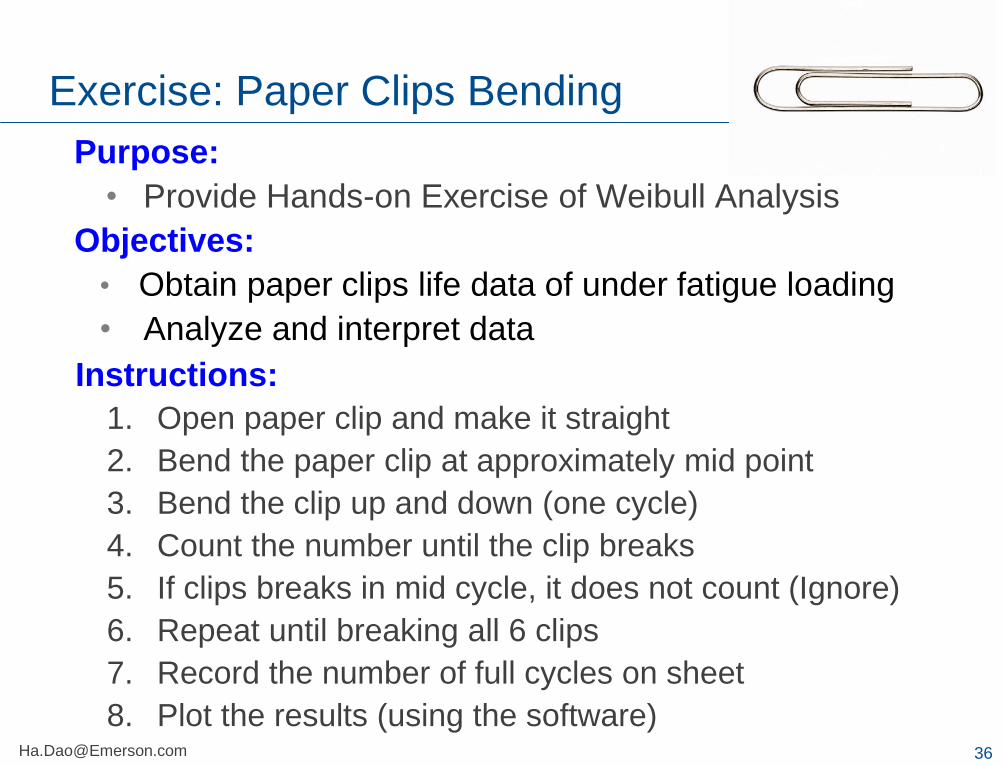
Purpose:
• Provide Hands-on Exercise of Weibull Analysis
Objectives:
• Obtain paper clips life data of under fatigue loading
• Analyze and interpret data
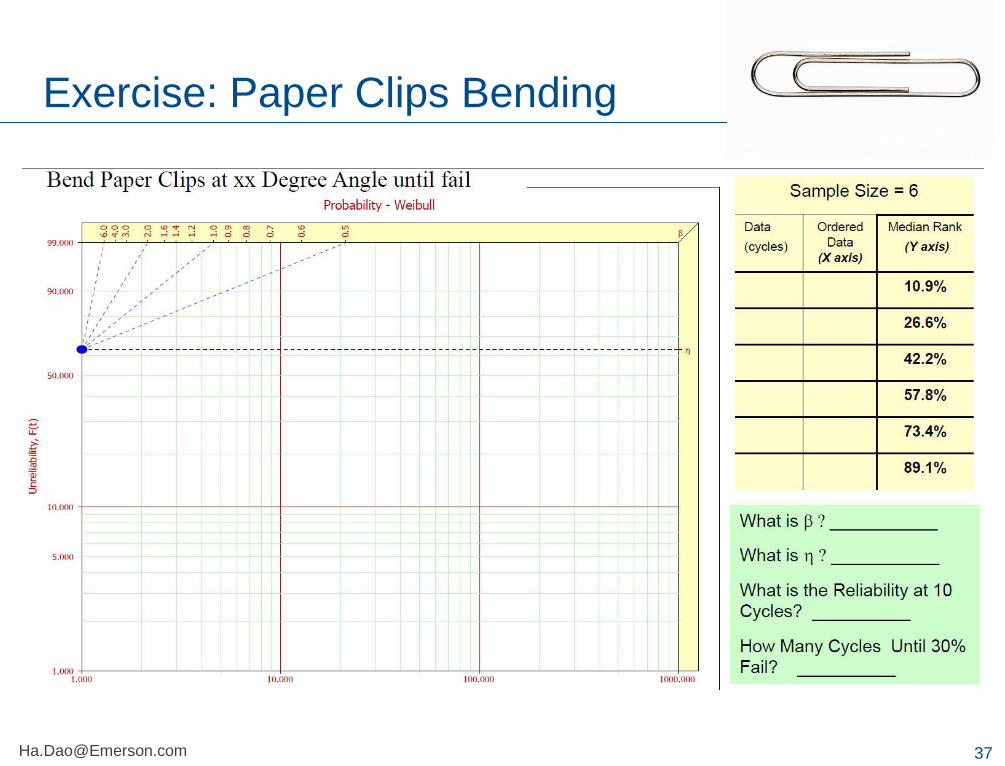
Exercise: Paper Clips Bending
Instructions:
1. Open paper clip and make it straight
2. Bend the paper clip at approximately mid point
3. Bend the clip up and down (one cycle)
4. Count the number until the clip breaks
5. If clips breaks in mid cycle, it does not count (Ignore)
6. Repeat until breaking all 6 clips
7. Record the number of full cycles on sheet
8. Plot the results (using the software)[email protected]
38
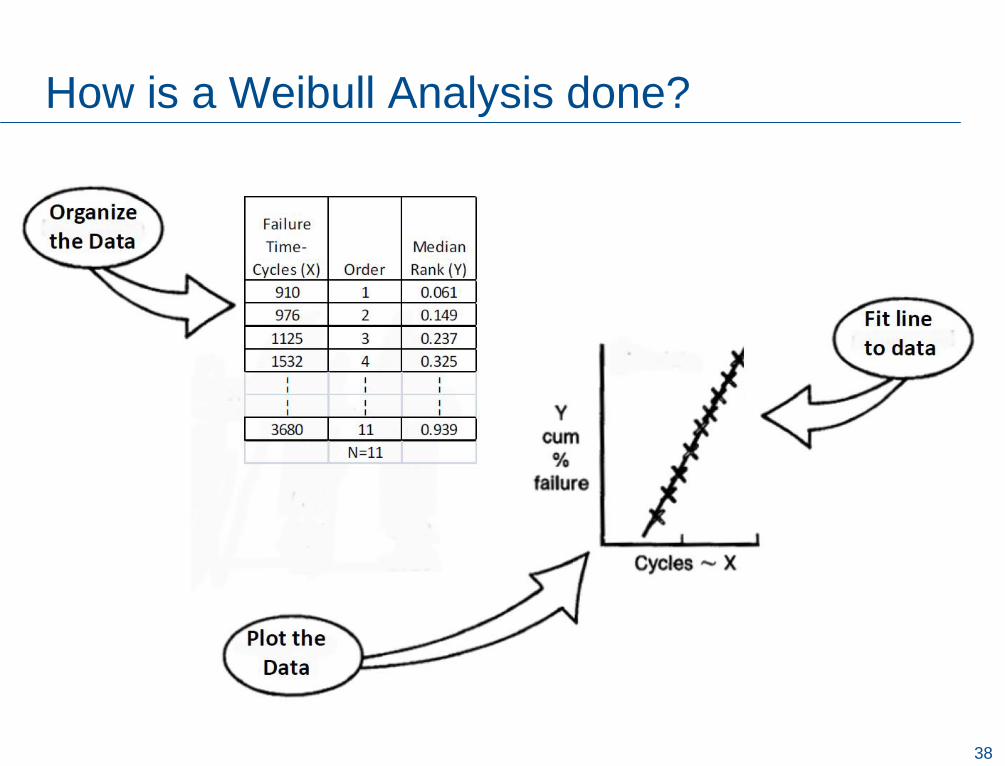
How is a Weibull Analysis done?
39
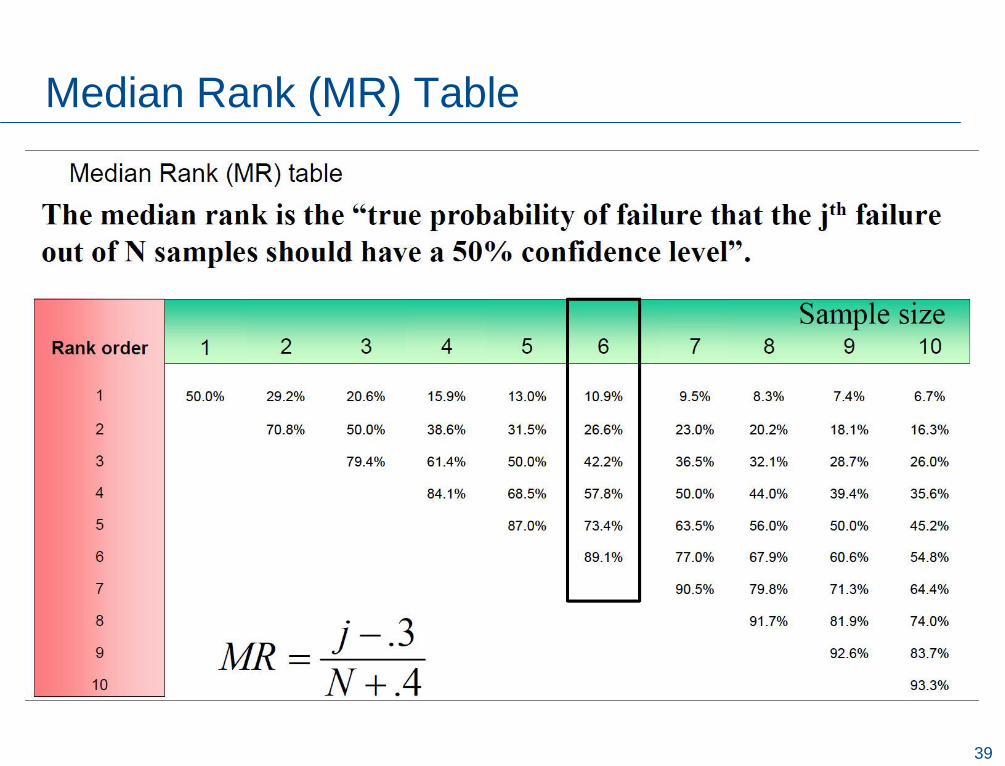
Median Rank (MR) Table
40
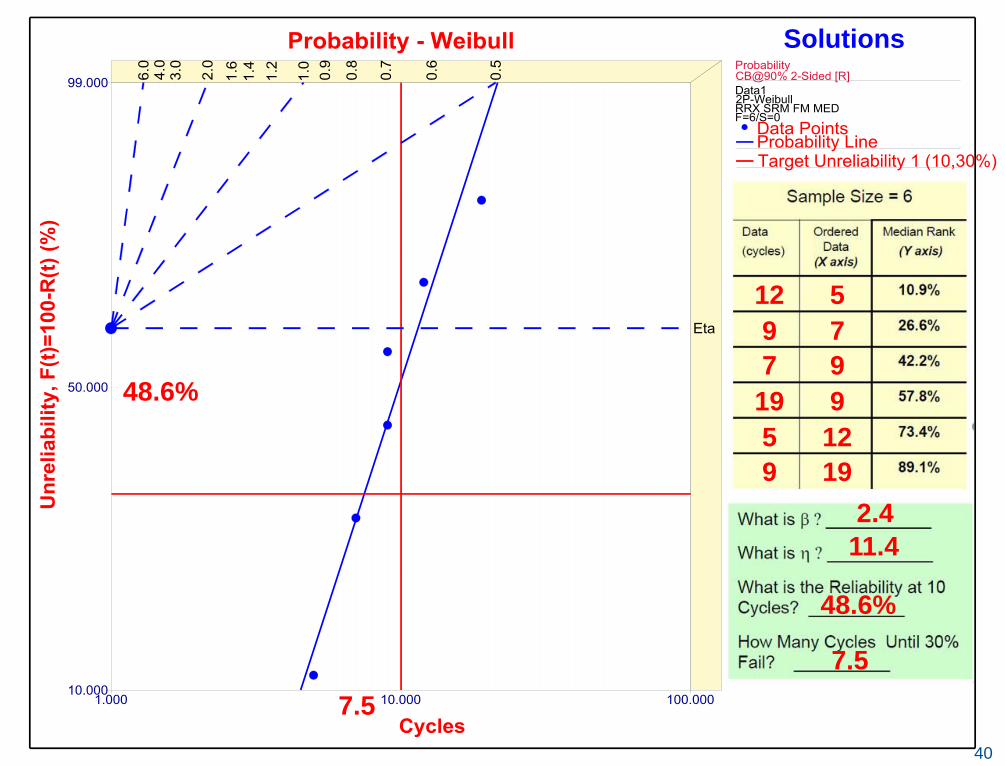
2.4
11.4
48.6%
7.5
5
7
9
9
12
19
12
9
7
19
5
9
48.6%
7.5
Solutions

41
Dead Batteries Exercise
Problem Scenario:
1. Contacted by car dealers for
dead batteries.
2. Problem being found at .3%
car dealers (about 3 in 1000).
3. More than 95% of the dead
batteries were found on
recently delivered vehicles.
4. All of dead batteries are field
failures. Replace the battery
fixed the problem.
5. Records showed 100% of
batteries passed final
inspection at the battery plant.
External Circuit
Cell Construction and Operation
Positive
Plate
Negative
Plate
Grid Grid
Positive Active
Material
Negative Active
Material
Electrolyte
Separator
Electron
Flow
Ionic
Current
+ -
-
-
+
On the Flip Chart, work as a team for 10 minutes to develop a
problem solving plan. Have a spokesperson to share your plan.
42
Stress-Strength Interference Model
Ha Dao
43
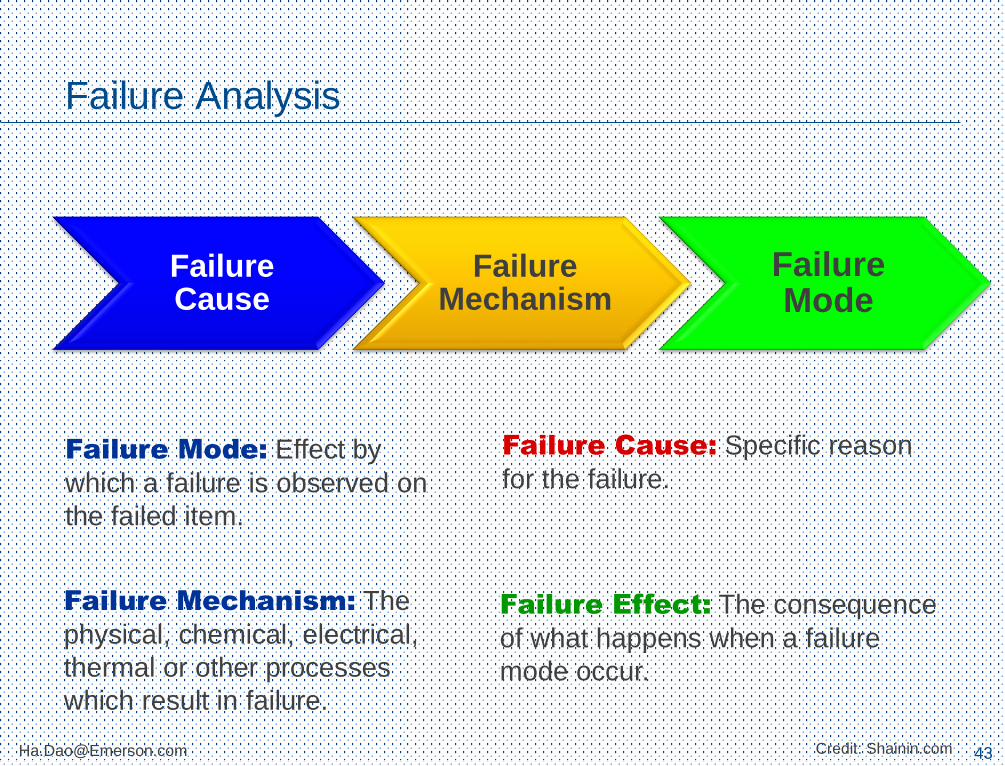
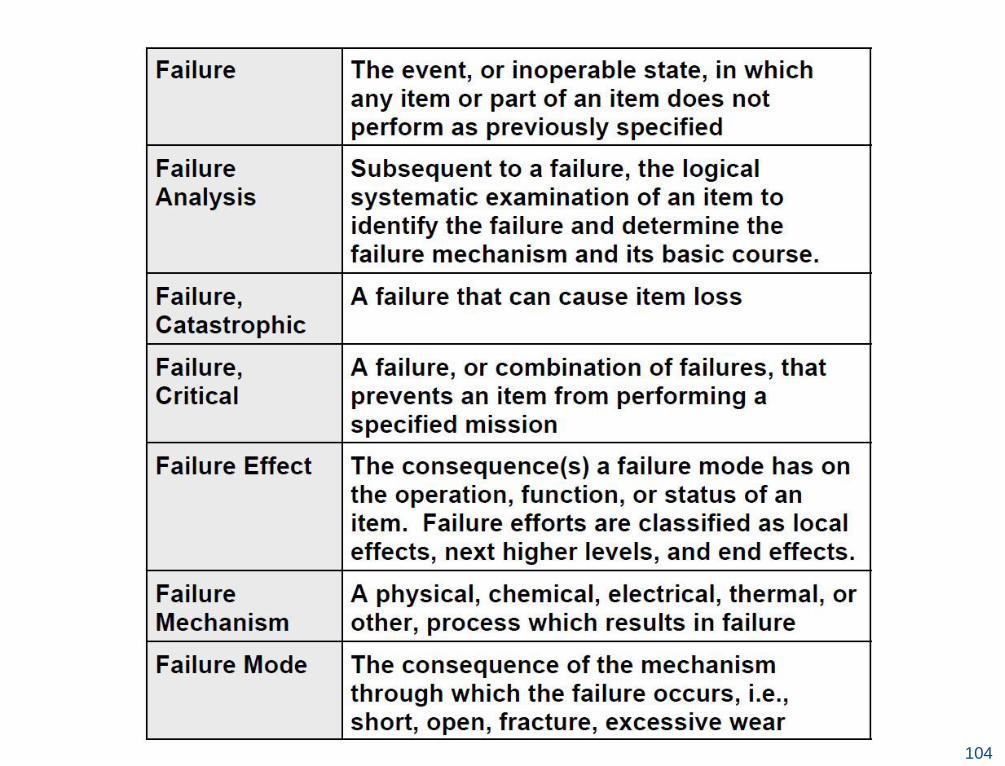
Failure Analysis
Failure Mode: Effect by
which a failure is observed on
the failed item.
Failure Mechanism: The
physical, chemical, electrical,
thermal or other processes
which result in failure.
Failure Cause: Specific reason
for the failure.
Failure Effect: The consequence
of what happens when a failure
mode occur.
Credit: [email protected]
Failure Cause
Failure Mechanism
Failure Mode
44
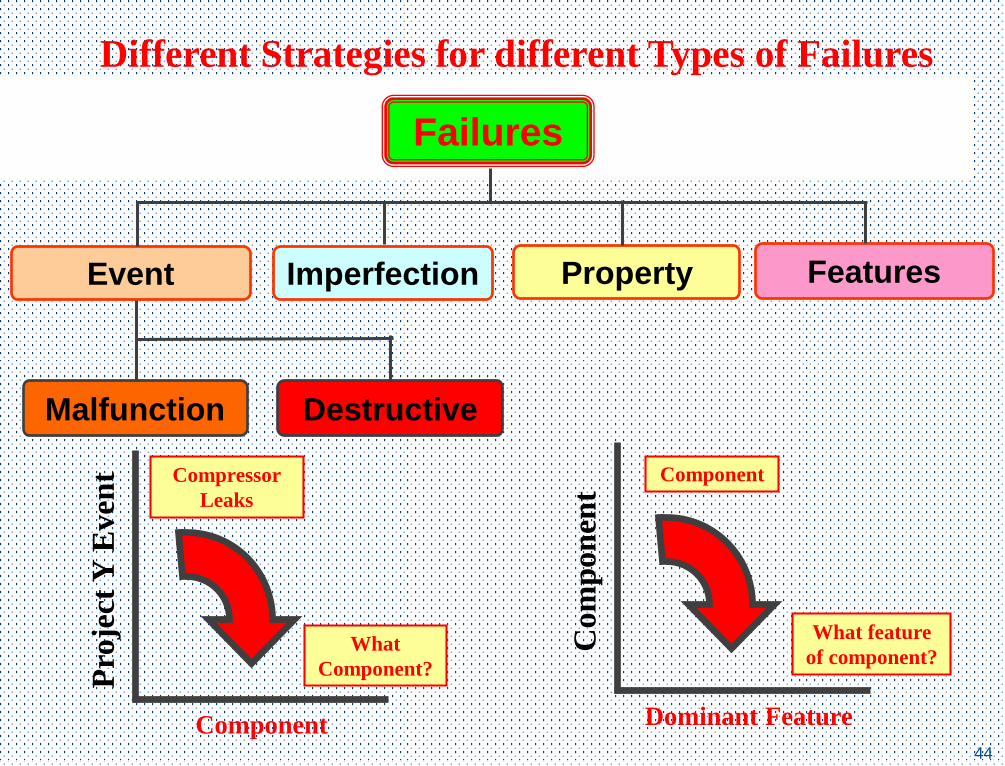
Failures
Event
Different Strategies for different Types of Failures
FeaturesImperfection
Malfunction Destructive
Component
Pro
ject
Y E
ven
t Compressor
Leaks
What
Component?
Dominant Feature
Com
po
nen
t
Component
What feature
of component?
Property
45
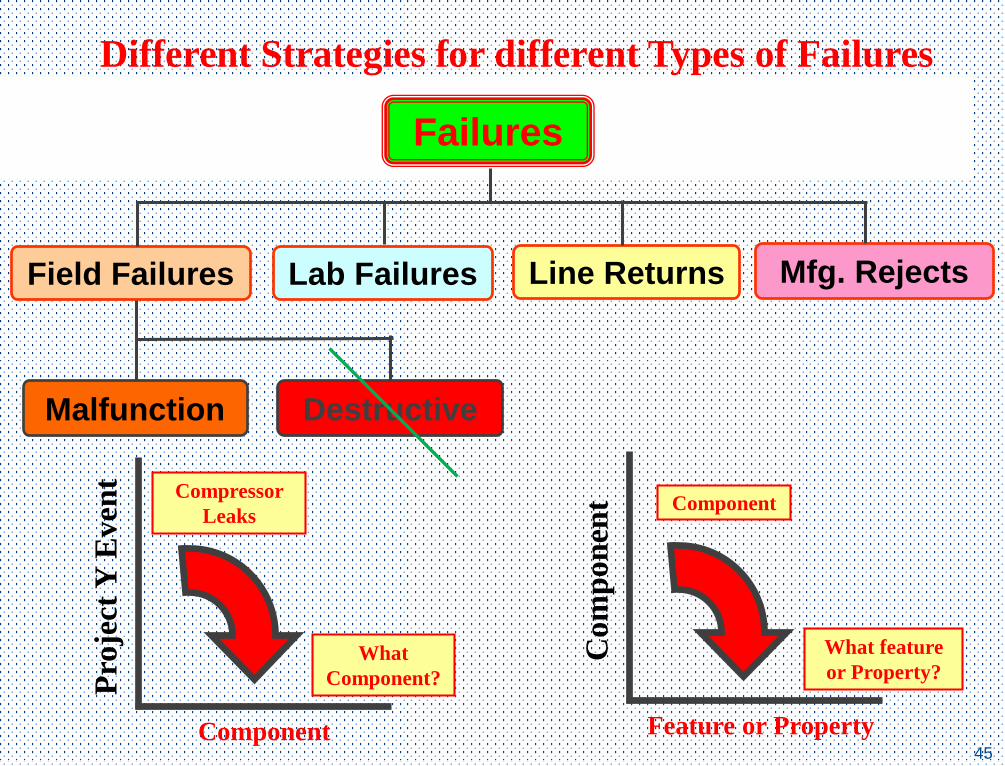
Failures
Field Failures
Different Strategies for different Types of Failures
Mfg. RejectsLab Failures
Malfunction Destructive
Line Returns
Component
Pro
ject
Y E
ven
t Compressor
Leaks
What
Component?
Feature or Property
Com
po
nen
t Component
What feature
or Property?
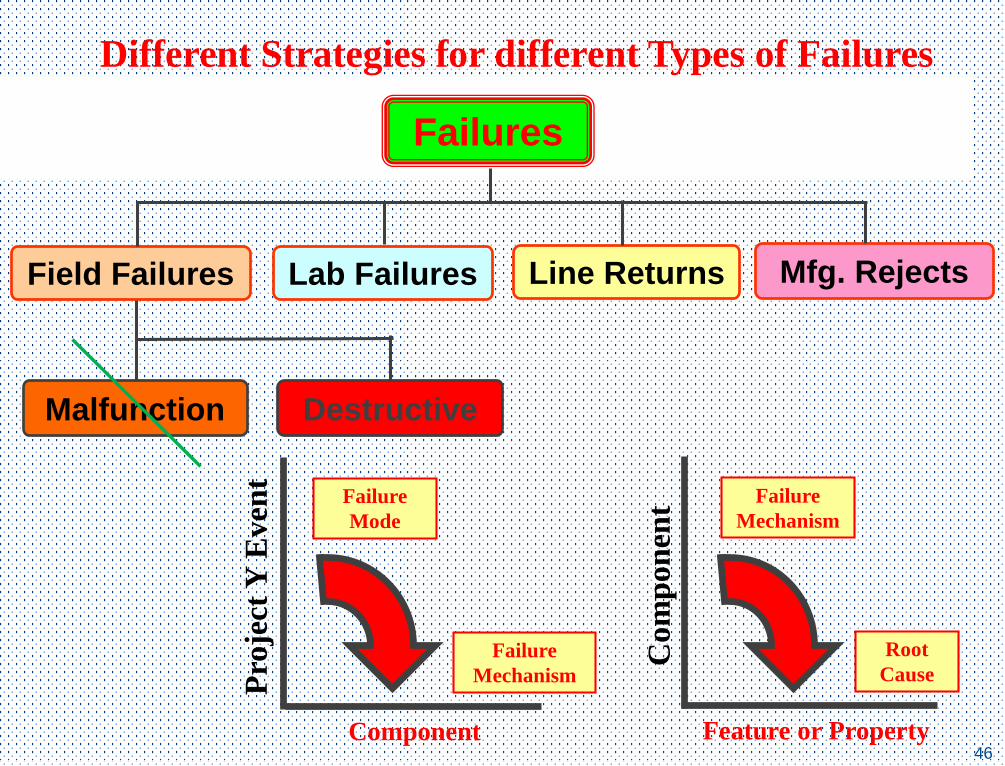
46
Failures
Field Failures
Different Strategies for different Types of Failures
Mfg. RejectsLab Failures
Malfunction Destructive
Line Returns
Component
Pro
ject
Y E
ven
t
Failure
Mode
Failure
Mechanism
Feature or Property
Com
po
nen
t Failure
Mechanism
Root
Cause
4747
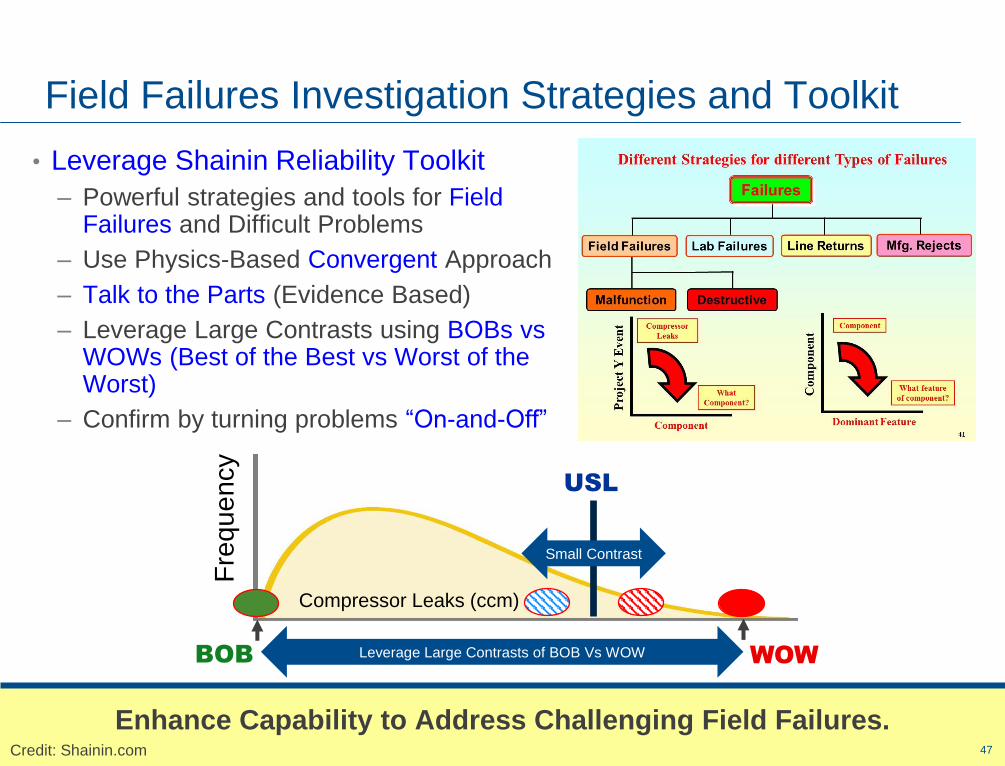
Field Failures Investigation Strategies and Toolkit
Enhance Capability to Address Challenging Field Failures.
• Leverage Shainin Reliability Toolkit
– Powerful strategies and tools for Field Failures and Difficult Problems
– Use Physics-Based Convergent Approach
– Talk to the Parts (Evidence Based)
– Leverage Large Contrasts using BOBs vs WOWs (Best of the Best vs Worst of the Worst)
– Confirm by turning problems “On-and-Off”
USL
Compressor Leaks (ccm)
Fre
qu
en
cy
Small Contrast
WOWBOB Leverage Large Contrasts of BOB Vs WOW
Credit: Shainin.com
48
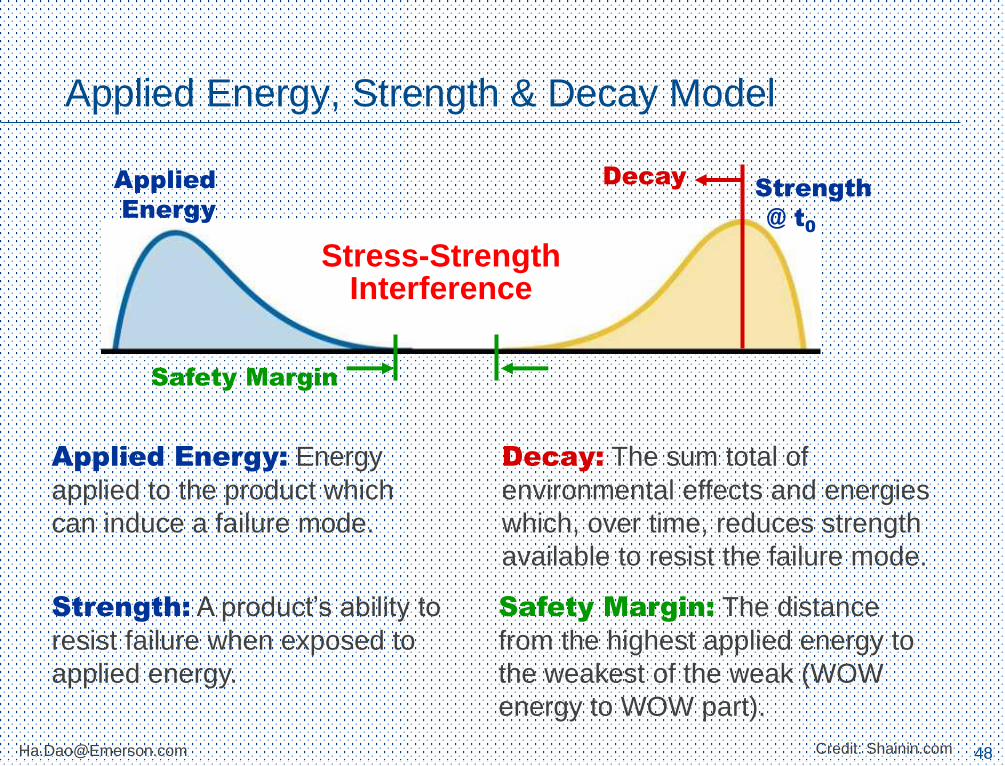
Applied Energy, Strength & Decay Model
Strength
@ t0
Applied
Energy
Decay
Safety Margin
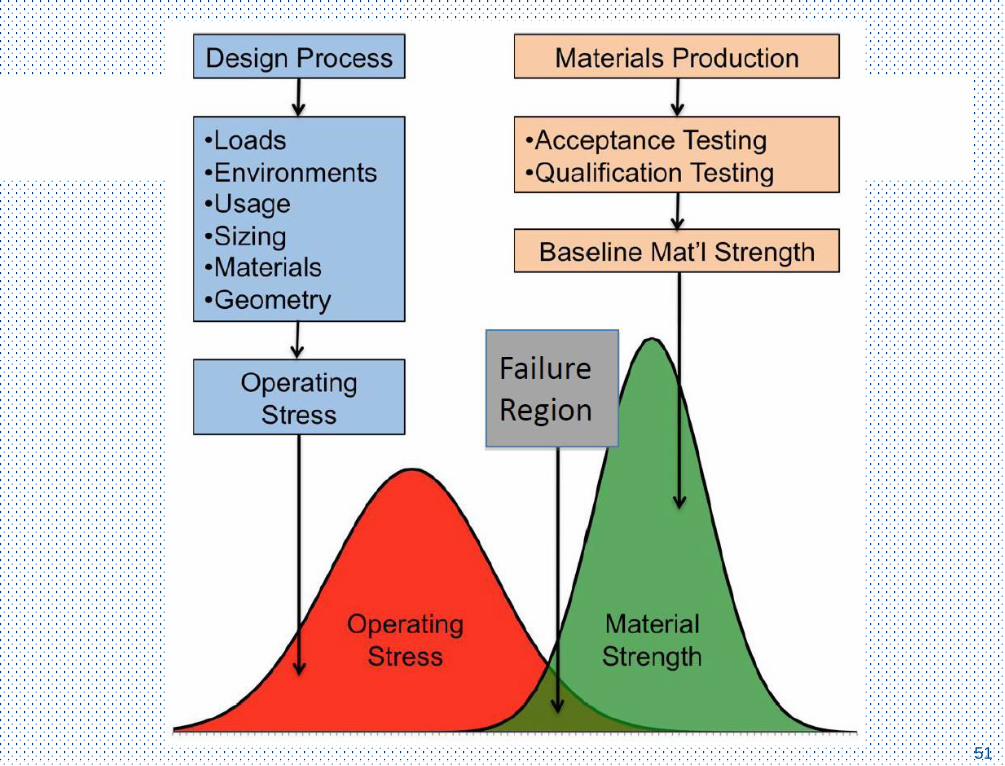
Strength: A product’s ability to
resist failure when exposed to
applied energy.
Applied Energy: Energy
applied to the product which
can induce a failure mode.
Decay: The sum total of
environmental effects and energies
which, over time, reduces strength
available to resist the failure mode.
Safety Margin: The distance
from the highest applied energy to
the weakest of the weak (WOW
energy to WOW part).
Credit: Shainin.com
Stress-Strength Interference
49
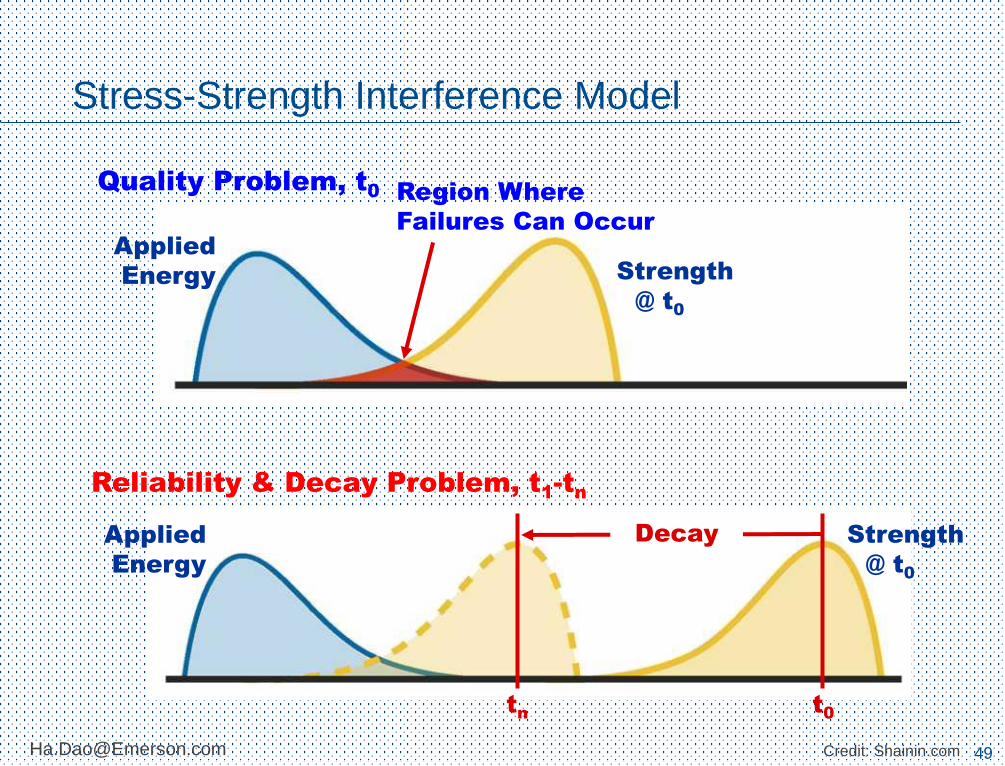
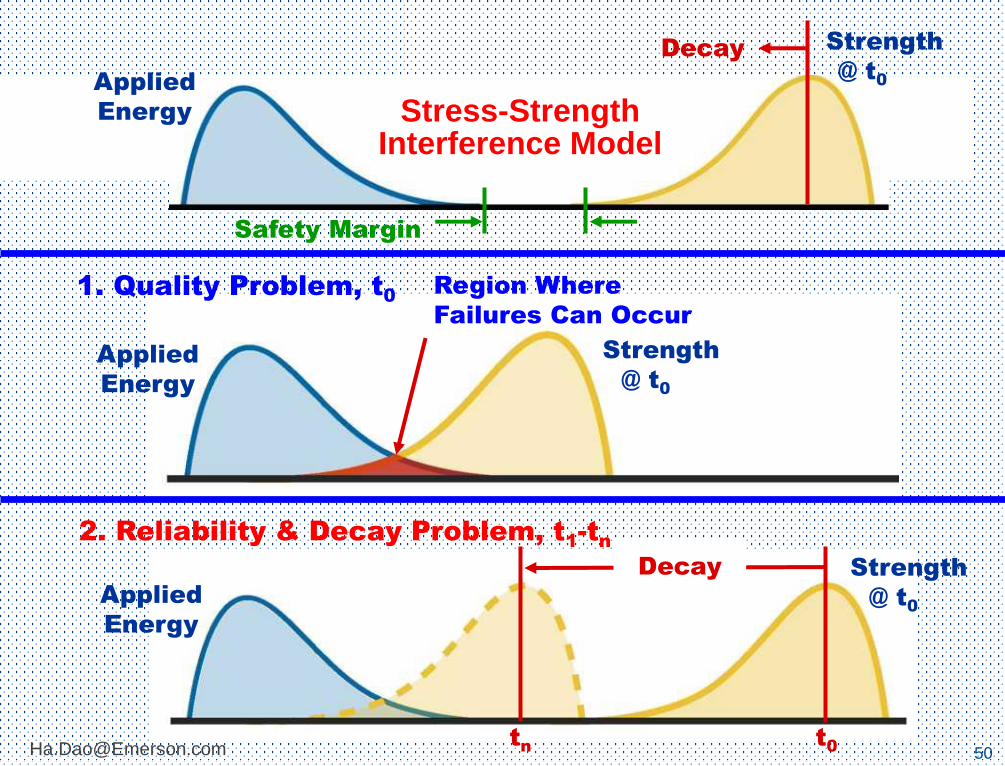
Stress-Strength Interference Model
Strength
@ t0
Applied
Energy
Quality Problem, t0 Region Where
Failures Can Occur
tn
t0
Decay
Reliability & Decay Problem, t1-t
n
Strength
@ t0
Applied
Energy
Credit: [email protected]
50
Strength
@ t0
Applied
Energy
1. Quality Problem, t0
Region Where
Failures Can Occur
tn
t0
Decay
2. Reliability & Decay Problem, t1-t
n
Strength
@ t0
Applied
Energy
Strength
@ t0Applied
Energy
Decay
Safety Margin
Stress-Strength Interference Model
51
53
54
Practical Applications
Ha Dao
55
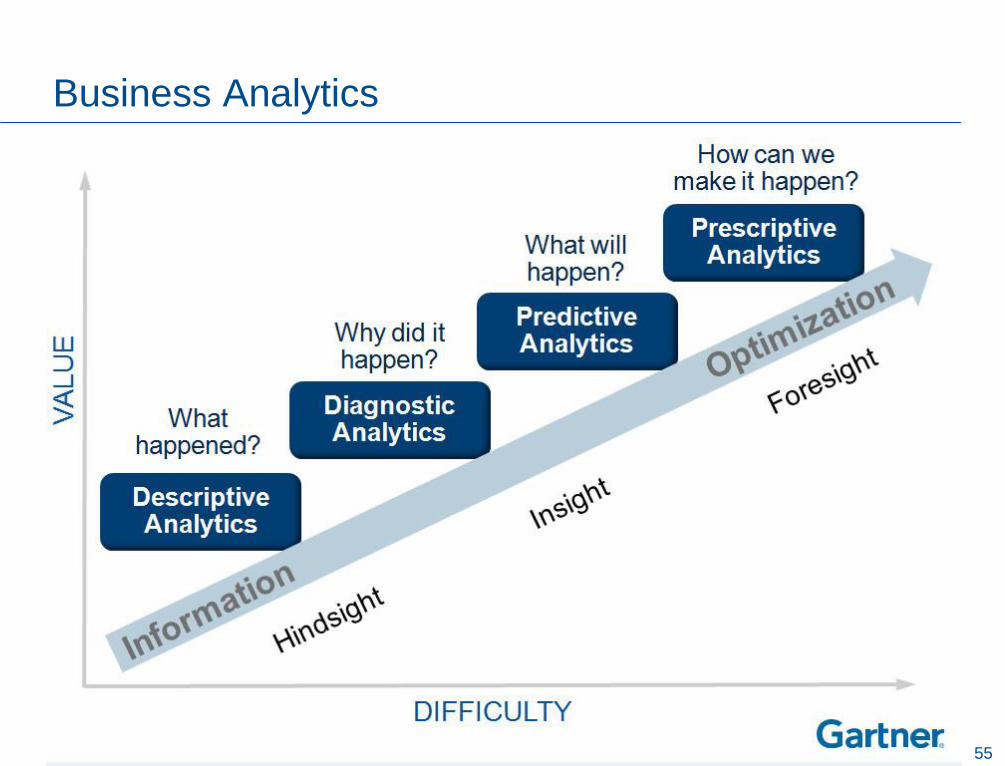
Business Analytics
56
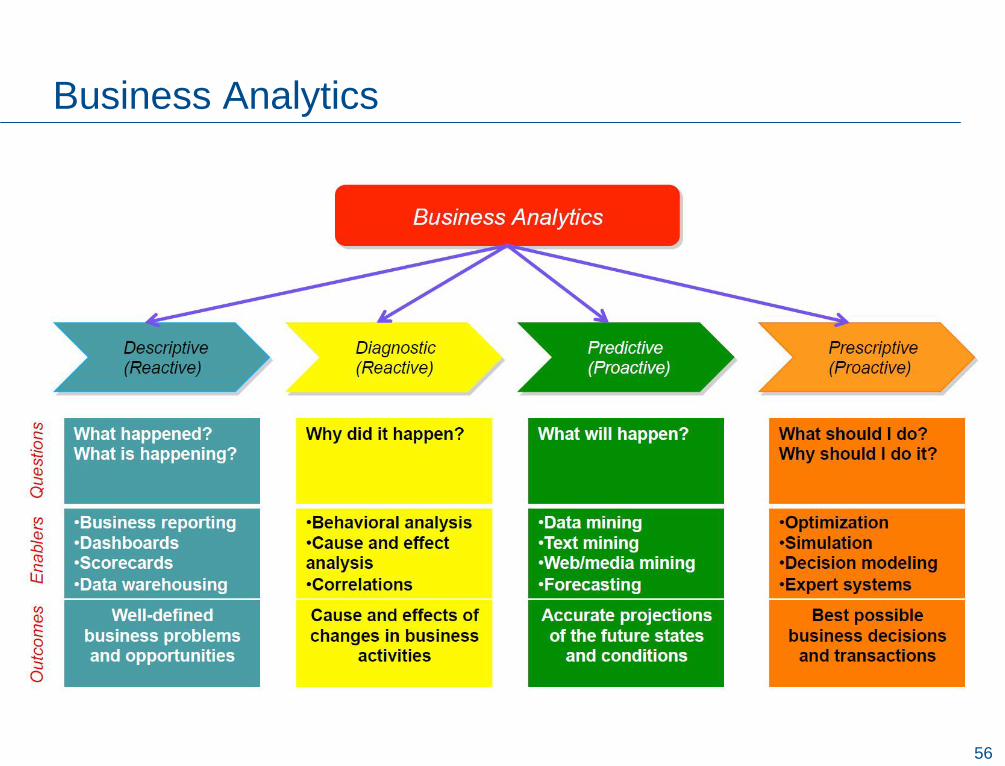
Business Analytics
57
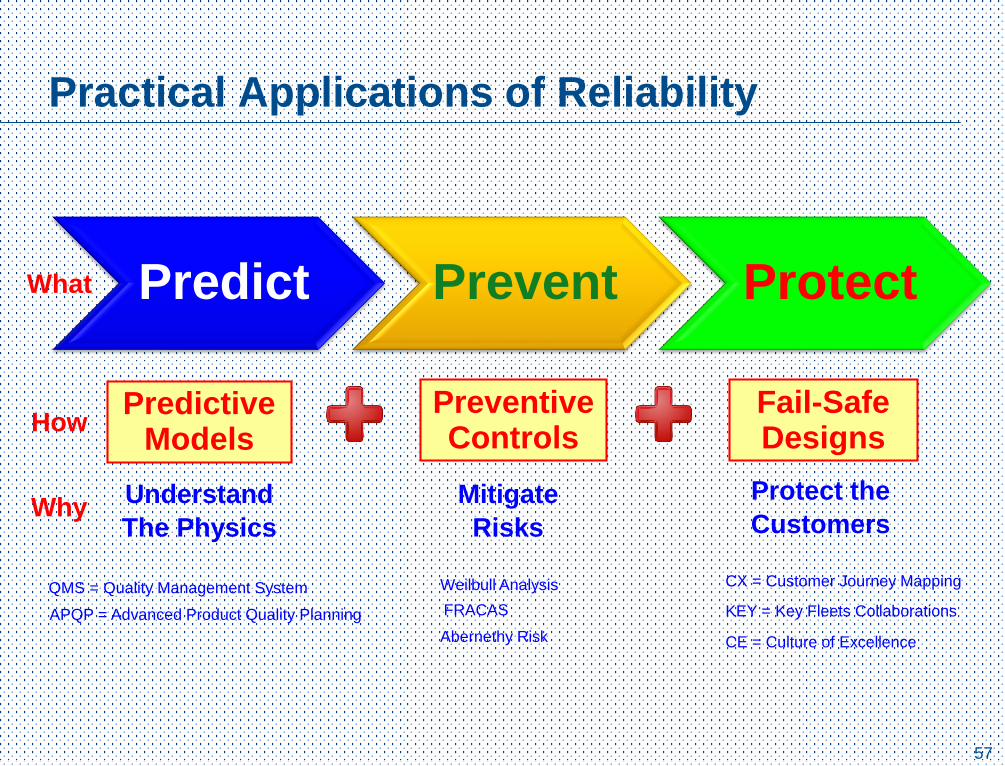
Practical Applications of Reliability
Predict Prevent ProtectWhat
Predictive Models
Preventive Controls
Fail-Safe Designs
How
APQP = Advanced Product Quality Planning
QMS = Quality Management System Weilbull Analysis
CE = Culture of Excellence
FRACAS
Abernethy Risk
CX = Customer Journey Mapping
KEY = Key Fleets Collaborations
Mitigate
Risks
Protect the
CustomersWhy
Understand
The Physics
58
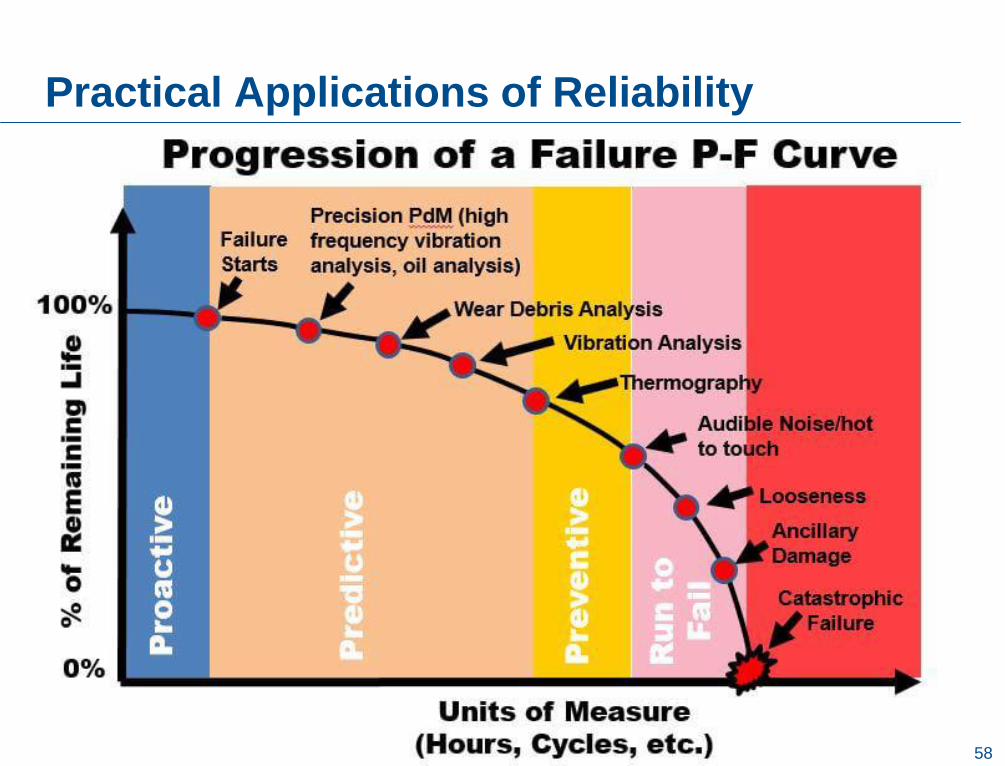
Practical Applications of Reliability
59
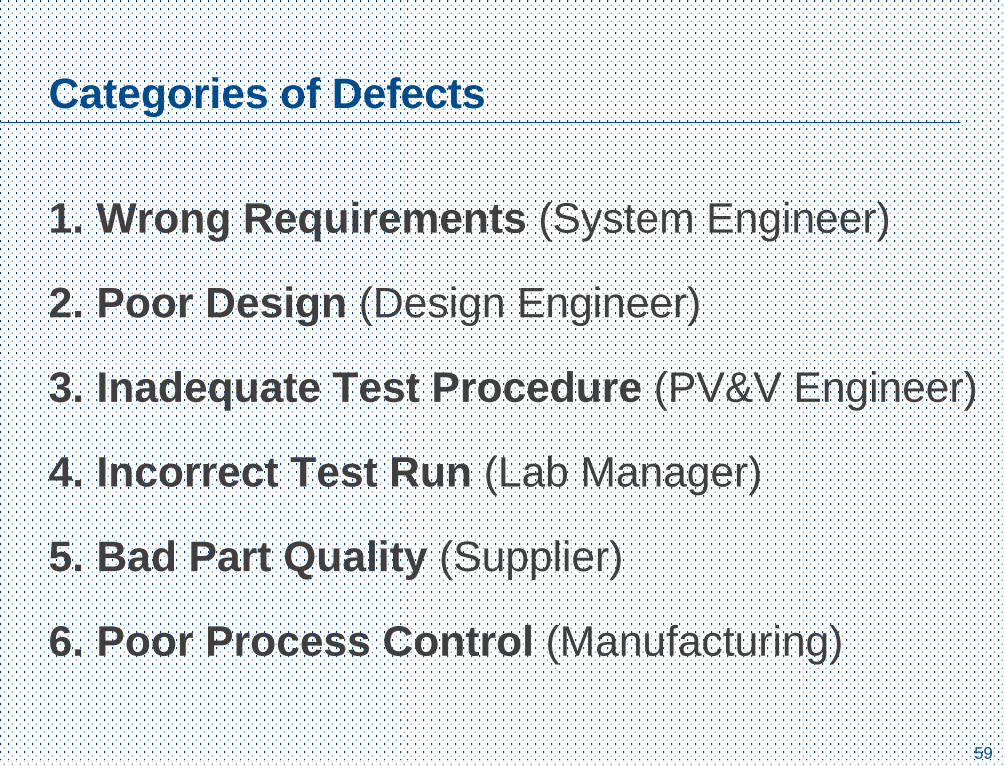
Categories of Defects
1. Wrong Requirements (System Engineer)
2. Poor Design (Design Engineer)
3. Inadequate Test Procedure (PV&V Engineer)
4. Incorrect Test Run (Lab Manager)
5. Bad Part Quality (Supplier)
6. Poor Process Control (Manufacturing)
60
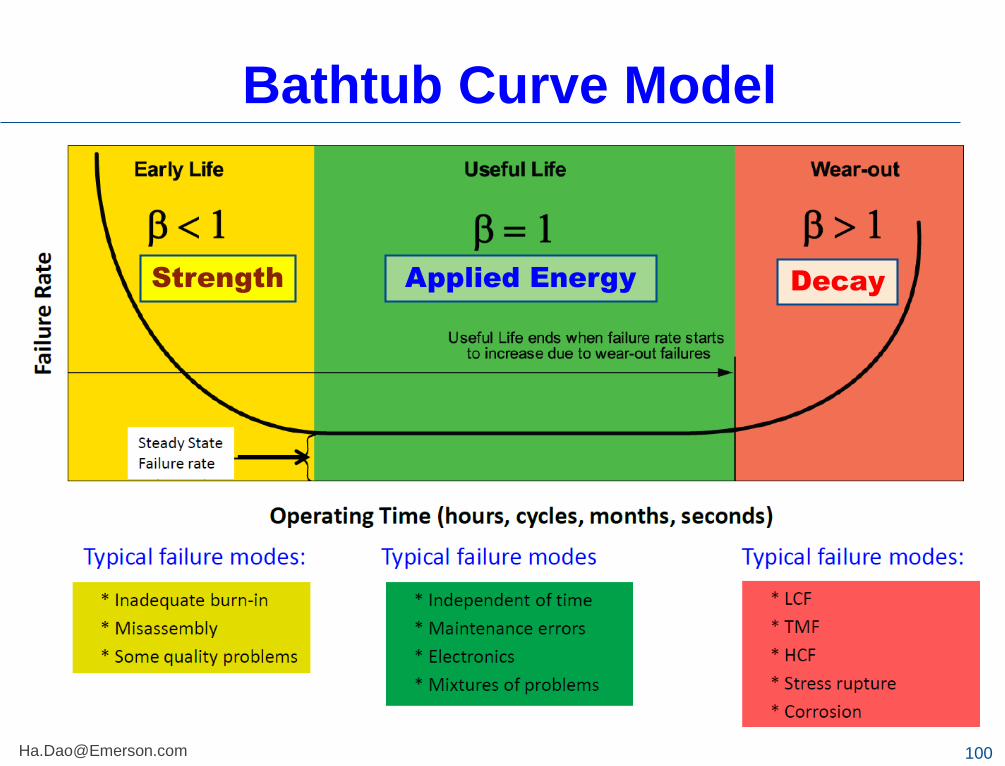
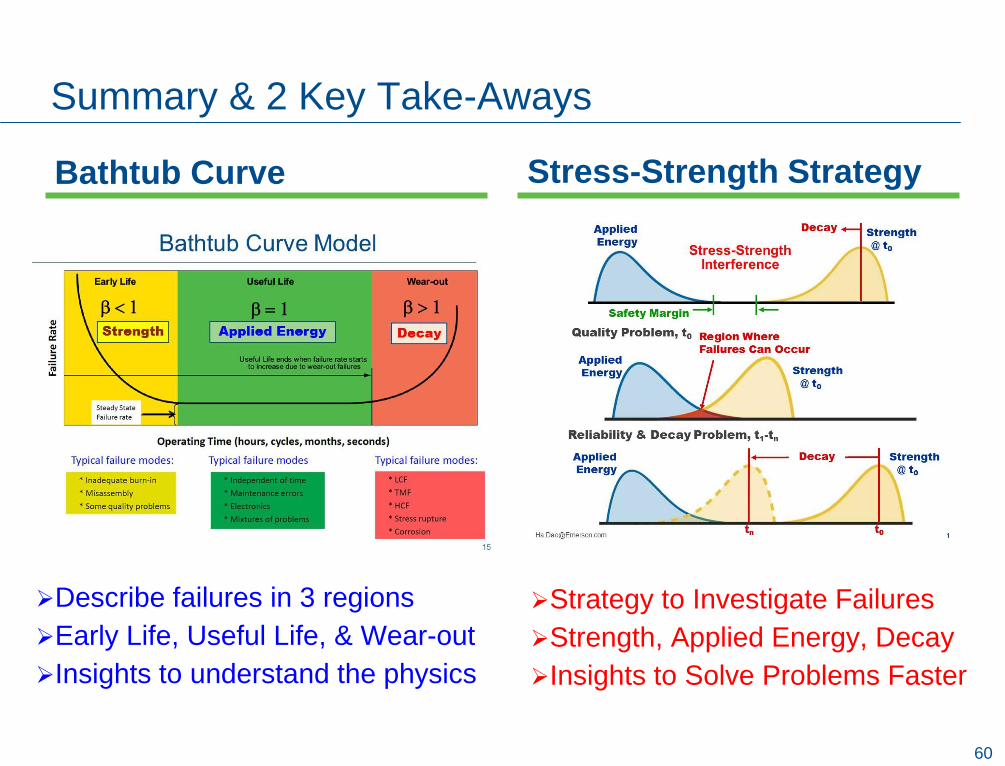
Summary & 2 Key Take-Aways
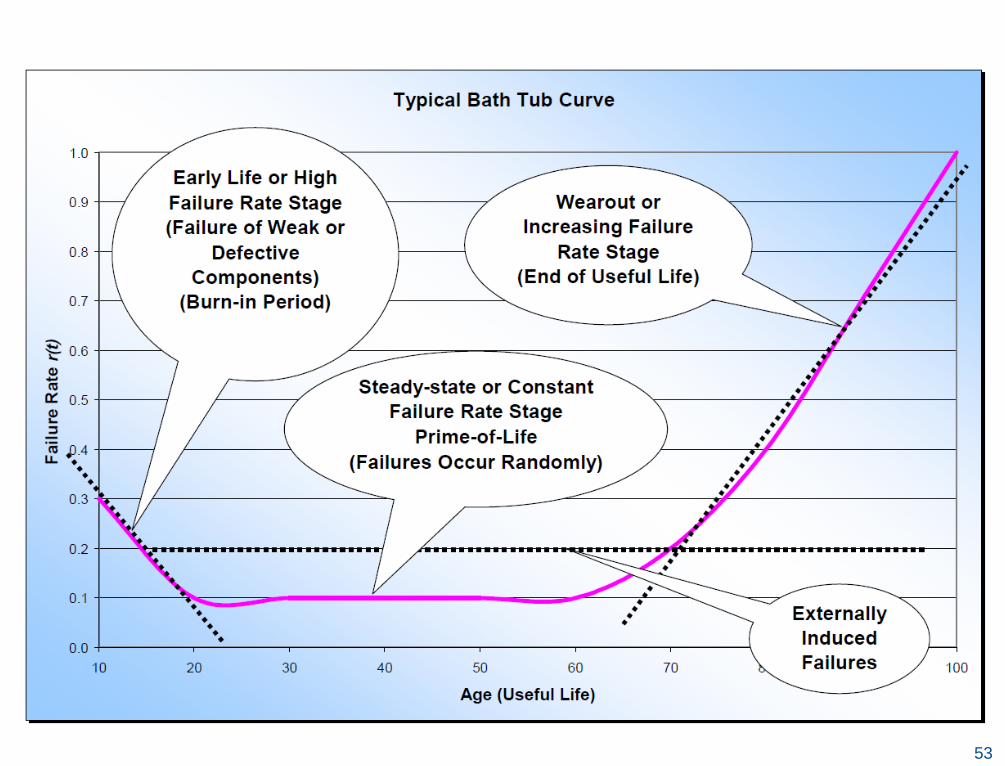
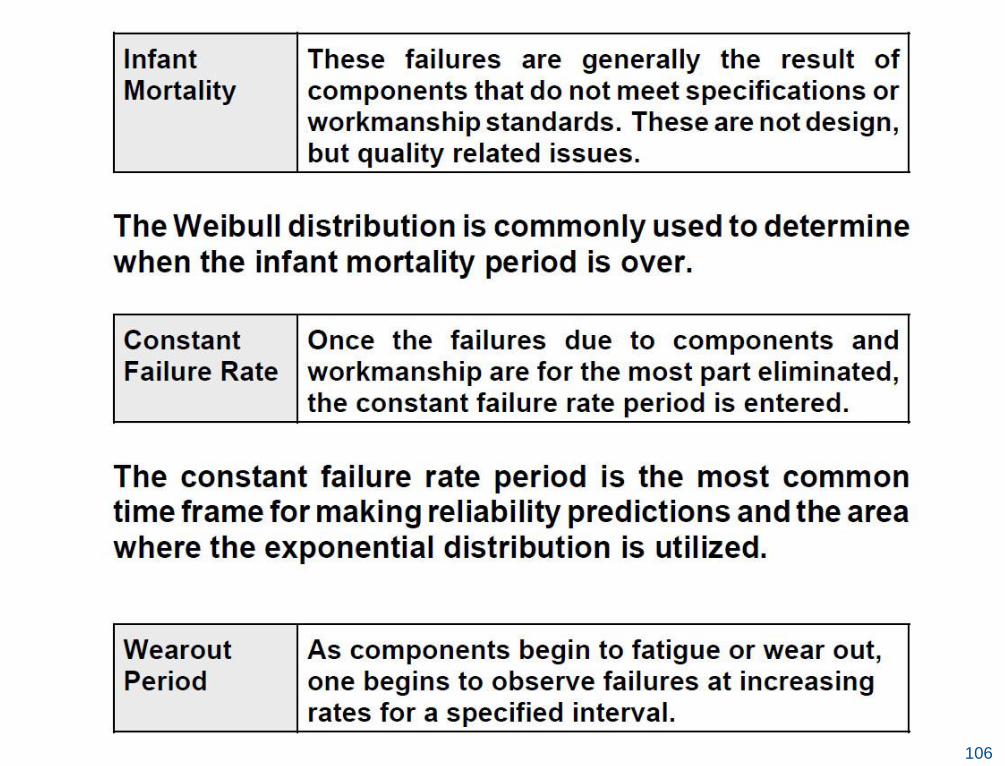
Bathtub Curve
➢Describe failures in 3 regions
➢Early Life, Useful Life, & Wear-out
➢Insights to understand the physics
Stress-Strength Strategy
➢Strategy to Investigate Failures
➢Strength, Applied Energy, Decay
➢Insights to Solve Problems Faster

61
One More Exercise: Fill in the Blanks
___________ is the probability that a product will perform its intended function successfully for a specified period of time, under specified operating conditions, in a manner
that meets or exceeds customer expectations. (Reliability is often considered quality over time).
___________________ provides the Consistent Capability to Analyze, Predict, Prevent and Protect
Failures over the life of the product.
What will Fail? When will it Fail? Why will it Fail?
___________________ applies tools and techniques to ensure the a robust design is to operate reliably within the distribution of stresses and variability of product, process,
and environment encountered.
62
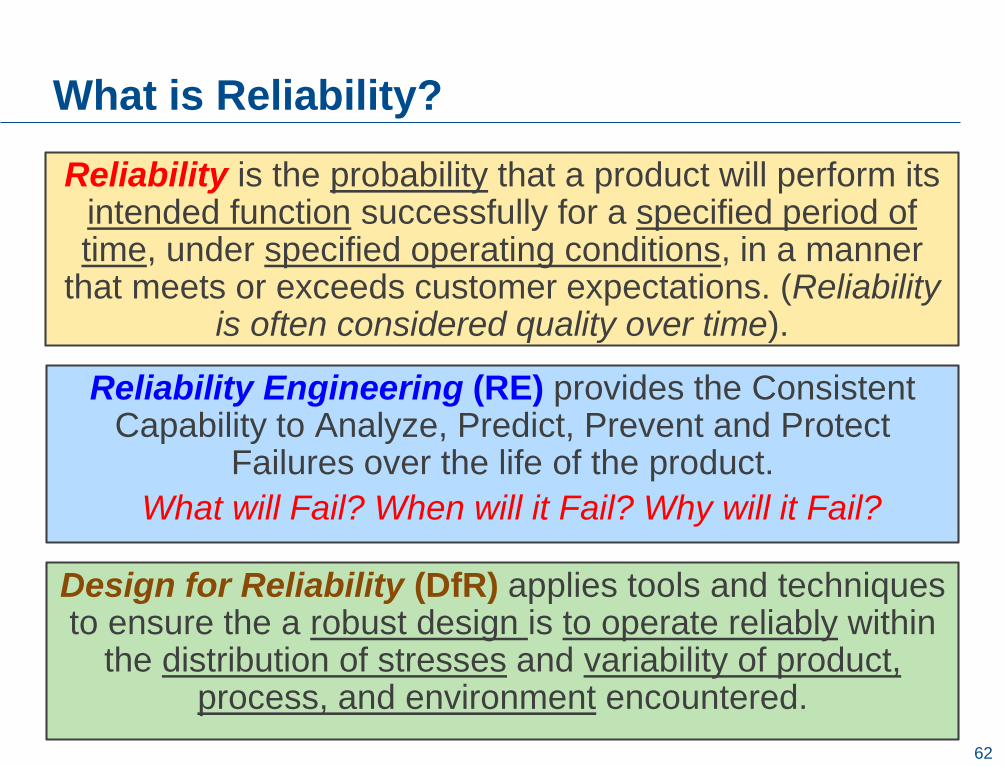
What is Reliability?
Reliability is the probability that a product will perform its intended function successfully for a specified period of time, under specified operating conditions, in a manner
that meets or exceeds customer expectations. (Reliability is often considered quality over time).
Reliability Engineering (RE) provides the Consistent Capability to Analyze, Predict, Prevent and Protect
Failures over the life of the product.
What will Fail? When will it Fail? Why will it Fail?
Design for Reliability (DfR) applies tools and techniques to ensure the a robust design is to operate reliably within
the distribution of stresses and variability of product, process, and environment encountered.

63
Final Exercise:

64
Questions & Answers
Mercedes-Benz SLS AMG

65
Bearing Cage Fracture
65
Failure Mode: Cage Fracture
Initiation Site: Cage Radius
Failure Mechanism: Fatigue
Root Cause: Inadequate Design for Mission Profile
Corrective Action: Re-Design to Higher Capability Bearing
For illustration purpose only
Data taken from “The New
Weibull Handbook”,
Abernethy 2004
66
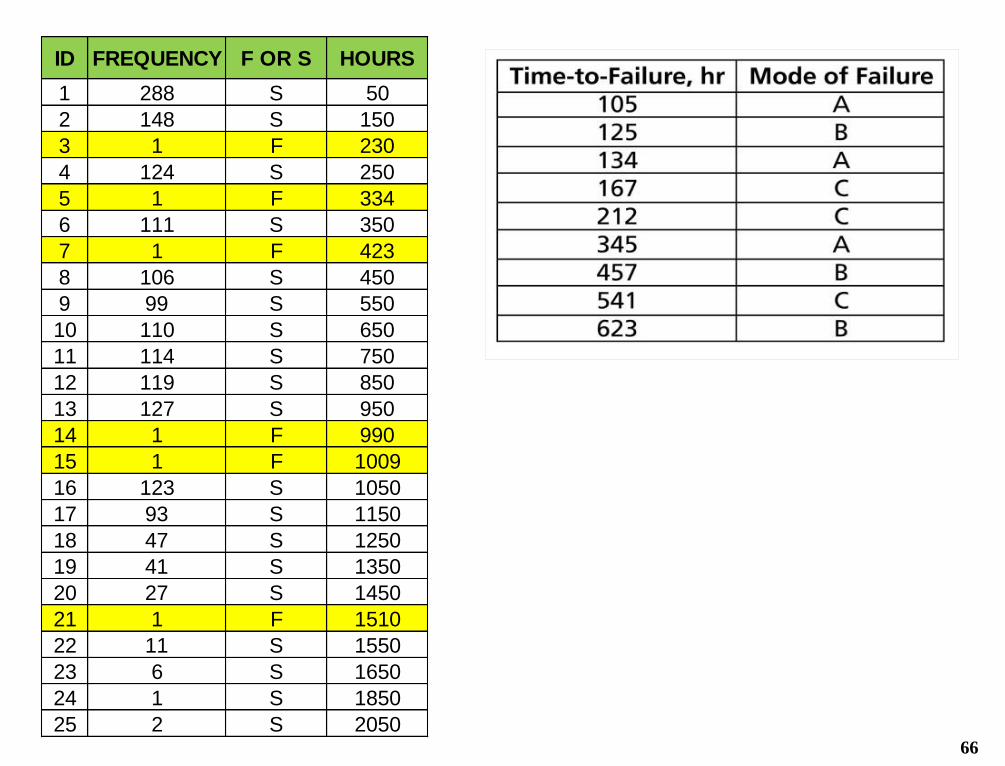
ID FREQUENCY F OR S HOURS
1 288 S 50
2 148 S 150
3 1 F 230
4 124 S 250
5 1 F 334
6 111 S 350
7 1 F 423
8 106 S 450
9 99 S 550
10 110 S 650
11 114 S 750
12 119 S 850
13 127 S 950
14 1 F 990
15 1 F 1009
16 123 S 1050
17 93 S 1150
18 47 S 1250
19 41 S 1350
20 27 S 1450
21 1 F 1510
22 11 S 1550
23 6 S 1650
24 1 S 1850
25 2 S 2050
67
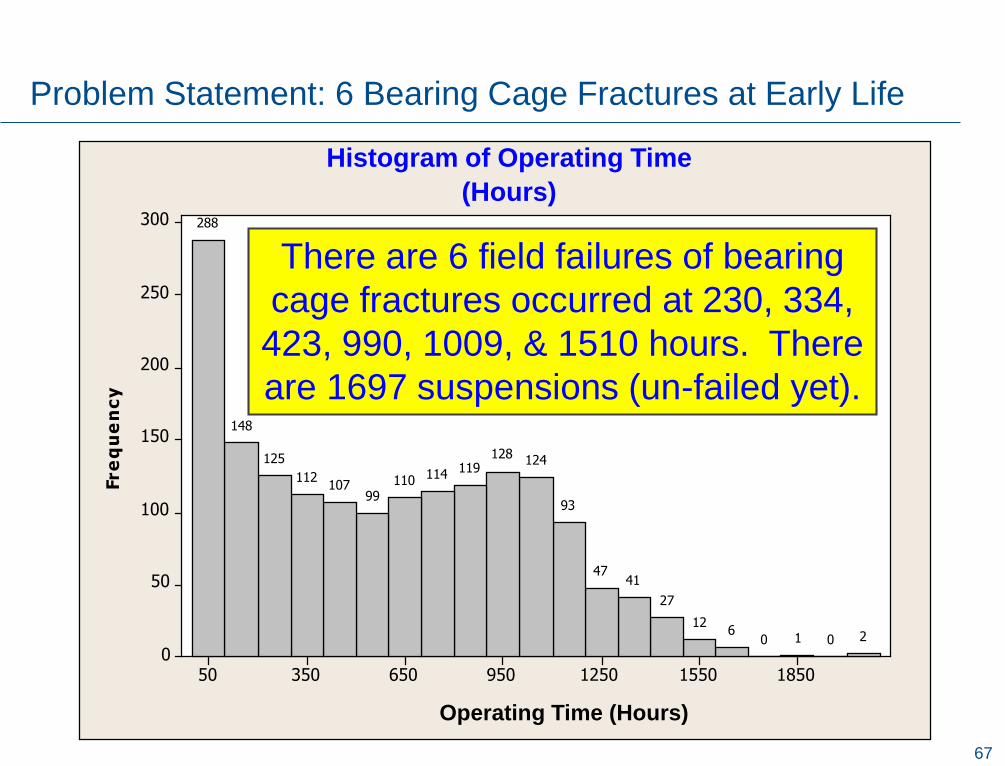
Problem Statement: 6 Bearing Cage Fractures at Early Life
There are 6 field failures of bearing cage fractures
occurred at 230, 334, 423, 990, 1009, & 1510 hours.
There are 1697 suspensions (un-failed yet).
18501550125095065035050
300
250
200
150
100
50
0
Operating Time (Hours)
20106
12
27
4147
93
124128119114110
99107
112
125
148
288
Histogram of Operating Time
(Hours)
There are 6 field failures of bearing
cage fractures occurred at 230, 334,
423, 990, 1009, & 1510 hours. There
are 1697 suspensions (un-failed yet).
68
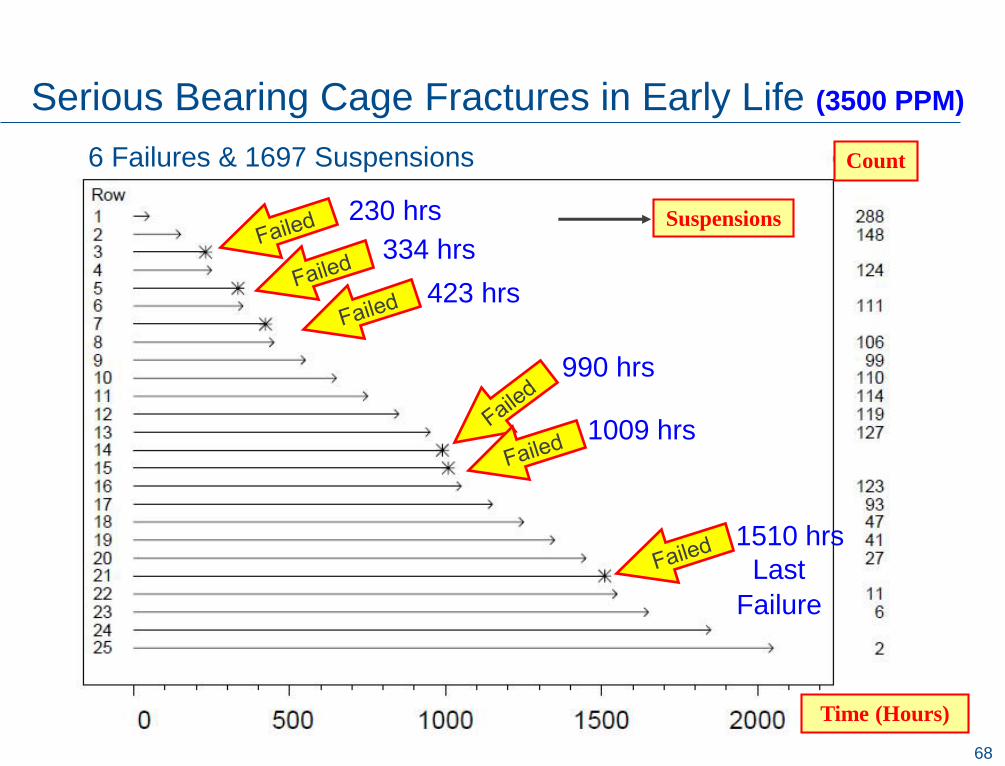
Serious Bearing Cage Fractures in Early Life (3500 PPM)
Count
Time (Hours)
230 hrs
334 hrs
423 hrs
990 hrs
1009 hrs
1510 hrs
Suspensions
6 Failures & 1697 Suspensions
Last
Failure

69
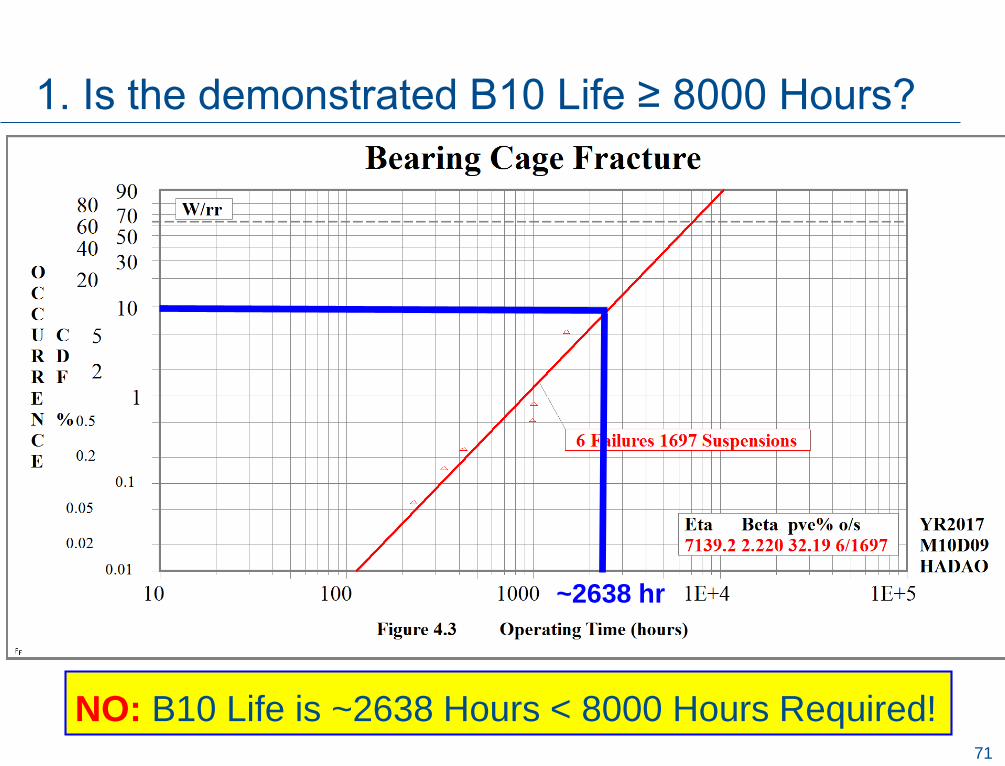
Weibull Analysis (Rank Regression rr)
Weibull 2-Parameter Model with Eta of 7139.2 and Beta of 2.220.
Model has reasonable good fit with pve% of 32.19 (>10%)

70
Weibull Plot Reading using SuperSMITH Software
71
NO: B10 Life is ~2638 Hours < 8000 Hours Required!
~2638 hr
1. Is the demonstrated B10 Life ≥ 8000 Hours?
72
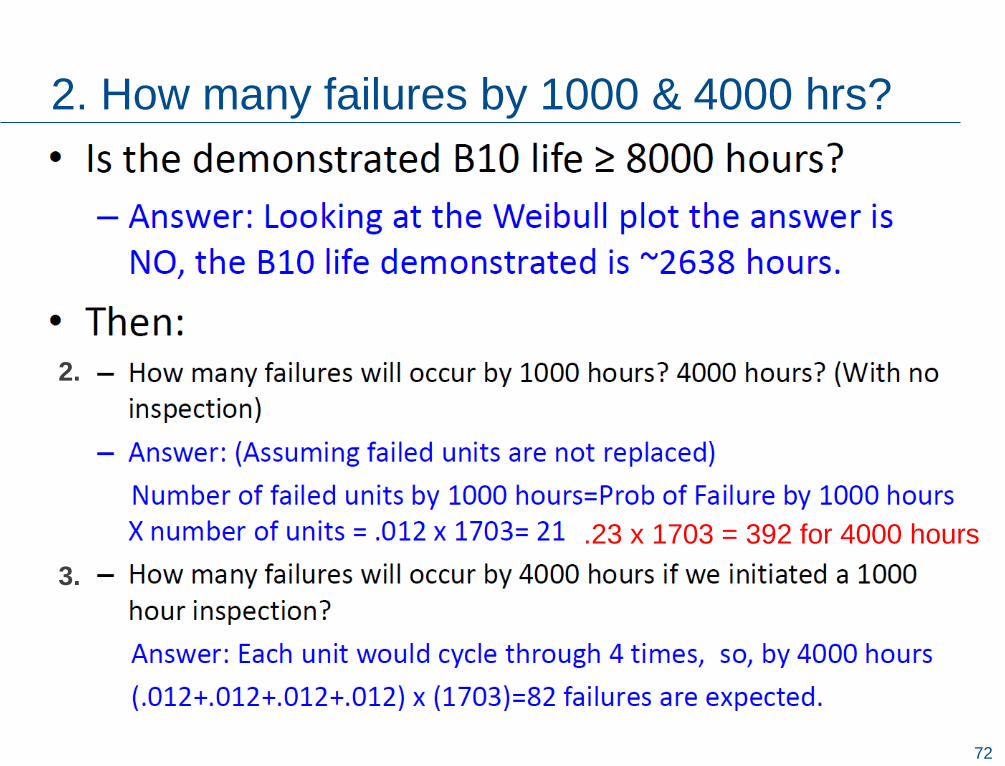
2. How many failures by 1000 & 4000 hrs?
.23 x 1703 = 392 for 4000 hours
3.
2.
73
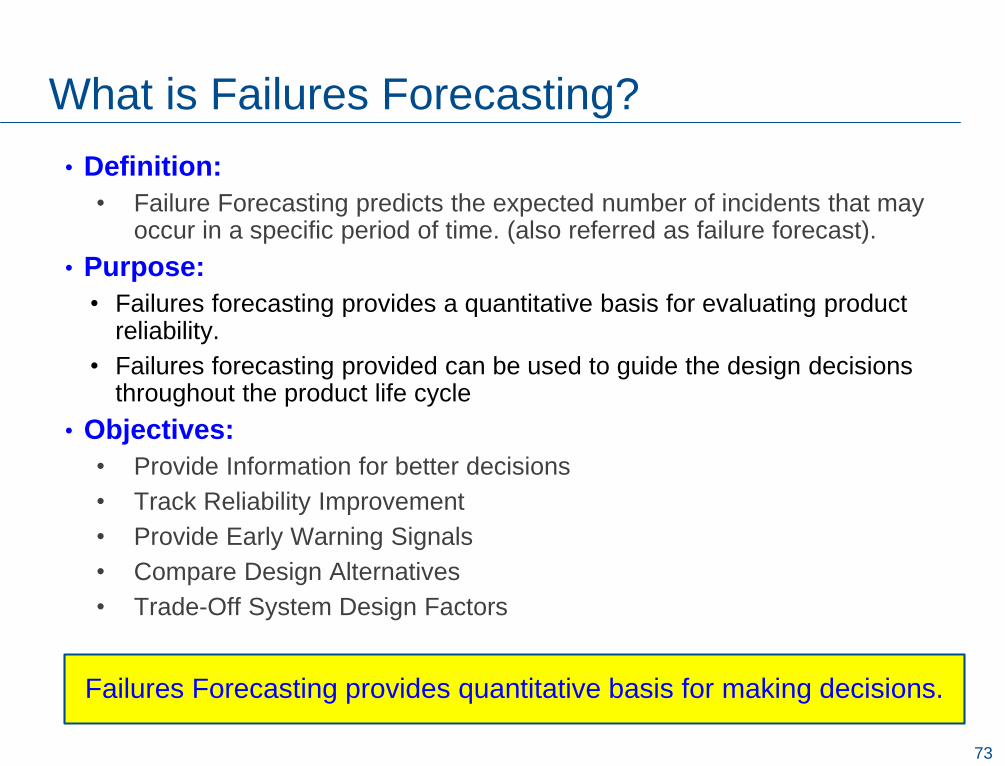
• Definition:
• Failure Forecasting predicts the expected number of incidents that may occur in a specific period of time. (also referred as failure forecast).
• Purpose:
• Failures forecasting provides a quantitative basis for evaluating product reliability.
• Failures forecasting provided can be used to guide the design decisions throughout the product life cycle
• Objectives:
• Provide Information for better decisions
• Track Reliability Improvement
• Provide Early Warning Signals
• Compare Design Alternatives
• Trade-Off System Design Factors
What is Failures Forecasting?
Failures Forecasting provides quantitative basis for making decisions.
74
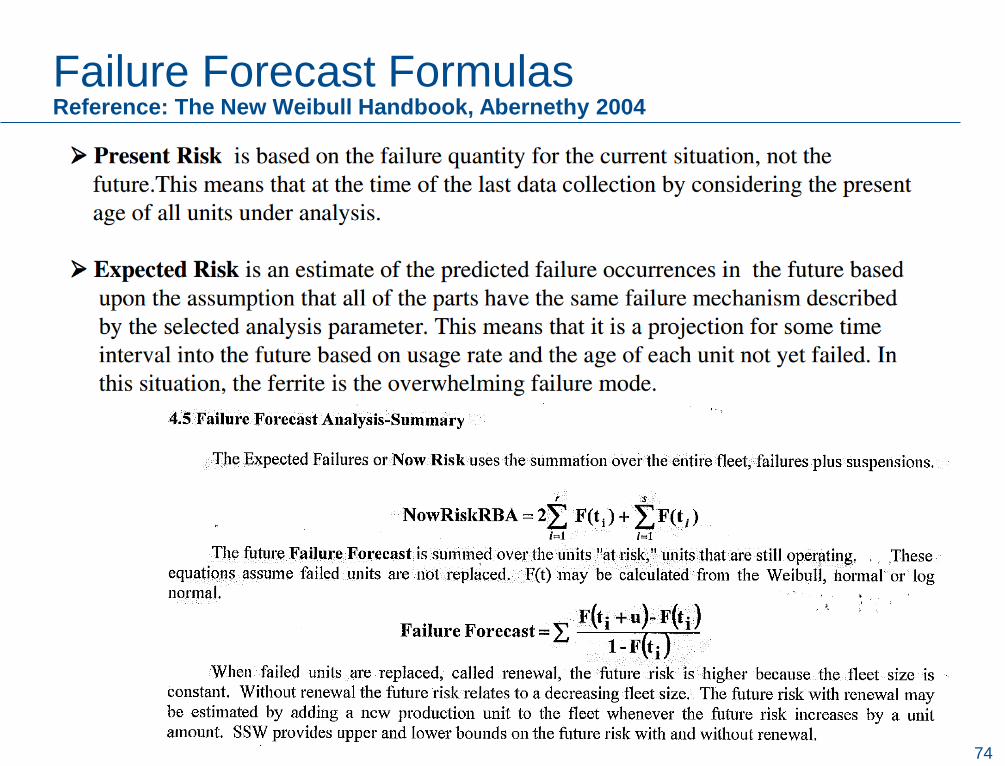
Failure Forecast FormulasReference: The New Weibull Handbook, Abernethy 2004
75
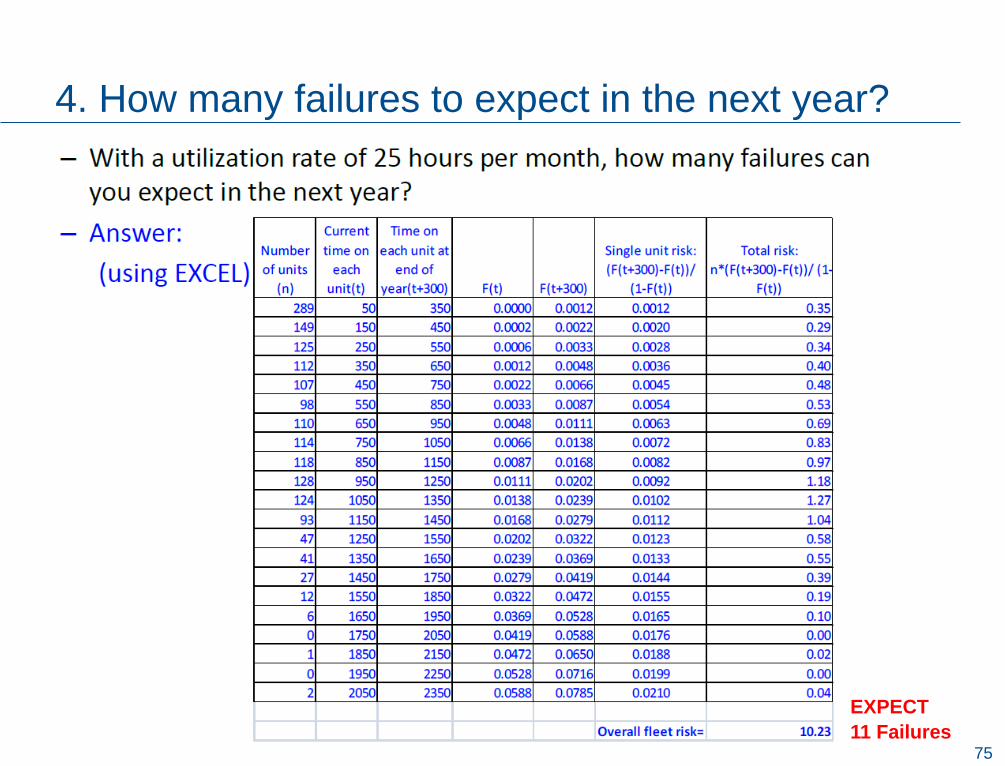
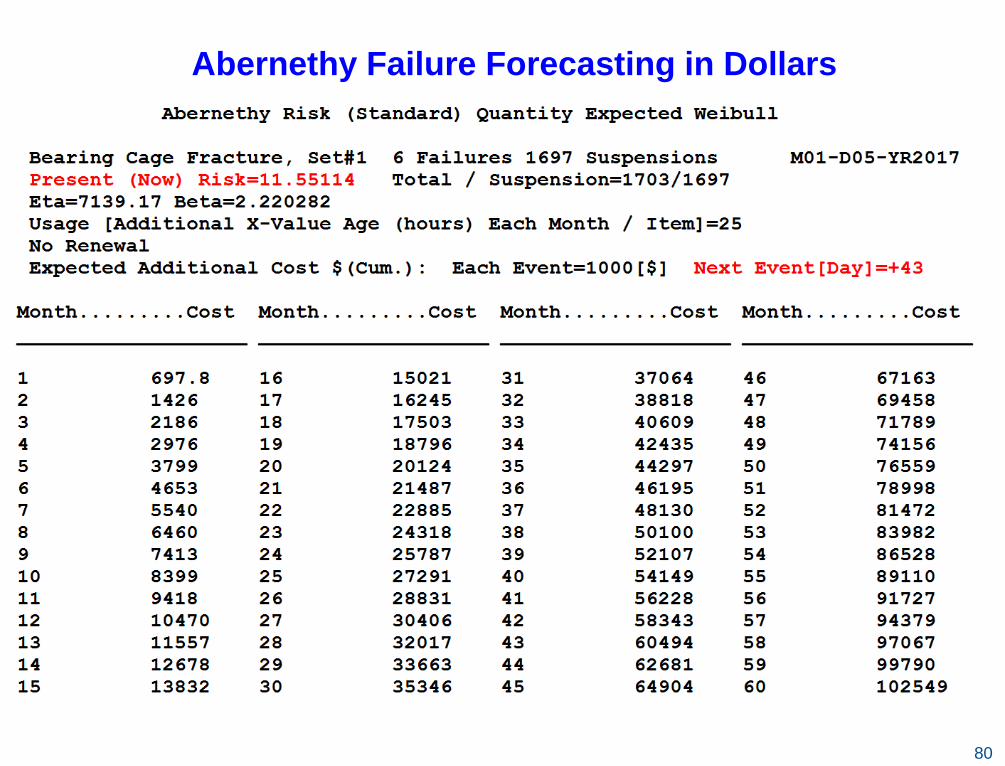
4. How many failures to expect in the next year?
11 Failures
EXPECT
76
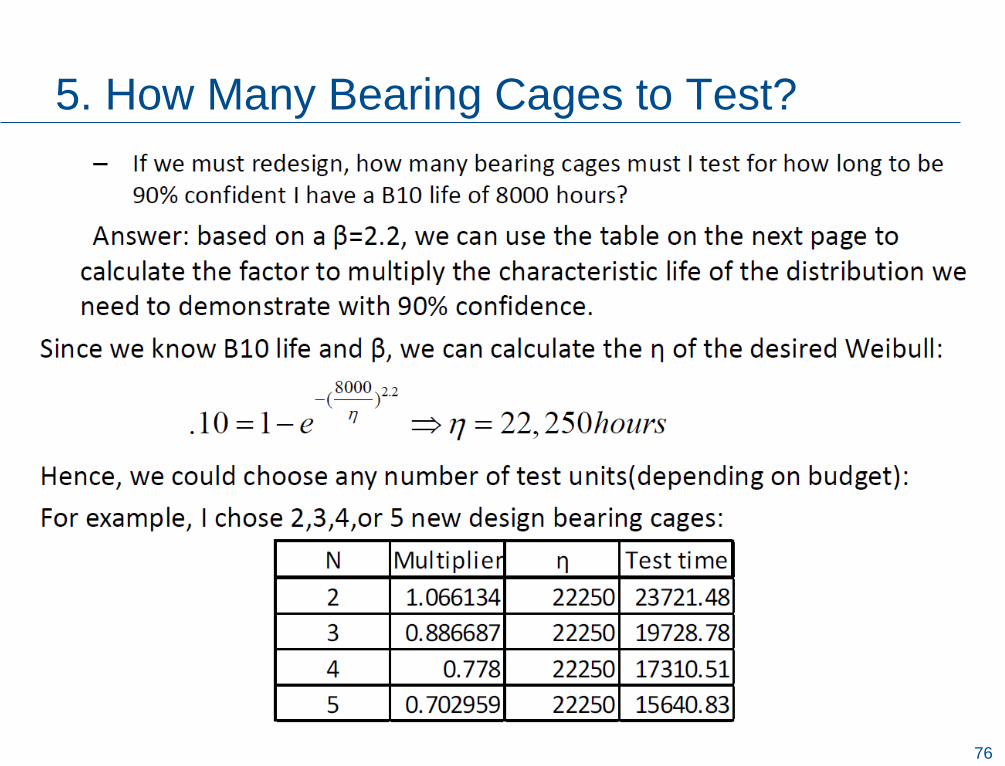
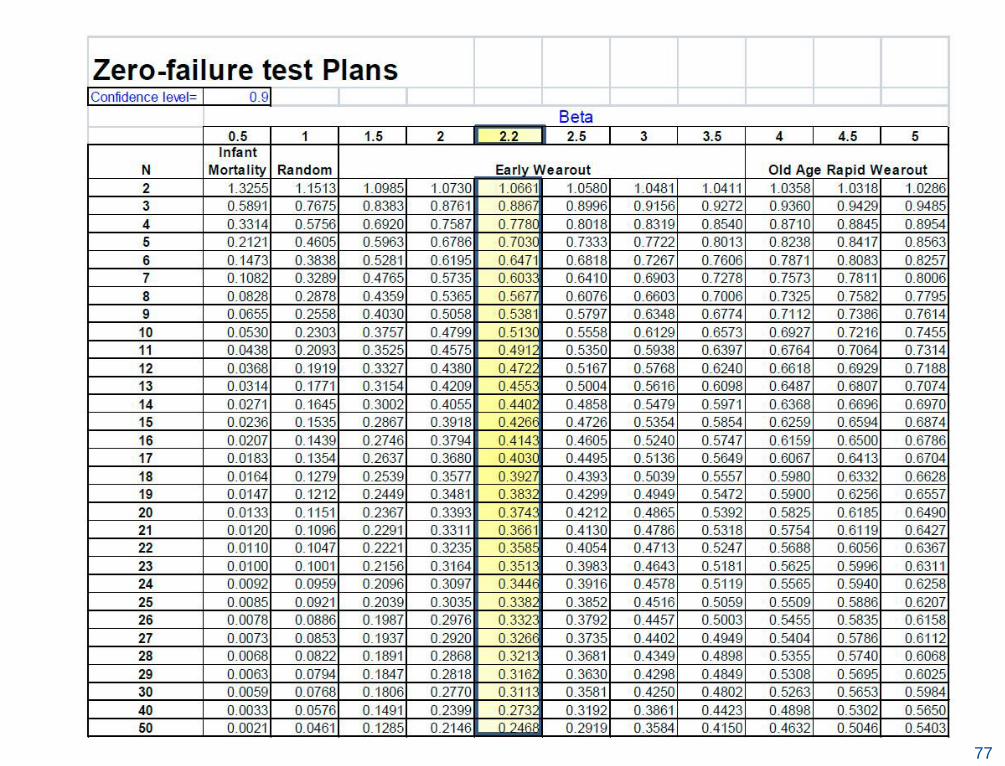
5. How Many Bearing Cages to Test?
77
78
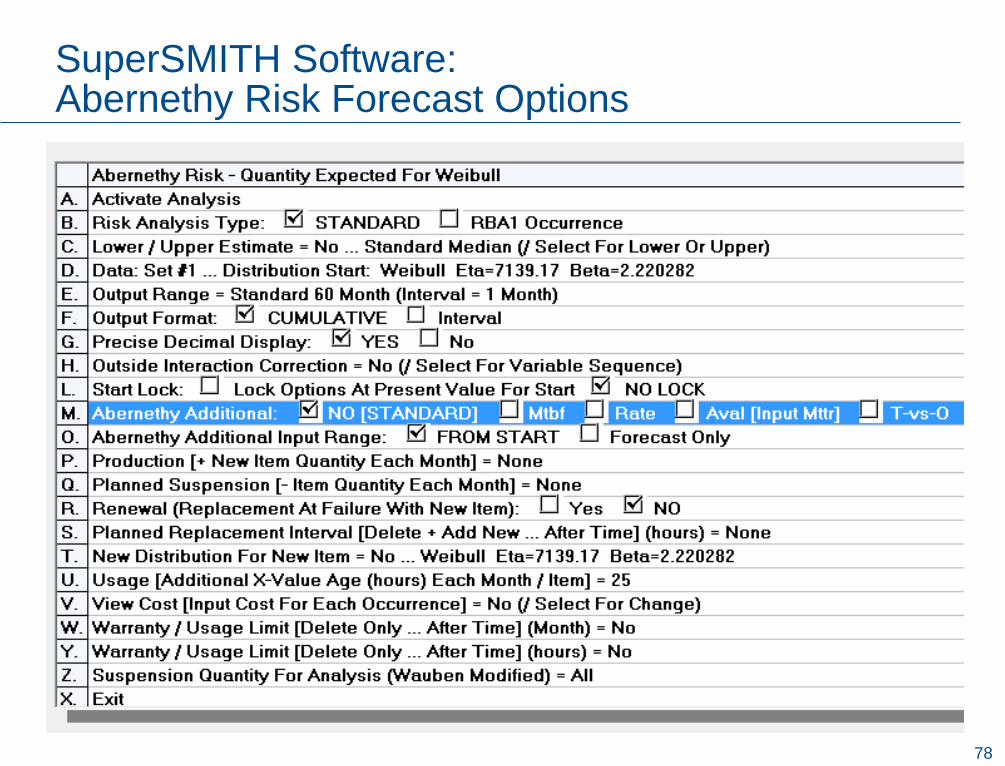
SuperSMITH Software: Abernethy Risk Forecast Options

79
Abernethy Failure Forecast in Units
11 Failures
12 Mo
24 Mo
35 Mo
48 Mo
Now Risk
is 11.55
fairly
close to 6
actual.
No Batch.
Tnow 1510 Hours
80
Abernethy Failure Forecasting in Dollars

81
Abernethy Risk Forecast Plot
82
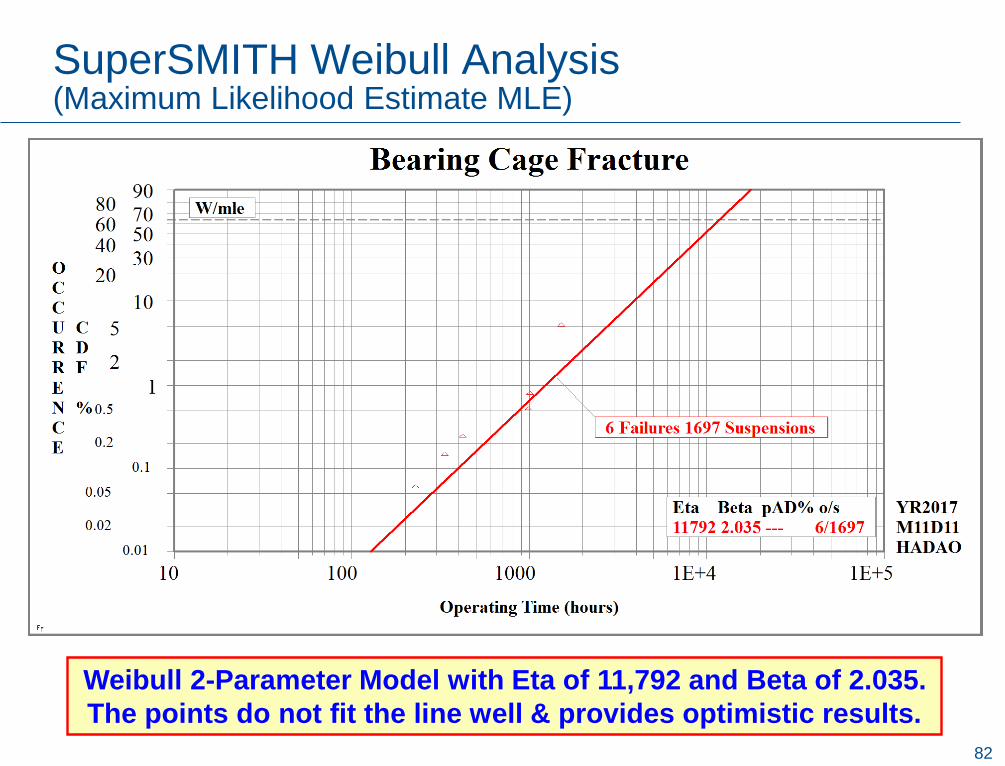
SuperSMITH Weibull Analysis (Maximum Likelihood Estimate MLE)
Weibull 2-Parameter Model with Eta of 11,792 and Beta of 2.035.
The points do not fit the line well & provides optimistic results.
83
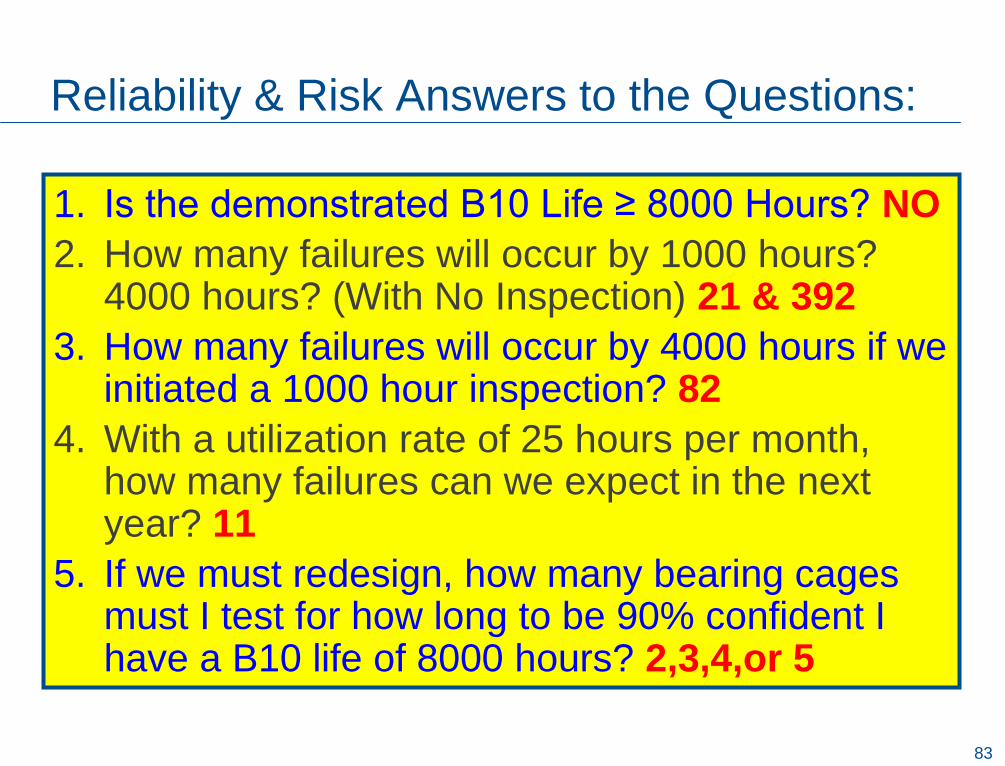
Reliability & Risk Answers to the Questions:
1. Is the demonstrated B10 Life ≥ 8000 Hours? NO
2. How many failures will occur by 1000 hours? 4000 hours? (With No Inspection) 21 & 392
3. How many failures will occur by 4000 hours if we initiated a 1000 hour inspection? 82
4. With a utilization rate of 25 hours per month, how many failures can we expect in the next year? 11
5. If we must redesign, how many bearing cages must I test for how long to be 90% confident I have a B10 life of 8000 hours? 2,3,4,or 5
84
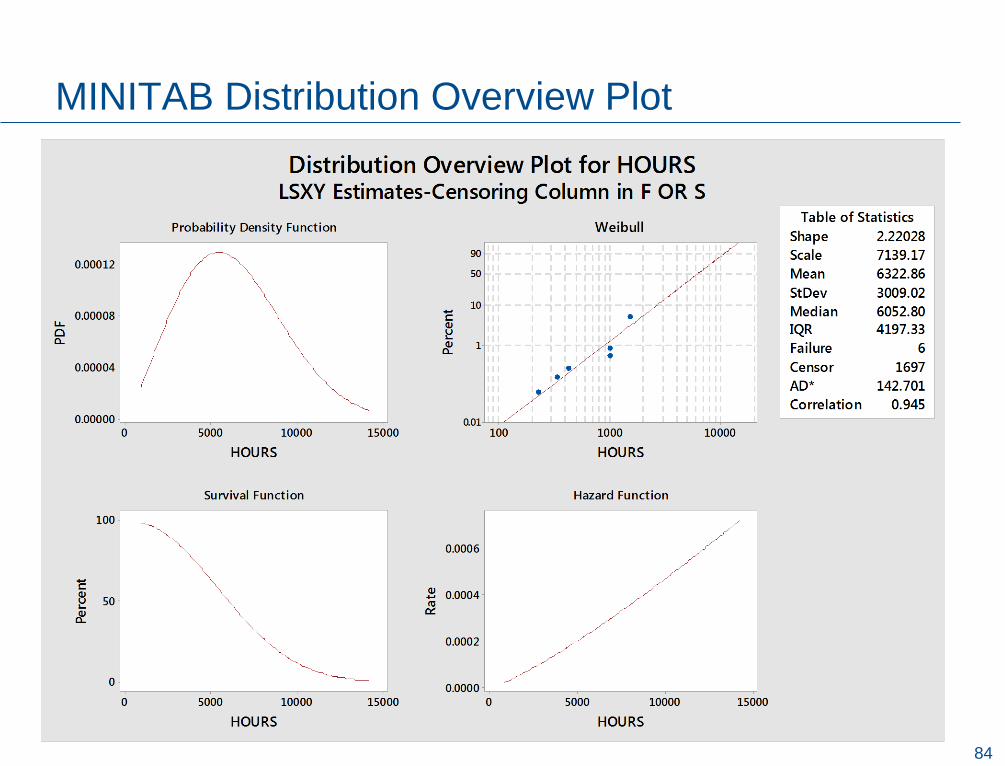
MINITAB Distribution Overview Plot
85
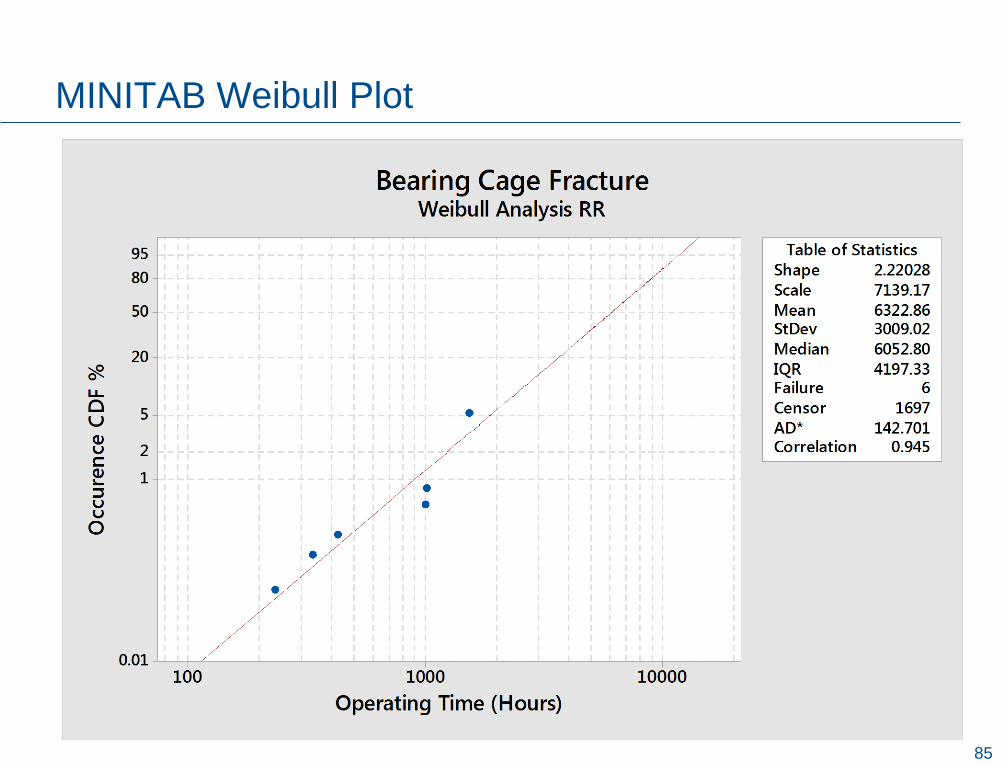
MINITAB Weibull Plot
86
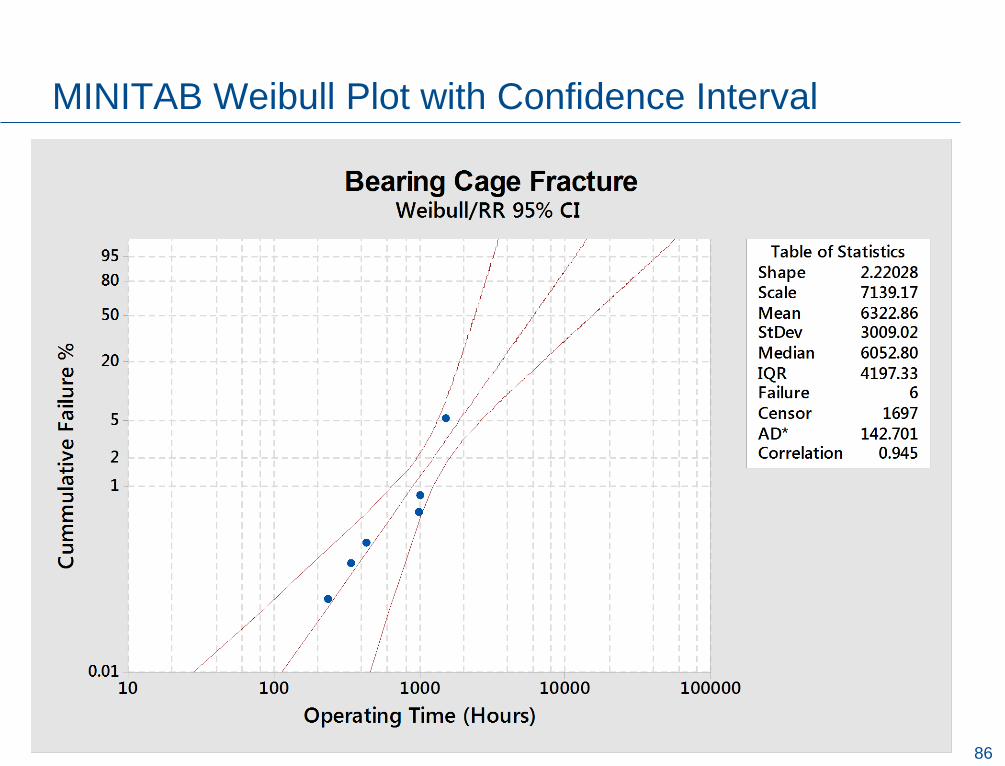
MINITAB Weibull Plot with Confidence Interval

87
88
89
90
Reliability Resources
Ha Dao
90

91
Reliability References
1. CRE Primer, Quality Council of Indiana, 2017
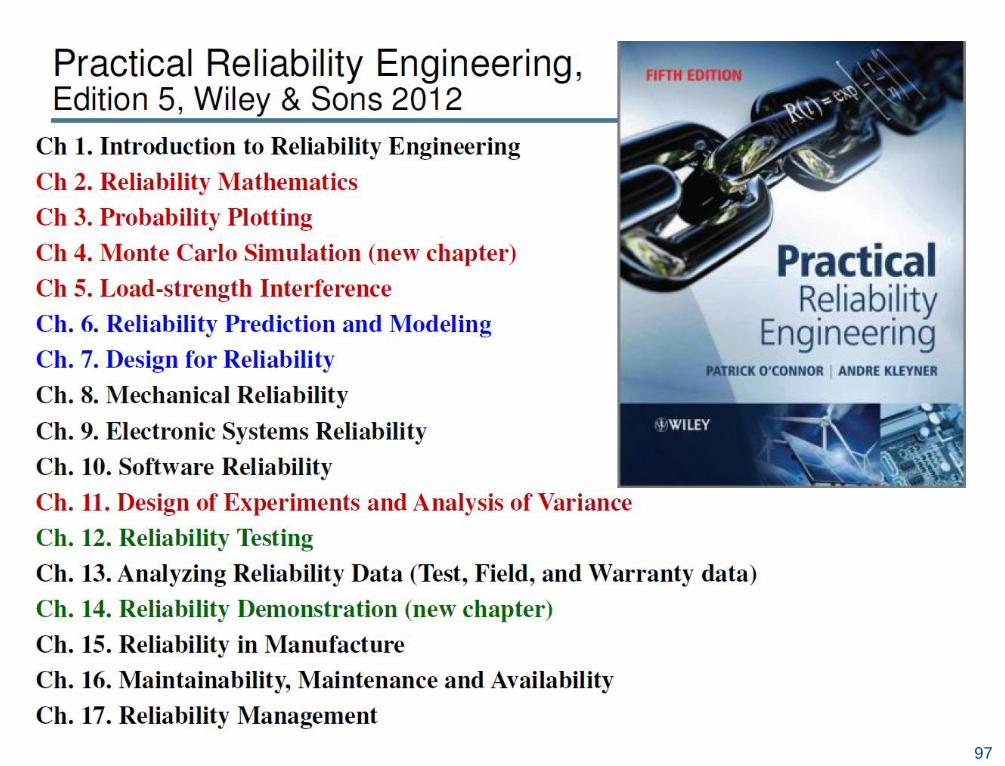
2. O’Connor, Patrick “Practical Reliability Engineering”, John Wiley, 2012
3. Durivage, Mark, “The Certified Reliability Engineer Handbook”, 3rd Ed, 2017
4. Benbow, Donald, “The Certified Reliability Engineer Handbook”, 2nd Ed, 2013
5. Abernethy, Robert B, “The New Weibull Handbook”, 5th Ed, 2004
6. EIC 61649:2008, “Weibull Analysis”, International Standard, 2008
7. Silverman, Mike. “How Reliable is Your Product”, Super Star Press, 2016
8. AFWAL-TR-83-2079, “USAF Weibull Analysis Handbook”, 1983
9. SAE JA 1000/1, “Reliability Program Standard”, 1983
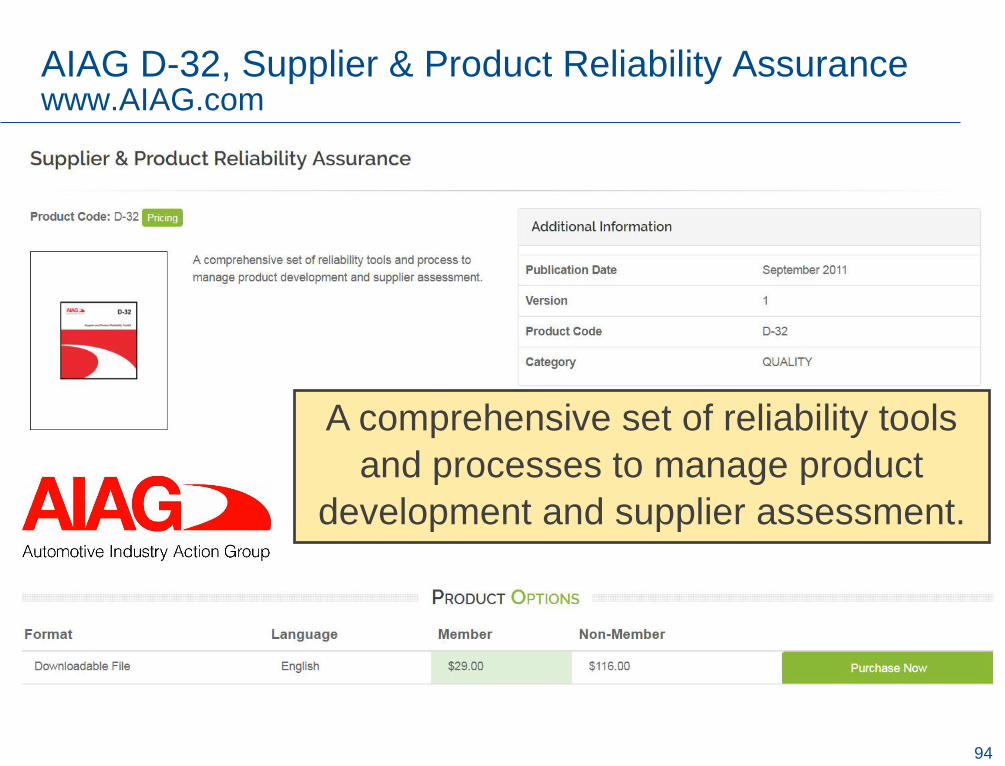
10. AIAG D-32, “Supplier & Product Reliability Assurance”, 2011
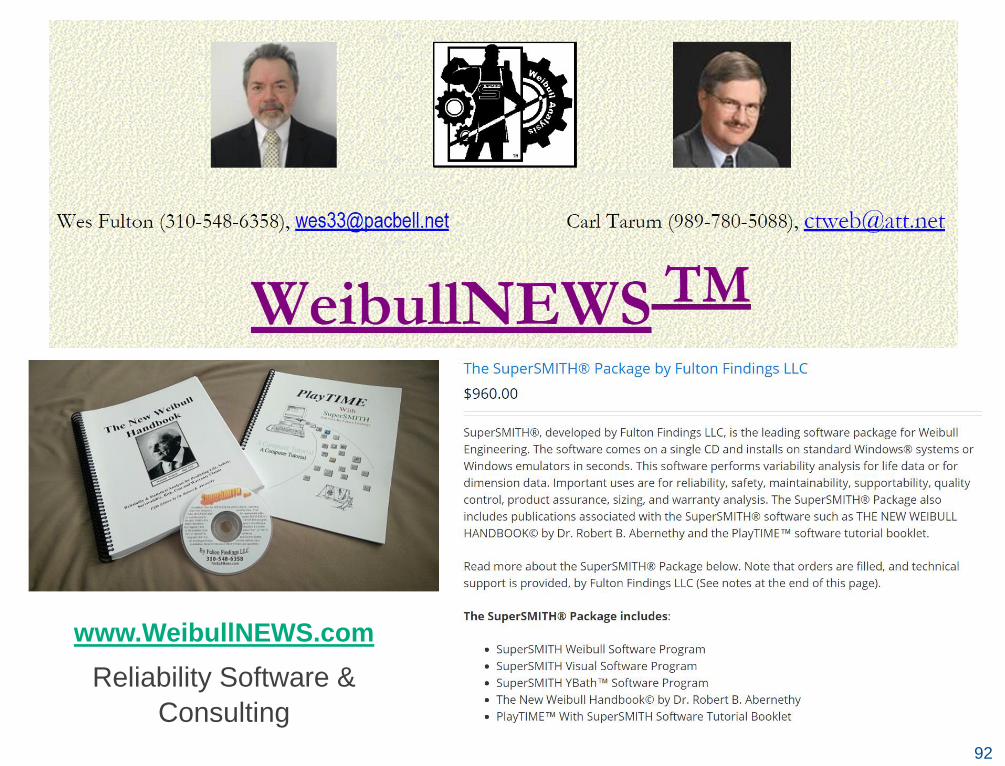
94
AIAG D-32, Supplier & Product Reliability Assurancewww.AIAG.com
A comprehensive set of reliability tools
and processes to manage product
development and supplier assessment.
95
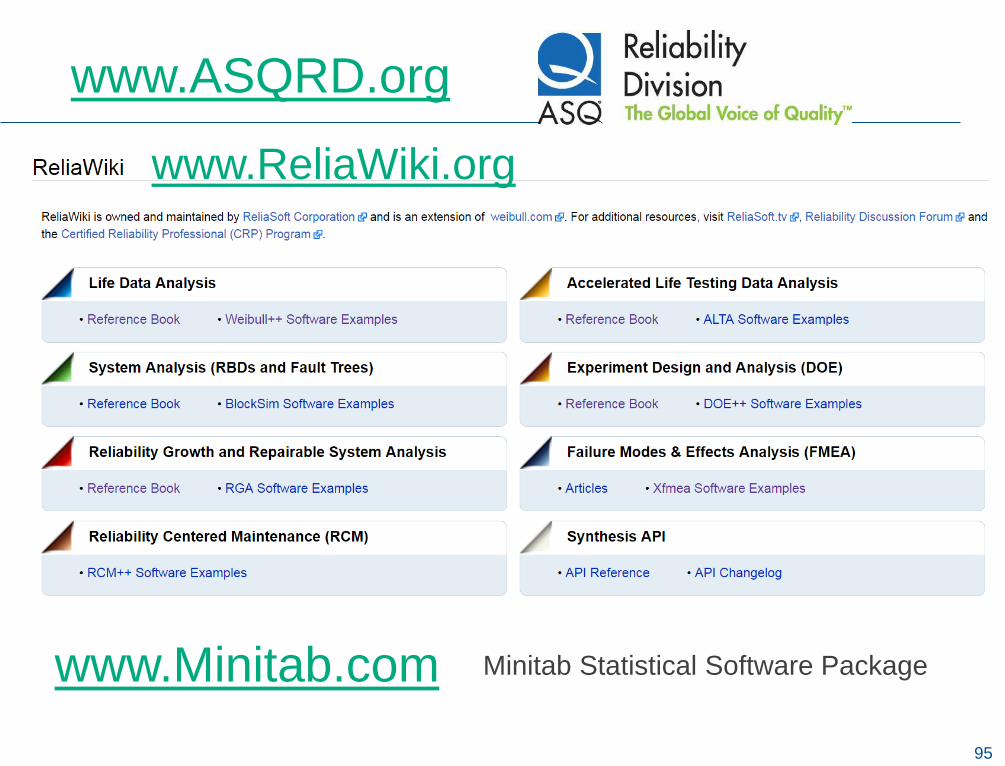
www.ReliaWiki.org
www.Minitab.com Minitab Statistical Software Package
www.ASQRD.org

96
Andre Kleyner has over 25 years of engineering,
research, consulting, and managerial experience
specializing in reliability of electronic and
mechanical systems designed to operate in severe
environments. He received the doctorate in
Mechanical Engineering from University of
Maryland, and Master of Business Administration
from Ball State University. Dr. Kleyner is a Global
Reliability Engineering Leader with Delphi
Electronics & Safety, and an adjunct professor at
Purdue University. Andre developed and taught
many training courses for reliability, quality, and
design professionals. He also holds several US
and foreign patents and authored professional
publications on reliability, quality, and other
engineering topics.
97
98
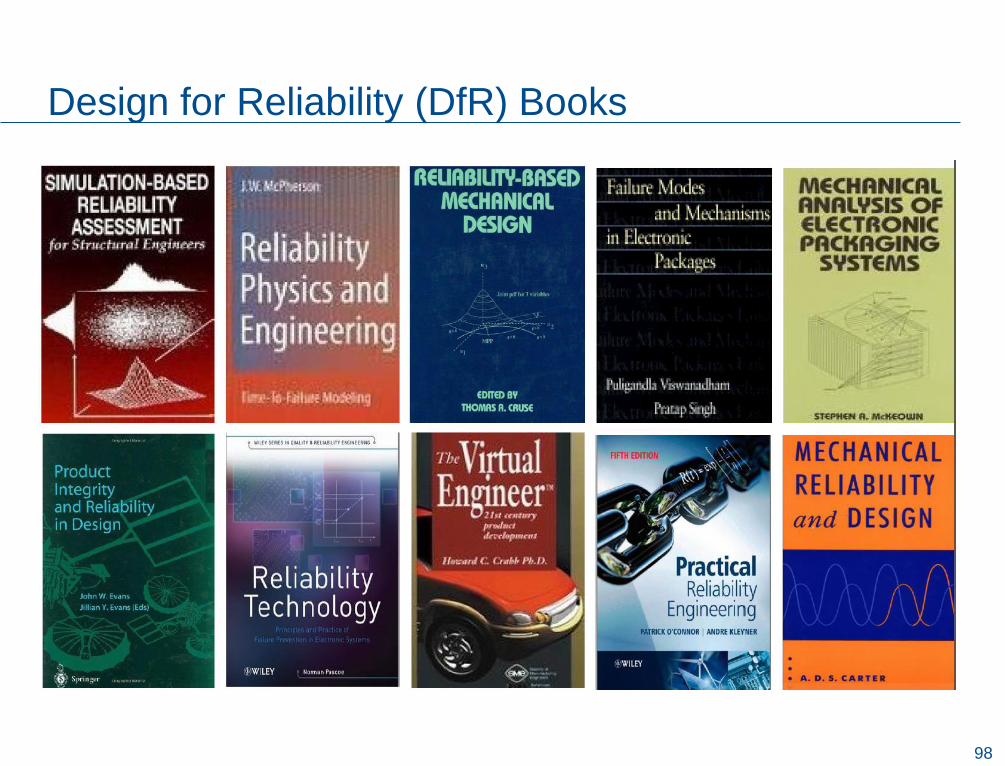
Design for Reliability (DfR) Books

99
Practical Applications of Reliability
(Quality over Time)
Ha Dao

101
Strength
@ t0
Applied
Energy
1. Quality Problem, t0
Region Where
Failures Can Occur
tn
t0
Decay
2. Reliability & Decay Problem, t1-t
n
Strength
@ t0
Applied
Energy
Strength
@ t0Applied
Energy
Decay
Safety Margin
Stress-Strength Interference Model

102
Reliability Glossary
Ha Dao
102
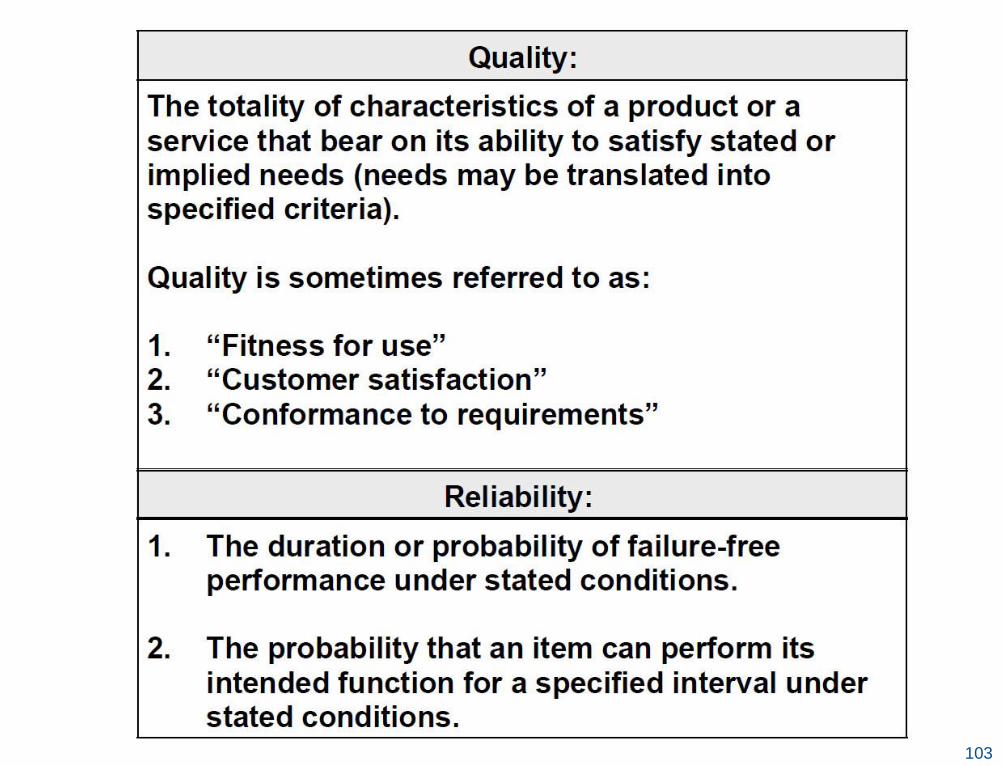
103
104
105
106
107
108
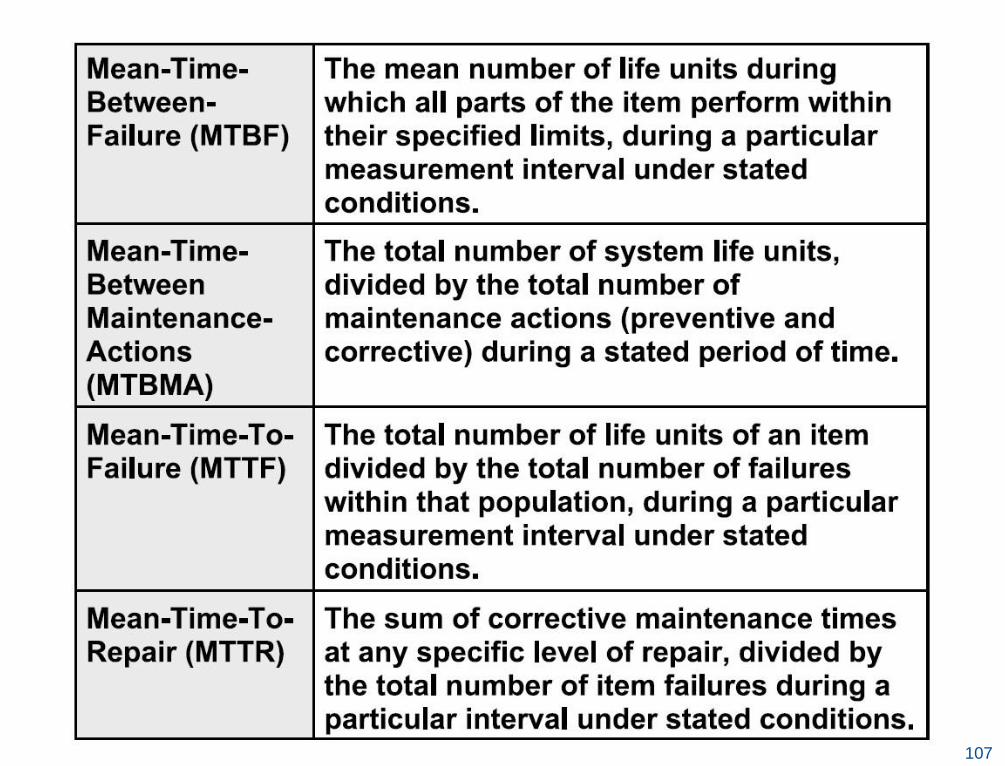
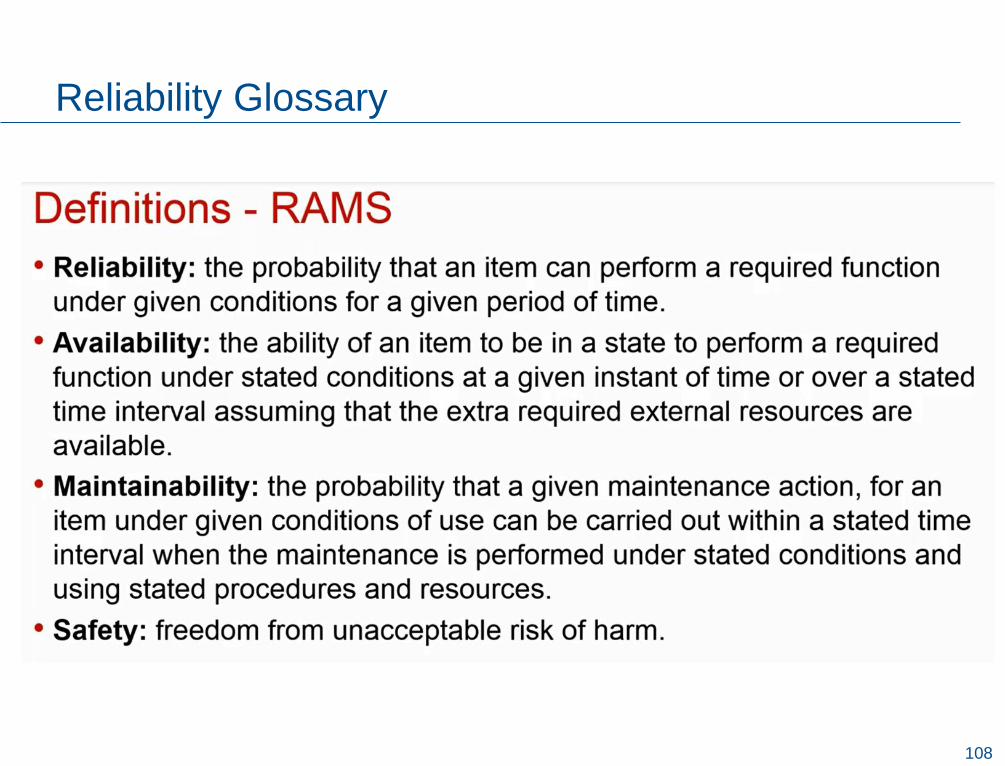
Reliability Glossary
Recommended