February 2017
Post Disaster Needs Assessment of the 2015-2016 Drought
Republic of the Marshall Islands

Republic of the Marshall Islands
Published by: Republic of the Marshall Islands
Lead Authors: Noud Leenders (UNDP), Paula Holland and Paul Taylor (SPC)
Design: Sailesh Kumar Sen, SPC
Front Cover Photo: Water sources in Majuro. Photo by Marshall Island Journal

Republic of the Marshall Islands i
February 2017
Post Disaster Needs Assessment of the 2015-2016 Drought
Republic of the Marshall Islands
Republic of the Marshall Islands ii
Empowered lives. Resilient nations.
Empowered lives. Resilient nations.
An initiative of the African, Caribbean and Pacific Group, funded by the European Union and managed by GFDRRACP-EU Natural Disaster Risk Reduction Program
Supported and facilitated by
With financial support by
Technical input by

Republic of the Marshall Islands iii
FOREWORDThe Republic of the Marshall Islands (RMI) is extremely vulnerable to climate change and natural hazards. The country is experiencing damaging effects from climate change and seeing more frequent and intense events, such as drought, floods and swells, and tropical cyclones and storms. The recent drought of 2015–2016 resulted in the national government having to declare a state of disaster with an estimated 53,158 persons across the RMI affected by the severe drought conditions.
This post-disaster needs assessment (PDNA) was not only the first for the Marshall Islands, but also the first for the Northern Pacific and the first assessment of an atoll country worldwide. It will form the basis of the drought recovery strategy to be managed by the Government of RMI and will guide recovery of the key sectors affected by the drought. The PDNA shows that the total economic losses caused by the drought have an estimated value of USD 4.9 million, with agriculture being the single most affected individual sector. What the assessment also found was that there was a significant decline in the quality of life as a direct result of the drought conditions.
The drought and prior natural disaster events clearly underpin the need for climate change and disaster risk management to be better understood, better planned, and better coordinated and funded at all levels – locally, nationally, regionally and internationally. Building resilience is key and the results of the PDNA will help RMI voice and prioritize its drought recovery actions, adjust national planning and offer guidance on financing.
On behalf of President Heine and the government and people of RMI, I wish to take this opportunity to thank our development and donor partners for their commitment and support to RMI in the development of this valuable assessment and the very first drought PDNA in the Pacific. In particular, our sincere gratitude to the European Union, the Pacific Community, the United Nations Development Program, the Office of the Chief Secretary and the National Disaster Management Office for their assiduous effort in the making of this PDNA. It was a great privilege to have Mr Roberto Jovel, senior international consultant for the World Bank, lead the PDNA process in our country.
I would be remiss if I did not also acknowledge the hard work and commitment of the various Marshallese men and women from the nation’s capital and the outer islands, who dedicated their time and effort throughout the process of the PDNA. A special acknowledgement to the Joint Unit for Disaster Risk Reduction and Climate Adaptation at the Office of the Chief Secretary for providing the secretariat to the PDNA and backstopping support to the national team.
The findings and recommended strategies in this document present a brilliant beginning, upon which the Government of the Republic of the Marshall Islands in a collective effort with civil society, private sector, and international partners can undertake the important task of recovery planning and implementation.
Mattlan Zackhras
Minister-in-Assistance to the President
Office of the PresidentRepublic of the Marshall Islands

Republic of the Marshall Islands iv
ACKNOWLEDGEMENTSThe post-disaster needs assessment (PDNA) was an extensive and labour-intensive exercise that would not have been possible without the dedication and support of several ministries and departments of the Government of Republic of the Marshall Islands in providing the time and expertise of their staff. Their drive and dedication underpins this government-led approach to disaster risk management and is a model for improved coordination for a more resilient Republic of the Marshall Islands.
Special acknowledgement is extended to the Minister-in-Assistance to the President, the Honourable Mattlan Zachras for the leadership, support and cooperation of his office throughout the assessment.
The PDNA team is grateful for the technical and financial support of the European Union, the Pacific Community (SPC), the United Nations and the World Bank Group, which provided the overall guidance for the PDNA process.
The PDNA greatly benefitted from the dedicated involvement and valuable contribution of the following national representatives and technical officers:
Kino S. Kabua (Deputy Chief Secretary), Antonio Eliu (Director – NDMO), Stephen Lepton, Thomas Maddison, Billy Edmond, Samuel Batti Lanwi Jr., Benedict Yamamura, Lajkit Rufus, Mackneil Abraham (Team Leader), Ransen L. Hansen Jr, Edler Anzures, Yoland Jurelang, Albert J. Ben, Herson Aloka, Francyne Wase-Jacklick, Aina Garstang, Randon Kaneko, Gee Leong Bing, Hanlee Term, Tricia Marie Taklu Menke, George George, Tuvuki Ketedromo, Halston deBrum, Paul Paul, Linus Kebos, Karness Kusto, Melvin Aliven, Steven Wakefield, Brooke Takala, Jessica Zebedee, Rose Minor, Cheryl English, Genna Tiobech-Hensen, Keyoka P. Kabua, Neilan Kaminaga, Angela Saunders, Tim Langrine, Kennedy Clanry, Lee Jacklick, Terry Keju, Paul Alee, Allison Nashion, Len Lenja, Junior Peter, Maybelline Bing, Jennifer Tseng, Daniel Timothy, Lita Flood, Herbert Sibok, Anthony Peren, Jennifer deBrum, Melanie Vicente and Bianca Samuel, Roberto Jovel (Consultant, World Bank), Paul Taylor (Manager, SPC Disaster Reduction Programme), Nicole Daniels (SPC editor), Sailesh Kumar Sen (SPC graphic artist), Dominique Blariaux (agricultural specialist), Mat Thame (water and sanitation specialist), Kim Robertson (SPC gender statistician), Asha Kambon (gender specialist), Edward Bernard (International Labour Organisation, ILO), Julian Schweitzer (Consultant, ILO), Paula Holland (Manager, Natural Resources Governance, SPC, and PDNA coordinator), Noud Leenders (Recovery Advisor, United Nations Development Programme, and PDNA coordinator).
We also gratefully acknowledge the 150+ people who shared their life experience of the 2016 drought across the Marshall Islands:
Lalera Erakrik, Ruthann Luis, Rosilla Isaiah, Hellma Anjuron, Kalora Benjimon, Junior deBrum, Motlok Pirsin, Paul Jibke, Hermon John, Stan Hazzard, Dally Jibke, Kioni Emel, Frederick Capelle, Andy Myena, Tania C, Bira H, Mary C, Wain T, Justina K, Winnie C, Sholla A, Wertha C, Rosa Capelle, Hemity deBrum, Patricia de Brum, Melinda Akkie, Telbi Bano, Jenny Hazzard, Cornella Hazzard, Hinna Hazzard, Rollenda Lokejok, Wendy de Brum, Agatha Emel, Kioni Emel, Ejmi Isaiah, Lino Tabu, Rison Isaiah, Hackney Emel, Mami Anuntak, Juamle Samuel, Rohanna Lomwe, Rise Anuntok, Mary Hitchfield, Roselina Benjamin, Garlami Luis, Selina Neirok Leem, Kathy Jetnil-Kijiner, Malynne Joseph, Winona J. Kisino, Canse Cho Carmel, Brandon Nathan, Alik Balos, William Kaisha Jr., Shima Seese, Tanner Smith, Rozena Tonyokwe, Nate Jellum, Jacky Patrick, Mackzine, Fritzad Reiher, Peter Macwhaleng, Bill Labija, Jackson Elcar, Florence Ned, Matlina Swain, Ruthann Korean, Stella M. Jack, Elias Jack, Joanna Ria, Marcellina Alik, Roseping Naishes, Wine Kobar, Beij Aki, Ricky R, Jilley Isaac, Namo H Abon, Roseann Jonju, Hezline Ria, Wanita, Altha, Jemitha R, Jackline, Jalet, Katrina M., Arina Felix, Aina Joash, Helisa Ceaser, Emile Lakjon, Matty Emos, Rosieland Riklon, Mesoheison, Jeremiah, Samlee, Jeffery, Robson John, Talleri, Erwina, Aljina, Selina William, Jessica William, Roslen Tare, Hannah William, Shinella Binat, Sandy Jiwirak, Merina Lat, Christy Jiwirak, Susanna Jiwirak, Biket Mewa, Amy Jibbwa, Makak Jeor, Motak Jonatha, Laurieline Jonatha, Milla Jetnol, Teliana Julal, Heitty Martin, Cathlin Hiram, Neiko Toka, Belitha Jorbal, Neinok Carol William, Hannah William, Elizabeth Lojan, Margarete Jiwirak, Monica Loran, Mishiko Lasmus, Herine jibon, Bilum Laijak, Helthy Lometo, Moje Kelen, Rebka Leijak, Sherlynn Lajon, Berlinda Chutaro, Neijoke L., Jostrokrok Lorokon Jacob, Nirok Lorok, Junior Samuel, Joonathan Lang, Davi Jacob, Kora Loran, Niestle Lometo, Carrtas Tarwoj, Shsete Erickdril, Emelia Labu, Tearmeu Jerwan, Hina L. Lorennz, Kyle Johnny, Nathan Nathan, Daline Kisino, Vanessa Dan, Cheryl Langbata, Christopher Bejang, Moseu Iosia, and Junny Abal.
Republic of the Marshall Islands 1
TAbLE OF CONTENTS ACKNOWLEDGEMENTS .......................................................................................................................Iv
AbbREvIATIONS ...................................................................................................................................5
ExECuTIvE SuMMARy .........................................................................................................................6
1 INTRODuCTION ....................................................................................................................................13 1.1 Overview of the 2015–2016 drought in Marshall Islands ................................................................................14
1.2 Socio-economic context of RMI .......................................................................................................................14
1.3 Response from the government and development partners .........................................................................14
1.4 Post-disaster needs assessment methodology .............................................................................................15
2 MACRO-ECONOMIC IMPACT ................................................................................................................17 2.1 Recent macro-economic performance ...........................................................................................................18
PRODuCTIvE SECTORS ..............................................................................21
3 CROPS AND LIvESTOCK ......................................................................................................................23 3.1 Sector background and pre-disaster situation ...............................................................................................24
3.2 Assessment of disaster effects .......................................................................................................................24
3.3 Agriculture post-disaster assessment ...........................................................................................................25
3.4 Recovery strategy and needs ...........................................................................................................................28
4 INDuSTRy AND COMMERCE ...............................................................................................................30 4.1 Industry sector. ................................................................................................................................................31
4.2 Recovery needs – industry sector....................................................................................................................33
4.3 Commerce sector ............................................................................................................................................33
4.4 Drought effects .................................................................................................................................................33
SOCIAL SECTORS ........................................................................................35
5 HEALTH SECTOR ..................................................................................................................................37 5.1 Background ......................................................................................................................................................38
5.2 Estimation of drought effects ..........................................................................................................................38
5.3 Recovery needs ................................................................................................................................................40
5.4 Health sector capacity development ...............................................................................................................42
6 EDuCATION SECTOR ............................................................................................................................43 6.1 Drought and education ....................................................................................................................................44
6.2 Estimation of disaster effects ..........................................................................................................................44
6.3 Recovery needs ................................................................................................................................................47
INFRASTRuCTuRE SECTORS .....................................................................51
7 WATER AND SANITATION SECTOR ......................................................................................................52 7.1 Drought effects .................................................................................................................................................53
7.2 Assessment of drought effects ........................................................................................................................55
7.3 Recovery strategy and needs ...........................................................................................................................56
Republic of the Marshall Islands 2
8 ELECTRICITy SECTOR ..........................................................................................................................62 8.1 Drought impact on the sector ..........................................................................................................................63
CROSS-CuTTING ISSuES ...........................................................................67
9 GENDER AND SOCIAL INCLuSION ......................................................................................................68 9.1 Background ......................................................................................................................................................69
9.2 Effects of the drought ......................................................................................................................................70
9.3 Recovery strategy and needs ...........................................................................................................................71
10 DISASTER RISK MANAGEMENT ..........................................................................................................73 10.1 Disaster risk management sector background ..............................................................................................74
10.2 Institutional arrangements ..............................................................................................................................75
10.3 Mechanisms and activities ...............................................................................................................................76
10.4 The response ....................................................................................................................................................76
10.5 Losses in the disaster risk management sector ............................................................................................77
10.6 Challenges ........................................................................................................................................................78
10.7 Areas for improvement ....................................................................................................................................78
10.8 Recovery needs for disaster risk management ..............................................................................................82
MACRO-SOCIAL IMPACT ............................................................................85
11 EMPLOyMENT, LIvELIHOODS AND SOCIAL IMPACT ..........................................................................86 11.1 Summary ..........................................................................................................................................................87
11.2 Pre-disaster context ........................................................................................................................................88
11.3 Disaster impact ................................................................................................................................................90
11.4 Recovery strategy and needs ...........................................................................................................................91
12 PERSONAL INCOME .............................................................................................................................93 12.1 General comments ...........................................................................................................................................94
12.2 Estimation of post-disaster needs ..................................................................................................................96
13 QuALITy OF LIFE DECLINE ..................................................................................................................98 13.1 Estimation of the Quality of Life Index .............................................................................................................99
13.2 Composite Quality-of-Life Index ......................................................................................................................103
bIbLIOGRAPHy ..........................................................................................................................................107
ANNExES ...................................................................................................................................................109 Annex 1 DEFINITIONS OF DROUGHT: WHEN DOES A DROUGHT OCCUR?...........................................................110
Annex 2 TRADITIONAL MARSHALLESE CALENDAR (HARVEST SEASONS OF TRADITIONAL CROPS) ...............113
Annex 3 BASELINE DATA AND ANNUAL PRODUCTION ESTIMATES ....................................................................114
Annex 4 DROUGHT IMPACT ON CROPS AND LIVESTOCK ......................................................................................117
Annex 5 BACKGROUND TO THE WATER SECTOR IN RMI ......................................................................................119
Annex 6 CLASSIFICATION OF APGAR SCORES .......................................................................................................121
Annex 7 SUMMARY OF FOCUS GROUP OBSERVATIONS FOR GENDER AND INCLUSIVITY .................................122
Annex 8 SUMMARY OF SECTOR DISASTER RISK REDUCTION NEEDS .................................................................126
Annex 9 SUMMARY OF SECTOR DISASTER RISK MANAGEMENT NEEDS ............................................................128

Republic of the Marshall Islands 3
TAbLESTable A: Summary of FY 2016 drought effects (USD thousand) ..................................................................................06
Table b: Geographical distribution of drought-induced production disruption ..........................................................08
Table C: Recovery needs (USD) in FY 2017 ...................................................................................................................10
Table D: Recovery needs (USD) in FY 2018 ...................................................................................................................11
Table 1: Classification of production flow changes arising from the FY 2016 drought (USD thousand) ...................19
Table 2: Classification of production flow changes arising from the FY 2016 drought (USD thousand) ...................20
Table 3: Damage and loss in the agriculture sector (loss in crop and damage in livestock sub-sector) (USD) ......27
Table 4: Summary of the damage and loss in the agriculture (crop and livestock) sector by atoll (USD) ...............28
Table 5: Recovery needs in the agricultural sector 2016–2017 (USD) ........................................................................29
Table 6: Reduction needs in the agriculture sector (USD) ..........................................................................................29
Table 7: Annual exports of processed copra ...............................................................................................................31
Table 8: Number of patients with drought-related diseases and treatment costs for the FY 2016 drought in Marshall Islands .............................................................................................................................................39
Table 9: Number of children with malnutrition in the first half of 2015 and 2016 calendar years............................40
Table 10: Recovery needs (USD) in the health sector by atoll, 2017 .............................................................................41
Table 11: Disaster risk reduction – Development to make the system better (2017) ..................................................41
Table 12: Enrolment and attendance information in the education sector, school years (SY) 2012, 2013, 2014 and 2015. .........................................................................................................................................................44
Table 13: Absenteeism rates in the schools most affected in SY 2014 and SY 2015 ...................................................45
Table 14: Absenteeism rates in the most affected schools in SY 2012 and SY 2013 ...................................................45
Table 15: Geographical distribution of education losses for the 2013 and 2016 droughts ..........................................46
Table 16: Education recovery needs, 2017 .....................................................................................................................47
Table 17: Education risk reduction needs, 2017 ............................................................................................................47
Table 18: Education risk reduction needs, 2018 ............................................................................................................48
Table 19: Education risk reduction needs, 2019 ............................................................................................................48
Table 20: Percentage of population using primary water .............................................................................................54
Table 21: PWWA APGAR benchmarking for MWSC and KAJUR 2015 ..........................................................................54
Table 22: Water collection times ....................................................................................................................................57
Table 23: Damage and losses (USD) in the water and sanitation sector by sub-sector ..............................................57
Table 24: Recovery needs (USD) in the water sector ....................................................................................................61
Table 25: Disaster risk reduction needs (USD) in the water sector .............................................................................61
Table 26: Estimation of higher residential consumption of electricity due to drought in RMI. ...................................64
Table 27: Estimation of higher electricity consumption costs and comparison to per capita and household income .............................................................................................................................................................65
Table 28: Cost of response activities ..............................................................................................................................78
Table 29: Disaster risk management needs 2017 .........................................................................................................82
Table 30: Disaster risk management needs, 2018 ........................................................................................................83
Table 31: Disaster risk management needs, 2019 ........................................................................................................83
Table 32: Unemployment by gender, age, and education (percentage) .......................................................................88
Table 33: Changes in production, work days and personal income by sector .............................................................90
Table 34: Recovery needs (USD) in the employment livelihoods and social impact section .......................................92
Table 35: Inflation-adjusted per capita income for all atolls ........................................................................................94
Table 36: Estimation of personal income decline due to impact of the FY 2016 drought ............................................94
Table 37: Copra purchases by Tobolar Authority in FY 2015 and FY 2016 – .................................................................96
Table 38: Estimates of additional higher copra purchases required for personal income recovery ..........................97
Table 39: Education index for FY 2016 drought .............................................................................................................99
Table 40: Health index for FY 2016 drought ...................................................................................................................100
Table 41: Water-supply access index for FY 2016 drought ...........................................................................................101
Table 42: Personal income index for the FY 2016 drought ...........................................................................................102
Table 43: Composite Quality of Life Index for pre-drought and post-drought conditions ...........................................103
Table 44: Decline in Quality of Life Index components due to drought in all atolls/islands ........................................106

Republic of the Marshall Islands 4
FIGuRESFigure A: Distribution of drought across private and public sector ............................................................................07
Figure b: Economic effects of drought by sector .........................................................................................................07
Figure C: Disruption of production flows in social and economic activity, by sector .................................................08
Figure D: Relationship between drought-induced losses and per capita income in the atolls .................................09
Figure 1: Quality of life weighted indicators .................................................................................................................16
Figure 2: GDP performance in Marshall Islands FY 2012 to FY 2016 .........................................................................18
Figure 3: Possible GDP performance, including isolated impact of drought in FY 2016 ...........................................19
Figure 4: Share of loss (%) in subsistence crops.........................................................................................................25
Figure 5: Losses on annual and perennial crops (USD) ..............................................................................................26
Figure 6: Share of losses in production (imperial tons) in the crop sub-sector ........................................................26
Figure 7: Share of cross losses (USD) between atolls (excluding copra) ...................................................................27
Figure 8: Number of fruit trees per atoll .....................................................................................................................27
Figure 9: Monthly copra processing (short tons) during the 2013–2014 drought ......................................................31
Figure 10: Monthly copra processing (short tons) during the 2016 drought in the Marshall Islands .........................32
Figure 11: Bottled water sales during the FY 2016 drought in Majuro .........................................................................34
Figure 12: Variation in the number of patients with conjunctivitis in Majuro, 2011 to 2016 ........................................38
Figure 13: Variation in the number of patients with scabies in Kwajalein, 2011 to 2016 .............................................39
Figure 14: Majuro International Airport runway catchment production outflow (gallons) ..........................................55
Figure 15: Draft Water and Sanitation Policy 2013 ........................................................................................................60
Figure 16: Monthly air temperature at Majuro vis-à-vis long-term average temperature, 2010 to 2016 ...................63
Figure 17: Monthly sales of electricity to the residential sector in Majuro compared to average sales in the period 2010 to 2016 .......................................................................................................................................64
Figure 19: Employment by economic activity and gender .............................................................................................88
Figure 20: Household income distribution, percentage ................................................................................................89
Figure 21: Change in personal income by island ...........................................................................................................90
Figure 22: Personal income decline as a percentage of pre-drought income levels per atoll ...................................95
Figure 23: Value of Composite Quality-of-Life Index for pre- and post-drought conditions .......................................104
Figure 24: Most affected atolls/islands in terms of quality of life index decline : A. The graph shows the composite QLI decline as a percentage; B. Shows the QLI percentage decline in geographical terms ...105
IMAGESImage 1: Woja Elementary School Majuro well. ..........................................................................................................48
Image 2: Marshall Islands High School well ...............................................................................................................48
Image 3: Wodmej Elementary School Wotje gutter ....................................................................................................48
Image 4: Lukonwod Elementary School Mili gutter. ...................................................................................................48
Image 5: Marshall Islands High School catchments ..................................................................................................49
Image 6: Ulien Elementary School Arno ......................................................................................................................49
Image 7: Nallo Elementary School Mili catchment .....................................................................................................49
Image 8: Mejrirok Elementary School Jaluit catchment. ...........................................................................................49
Image 9: Ajeltake Elementary Majuro catchment .......................................................................................................49
Image 10: Mejel Elementary School catchment ............................................................................................................49
Image 11: Water sources in Majuro. ..............................................................................................................................53
Republic of the Marshall Islands 5
AbbREvIATIONSADb Asian Development Bank
DRM disaster risk management
DRR disaster risk reduction
ENSO El Niño Southern Oscillation Phenomenon
EOC Emergency Operation Center
EPA Environmental Protection Agency
EPPSO Economic Policy, Planning and Statistics Office
FAO Food and Agriculture Organization
GEF Global Environment Fund
IOM International Organization for Migration
JNAP Joint National Action Plan for Disaster Risk Management and Climate Change Adaptation Plan
MWSC Majuro Water and Sewer Company
QLI Quality of Life Index
NDMO National Disaster Management Office
ROC Taiwan officially the Republic of China
SPC Pacific Community
SPREP Secretariat of the Pacific Regional Environment Programme
SWRO salt water reverse osmosis
uNDP United Nations Development Programme
uNICEF United Nations Children’s Fund
uSAID/OFDA United States Agency for International Development/Office of U.S. Foreign Disaster Assistance
uSD US dollar
WASH water, sanitation and hygiene
WHO World Health Organization
WSO Weather Service Office
WuTMI Women United Together Marshall Islands
Republic of the Marshall Islands 6 Republic of the Marshall Islands
Post Disaster Needs Assessment of the 2015-2016 Drought | ExEcutivE Summary
ExECuTIvE SuMMARy Historically, the Republic of the Marshall Islands (RMI) has faced significant challenges with its water supply. Between 2015 and 2016, extremely low precipitation and an especially intense El Niño Southern Oscillation (ENSO) resulted in a severe drought. By May 2016, 21,000 people in RMI were affected – 1,257 households on the outer islands and 5,195 households in urban areas.
A state of drought emergency was declared by the Government of RMI on 3 February 2016, which was subsequently elevated to a state of disaster on 4 March. On 27 April 2016, US President Barack Obama declared the drought a disaster for the Marshall Islands. In response, the Government of RMI requested support from the World Bank to conduct a post disaster needs assessment (PDNA) to evaluate the economic effects of the drought. The Government of RMI also requested assistance from the Pacific Community (SPC) to undertake a scoping mission in March 2016 to assess the key sectors affected, including agriculture, water and health. As a result, it was recommended that a more detailed assessment be conducted to assess the overall economic effects of the drought.
With the assistance of The European Union, the Pacific Community, the United Nations Development Programme, the United Nations, and the World Bank, a PDNA commenced on 1 August 2016. As the assessment was being carried out, it became apparent that the financial impacts were considerable across all sectors, and that the private sector was affected to a much greater degree than the public sector. The PDNA also revealed a significant decline in the quality of life for people in RMI as a direct result of the drought conditions experienced.
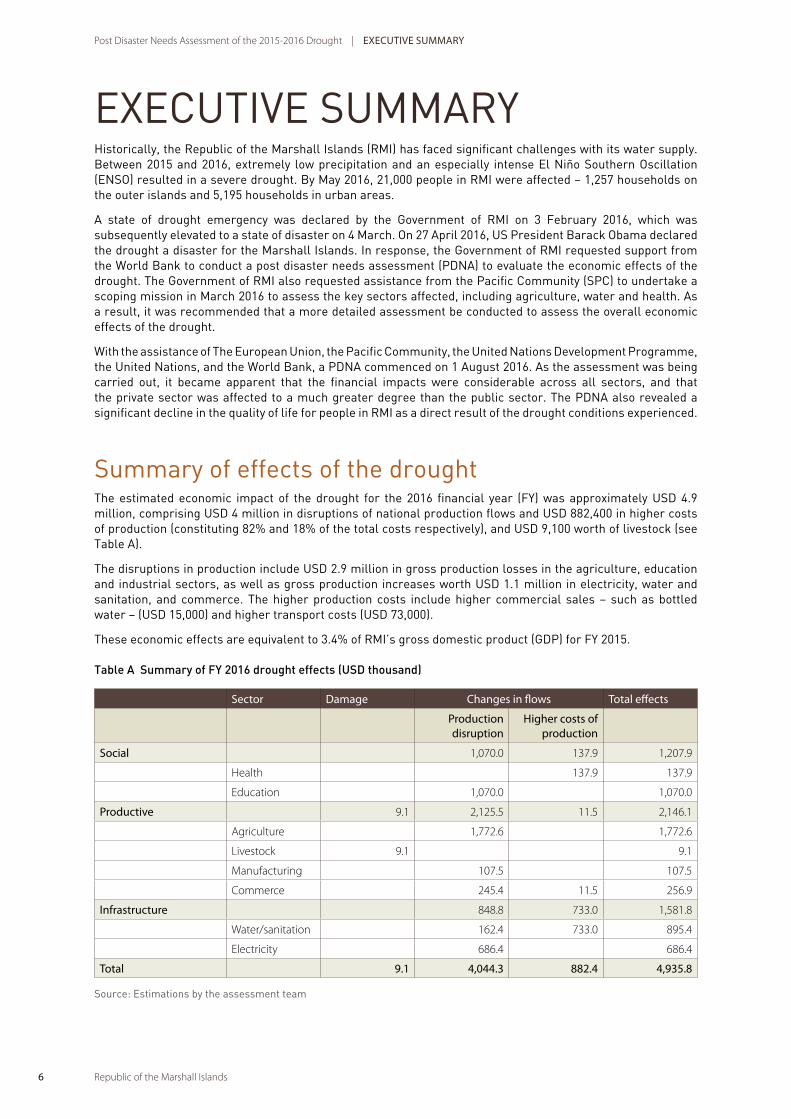
Summary of effects of the droughtThe estimated economic impact of the drought for the 2016 financial year (FY) was approximately USD 4.9 million, comprising USD 4 million in disruptions of national production flows and USD 882,400 in higher costs of production (constituting 82% and 18% of the total costs respectively), and USD 9,100 worth of livestock (see Table A).
The disruptions in production include USD 2.9 million in gross production losses in the agriculture, education and industrial sectors, as well as gross production increases worth USD 1.1 million in electricity, water and sanitation, and commerce. The higher production costs include higher commercial sales – such as bottled water – (USD 15,000) and higher transport costs (USD 73,000).
These economic effects are equivalent to 3.4% of RMI’s gross domestic product (GDP) for FY 2015.
Table A Summary of FY 2016 drought effects (USD thousand)
Sector Damage changes in flows total effects
Production disruption
Higher costs of production
Social 1,070.0 137.9 1,207.9
Health 137.9 137.9
Education 1,070.0 1,070.0
Productive 9.1 2,125.5 11.5 2,146.1
Agriculture 1,772.6 1,772.6
Livestock 9.1 9.1
Manufacturing 107.5 107.5
Commerce 245.4 11.5 256.9
infrastructure 848.8 733.0 1,581.8
Water/sanitation 162.4 733.0 895.4
Electricity 686.4 686.4
total 9.1 4,044.3 882.4 4,935.8
Source: Estimations by the assessment team

Republic of the Marshall Islands 7
Post Disaster Needs Assessment of the 2015-2016 Drought | ExEcutivE Summary
Republic of the Marshall Islands
Post Disaster Needs Assessment of the 2015-2016 Drought | ExEcutivE Summary
Figure A: Distribution of drought across private and public sector
Source: Estimations by the assessment team
Disruptions in the production of goods in the productive sectors – agriculture, industry and commerce – amounted to USD 2.15 million (43.5% of the total drought costs); the infrastructure sectors – electricity and water – faced estimated losses of USD 1.58 million (32% of the total). The social sector, including education and health, endured USD 1.2 million (24% of the total) in losses. Figure B shows the breakdown of the economic effects of the drought by sector.
24%
Public Sector
Private Sector
76%
44%
32%
24%
Social
Productive
Infrastructure
Figure B: Economic effects of drought by sector
Source: Estimations by the assessment team
The agriculture sector was the most severely impacted by the drought, sustaining a decline of USD 1.77 million in gross production (see Figure C) – including subsistence and commercial sales – which represents a 12% drop from normal production levels. The second most affected sector was education, with losses estimated at USD 1.1 million. Electricity and water and sanitation were also significantly affected, as they faced increased demand for services, as well as higher-than-normal operational costs, ranging between USD 700,000 and USD 900,000. Commerce, health and manufacturing were the least affected sectors, in terms of economic losses (see Figure C).
Of the total losses resulting from the drought, 76% occurred in the private sector, while the public sector bore only 24% of the economic impact (Figure A). Consequently, relief and recovery efforts would need to be split proportionally between the government and private entities (including both individual families and enterprises).

Republic of the Marshall Islands 8 Republic of the Marshall Islands
Post Disaster Needs Assessment of the 2015-2016 Drought | ExEcutivE Summary
Figure C: Disruption of production flows in social and economic activity, by sector
Source: Estimations by the assessment team
The geographical distribution of drought-induced losses is not uniform. The estimated losses per atoll are shown in Table B. The atolls with the highest recorded losses, in order of descending magnitude, include: Majuro (USD 2.5 million), Kwajalein (USD 305,400), Arno (USD 283,800) and Maloelap (USD 213,600).
A clearer geographic distribution of drought impact may emerge, however, when introducing population considerations into the analysis. Table B provides information on per capita losses for all atolls. The population of Wotho sustained the highest per capita losses of all the atolls (USD 590 per person), followed by Jabat (USD 407 per person) and the residents of Maloelap and Aur (USD 345 and 307 per person respectively).
Table B: Geographical distribution of drought-induced production disruption
atoll Production disruption
uSD Per capita, uSD/person
ailinglaplap 153,374 93
ailuk 45,625 160
arno 283,810 168
aur 146,894 304
Ebon 4,497 7
Enewetak 73,389 123
Jabat 32,435 407
Jaluit 73,357 40
Kili 18,382 39
Kwajalein 305,395 26
Lae 54,577 152
Lib 29,697 187
Likiep 39,096 109
majuro 2,543,997 86
maloelap 213,622 345
mejit 68,540 212
mili 119,471 187
Namdrik 7,100 17
Namu 128,787 176
rongelap 4,657 34
ujae 33,746 100
utrik 19,216 44
Wotho 48,226 590
Wotje 154,030 180
Source: Estimations by the assessment team
iii
Figure 2 Economic effects of drought by sector Source: Estimations by assessment team
The agriculture sector was the most severely impacted by the drought, sustaining a decline of USD 1.77 million in gross production (see Figure 3) – including subsistence and commercial sales – which represents a 12 per cent drop from normal production levels. The second most affected sector was education, with losses estimated at USD 1.1 million. Electricity and water and sanitation were also significantly affected, as they faced increased demand for services, as well as higher-‐than-‐normal operational costs, ranging between USD 700,000 and USD 900,000. Commerce, health and manufacturing were the least affected sectors, in terms of economic losses (see Figure 3). Figure 3 Disruption of production flows in social and economic activity, by sector Source: Estimations by assessment team The geographical distribution of drought-‐induced losses is not uniform. The estimated losses per atoll are shown in Table 2. The atolls with the highest recorded losses, in order of descending magnitude, include: Majuro (USD 2.5 million), Kwajalein (USD 305,400), Arno (USD 283,800) and Maloelap (USD 213,600).
Social 24%
Produc6ve 44%
M= OMM= QMM= SMM= UMM= NIMMM= NIOMM= NIQMM= NISMM= NIUMM=
^ÖêáÅìäíìêÉ=
bÇìÅ~íáçå=
t~íÉê=~åÇ=ë~åáí~íáçå=
bäÉÅíêáÅáíó=
`çããÉêÅÉ=
eÉ~äíÜ=
j~åìÑ~ÅíìêáåÖ=
Produc6on disrup6on Higher produc6on costs
Natalie McMullen 11/7/2016 11:29 AMComment [1]: Ensure in final layout ‘infrastructure’ is on one line. When I move it – I get a grey line added to the diagram.
Paul Taylor 11/8/2016 1:45 PMComment [2]: Should be OK now.
Production disruption
Higher production costs

Republic of the Marshall Islands 9Republic of the Marshall Islands
Post Disaster Needs Assessment of the 2015-2016 Drought | ExEcutivE Summary Post Disaster Needs Assessment of the 2015-2016 Drought | ExEcutivE Summary
Figure D shows the relation between per capita income and the estimated value of per capita production disruption induced by the drought for all affected atolls. The atolls with below-average income levels – Wotho, Maloelap, Aur, Wotje, Jabat and Mejit – faced the highest levels of production disruption per capita. Residents of Majuro, Kwajalein and Kili – the atolls with higher-than-average personal income – sustained lower levels of drought-induced disruption to production.
xv
Figure D: Relationship between drought-‐induced losses and per capita income in the atolls Source: Estimations by the assessment team Quality of Life Index (QLI) decline While there is generally a decline in quality of life following any disaster, the particular nature of the drought in RMI means that the impact observed across the country was likely to be considerable. To measure this impact, a composite quality of life index was calculated for RMI. The index – already tested and applied in previous post disaster needs assessments – is based on a variety of sectorial indicators including, for example, the number of hospital patients or disease outbreaks arising from the disaster and the number of school-‐days lost by students due to interruption of classes. The decline in calculated quality of life arising from the drought was most apparent in communities on Ailuk, Jabot and Arno atolls, where rates of decline measured in excess of 25%. Overview of recovery needs Based on the PDNA, total emergency and recovery costs for the drought are estimated at USD 3 million,
AILINGLAPLAP
AILUK
ARNO
AUR
EBON
ENEWETAK
JABAT
JALUIT KILI
KWAJALEIN
LAE
MILI
LIKIEP MAJURO
MALOELAP
MEJIT LIBI
NAMDRIK
NAMU
UJAE
UTIRIK
WOTHO
WOTJE
-‐
100
200
300
400
500
600
700
-‐ 500 1,000 1,500 2,000 2,500 3,000
Per capita disrup6on, USD per person
Per capita income, USD per person
Figure D: Relationship between drought-induced losses and per capita income in the atolls
Source: Estimations by the assessment team
Quality of Life Index (QLI) declineWhile there is generally a decline in quality of life following any disaster, the particular nature of the drought in RMI means that the impact observed across the country was likely to be considerable. To measure this impact, a composite quality of life index was calculated for RMI. The index – already tested and applied in previous post disaster needs assessments – is based on a variety of sectorial indicators including, for example, the number of hospital patients or disease outbreaks arising from the disaster and the number of school-days lost by students due to interruption of classes. The decline in calculated quality of life arising from the drought was most apparent in communities on Ailuk, Jabot and Arno atolls, where rates of decline measured in excess of 25%.
Overview of recovery needsBased on the PDNA, total emergency and recovery costs for the drought are estimated at USD 3 million, with 1.3 million needed for recovery efforts in 2016, and the remaining activities needed for implementation of activities in FY 2017 and FY 2018, pending redirection of existing funding and acquisition of additional funding. Disaster risk reduction (DRR) interventions to strengthen sector resilience will cost an estimated USD 1.8 million (see Annex 8) over a period of three years, and the disaster risk management (DRM) sector will need an estimated USD 0.8 million over three years to bring RMI to a desired operational level (see Annex 9).
Recovery efforts will initially need to focus on the most affected sectors and geographical areas, while also ensuring that other sectors and strategic needs are addressed.

Republic of the Marshall Islands 10 Republic of the Marshall Islands
Post Disaster Needs Assessment of the 2015-2016 Drought | ExEcutivE Summary
Tabl
e C
: Rec
over
y ne
eds
(USD
) in
FY 2
017
Prog
ram
of a
ctiv
ity
valu
e (u
SD)
resp
onsi
ble
age
ncy
cro
ps
and
Live
stoc
k
Emer
genc
y in
terv
entio
ns: f
ood
dist
ribut
ion
in 2
5 at
olls
for 4
-to-
6 m
onth
s dep
endi
ng o
f the
leve
l of d
roug
ht im
pact
1,29
7,90
1G
oRM
I (U
SD 1
4 43
9), O
FDA/
IOM
(USD
601
600
), FN
S (U
SD
451
200)
, AD
B (U
SD 1
75 8
42),
ROC
(USD
54
820)
1 , lik
ely
spen
t as e
arly
as 2
016
Seed
s, se
edlin
gs, s
ucke
rs, c
uttin
gs a
nd o
ther
agr
icul
tura
l inp
uts a
nd e
quip
men
t for
re-p
lant
ing
of c
rops
150,
000
FAO
/WU
TMI,
US
Fore
stry
, SPC
: (U
SD 6
000
brea
dfru
it an
d pa
ndan
us se
edlin
gs),
MRD
, PRE
L2
com
mer
ce a
nd in
dust
ry
Tobo
lar3 to
cha
nge
ship
ping
rout
es to
targ
et w
orst
affe
cted
isla
nds w
ith re
spec
t to
QLI
to sh
orte
n th
e re
cove
ry ti
me
of
thes
e co
mm
uniti
es0
Tobo
lar a
nd M
RD
Hea
lth
Mob
ile o
utre
ach
clin
ics
(one
doc
tor w
ith s
uppo
rt fr
om n
urse
s) w
ith a
focu
s on
mon
itorin
g m
alnu
triti
on, i
nste
ad o
f the
sc
hedu
led
annu
al h
ealth
cen
tre
visit
, whi
ch d
id n
ot ta
ke p
lace
this
year
bec
ause
of t
he d
roug
ht
90,4
00M
OH
4
Repl
enish
men
t of
med
icin
es a
nd s
uppl
ies
in t
he h
ospi
tals
and
heal
th c
entr
es; r
eple
nish
men
t of
labo
rato
ry re
agen
ts
and
supp
lies
108,
852
MO
H
Supp
ort c
omm
unity
seve
re a
nd m
oder
ate
acut
e m
alnu
triti
on tr
eatm
ent,
incl
usiv
e of
trea
tmen
t cos
ts (e
stim
ated
at U
SD
200
for 1
9 pa
tient
s)22
,800
MO
H
Com
mun
ity h
ealth
edu
catio
n pr
ogra
m, a
ddin
g a
drou
ght-
spec
ific
editi
on20
,000
MO
H
Educ
atio
n
Esta
blish
afte
r-sch
ool p
rogr
amm
es fo
r st
uden
ts w
ho m
issed
sch
ool d
urin
g th
e dr
ough
t (L
ib E
lem
., Lu
koj E
lem
., an
d Ka
tiej E
lem
., and
oth
er re
mot
e at
olls
that
wer
e se
vere
ly a
ffect
ed)
13,0
00M
OE/
PSS5
Sum
mer
scho
ol c
lass
es fo
r Maj
uro
scho
ols (
Ajel
take
and
Lau
ra E
lem
.)35
,000
MO
E/PS
S
Sum
mer
scho
ol c
lass
es fo
r Ebe
ye P
ublic
Ele
men
tary
Sch
ool (
Kwaj
alei
n At
oll)
16,0
00M
OE/
PSS
Stud
ent f
eedi
ng p
rogr
am (l
unch
mea
ls fo
r Ebe
ye a
nd M
ajur
o sc
hool
s)65
,000
MO
E/PS
S
Vita
min
s to
be g
iven
to st
uden
ts (f
olic
aci
d, m
ulti-
vita
min
s, et
c. O
ther
vita
min
s are
don
ated
by
UN
ICEF
and
WH
O)
300,
000
MO
E/PS
S, M
inist
ry o
f Hea
lth, W
HO
, UN
ICEF
, etc
.
Wat
er
Reco
very
of 3
60G
PD R
O u
nits
, mai
nten
ance
and
pre
posit
ioni
ng to
stor
es in
Ebe
ye a
nd M
ajur
o11
0,00
0M
WSC
, KA
JUR6 (r
ecov
ery
and
spar
es fu
nded
)
1 G
oRM
I: G
over
nmen
t of t
he R
epub
lic o
f the
Mar
shal
l Isl
ands
; OFD
A: U
S O
ffic
e of
For
eign
Dis
aste
r A
ssis
tanc
e; IO
M: I
nter
natio
nal O
rgan
izat
ion
for
Mig
ratio
n; A
DB
: Asi
an D
evel
opm
ent B
ank;
RO
C:
Rep
ublic
of C
hina
.2
FAO
: Foo
d an
d A
gric
ultu
re O
rgan
izat
ion;
WU
TMI:
Wom
en U
nite
d To
geth
er M
arsh
all I
slan
ds; M
RD
: Min
istr
y of
Res
ourc
es a
nd D
evel
opm
ent;
PR
EL: P
acifi
c R
esou
rce
for
Educ
atio
n an
d Le
arni
ng.
3 To
bola
r is
a s
tate
-ow
ned
ente
rpri
se th
at p
urch
ases
cop
ra fr
om th
e is
land
s an
d at
olls
and
pro
cess
es it
for
expo
rt to
fore
ign
mar
kets
.4
MO
H: M
inis
try
of H
ealt
h.5
MO
E: M
inis
try
of E
nvir
onm
ent;
PSS
: Pub
lic S
choo
l Sys
tem
.6
MW
SC: M
ajur
o W
ater
& S
ewer
Com
pany
; KA
JUR
: Kw
ajal
ein
Ato
ll Jo
int U
tility
Res
ourc
es.
Sour
ce: E
stim
atio
ns o
f the
ass
essm
ent t
eam
usi
ng o
ffic
ial i
nfor
mat
ion

Republic of the Marshall Islands 11Republic of the Marshall Islands
Post Disaster Needs Assessment of the 2015-2016 Drought | ExEcutivE Summary Post Disaster Needs Assessment of the 2015-2016 Drought | ExEcutivE Summary
Prog
ram
of a
ctiv
ity
valu
e (u
SD)
resp
onsi
ble
age
ncy
Emp
loym
ent,
Live
lihoo
ds a
nd S
ocia
l Pro
tect
ion
Nat
iona
l tra
inin
g of
trai
ners
on
care
er c
ouns
ellin
g 15
,000
NTC
, Min
istry
of E
duca
tion,
Min
istry
of I
nter
nal A
ffairs
, N
atio
nal Y
outh
Cou
ncil,
ILO
7
Star
t You
r Bus
ines
s (SY
B) tr
aini
ng fo
r you
ths i
n M
ajur
o an
d Eb
eye
30,0
00N
TC, C
ham
ber o
f Com
mer
ce, M
inist
ry o
f Res
ourc
es a
nd
Dev
elop
men
t, O
ffice
of C
omm
erce
and
Inve
stm
ent,
UN
DP,
ILO
Trai
ning
on
right
s of y
oung
wor
kers
and
nat
iona
l lab
our l
aws,
incl
udin
g de
velo
ping
a p
ocke
t gui
de
30,0
00N
atio
nal Y
outh
Cou
ncil,
Indu
stry
-bas
ed w
orke
rs
orga
nisa
tions
, ILO
Entr
epre
neur
ship
adv
ocac
y pr
ogra
mm
e, in
clud
ing
esta
blish
men
t of a
You
ng E
ntre
pren
eurs
Cou
ncil
20,0
00Ch
ambe
r of C
omm
erce
, SPC
, Pac
ific
Yout
h Co
unci
l, N
atio
nal Y
outh
Cou
ncil,
UN
DP,
ILO
Esta
blish
men
t of N
atio
nal E
mpl
oym
ent S
ervi
ces C
entr
e40
,000
NTC
, ILO
Esta
blish
men
t of a
fore
ign
wor
kers
dat
abas
e, in
clus
ive
of sk
ills,
qual
ifica
tions
etc
.10
,000
Div
ision
of L
abou
r (M
inist
ry o
f For
eign
Affa
irs),
Imm
igra
tion
and
ILO
tota
l rec
over
y N
eeds
Fy
2017
2,37
3,95
3
Tabl
e 4
Rec
over
y N
eeds
(USD
) in
FY 2
018
Prog
ram
of a
ctiv
ity
valu
e (u
SD)
resp
onsi
ble
age
ncy
Emp
loym
ent,
Live
lihoo
ds a
nd S
ocia
l Pro
tect
ion
Nat
iona
l Act
ion
Plan
on
Yout
h Em
ploy
men
t (N
AP) d
evel
oped
60,0
00Al
l rel
evan
t min
istrie
s, Ch
ambe
r of C
omm
erce
, Wor
kers
O
rgan
isatio
n, N
atio
nal Y
outh
Cou
ncil,
PYC8 , S
PC, U
ND
P, IL
O
Dev
elop
men
t of l
ocal
ly-t
ailo
red
SYB
trai
ning
mat
eria
ls 35
,000
NTC
, Offi
ce o
f Com
mer
ce a
nd In
vest
men
t, Ch
ambe
r of
Com
mer
ce, I
LO
TOT9 a
nd c
ertifi
catio
n of
loca
l bus
ines
s tra
iner
s 50
,000
NTC
, ILO
Care
er c
ouns
ellin
g pa
rt o
f Min
istry
of E
duca
tion
curr
icul
um
100,
000
Min
istry
of E
duca
tion,
NTC
, ILO
Priv
ate
sect
or d
evel
opm
ent p
rogr
amm
e in
clud
ing
esta
blish
men
t of d
atab
ase
and
busin
ess d
evel
opm
ent s
ervi
ces
50,0
00O
ffice
of C
omm
erce
and
Inve
stm
ent,
Cham
ber o
f Co
mm
erce
, UN
DP,
ILO
Dem
and-
driv
en sk
ills t
rain
ing
prog
ram
mes
100,
000
NTC
, ILO
Nat
iona
l em
ploy
men
t pol
icy
100,
000
Gov
ernm
ent,
Cham
ber o
f Com
mer
ce, W
orke
rs
Org
anisa
tions
, UN
DP,
ILO
Soci
al P
rote
ctio
n &
Emer
genc
y Em
ploy
men
t Pro
gram
me
for h
ouse
hold
s hea
ded
by w
omen
100,
000
Min
istry
of H
ealth
, Com
mun
ity D
evel
opm
ent D
ivisi
on
(Min
istry
of I
nter
nal A
ffairs
), N
TC
tota
l rec
over
y N
eeds
Fy
2018
595,
000
Sour
ce: E
stim
atio
ns o
f the
ass
essm
ent t
eam
usi
ng o
ffic
ial i
nfor
mat
ion
7 N
TC: N
atio
nal T
rain
ing
Cen
ter;
ILO
: Int
erna
tiona
l Lab
our
Org
aniz
atio
n.8
PYC
: Pac
ific
Yout
h C
ounc
il.9
Trai
ning
of t
rain
ers.

Republic of the Marshall Islands 12 Republic of the Marshall Islands Republic of the Marshall Islands
Post Disaster Needs Assessment of the 2015-2016 Drought | ExEcutivE Summary
The recovery strategyThe recovery needs identified during the PDNA process are not presently linked to the availability of, or the process by which to pursue recovery funding; they were established through the sectoral analysis. Given the number of needs identified and the limited resources available, a key step will be to prioritize which sectors receive funding. This strategic prioritization will require rigorous vetting, based on clear criteria and parameters, such as:
• potentialfordirectandwidesthumanitarianimpact;
• potentialtogeneratesustainablelivelihoods;
• inclusive(pro-poorandpro-vulnerablestrategies);
• balancebetweenpublicandprivatesectorrecovery;and
• restorationandrebuildingofcriticalinfrastructureandservices.
Additionally, prioritization should be linked to the Joint National Action Plan for Climate Change and Disaster Risk Management (JNAP), which sets general national priorities for risk management and can provide a foundation for recovery efforts.
In implementing recovery activities, a detailed sectoral implementation plan and monitoring framework will be required to achieve the recommendations and to assess progress. This should include a review of results after one year, possibly based on the QLI, to reassess strategies, policy options and activities if needed. The results should then be incorporated into the National Strategic Plan to guide the programmatic approach, planning, implementation and monitoring of the medium- and long-term recovery and rehabilitation efforts.
Republic of the Marshall Islands Republic of the Marshall Islands
Post Disaster Needs Assessment of the 2015-2016 Drought | ExEcutivE Summary Post Disaster Needs Assessment of the 2015-2016 Drought | Executive Summary
INTRODUCTION
1
13

Republic of the Marshall Islands 14 Republic of the Marshall Islands
Post Disaster Needs Assessment of the 2015-2016 Drought | iNtrODuctiON
1.1 Overview of the 2015–2016 drought in Marshall IslandsHistorically, the Republic of the Marshall Islands (RMI) has faced challenges in accessing enough water on its low lying atolls for the increasing population. Conventional water supplies rely on rainwater harvesting and access to lens water, although these supplies may also be supplemented by desalination units and/or imported water.
During 2015 and 2016, extremely low precipitation and an especially intense El Niño Southern Oscillation (ENSO) resulted in a severe drought. According to the National Oceanic and Atmospheric Administration (NOAA): “All locations across the Marshall Islands are in a severe or extreme drought” and “one of the strongest El Niño events in recorded history remains entrenched across the equatorial Pacific Ocean’’ (IOM 2016). By May 2016, 21,000 people – 1,257 households on the outer islands and 5,195 households in urban areas – were estimated to be affected by severe drought conditions (IOM 2016).
A one-month State of Drought Emergency was declared by the Government of RMI on 3 February 2016. This was subsequently elevated to a State of Disaster on 10 March and extended twice after this. On 27 April 2016, U.S. President Barack Obama declared the drought a disaster for Marshall Islands. More information on the RMI drought and droughts in general can be found in Annex 1.
1.2 Socio-economic context of RMILike many other Pacific small island developing states, RMI development faces a number of social and economic challenges. Geographically isolated, with limited natural resources, families have limited economic opportunities. The government is the largest employer, supporting around a third of the workforce, while economic earnings are based mainly on payments from USA under the terms of the amended Compact of Free Association (US State Department 2003). Direct USA aid is also significant, accounting for 60% of the Marshall Islands’ budget. This income to the country is, however, likely to change substantially when the Compact of Free Association ends in 2023.
Apart from these prime sources, fishing, copra production and handicrafts provide small but important sources of income for the country. Additionally, subsistence production is valuable for maintaining well-being, with fishing, breadfruit, banana, taro, and pandanus production on some islands supplementing heavy importation of food.
Socially, the country faces challenges. First, changing aspirations and practices have contributed to the loss of some traditional skills and practices. The population of the country has grown substantially in the last few decades, and there has been rapid urbanization of key centers, such as Majuro and Ebeye, as families on outer islands pursue access to facilities and paid jobs. Problems observed in the country include increasing crime, domestic violence, unemployment, malnourishment, and substance abuse (Ahmad and Weiser 2006: 28).
1.3 Response from the government and development partnersGovernment response to the drought was coordinated through national clusters and led by government ministries and departments:
• HealthandNutrition;
• Water,SanitationandHygiene(WASH);
• Education;
• SafetyandProtection;
• Shelter;
• PublicWorksandUtilities;
• Logistics;
• FoodSecurityandAgriculture;and
• Communication.

Republic of the Marshall Islands 15Republic of the Marshall Islands
Post Disaster Needs Assessment of the 2015-2016 Drought | iNtrODuctiON Post Disaster Needs Assessment of the 2015-2016 Drought | iNtrODuctiON
The government provided relief to communities by supplying water (to all affected islands) and food supplies (to outer islands) as well as medical and other relief. The international community supported RMI by providing advice, a technical assessment, and critical items (such as water tanks and desalination units) as well as financial assistance. Notably, the US government provided a team of experts to assess the effects of the event, resulting in the endorsement of the drought status by the US government.
To assess the socio-economic impact of the drought, and assist in mobilizing the resources needed for recovery, the government requested that a post-disaster needs assessment (PDNA) be conducted. The assessment was supported by the Pacific Community (SPC), the United Nations, the European Union and the World Bank, as well as other bilateral partners.
The administration of the government of RMI is small and conducting a ’full’ PDNA was considered likely be a challenge for agencies already working to support sectors and communities affected by the drought. As a result, a rapid socio-economic assessment was conducted, rather than a comprehensive PDNA. This assessment will form the basis of the drought recovery strategy to be managed by the government, and will guide recovery in key sectors affected by the drought.
While PDNAs have been conducted for droughts in other parts of the world, such as Africa, this assessment is the first PDNA of a drought in the Pacific. As well as providing specific policy guidance and planning information for RMI, it also represents a considerable learning exercise for other drought-affected countries in the Pacific region.
1.4 Post-disaster needs assessment methodologyA PDNA analyzes disaster effects and impacts for the purpose of identifying recovery needs, as they are understood from human, socio-cultural, economic and environmental perspectives. A unique aspect of a PDNA is that it is led and owned by the government of the affected country but is assisted by a multi-disciplinary, multi-agency team. In this instance, the PDNA team included the UN agencies led by UNDP, SPC and other relevant stakeholders. The assessment methodology used is based on PDNA guidelines (GFDRR 2013), and has three main elements: assessment of disaster effects, assessment of disaster impact, recovery strategy and needs, and in the case of RMI an assessment of the impacts on the quality of life.
Assessment of disaster effectsUnder the PDNA methodology, assessment of the disaster effects is based on a bottom-up approach, capturing information about the effects of the event sector by sector. It aggregates the data to determine the event’s total effects on society and the economy. Assessment of disaster effects is based on the quantification of damage and losses.
• Damage to infrastructure and physical assets is the quantification of public and private sectorinfrastructure and assets, either totally or partially destroyed by the disaster.
• Lossesaredefinedasthedisruptionoftheproductionofandaccesstogoodsandservices,andincludeboth production decline and higher production costs. Losses occur until full economic recovery is achieved, which can, in some cases, take several years. Typical losses include the decline in output in productive sectors (such as agriculture and commerce), as well as the decline in delivery of basic services (such as education, health, electricity, water and sanitation).
Assessment of disaster impactWithin the PDNA methodology, disaster impact is defined as the consequences of drought effects on economic and social development. Therefore, drought impact is measured at the macro-economic, macro-social and household levels.
• Theeconomicimpactatthemacrolevelincludesestimationofthedrought’slikelyeffectsoneconomicperformance and the temporary macro-economic imbalances that may arise from the disaster in the external and fiscal sectors of the economy.
• Thesocialandhouseholdimpactincludesimpactsofthedroughtonhouseholdandcommunitylivelihoodsand employment, as well as gender-specific impacts.

Republic of the Marshall Islands 16 Republic of the Marshall Islands Republic of the Marshall Islands
Post Disaster Needs Assessment of the 2015-2016 Drought | iNtrODuctiON
Assessment of quality of lifeThe drought has not only had a negative impact on the national economy, it has also caused a decline in the quality of life and well-being of affected households and communities. Existing sectoral baseline information and the estimated value of the main disaster effects were used to estimate sectoral indicators that define quality of life. The quality of life index is a composite index conceived to:
• comprehensivelyandquantitativelymeasurethedrought’simpactonqualityoflifethroughasetofkeysocio-economic indicators;
• identifythegeographicallocationanddemographiccharacteristicsofthepopulationsmostaffectedinorder to assist decision-makers in prioritizing and targeting prospective recovery interventions; and
• provideareadilyavailablepost-droughtbaselinethatwillenablenationalauthoritiesandinternationalpartners to periodically monitor the improvement (or indeed further deterioration) of the quality of life during the recovery process.
The quality of life index is composed of several equally weighted indicators that are assessed prior to the disaster, immediately after the disaster, and periodically during the recovery process (see Figure 1).
The composite quality of life index derived for the drought focuses on recovery priorities in several ways.
It provides a measure of negative disaster impacts on the affected population’s living conditions, shows the impact’s geographical distribution, and provides a quantitative means to measure progress in achieving recovery over time. The quality of life index may be re-evaluated periodically to determine progress in achieving
Figure 1: Quality of life weighted indicatorsSource: Roberto Jovel
Quality of LifeIndex
Number of patients treated
in hospital
per capita GDPper person
Number of houses available
Number of households
connected to electricity
grid
Number of attended school
days
Number of households
connected to collective water
supply and sanitation
systems
Republic of the Marshall Islands

Republic of the Marshall Islands 17Republic of the Marshall Islands Republic of the Marshall Islands
Post Disaster Needs Assessment of the 2015-2016 Drought | iNtrODuctiON Post Disaster Needs Assessment of the 2015-2016 Drought | Executive Summary
recovery.
Republic of the Marshall Islands
Post Disaster Needs Assessment of the 2015-2016 Drought | Executive Summary
MACRO-ECONOMIC IMPACT
2
17

Republic of the Marshall Islands 18 Republic of the Marshall Islands
Post Disaster Needs Assessment of the 2015-2016 Drought | macrO-EcONOmic imPact
The drought was expected to induce a negative impact on the macro-economic performance of the country. To ascertain the degree of such impact, use was made of the estimated effects of the drought as measured at sectorial level. Once these sectorial effects were aggregated and examined, to eliminate possible double accountings and/or possible gaps in information, they were used as inputs to analyze resulting macro-economic performance. Examinations are made of the possible negative impact of the drought effects on the growth of the gross domestic product (GDP), the fiscal position and the balance of payments.
2.1 Recent macro-economic performanceBetween FY 2010 and FY 2013 the RMI economy performed relatively well, growing at annual rates around 3.3%. Fishery was the sector responsible for the main growth. In FY 2014, however, the economy experienced a downturn due to poor performance of the manufacturing, construction, and tax collections, and GDP growth was -0.9%. In FY 2015 the economy again turned into a positive, growing by an estimated 0.6%, a welcome change over the previous year’s performance. This recent growth was led by education and financial intermediation, while fishery and construction remained nearly stagnant, and wholesale and retail trade declined. Inflation declined by 2.2%, due to the large reduction in international oil prices.10
There is evidence that the fiscal outturn was positive in FY 2015, with a positive fiscal surplus equivalent to 2.9% of GDP. This resulted from a 6% increase in tax revenues, and a containment of expenditures. With regard to the latter, payroll costs grew by 1.4% only, the use of goods and services declined by 0.8%, subsidies to state-owned enterprises increased by USD 5.6 million, and transfers to government agencies rose by USD 1.5 million.
The International Monetary Fund estimates that GDP would grow by 1.4% in FY 2016.11
The historical and forecasted performance of GDP for Marshall Islands is shown in Figure 2.
10 See Fiscal Year 2015 Economic Review, Preliminary Review, Economic Monitoring and Analysis Program, August 2016.11 See Staff Report for the 2016 Article IV Consultation, Republic of the Marshall Islands, International Monetary Fund, 7 July
2016.
28
Figure 2: GDP performance in Marshall Islands FY 2012 to FY 2016 Source: Estimations of the assessment team using official information Estimated impact of the drought Impact on GDP. In order to ascertain the isolated macro-‐economic impact of the drought, the values of production flow changes (production decline, production increase and higher costs of production) were classified as having either negative or positive signs, before they could be compared to the forecasted value of GDP for FY 2016, as shown in Table 1. These values, expressed in gross output nominal terms, were converted into value-‐added by applying the available value-‐added/gross output coefficients. For inserting into the forecasted value of GDP, production decline values were assigned a negative sign, and higher production values were given a positive sign. The higher production costs shown in Table 1 constitute in fact intermediate consumption; they were transferred to the sectors where they would be produced, and would have a positive sign. These values were first obtained in nominal terms and later on converted into real terms. It was found that, as a result of the drought, GDP growth in FY 2016 – rather than being 1.4% –would be only 1.0% (See Figure 2). In other words, the impact of the drought would reduce forecasted GDP growth by about one third. Other factors, unrelated to the drought, may modify such expected drought-‐induced performance before FY 2016 ends.12
12 The higher-‐than-‐normal purchases and processing of copra, which are not drought-‐related, may in fact induce a higher growth of GDP.
-‐2.0
-‐1.0
0.0
1.0
2.0
3.0
4.0
FY2012 FY2013 FY2014 FY2015 FY2016 Ann
ual G
DP
Gro
wth
, %
Actual growth Growth forecast
Sailesh Sen 2/27/2017 9:11 AMFormatted: Font:Not Bold
Sailesh Sen 2/27/2017 9:11 AMFormatted: Font:Not Bold, Not Italic
Sailesh Sen 2/27/2017 9:10 AMDeleted: Table 1Sailesh Sen 2/27/2017 9:11 AMFormatted: Font:Not Bold
Sailesh Sen 2/27/2017 9:11 AMFormatted: Font:Not Bold, Not Italic
Sailesh Sen 2/27/2017 9:10 AMDeleted: Table 1
Figure 2: GDP performance in Marshall Islands FY 2012 to FY 2016
Source: Estimations of the assessment team using official information
Estimated impact of the droughtImpact on GDP. In order to ascertain the isolated macro-economic impact of the drought, the values of production flow changes (production decline, production increase and higher costs of production) were classified as having either negative or positive signs, before they could be compared to the forecasted value of GDP for FY 2016, as shown in Table 1. These values, expressed in gross output nominal terms, were converted into value-added by applying the available value-added/gross output coefficients.

Republic of the Marshall Islands 19Republic of the Marshall Islands
Post Disaster Needs Assessment of the 2015-2016 Drought | macrO-EcONOmic imPact Post Disaster Needs Assessment of the 2015-2016 Drought | macrO-EcONOmic imPact
12 The higher-than-normal purchases and processing of copra, which are not drought-related, may in fact induce a higher growth of GDP.
For inserting into the forecasted value of GDP, production decline values were assigned a negative sign, and higher production values were given a positive sign. The higher production costs shown in Table 1 constitute in fact intermediate consumption; they were transferred to the sectors where they would be produced, and would have a positive sign. These values were first obtained in nominal terms and later on converted into real terms.
It was found that, as a result of the drought, GDP growth in FY 2016 – rather than being 1.4% –would be only 1.0% (See Figure 2). In other words, the impact of the drought would reduce forecasted GDP growth by about one third. Other factors, unrelated to the drought, may modify such expected drought-induced performance before FY 2016 ends.12
Table 1: Classification of production flow changes arising from the FY 2016 drought (USD thousand)
Production decline Production increase Higher production costs
Social
Health 137.9
Education 1,070.0
Productive
Agriculture 832.5
Livestock
Manufacturing 107.5
Commerce 245.4 11.5
infrastructure
Water and sanitation 162.4 733.0
Electricity 686.4
Transport
total 2,010.0 1,094.2 882.4
Source: Estimations by assessment team
Figure 3: Possible GDP performance, including isolated impact of drought in FY 2016
Source: Estimations by assessment team
Impact on fiscal budget. To ascertain the isolated impact of the drought on the government fiscal position, an analysis was made to estimate higher or lower tax revenues arising from the drought-induced changes in production flows in the sectors of industry, commerce, electricity and sanitation. In addition, the changes or increases in expenditure arising from meeting the urgent relief needs met through the Disaster Management Office were assessed.

Republic of the Marshall Islands 20 Republic of the Marshall Islands
Post Disaster Needs Assessment of the 2015-2016 Drought | macrO-EcONOmic imPact
The data for FY 2016 included in the Statement of Government Operations FY 2010–FY 2021 prepared by the International Monetary Fund was used as a baseline for comparison to the drought-induced changes in tax revenues and expenditures. Table 2 shows the results of such comparisons.
Table 2: Classification of production flow changes arising from the FY 2016 drought (USD)
No drought after drought
million uSD uSD million uSD
revenues 124.6 124.57
Tax revenues 31.3 29,600 31.27
Grants 70.0 70.00
Other revenues 23.3 23.30
Expenditures 103.3 678,890 103.98
Net operating balance 21.2 20.59
Source: Estimations by assessment team
In brief, the drought would induce slight modifications to the fiscal sector in FY 2016. An increase in tax revenues and an increase in government relief-related expenditures would produce a decline in the net operating balance, from a forecasted value of USD 21.2 million to an after-drought value of USD 20.6 million.
Impact on balance of payments. The only drought-induced impact on RMI’s balance of payment refers to an increase in fuel imports – USD 198,400 – required to produce the higher electricity consumption of the residential sector. It is understood that food imports for relief were funded by international donations and would not affect the balance of payments.
Summarizing, the isolated macro-economic impact of the drought may be considered as moderate, while the social impact, especially at the household level, would be very high, as would be described in the Employment, Livelihoods and Social Impact chapter of this report.
Republic of the Marshall Islands Republic of the Marshall Islands
Post Disaster Needs Assessment of the 2015-2016 Drought | macrO-EcONOmic imPact
PRODUCTIVE SECTORS
21

Republic of the Marshall Islands Republic of the Marshall Islands Republic of the Marshall Islands
Post Disaster Needs Assessment of the 2015-2016 Drought | Executive Summary
Republic of the Marshall Islands
Post Disaster Needs Assessment of the 2015-2016 Drought | Executive Summary
22

Republic of the Marshall Islands 23Republic of the Marshall Islands Republic of the Marshall Islands
Post Disaster Needs Assessment of the 2015-2016 Drought | Executive Summary Post Disaster Needs Assessment of the 2015-2016 Drought | Executive Summary
Republic of the Marshall Islands
Post Disaster Needs Assessment of the 2015-2016 Drought | Executive Summary
CROPS AND LIVESTOCK
3
23

Republic of the Marshall Islands 24 Republic of the Marshall Islands
Post Disaster Needs Assessment of the 2015-2016 Drought | crOPS aND LivEStOcK
3.1 Sector background and pre-disaster situationAgriculture in Marshall Islands is predominantly subsistence-oriented. Less than half the total land area (70.05 square miles) is considered potentially agricultural. The amount of agricultural land available per rural household falls within the average range of 2.6 to 5.9 ha (6.4 to 14.6 acres) and an overall average of 3.8 hectares (9.4 acres). However, many holdings are fragmented over a number of atoll islands and access to the total area to which rights are held can be difficult (FAO 2000).
The traditional farming system is characterized by inter-cropping between coconuts and other tree/vegetable crops. The most common crops include coconut, breadfruit, banana, pandanus, pumpkin, taro and papaya. Kitchen gardening is practiced only in densely populated areas (Majuro and Ebeye) and in most of the high schools, encouraged by the Ministry of Resources and Development. Further gardening development is constrained by the damage caused by roaming livestock (pigs and chickens), limited existence of organic soils, lack of inputs and limited water. Livestock production in the country is at subsistence level. Households typically keep a few pigs and some local chickens, and occasionally ducks.
Breadfruit is the most widely available starch food, consumed when in season – from January to March and June to July – although some varieties can be harvested all year round. Traditional food preservation techniques are also very common (fermented breadfruit called bwiro and breadfruit leather called jāānkun), allowing consumption all year round. Pandanus produces fruits from January to March and production of eating and cooking banana varieties and pumpkins is very common. Production of taro and sweWet potato has decreased over the years, mostly due to increased access to and availability of imported staples (such as rice and noodles), which are more convenient to prepare and store. Arrowroot, the traditional staple of the atolls, is becoming less available over the years, mostly due to successive disasters such as cyclones and droughts.13
Agricultural production, although quite limited, does have a significant impact on the livelihood of people and the economy. Agriculture accounts for about 4% of GDP.14 Coconut plays a central role in the agriculture sector as the primary outer island cash income source (through copra sales), as a source of foreign exchange (through oil exports) and as an important food. The domestic market is very limited, which reduces opportunities for diversification or a drastic increase in production, processing and marketing. Cash income in the outer Islands is mostly derived from copra production for men and handicraft production for women. The under-exploited food production capacity and the high level of food import dependence in the country poses some significant challenges to national food security.
The national import bill is largely dominated by fuel, food and beverages, with food imports accounting for about 30% of the import bill in 2016 (GRMI 2015). The RMI economy runs a deep trade deficit, which is covered by inflows on income and transfer accounts, especially Compact grants15 and land-use payments associated with the US military base at Kwajalein Atoll.
3.2 Assessment of disaster effectsThe prolonged periods of drought during the period from November 2015 until May 2016 had adverse effects on the agricultural yield and productivity of the atolls. These effects varied, depending on the amount of rainfall received and monthly distribution patterns in the atolls. Breadfruit and pandanus production was affected during their main harvesting period (January to March). The production of other fruit trees, such as coconut, papaya, bananas, citrus and pumpkins, also suffered from the drought.
Damage and losses in production and income were assessed and estimated for the most affected crops. The assessment was based on the 2011 population census data on the agriculture sector and household characteristics pre-drought, with additional support of key sector experts and agriculture assessment reports (post disaster assessment report) conducted in Aur and Mili in January 2016, as well as rapid assessments conducted by the PDNA team in August 2016 in Arno, Mili, Ebeye and Likiep.
13 The impact of high winds during cyclones and water stress from prolonged drought periods has reduced the number of arrowroot plants. They were not replaced after these disasters, mostly due to new food habits among the young population and the attraction of imported food, such as rice and noodles, that are easier to prepare.
14 Econmap.org, US graduate school, 2015.15 Under the renewed Compact Agreement with USA, RMI will continue to receive annually declining grants averaging USD 45
million (26% of GDP as of FY 2012) until FY 2023. A Compact Trust Fund (CTF) is being built up to provide funding from FY 2024 onwards.

Republic of the Marshall Islands 25Republic of the Marshall Islands
Post Disaster Needs Assessment of the 2015-2016 Drought | crOPS aND LivEStOcK Post Disaster Needs Assessment of the 2015-2016 Drought | crOPS aND LivEStOcK
Estimation of costs was based on:
• post-droughtagriculturebaselineextractedfromthe2011populationcensus(numberoftreesperhousehold);
• theindividualislandpost-disasterassessmentreportsproducedbythegovernment;
• PDNAteams’on-the-groundestimatesfromfouratolls(Arno,Mili,Ebeye,Likiep);
• governmentandsectorexpertrepresentativeswhovisitedatollsduringthedrought;and
• aseasonalcropcalendar(seeAnnex2)andaboveaveragerainfall/temperaturedatawereusedinorderto cross-reference accuracy of the findings in terms of magnitude of production losses.
Key parameters for the estimates included:
• theaverageannualproductionfortreesandplantsforeachcroponeachatoll(seeAnnex3–baselinedata, based on the 2011 population census data on agriculture (number of fruit trees per household and number of households growing annual plants);
• thenumberoflivestockforeachatoll,basedonthe2011populationcensus;
• theestimatedlevelofreductioninproduction(%)foreachcroponeachatollfromassessmentandkeyexperts’ estimation;
• thecostoflossesfromlostanimals;and
• theestimatedvalueofeachcrop(USD/shortton)andlivestock(USD/animal).
3.3 Agriculture post-disaster assessmentCrop sub-sectorThere was no damage recorded in perennial crops, however, the drought affected the production of fruit trees and production decreased for four to six months, trees were able to recover from the drought stress.
Losses did occur, with the estimated loss in the crop sub-sector amounting to USD 1.77 million.16 The impact was felt mostly in the form of decreased production of fruit trees (breadfruit, pandanus, coconut, banana) and the reduction or complete loss of pumpkin production. The level of impact varied from atoll to atoll and with the type of crop (see Figure 4 and Annex 4: Drought impact on crops and livestock). Losses in production were recorded mostly during January to April 2016. Most of the drought impact occurred on perennial crops (91.1%) against 8.9% for annual crops: pumpkin, bananas and assorted vegetables in Kwajalein (see Figure 5). Total losses in production of subsistence crops amounted to 11.6% of annual expected production (see Annex 3: Baseline data and annual production estimates).
16 GDP estimates for agriculture in RMI are low. To date, estimation of the value of the sector has been based on historical production data dating back to 2002. Drawing on population census information, agricultural production has now been re-estimated as USD 15 million, compared to the published value of USD 4.2 million, which was based on historical figures.
Figure 4: Share of loss (%) in subsistence crops
Source: Estimations of the assessment team using official information
7%
1%
14%
8%
0%
1%
69%
PandanusPumpkinCoconutBananaLimePapayaBreadfruit
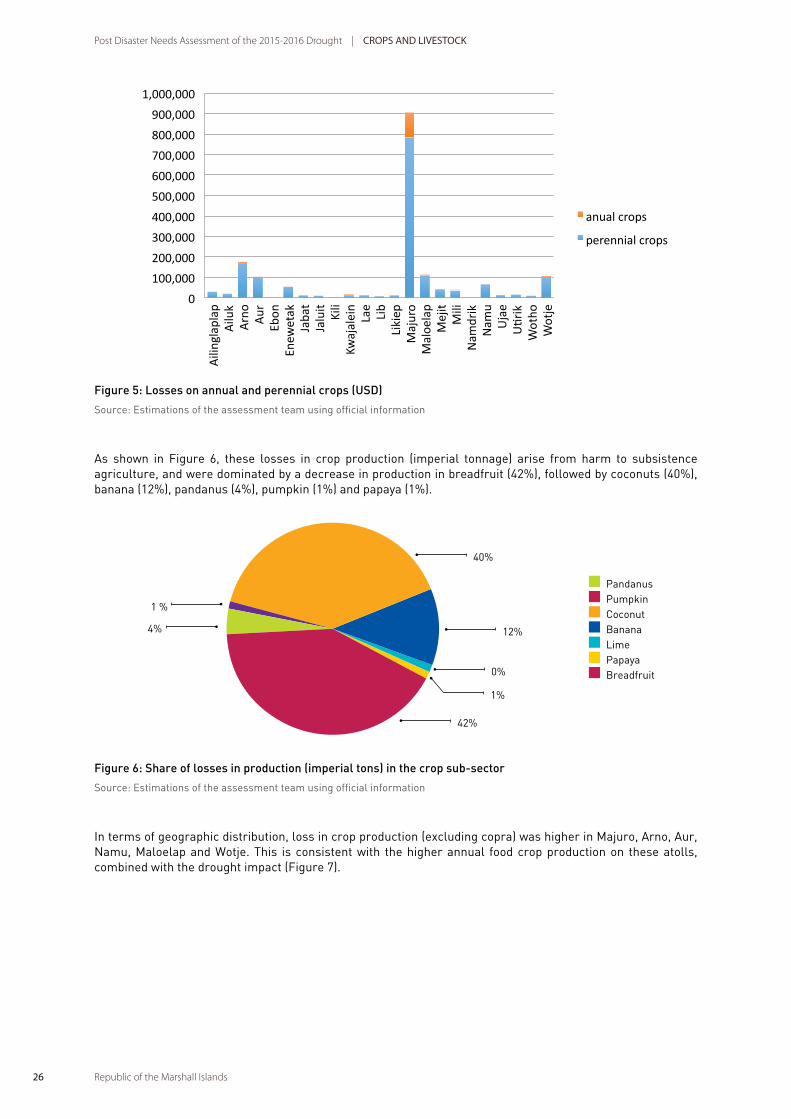
Republic of the Marshall Islands 26 Republic of the Marshall Islands
Post Disaster Needs Assessment of the 2015-2016 Drought | crOPS aND LivEStOcK
Figure 5: Losses on annual and perennial crops (USD)
Source: Estimations of the assessment team using official information
As shown in Figure 6, these losses in crop production (imperial tonnage) arise from harm to subsistence agriculture, and were dominated by a decrease in production in breadfruit (42%), followed by coconuts (40%), banana (12%), pandanus (4%), pumpkin (1%) and papaya (1%).
35
Figure 5: Losses on annual and perennial crops (USD) Source: Estimations of the assessment team using official information As shown in Figure 6, these losses in crop production (imperial tonnage) arise from harm to subsistence agriculture, and were dominated by a decrease in production in breadfruit (42%), followed by coconuts (40%), banana (12%), pandanus (4%), pumpkin (1%) and papaya (1%).
Figure 6: Share of losses in production (imperial tons) in the crop sub-‐sector Source: Estimations of the assessment team using official information In terms of geographic distribution, loss in crop production (excluding copra) was higher in Majuro, Arno, Aur, Namu, Maloelap and Wotje. This is consistent with the higher annual food crop production on these atolls, combined with the drought impact (Figure 7).
0
100,000
200,000
300,000
400,000
500,000
600,000
700,000
800,000
900,000
1,000,000
Aili
ngla
plap
Ailu
k Arn
o Aur
Eb
on
Enew
etak
Ja
bat
Jalu
it Ki
li Kw
ajal
ein
Lae
Lib
Liki
ep
Maj
uro
Mal
oela
p M
ejit
Mili
N
amdr
ik
Nam
u U
jae
URr
ik
Wot
ho
Wot
je
anual crops
perennial crops
Banana 12%
Lime 0% Papaya
1%
Breadfruit 42%
Pandanus 4%
Pumpkin 1%
Coconut 40%
Figure 6: Share of losses in production (imperial tons) in the crop sub-sector
Source: Estimations of the assessment team using official information
In terms of geographic distribution, loss in crop production (excluding copra) was higher in Majuro, Arno, Aur, Namu, Maloelap and Wotje. This is consistent with the higher annual food crop production on these atolls, combined with the drought impact (Figure 7).
40%
0%
42%
12%
1%
1 %
4%
PandanusPumpkinCoconutBananaLimePapayaBreadfruit

Republic of the Marshall Islands 27Republic of the Marshall Islands
Post Disaster Needs Assessment of the 2015-2016 Drought | crOPS aND LivEStOcK Post Disaster Needs Assessment of the 2015-2016 Drought | crOPS aND LivEStOcK
36
Figure 7: Share of cross losses (USD) between atolls (excluding copra) Source: Estimations of the assessment team using official information
Figure 8: Number of fruit trees per atoll Source: Population census 2011 Livestock sub-‐sector The estimated damage to the livestock sub-‐sector was USD 9,096 (seeTable 3). Only on a few atolls (Aur, Lae, Likiep and Maloelap) did animals die from the drought.
0
200 000
400 000
600 000
800 000
1000 000
1200 000
Aili
ngla
plap
Ailu
k
Arn
o
Aur
Ebon
Enew
etak
Jaba
t
Jalu
it
Kili
Kwaj
alei
n
Lae
Lib
Liki
ep
Maj
uro
Mal
oela
p
Mej
it
Mili
Nam
drik
Nam
u
Uja
e
URr
ik
Wot
ho
Wot
je
Losses
0
5,000
10,000
15,000
20,000
25,000
30,000
35,000
Aili
ngla
plap
Ailu
k
Arn
o
Aur
Ebon
Enew
etak
Jaba
t
Jalu
it
Kili
Kwaj
alei
n
Lae
Lib
Liki
ep
Maj
uro
Mal
oela
p
Mej
it
Mili
Nam
drik
Nam
u
Uja
e
URr
ik
Wot
ho
Wot
je
Banana
Lime
Papaya
Breadfruit
Coconut
Pandanus
Sailesh Sen 2/27/2017 9:11 AMFormatted: Font:Not Bold
Sailesh Sen 2/27/2017 9:11 AMFormatted: Font:Not Bold, Not Italic
Sailesh Sen 2/27/2017 9:10 AMDeleted: Table 3
Figure 7: Share of cross losses (USD) between atolls (excluding copra)
Source: Estimations of the assessment team using official information
Figure 8: Number of fruit trees per atoll
Source: Population census 2011
Livestock sub-sectorThe estimated damage to the livestock sub-sector was USD 9,096 (seeTable 3). Only on a few atolls (Aur, Lae, Likiep and Maloelap) did animals die from the drought.
Table 3: Damage and loss in the agriculture sector (loss in crop and damage in livestock sub-sector) (USD)
Sub-sector Loss Damage Private
agriculture 1 772 586 1 772 586
Livestock 9 096 9 096
Sector total 1 772 586 9 096 1 781 682
Source: Estimations of the assessment team using official information
36
Figure 7: Share of cross losses (USD) between atolls (excluding copra) Source: Estimations of the assessment team using official information
Figure 8: Number of fruit trees per atoll Source: Population census 2011 Livestock sub-‐sector The estimated damage to the livestock sub-‐sector was USD 9,096 (seeTable 3). Only on a few atolls (Aur, Lae, Likiep and Maloelap) did animals die from the drought.
0
200 000
400 000
600 000
800 000
1000 000
1200 000
Aili
ngla
plap
Ailu
k
Arn
o
Aur
Ebon
Enew
etak
Jaba
t
Jalu
it
Kili
Kwaj
alei
n
Lae
Lib
Liki
ep
Maj
uro
Mal
oela
p
Mej
it
Mili
Nam
drik
Nam
u
Uja
e
URr
ik
Wot
ho
Wot
je
Losses
0
5,000
10,000
15,000
20,000
25,000
30,000
35,000
Aili
ngla
plap
Ailu
k
Arn
o
Aur
Ebon
Enew
etak
Jaba
t
Jalu
it
Kili
Kwaj
alei
n
Lae
Lib
Liki
ep
Maj
uro
Mal
oela
p
Mej
it
Mili
Nam
drik
Nam
u
Uja
e
URr
ik
Wot
ho
Wot
je
Banana
Lime
Papaya
Breadfruit
Coconut
Pandanus
Sailesh Sen 2/27/2017 9:11 AMFormatted: Font:Not Bold
Sailesh Sen 2/27/2017 9:11 AMFormatted: Font:Not Bold, Not Italic
Sailesh Sen 2/27/2017 9:10 AMDeleted: Table 3
CoconutBananaLimePapayaBreadfruit
Pandanus

Republic of the Marshall Islands 28 Republic of the Marshall Islands
Post Disaster Needs Assessment of the 2015-2016 Drought | crOPS aND LivEStOcK
Total costsThe estimated total loss to the agricultural sector, excluding copra for which no accurate data were available, was USD 1.8 million (Table 4).
Table 4: Summary of the damage and loss in the agriculture (crop and livestock) sector by atoll (USD)
atoll Loss Damage Private
ailinglaplap 29,824 29,824
ailuk 21,133 21,133
arno 175,953 175,953
aur 102,540 2,018 104,558
Ebon 0 0
Enewetak 53,523 53,523
Jabat 12,863 12,863
Jaluit 10 428 10,428
Kili 2,073 2,073
Kwajalein 16,597 16,597
Lae 12,492 362 12,854
Lib 7,603 7,603
Likiep 13 187 676 13,863
majuro 905,056 905,056
maloelap 113,467 6,040 119,507
mejit 45,662 45,662
mili 39,652 39,652
Namdrik 0 0
Namu 65,522 65,522
ujae 13,863 13,863
utrik 15,542 15,542
Wotho 9,578 9,578
Wotje 106,029 106,029
total 1,748,972 9,096 1,781,683
Source: Estimations of the assessment team using official information
Social impact of damage and lossAside from US government-sponsored agriculture programs on four of the atolls affected by nuclear testing (Enewetak, Rongelap, Utrok, Bikini), support to agricultural development on other atolls is scarce. While some activities are gender-oriented (such as fishing for men, cooking for women), most agricultural responsibilities are shared – and even more so during times of hardship. The drought strongly affected all family members, as men spent more time fishing, and women and children looked for other food and water sources.
3.4 Recovery strategy and needsThe total monetary value of agricultural recovery needs for 2016 amounts to USD 1.4 million. Disaster risk reduction needs for FY 2017–2018 amount to USD 0.5 million.
The sector strategy for recovery includes immediate provision of food relief and dissemination (free distribution) of drought tolerant seeds/seedlings for four to six months for the most affected atolls.
The sector strategy for disaster risk reduction includes support to the Ministry of Resources and Development (MR&D) in: the production and dissemination of drought tolerant seeds/seedlings; training on the promotion of indigenous knowledge and innovative ideas for resilient agriculture techniques (intercropping, fruit tree

Republic of the Marshall Islands 29Republic of the Marshall Islands
Post Disaster Needs Assessment of the 2015-2016 Drought | crOPS aND LivEStOcK Post Disaster Needs Assessment of the 2015-2016 Drought | crOPS aND LivEStOcK
planting, integrated farming systems using permaculture techniques, food preservation); promotion of school gardening and kitchen gardens to improve diet diversification; dissemination and knowledge of compost-making techniques and resilience techniques against drought; gender-balanced research into traditional farming, harvesting, food preservation and integrated traditional agro-forestry practices; an income diversification programme; and development of quality crop and livestock baseline data.
Table 5: Recovery needs in the agricultural sector 2016–2017 (USD)
Program of activity value (uSD) responsible agency
Emergency intervention: food distribution in 25 atolls for 4 to 6 months depending of the level of drought impact of the atoll
1,297,901 GoRMI (USD 14 439), OFDA/IOM (USD 601 600), FNS (USD 451 200), ADB (USD 175 842), ROC (USD 54 820)
Seeds, seedlings, suckers, cuttings and other agricultural inputs and equipment for re-planting of crops
150,000 FAO/WUTMI, US Forestry, SPC: (6000USD breadfruit and pandanus seedlings ), MR&D, Pacific Resource for Education and Learning (PRELP)
tOtaL 1,447,901
Source: Estimations of the assessment team using official information
Table 6: Disaster risk reduction needs in the agriculture sector 2016-2017 (USD)
Program of activity value (uSD) responsible agency
Support promotion of indigenous knowledge and innovative ideas for resilient agriculture techniques (intercropping, fruit tree planting, integrated farming systems using permaculture techniques, food preservation) using Cull institutional knowledge for irradiated coral atoll soil remediation and rehabilitation techniques, in the 16 most affected (agriculture) atolls (Majuro, Aur, Wotje, Maloelap, Arno, Mili, Mejit, Jabot, Kwajalein, Likiep, Ailuk, Utrik, Wotho, Ujae, Lae and Enewetak)
100,000 MR&D, Local Government, Council of Iroj, Landowners, FAO, SPC, WUTMI, others partners
Support MR&D in production and dissemination (free distribution) of drought-tolerant crops, including coconut, drought-resilient breadfruit, sweet potatoes and taro varieties (kata), drought-tolerant fruit trees, e.g. fig (tebro), sea-almond, sea-grape, amaranth
100,000 MR&D, Local Government, Council of Iroj, Landowners, FAO, SPC, WUTMI,
Promotion of school gardening and kitchen gardens to improve diet diversification, dissemination and knowledge of compost-making techniques and resilience techniques against drought, including water conservation techniques (drip irrigation) and traditional storage techniques, in the 16 most affected atolls: Majuro, Aur, Wotje, Maloelap, Arno, Mili, Mejit, Jabot, Kwajalein, Likiep, Ailuk, Utrik, Wotho, Ujae, Lae and Enewetak
100,000 MR&D, College of the Marshall Island grant, PRELP, SPC, FAO
Support gender-balanced research into traditional farming, harvesting, food preservation and integrated traditional agro-forestry practices and an income diversification programme that would include an economic feasibility study for aquaculture production: giant clams, seaweeds, sea cucumber, lobster, pearls
80,000 MR&D, NGOs, WUTMI, SPC or FAO, Local Government, Landowners,
Support MR&D in developing quality crop and livestock baseline data 100,000 MR&D, EPPSO
tOtaL 2017–2018 480,000
GraND tOtaL Disaster risk reduction activities 1,927,901
Source: Estimations of the assessment team using official information

Republic of the Marshall Islands Republic of the Marshall Islands
Post Disaster Needs Assessment of the 2015-2016 Drought | Executive Summary
Republic of the Marshall Islands
Post Disaster Needs Assessment of the 2015-2016 Drought | Executive Summary
INDUSTRY AND COMMERCE
4
30
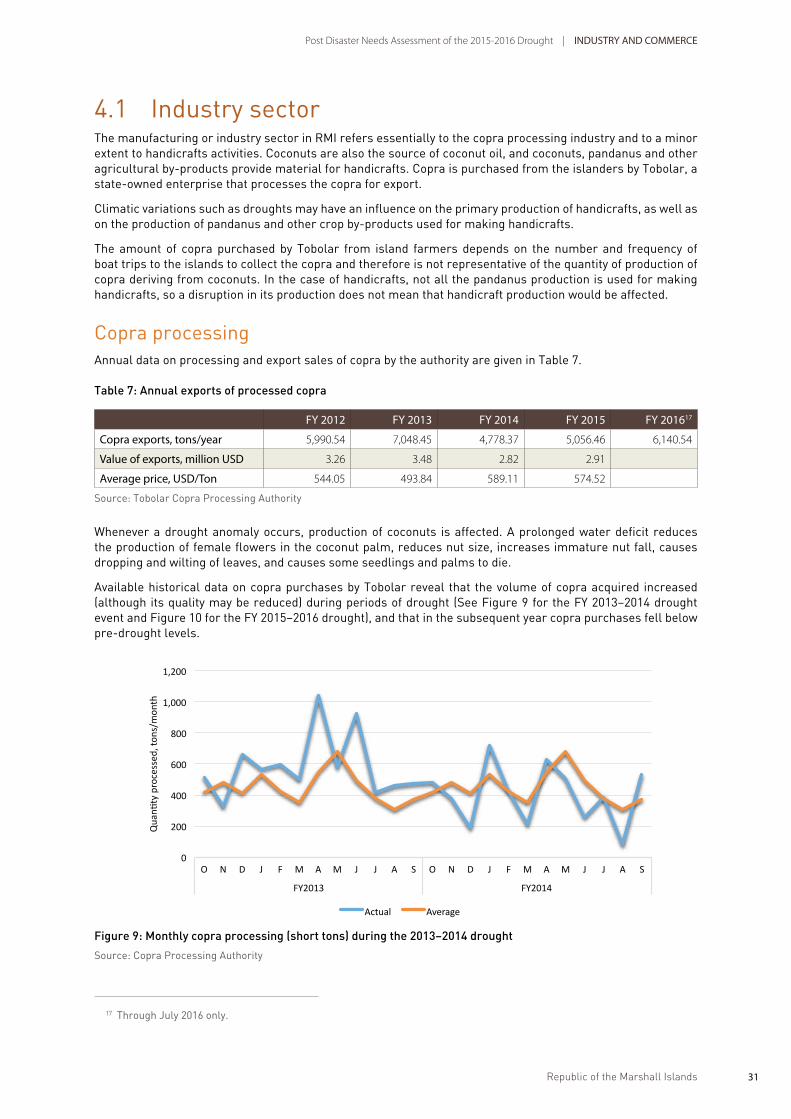
Republic of the Marshall Islands 31Republic of the Marshall Islands
Post Disaster Needs Assessment of the 2015-2016 Drought | Executive Summary Post Disaster Needs Assessment of the 2015-2016 Drought | iNDuStry aND cOmmErcE
4.1 Industry sectorThe manufacturing or industry sector in RMI refers essentially to the copra processing industry and to a minor extent to handicrafts activities. Coconuts are also the source of coconut oil, and coconuts, pandanus and other agricultural by-products provide material for handicrafts. Copra is purchased from the islanders by Tobolar, a state-owned enterprise that processes the copra for export.
Climatic variations such as droughts may have an influence on the primary production of handicrafts, as well as on the production of pandanus and other crop by-products used for making handicrafts.
The amount of copra purchased by Tobolar from island farmers depends on the number and frequency of boat trips to the islands to collect the copra and therefore is not representative of the quantity of production of copra deriving from coconuts. In the case of handicrafts, not all the pandanus production is used for making handicrafts, so a disruption in its production does not mean that handicraft production would be affected.
Copra processingAnnual data on processing and export sales of copra by the authority are given in Table 7.
Table 7: Annual exports of processed copra
Fy 2012 Fy 2013 Fy 2014 Fy 2015 Fy 201617
copra exports, tons/year 5,990.54 7,048.45 4,778.37 5,056.46 6,140.54
value of exports, million uSD 3.26 3.48 2.82 2.91
average price, uSD/ton 544.05 493.84 589.11 574.52
Source: Tobolar Copra Processing Authority
Whenever a drought anomaly occurs, production of coconuts is affected. A prolonged water deficit reduces the production of female flowers in the coconut palm, reduces nut size, increases immature nut fall, causes dropping and wilting of leaves, and causes some seedlings and palms to die.
Available historical data on copra purchases by Tobolar reveal that the volume of copra acquired increased (although its quality may be reduced) during periods of drought (See Figure 9 for the FY 2013–2014 drought event and Figure 10 for the FY 2015–2016 drought), and that in the subsequent year copra purchases fell below pre-drought levels.
40
Copra processing Annual data on processing and export sales of copra by the authority are given in Table 7. Table 7: Annual exports of processed copra
FY 2012 FY 2013 FY 2014 FY 2015 FY 201617 Copra exports, tons/year 5,990.54 7,048.45 4,778.37 5,056.46 6,140.54 Value of exports, million USD
3.26 3.48 2.82 2.91
Average price, USD/Ton 544.05 493.84 589.11 574.52 Source: Tobolar Copra Processing Authority Whenever a drought anomaly occurs, production of coconuts is affected. A prolonged water deficit reduces the production of female flowers in the coconut palm, reduces nut size, increases immature nut fall, causes dropping and wilting of leaves, and causes some seedlings and palms to die. Available historical data on copra purchases by Tobolar reveal that the volume of copra acquired increased (although its quality may be reduced) during periods of drought (See Figure 9 for the FY 2013–2014 drought event and Figure 10 for the FY 2015–2016 drought), and that in the subsequent year copra purchases fell below pre-‐drought levels.
Figure 9: Monthly copra processing (short tons) during the 2013–2014 drought Source: Copra Processing Authority
17 Through July 2016 only.
0
200
400
600
800
1,000
1,200
O N D J F M A M J J A S O N D J F M A M J J A S
FY2013 FY2014
Qua
nRty
pro
cess
ed, t
ons/
mon
th
Actual Average
Sailesh Sen 2/27/2017 9:11 AMFormatted: Font:Not Bold
Sailesh Sen 2/27/2017 9:11 AMFormatted: Font:Not Bold, Not Italic
Sailesh Sen 2/27/2017 9:10 AMDeleted: Table 7
Figure 9: Monthly copra processing (short tons) during the 2013–2014 drought
Source: Copra Processing Authority
17 Through July 2016 only.

Republic of the Marshall Islands 32 Republic of the Marshall Islands
Post Disaster Needs Assessment of the 2015-2016 Drought | iNDuStry aND cOmmErcE
Figure 10: Monthly copra processing (short tons) during the 2015-16 drought in the Marshall Islands
Source: Copra Processing Authority
This situation – which differs from the notion that coconut production should decline when faced by water deficits – is explained by the fact that the purchases of copra made by Tobolar are not a function of coconut availability but instead are governed by the frequency and number of trips made by boats to visit the islands and atolls to collect copra. The latter is, in turn, governed by the availability of Tobolar boats.
Because of those considerations, and the lack of sufficient information, it was concluded that it is not possible to identify and quantify the possible impact of the drought on copra processing.18 Nevertheless, it is noted that in FY 2016 purchases of copra have been above usual levels, which fact has resulted in the farmers who produce primary copra receiving higher incomes than in previous years, which is a welcome relief and perhaps partial compensation for the decline in food production that they are facing because of the drought.
HandicraftsIn order to estimate the negative impact of the FY 2016 drought on handicraft production, data were collected from a number of individuals and small enterprises that are active in this sub-sector of economic activity. Comparisons were made with the previous year’s volume or quantity of production to that prevailing during the first six months of calendar year 2016 in order to have an indication of the impact of the drought.
It was noted that not all the handicraft producers sustained production losses. In fact, two of the small enterprises that export their products abroad maintained their usual level of production and exports. This was made possible because they had stored raw materials before the start of the forthcoming drought upon learning of the El Niño forecasts in mid-2015.19
An analysis was made of the decline in the production of pandanus and other agricultural crops from which raw materials are used for making handicrafts. While not all such production is used to make handicrafts, the decline in production during the drought provided guidance on the availability of raw materials for this industry.
The decline in production by handicraft producers and entrepreneurs was compared to the value of added value and gross production available in RMI’s GDP information. It was estimated that this activity would lose a total of USD 107,500 in FY 2016 as a result of the drought, and that such losses would be spread out in all atolls and islands where these articles are produced.
41
Figure 10: Monthly copra processing (short tons) during the 2015-‐16 drought in the Marshall Islands Source: Copra Processing Authority This situation – which differs from the notion that coconut production should decline when faced by water deficits – is explained by the fact that the purchases of copra made by Tobolar are not a function of coconut availability but instead are governed by the frequency and number of trips made by boats to visit the islands and atolls to collect copra. The latter is, in turn, governed by the availability of Tobolar boats. Because of those considerations, and the lack of sufficient information, it was concluded that it is not possible to identify and quantify the possible impact of the drought on copra processing.18 Nevertheless, it is noted that in FY 2016 purchases of copra have been above usual levels, which fact has resulted in the farmers who produce primary copra receiving higher incomes than in previous years, which is a welcome relief and perhaps partial compensation for the decline in food production that they are facing because of the drought. Handicrafts In order to estimate the negative impact of the FY 2016 drought on handicraft production, data were collected from a number of individuals and small enterprises that are active in this sub-‐sector of economic activity. Comparisons were made with the previous year’s volume or quantity of production to that prevailing during the first six months of calendar year 2016 in order to have an indication of the impact of the drought. It was noted that not all the handicraft producers sustained production losses. In fact, two of the small enterprises that export their products abroad maintained their usual level of production and exports.
18 Furthermore, it was concluded that the data on copra purchases made by the Tobolar Copra Processing Authority could not be utilized as a measure of copra production in the agriculture sector.
0
200
400
600
800
1,000
1,200
O N D J F M A M J J A S O N D J F M A M J J A S
FY2015 FY2016
Qua
nRty
pro
cess
ed, t
ons/
mon
th
Actual Long term average
18 Furthermore, it was concluded that the data on copra purchases made by the Tobolar Copra Processing Authority could not be utilized as a measure of copra production in the agriculture sector.
19 This experience is the basis for recommending that adequate and timely use be made of El Niño forecasts in all sectors of social and economic activity in order to reduce the impact of bad weather.

Republic of the Marshall Islands 33Republic of the Marshall Islands
Post Disaster Needs Assessment of the 2015-2016 Drought | iNDuStry aND cOmmErcE Post Disaster Needs Assessment of the 2015-2016 Drought | iNDuStry aND cOmmErcE
4.2 Recovery needs – industry sectorEstimations were made of the working capital required for the handicraft producers to enable them to restore their pre-drought level of production, assuming that production of the raw materials would occur shortly. The amount of such working capital was estimated to range between 25 to 30% of individual producer’s output, and the total requirement was estimated at around USD 40,000, to be distributed among the islands and atolls.
The modality for ensuring the delivery of these resources to the producers would need to be defined, in view of the local customs and practices. Many of the producers are women who neither necessarily have access to formal credit nor financial literacy, and who may require some kind of micro-financing scheme and associated financial inclusion capacity strengthening.
Tobolar would be well placed to adjust shipping routes to ensure maximum collection of copra, and payment for it, in the most affected communities as per the Quality of Life Index decline (see Section 13). This would not require significant additional cost, yet it would significantly speed up recovery of those most affected by the drought.
4.3 Commerce sectorThe FY 2016 drought had some effects on the performance of the commerce sector.
Due to the decline in domestic food production by the farmers, it was necessary for the government – through the National Disaster Management Office – to acquire imported food through local market suppliers and distribute it to the affected populations. Furthermore, donations of food from abroad were added to the amount of local food purchases for distribution to all the affected people.
The insufficiency of rainwater caused by the drought, combined with the limited capacity of the water supply utilities, meant that the population resorted to drinking coconut water that could be obtained locally and to the purchase and consumption of bottled water and bottled fruit juice. This resulted in an increase in the sale of bottled water and fruit juice.
4.4 Drought effects – commerce sectorTo estimate the effects of the drought on the sector, information on the sale of bottled water and juice was collected from several vendors, who provided their data with a request for confidentiality. The vendors, who voluntarily participated in the survey, represent a sizable fraction of the market in this connection, so their results can be validly applied to the vendors.
It is to be noted that the performance in sales of each vendor varied over time. In the initial months of the drought, several vendors started selling these products at higher-than-usual monthly rates until their capacity was exceeded; after that some vendors resorted to increasing their capacity – by drilling water wells in their premises and/or importing water from abroad – and were able to supply the demand that other vendors were unable to meet. Figure 11 shows the time variation of bottled water sales from October 2015 to May 2016, and provides an overview of the performance of these sales during most of the drought. It may be noted that the demand for bottled water rose in January, and continued rising during February and March, and then started receding by April.
Using this sales information, together with the data on higher costs of operation for the commercial enterprises, it was estimated that the sale of bottled water and juice increased by USD 234,000 while at the same time the costs of operation increased by USD 11,500 during the entire period of the FY 2016 drought.

Republic of the Marshall Islands 34
Figure 11: Bottled water sales during the FY 2016 drought in Majuro
Source: Estimations by the assessment team on the basis of private vendor information
In addition to the above, the National Disaster Management Office purchased food locally for the operations and activities of the Emergency Operations Centre at a cost of USD 10,600.00. These purchases represent an unforeseen amount of sales for the commerce sector, which was exclusively due to the drought.
Therefore, the total effects of the FY 2016 drought for the commerce sector involve a higher value of sales in bottled water and juice for a total amount of USD 245,400, together with higher costs of operation for the vendors of USD 11,500 (Estimations by the assessment team on the basis of private vendor information).
4.4 Recovery needs – commerce sectorSince the above numbers represent an increase in sales of the sector, no activities of recovery are envisaged. The efforts that the private vendors made to meet the increased demand for bottled water and juice enabled them to overcome the impact of the drought with very limited costs, and these they absorbed without modifying the unit price of their products.
20.0
0.0
40.0
OCT NOV
2018 2016
DEC JAN FEB MAR APR MAY JUNEE
60.0
100.0
80.0
12 0.0
Valu
s of
bot
tled
wat
er s
ales
, tho
usan
d U
S$/m
onth
Post Disaster Needs Assessment of the 2015-2016 Drought | iNDuStry aND cOmmErcE
Republic of the Marshall Islands
SOCIAL SECTORS
35
Post Disaster Needs Assessment of the 2015-2016 Drought | iNDuStry aND cOmmErcE

Republic of the Marshall Islands 36 Republic of the Marshall Islands
Republic of the Marshall Islands 37Republic of the Marshall Islands
Post Disaster Needs Assessment of the 2015-2016 Drought | Executive Summary
Republic of the Marshall Islands
Post Disaster Needs Assessment of the 2015-2016 Drought | Executive Summary
HEALTH SECTOR
5
37

Republic of the Marshall Islands 38 Republic of the Marshall Islands
Post Disaster Needs Assessment of the 2015-2016 Drought | HEaLtH SEctOr
5.1 BackgroundThe changing climate and environmental conditions brought about by a drought often cause morbidity rates to increase and nutrition levels to decline, thereby negatively affecting human development and quality of life. The health sector has to address the increased health needs and mitigate risks, which means the cost of providing health services and nutrition supplementation to the affected population increases.
During droughts – in the absence or scarcity of suitable drinking water and because of rising and often-changing air temperatures – the incidence of diarrhea, conjunctivitis, scabies and influenza-like-illness usually increases, in particular among children. In addition, because of the decline in food availability caused by crop production decline, nutrition rates – especially in children and other vulnerable population groups such as pregnant and lactating women, or people with chronic diseases – may decline. These factors lead to increased levels of malnutrition and increased levels of morbidity and mortality.
The climatic changes caused by the El Niño event resulted in a drought that caused a negative impact on the health of the affected population in RMI.
RMI approved its Hospital Preparedness Programme in 2016 and also has a Pandemic Influenza Response Plan (2005) and a Public Health Emergency Response Plan (2015), as well as a National Emergency Response Plan with a health component (2010).
Simulation exercises are held annually; last year a plane crash was simulated.
5.2 Estimation of drought effectsThe Ministry of Health has a regular program of health condition surveillance that involves collection of data on the number of patients treated or diagnosed with different kinds of disease. It also registers the number of children suffering from malnutrition. Using this information, which is collected on a weekly basis from all atolls/islands, it was possible to obtain a good diagnosis of the effects of the drought on the affected population. Analysis of such information, which was made available to the assessment team, enabled an estimation of the effects of the drought on the sector. The data, however, are not disaggregated enough to pick up the likely effects on pregnant women or the increased risks for people with chronic diseases who also require additional medical attention.
The surveillance information was available for the period from 2011 to mid-2016 for some of the main atolls and islands. In several of the outer islands, however, the record is incomplete as there are interruptions in the availability of data for many months at a time, resulting in information gaps for some of the years included in the period of analysis. Nevertheless, the available information enabled the team to conduct a full estimation of increases in the rates of morbidity and, together with information on unit treatment costs, an estimation of the higher costs of medical attention required by the affected population during the two drought events of FY 2013 and FY 2016, although with a different degree of accuracy.
47
The analysis involved a comparison of total cases of disease that occurred during the drought periods with the morbidity that prevailed during non-‐drought years. It was therefore possible to estimate the increase in the number of patients for each drought-‐related disease that were exclusively due to the drought events. While this is not an exact science, every effort was made to reduce errors, which included consultations between the sector assessment team and epidemiologist experts in the Ministry of Health.
Figure 12: Variation in the number of patients with conjunctivitis in Majuro, 2011 to 2016 Source: Estimations by the assessment team using official data from the Ministry of Health
Figure 13: Variation in the number of patients with scabies in Kwajalein, 2011 to 2016 Source: Estimations by the assessment team using official data from the Ministry of Health
0
50
100
150
200
250
300
350
400
M M J S N J M M J S N J M M J S N J M M J S N J M M J S N J M M J S N
2012 2013 2014 2015 2016
NU
MBE
R O
F CA
SES
PER
MO
NTH
0
5
10
15
20
25
30
35
S O N D J F M A M J J A S O N D J F M A M J J A S O N D J F M A M J J A S O N D J F M A M J J A S
FY2013 FY2014 FY2015 FY2016
NU
MBE
R O
F PA
TIEN
TS P
ER M
ON
TH
Figure 12: Variation in the number of patients with conjunctivitis in Majuro, 2011 to 2016Source: Estimations by the assessment team using official data from the Ministry of Health

Republic of the Marshall Islands 39Republic of the Marshall Islands
Post Disaster Needs Assessment of the 2015-2016 Drought | HEaLtH SEctOr Post Disaster Needs Assessment of the 2015-2016 Drought | HEaLtH SEctOr
The analysis involved a comparison of total cases of disease that occurred during the drought periods with the morbidity that prevailed during non-drought years. It was therefore possible to estimate the increase in the number of patients for each drought-related disease that were exclusively due to the drought events. While this is not an exact science, every effort was made to reduce errors, which included consultations between the sector assessment team and epidemiologist experts in the Ministry of Health.
47
The analysis involved a comparison of total cases of disease that occurred during the drought periods with the morbidity that prevailed during non-‐drought years. It was therefore possible to estimate the increase in the number of patients for each drought-‐related disease that were exclusively due to the drought events. While this is not an exact science, every effort was made to reduce errors, which included consultations between the sector assessment team and epidemiologist experts in the Ministry of Health.
Figure 12: Variation in the number of patients with conjunctivitis in Majuro, 2011 to 2016 Source: Estimations by the assessment team using official data from the Ministry of Health
Figure 13: Variation in the number of patients with scabies in Kwajalein, 2011 to 2016 Source: Estimations by the assessment team using official data from the Ministry of Health
0
50
100
150
200
250
300
350
400
M M J S N J M M J S N J M M J S N J M M J S N J M M J S N J M M J S N
2012 2013 2014 2015 2016
NU
MBE
R O
F CA
SES
PER
MO
NTH
0
5
10
15
20
25
30
35
S O N D J F M A M J J A S O N D J F M A M J J A S O N D J F M A M J J A S O N D J F M A M J J A S
FY2013 FY2014 FY2015 FY2016
NU
MBE
R O
F PA
TIEN
TS P
ER M
ON
TH
Figure 13: Variation in the number of patients with scabies in Kwajalein, 2011 to 2016
Source: Estimations by the assessment team using official data from the Ministry of Health
It was found that the drought conditions caused an increase in the number of cases of diarrhea – which may have arisen because of consumption of contaminated water – influenza-like-illness caused by changing air temperature, conjunctivitis and scabies. Examples of the variation in the number of patients with conjunctivitis and scabies during the period of analysis are shown in Figures 12 and 13, where a clear increase may be observed in Majuro and Kwajalein respectively. Similar analyses were made for all atolls/islands for the four diseases identified.
Estimations were made of the additional cost of health care – including medicines and attention by physician – given to the affected population by atoll/island, over and above the normal budget of the sector. Details of such costs in the FY 2016 drought are shown in Table 8, where it may be observed that these losses amounted to USD 137,900. In the case of the FY 2013 drought, however, the cost was estimated at USD 149,900, despite the fact that the event was of less intensity than the more recent one. Because of underestimating the increase in malnutrition among pregnant/lactating women, the number of children born with low birth weight, and the effects on people with chronic diseases (which cannot be currently established in all 54 health centers), actual losses for both droughts will likely be higher. Malnutrition is only identified when people visit a hospital or during (drought) disasters when medical staff conduct house-to-house consultations. This is done clinically, i.e. by visual examination, subjectively and objectively. Outer islands are not equipped to treat malnutrition, so a referral to one of the two country hospitals is the current course of action and a distinction between severe acute malnutrition (SAM) and moderate acute malnutrition (MAM) is therefore not made.
Table 8: Number of patients with drought-related diseases and treatment costs for the FY 2016 drought in Marshall Islands
Number of patients treatment cost, uSDDiarrhea influenza conjunctivitis Scabies
ailinglaplap 137 14 309 80 13,941
ailuk 45 29 53 7 3,346
arno 191 98 181 25 13,009
aur 5 63 1 191 4,492
Ebon 20 26 59 25 2,761

Republic of the Marshall Islands 40 Republic of the Marshall Islands
Post Disaster Needs Assessment of the 2015-2016 Drought | HEaLtH SEctOr
Number of patients treatment cost, uSDDiarrhea influenza conjunctivitis Scabies
Enewetak 75 116 27 - 4,529
Jabat 17 8 24 2 1,314
Jaluit 133 127 342 7 13,797
Kili 35 - 12 3 1,782
Kwajalein 175 336 419 133 17,616
Lae 52 33 93 14 4,648
Lib 18 2 18 - 1,148
Likiep 59 47 62 14 4,389
majuro 129 360 434 11 13,709
maloelap 90 86 97 40 7,219
mejit 8 19 45 8 1,574
mili 87 54 170 43 8,462
Namdrik 43 51 76 16 4,079
Namu 101 42 66 21 6,342
rongelap 55 24 43 - 3,381
ujae 17 - 12 10 1,166
utrik 27 7 15 2 1,538
Wotho 17 4 12 10 1,194
Wotje 29 45 35 10 2,468
total 1,565 1,591 2,605 672 137,904
Source: Estimations by the assessment team using official data from the Ministry of Health
In addition to the increase in morbidity, the Ministry of Health’s surveillance information revealed that the number of children with malnutrition has increased in several of the atolls/islands during the current year, in apparent response to the decline in domestic food production caused by the 2016 drought. The increase is clear in the cases of Majuro, Jaluit, Ailuk, Wotje and Ebon, as may be seen in Table 9. Data is not yet available for the case of Kwajalein; it is possible that when this information becomes available, that the magnitude of the problem may be increased. It is possible that in the coming months more cases may be detected, since the impact of the drought may not have shown completely by June 2016.
Table 9: Number of children with malnutrition in the first half of each calendar year for 2015 and 2016.
Number of cases
2015 2016
ailuk 0 3
Ebon 0 1
Jaluit 2 5
majuro 2 8
Wotje 0 2
total 4 19
Source: Ministry of Health.
5.3 Recovery needsThe cost of treatment of patients who developed disease because of the FY 2016 drought was met during the relief stage through government expenditure. However, the value of the medicines that were provided represents the value of medicines stock that must be replenished to ensure their availability in the near future. Thus, the recovery needs amount to a total of USD 242,052 (see Table 10).

Republic of the Marshall Islands 41Republic of the Marshall Islands
Post Disaster Needs Assessment of the 2015-2016 Drought | HEaLtH SEctOr Post Disaster Needs Assessment of the 2015-2016 Drought | HEaLtH SEctOr
In addition, a program for the treatment of malnutrition-affected children and increased monitoring should be considered as part of the recovery scheme, as effects may not become apparent for some months after June. It is worth noting that, after a referral of a child for malnutrition, the mother will receive a per diem as she will not be fed in the hospital and treatment can take from days to months. However, costs for per diems and medical evacuations have not been taken into account, as there is an option to start treating severe acute malnutrition (SAM) and moderate acute malnutrition (MAM) by affected communities (WHO 2007).
Table 10: Recovery needs (USD) in the health sector by atoll, 2017
Program of activity value (uSD) responsible agency
Annual outreach mobile visits (one doctor and some nurses) to visit each health centre (not taken this year because of the drought) with a focus on monitoring malnutrition
90,400 MOH
Replenishment of medicines and supplies in the hospitals and health centers and replenishment of laboratory reagents and supplies
108,852 MOH
Support community in SAM/MAM treatment, inclusive of treatment costs (SAM, MAM treatment medicinal cost estimated at USD 200 for 19 patients)
22,800 MOH
Community Health Education Program, adding a drought-specific edition 20,000 MOH
total 242,052
Source: Estimations of the assessment team using official information
Table 11: Disaster risk reduction – Development to make the system better (2017)
Program of activity value (uSD) responsible agency
Establishment of local health councils, training and simulation exercises planned
125,000 MOH
Capacity development, such as environmental health management training and enhancing health monitoring; outer islands communication; surveillance; segregated data (age, sex, etc.) generation, collection and management, and for warnings
74,075 MOH
Awareness programmes, e.g. newspapers, cell broadcasts, radio and TV 20,000 MoH, NDMO
Health communication system development, and repair of equipment and training of users in the current 8 Demand Assigned Multiple Access (DAMA) sites
436,000 MOH, planned and funded by USA
total 655,075
Source: Estimations of the assessment team using official information
Community Health Education ProgrammeThis activity supports ongoing education of communities in maintaining basic health and is aimed at improving public awareness about water and drought-related preventive health issues in all atolls.
Establishment of Local Health Councils Local Health Councils (LHCs), consisting of landlords, mayors, local health workers, and community leaders, existed 15–20 years ago on each of the outer island atolls. They were the focal point for health activities in the outer islands and performed an important coordination role but they folded up, mainly due to financial constraints. Mayors and their representatives at the RMI High Availability Disaster Recovery (HADR) Workshop on 8 July 2013 agreed to re-establish the councils. They would support strengthening overall community resilience by, among other roles: (a) enhancing communication of community health issues to RMI MOH; (b) facilitating local community engagement in health issues during the drought recovery period; (c) conducting initial health assessments; (d) facilitating community health education and response activities; and (e) conducting annual simulation exercises. The RMI Ministry of Health and the Marshall Islands Mayors’ Association will coordinate their re-establishment, including reaching agreement on relative roles, duties and responsibilities, including reporting to RMI Ministry of Health, within the context of local government administration provisions.

Republic of the Marshall Islands 42 Republic of the Marshall Islands Republic of the Marshall Islands
Post Disaster Needs Assessment of the 2015-2016 Drought | HEaLtH SEctOr
5.4 Health sector capacity developmentThis is to enhance environmental health by strengthening the capacity of atoll health staff to address drought-related diseases through: (a) improved environmental health management training, and (b) better surveillance, particularly in the use of geographical information systems (GIS).
Environmental health management trainingThis involves RMI Ministry of Health Majuro staff visiting all health centers for on-site training of health assistants on environmental health management.
Enhancing health monitoring, surveillance, data generationRMI Ministry of Health Majuro staff will visit all health centers for on-site training of health assistants on health monitoring and surveillance. This will include undertaking community rapid assessments, including use of the Center for Disease Control’s Community Assessment for Public Health Emergency Response (CASPER) toolkit, for health surveillance data generation. The ministry will develop a mechanism to share these data routinely with mayors, local government leaders and development partners.
Health communication system development This involves continuation of the installation of Demand Assigned Multiple Access (DAMA) sites in all health centres, the RMI National Telecommunications service that provides phone and internet service through a DAMA system. This will enhance the ability to transmit health information from the outer island health centers to RMI MOH in Majuro, thereby improving and increasing access to tele-communication systems for patient care and continued education for outer island community health centers.

Republic of the Marshall Islands 43Republic of the Marshall Islands Republic of the Marshall Islands
Post Disaster Needs Assessment of the 2015-2016 Drought | HEaLtH SEctOr Post Disaster Needs Assessment of the 2015-2016 Drought | Executive Summary
Republic of the Marshall Islands
Post Disaster Needs Assessment of the 2015-2016 Drought | Executive Summary
EDUCATION SECTOR
6
43

Republic of the Marshall Islands 44 Republic of the Marshall Islands
Post Disaster Needs Assessment of the 2015-2016 Drought | EDucatiON SEctOr
6.1 Drought and educationUnlike other disasters, drought does not bring about destruction of the physical, durable assets of the education sector. However, drought causes disruptions in the delivery of education that may alter the long-term future of students, resulting in a decline in their wellbeing and quality of life. Such disruptions are accounted as losses in the assessment for the education sector, and have a corresponding value in terms of production at the macro-economic level.
Thus, when analyzing the effects and impact of the FY 2013 and FY 2015 droughts, it is noted that there is no damage involved, as no school buildings, furniture, equipment and education materials were destroyed. Nevertheless, the amount and value of education that students received during each of those events declined because of interruptions or slowdowns in the delivery of education during the critical months of the droughts.
Data on enrolment and attendance of students was collected for the period 2011 to 2016 in order to enable the estimation of such losses in the education sector, as caused by the droughts.
6.2 Estimation of disaster effectsThe data provided by the public school system includes the number of enrolled students in all schools on all atolls and islands of the country. Furthermore, it provides information on attendance. This has enabled the development of Table 12, which shows number of students enrolled and their absenteeism for 2012 to 2015.
A comparison of absence rates between 2013 and 2012 and between 2015 and 2014 provided a snapshot of the possible effects of the 2013 and 2016 drought events. The islands and atolls where education was affected were thus identified for each event.
During the 2015 drought, absenteeism rates were higher in Majuro, where the rate rose by nearly 10%, reaching a high of 20.1%; in Lib the rate increased by 3.6 to reach a level of 10.6%; in Ailinglaplap the rate rose by 3% reaching a level of 6.3%. The rates for other affected islands and atolls were, in order of descending magnitude, Maloelap, Wotje, Likiep, Mili and Enewetak (see Table 12).
It was learned that the effects of the drought were more concentrated in elementary-level establishments, where absenteeism rates were highest, perhaps due to the higher vulnerability of small children to the lack of water, and/or to the higher concern of parents for same. This fact is supported by the information on the schools most affected by the droughts as, shown in Table 13 and 14.
Table 12: Enrolment and attendance information in the education sector, school years (SY) 2012, 2013, 2014 and 2015.
island/atoll Sy 2012 Sy 2013 Sy 2014 Sy 2015
# Students
absencerate, %
# Students
absencerate, %
# Students
absencerate, %
# Students
absencerate, %
ailinglaplap 600 2.34 593 3.49 541 3.26 551 6.27
ailuk 117 2.45 114 1.99 111 2.88 91 3.59
arno 705 4.31 657 7.62 604 4.69 549 5.11
aur 136 1.76 141 1.39 165 2.77 119 1.99
Ebon 202 0.59 199 0.90 199 1.07 201 0.92
Enewetak 210 5.19 210 6.35 151 6.01 211 6.90
Jabat 41 53.11 40 59.32 30 1.52 26 2.00
Jaluit 455 2.81 445 2.35 430 1.81 374 1.87
Kili 231 8.53 230 5.81 210 8.19 191 8.32
Kwajalein 1,594 9.73 1,769 13.30 1,603 10.10 1,479 8.16
Lae 118 1.68 115 1.99 113 1.67 104 2.11
Lib 55 5.06 46 2.41 51 7.04 47 10.60
Likiep 137 1.39 126 1.59 132 1.33 122 2.96
majuro 4,450 7.24 4,809 7.76 4,062 10.25 4,138 20.09
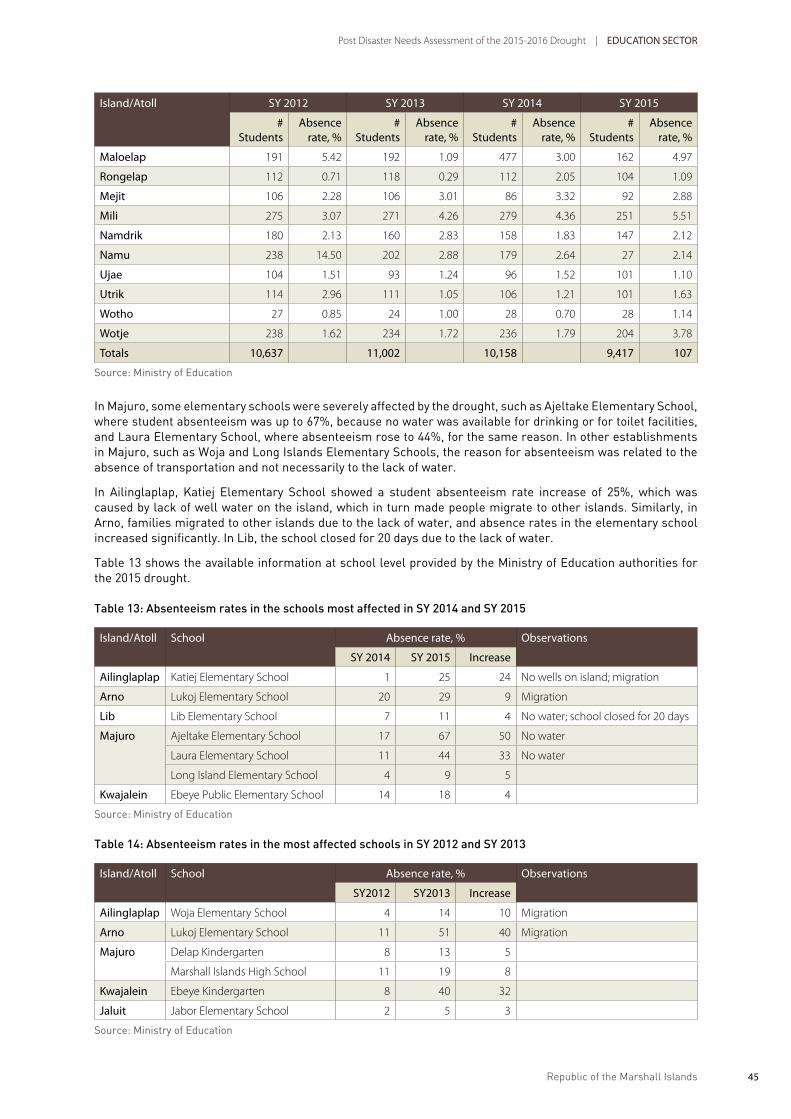
Republic of the Marshall Islands 45Republic of the Marshall Islands
Post Disaster Needs Assessment of the 2015-2016 Drought | EDucatiON SEctOr Post Disaster Needs Assessment of the 2015-2016 Drought | EDucatiON SEctOr
island/atoll Sy 2012 Sy 2013 Sy 2014 Sy 2015
# Students
absencerate, %
# Students
absencerate, %
# Students
absencerate, %
# Students
absencerate, %
maloelap 191 5.42 192 1.09 477 3.00 162 4.97
rongelap 112 0.71 118 0.29 112 2.05 104 1.09
mejit 106 2.28 106 3.01 86 3.32 92 2.88
mili 275 3.07 271 4.26 279 4.36 251 5.51
Namdrik 180 2.13 160 2.83 158 1.83 147 2.12
Namu 238 14.50 202 2.88 179 2.64 27 2.14
ujae 104 1.51 93 1.24 96 1.52 101 1.10
utrik 114 2.96 111 1.05 106 1.21 101 1.63
Wotho 27 0.85 24 1.00 28 0.70 28 1.14
Wotje 238 1.62 234 1.72 236 1.79 204 3.78
totals 10,637 11,002 10,158 9,417 107
Source: Ministry of Education
In Majuro, some elementary schools were severely affected by the drought, such as Ajeltake Elementary School, where student absenteeism was up to 67%, because no water was available for drinking or for toilet facilities, and Laura Elementary School, where absenteeism rose to 44%, for the same reason. In other establishments in Majuro, such as Woja and Long Islands Elementary Schools, the reason for absenteeism was related to the absence of transportation and not necessarily to the lack of water.
In Ailinglaplap, Katiej Elementary School showed a student absenteeism rate increase of 25%, which was caused by lack of well water on the island, which in turn made people migrate to other islands. Similarly, in Arno, families migrated to other islands due to the lack of water, and absence rates in the elementary school increased significantly. In Lib, the school closed for 20 days due to the lack of water.
Table 13 shows the available information at school level provided by the Ministry of Education authorities for the 2015 drought.
Table 13: Absenteeism rates in the schools most affected in SY 2014 and SY 2015
island/atoll School absence rate, % Observations
Sy 2014 Sy 2015 increase
ailinglaplap Katiej Elementary School 1 25 24 No wells on island; migration
arno Lukoj Elementary School 20 29 9 Migration
Lib Lib Elementary School 7 11 4 No water; school closed for 20 days
majuro Ajeltake Elementary School 17 67 50 No water
Laura Elementary School 11 44 33 No water
Long Island Elementary School 4 9 5
Kwajalein Ebeye Public Elementary School 14 18 4
Source: Ministry of Education
Table 14: Absenteeism rates in the most affected schools in SY 2012 and SY 2013
island/atoll School absence rate, % Observations
Sy2012 Sy2013 increase
ailinglaplap Woja Elementary School 4 14 10 Migration
arno Lukoj Elementary School 11 51 40 Migration
majuro Delap Kindergarten 8 13 5
Marshall Islands High School 11 19 8
Kwajalein Ebeye Kindergarten 8 40 32
Jaluit Jabor Elementary School 2 5 3
Source: Ministry of Education

Republic of the Marshall Islands 46 Republic of the Marshall Islands
Post Disaster Needs Assessment of the 2015-2016 Drought | EDucatiON SEctOr
During the 2013 drought, the increase in absenteeism rates were highest in Arno (from 11 to 51% in Lukoj Elementary School) as a result of families migrating to other islands due to lack of water. In Kwajalein the absence rate rose from 8 to 40% in Ebeye Kindergarten. In Ailinglaplap’s Woja Elementary School, the absence rate increased from 4 to 14%, possibly due to migration of families to other islands.
In Majuro, Delap Kindergarten and Marshall Islands High School showed increased absence rates due to lack of sufficient water, and in Jaluit, Jabor Elementary School also showed an increase in absenteeism rates (See Table 14).
Compared to the 2016 event, the drought in 2013 caused more diversified effects, with attendance decreasing in kindergarten and high school establishments, as well as elementary schools.
While it is difficult to estimate the cost of the loss of education provision that students sustained because of the droughts, and the value of future unearned income they would face because of such delay in completing their education, an attempt was made to quantify it. Use was made of the per capita value of education taken from national accounts, and this unit amount was applied to the absence rates caused by the drought in each atoll and island for which information was available. In brief, the estimated cost of such losses amounts to USD 0.2 and USD 1.7 million in the 2013 and 2016 droughts, respectively, which reflects the difference in severity of the two meteorological events. These estimated losses were apportioned to the affected islands and atolls on the basis of the observed absenteeism rates for each of the drought events, as shown in Table 15.
table 15: Geographical distribution of education losses for the 2013 and 2016 droughts
island/atoll Education losses, million uSD
2013 Drought 2016 Drought
ailinglaplap 0.003 0.021
ailuk 0.003
arno 0.003 0.020
aur 0.002
Ebon 0.002
Enewetak 0.001 0.014
Jabat 0.001 0.001
Jaluit 0.003 0.030
Kili 0.001 0.014
Kwajalein 0.023 0.224
Lae 0.002
Lib 0.003
Likiep 0.004
majuro 0.160 0.685
maloelap 0.003
mejit 0.003
mili 0.001 0.018
Namdrik 0.003
Namu 0.001 0.003
rongelap 0.001
ujae 0.001
utrik 0.002
Wotho 0.002
Wotje 0.008
total 0.200 1.070
Source: Estimations by the assessment team on the basis of official information
The information on estimated education losses shown in Table 15 reveal that the droughts affected some islands and atolls more severely than others. In both events, Majuro was by far the more affected location, followed by Kwajalein, as a result of the severity of the drought and the larger number of students enrolled in the schools.

Republic of the Marshall Islands 47Republic of the Marshall Islands
Post Disaster Needs Assessment of the 2015-2016 Drought | EDucatiON SEctOr Post Disaster Needs Assessment of the 2015-2016 Drought | EDucatiON SEctOr
During the 2013 event, other islands and atolls were also affected to a lesser degree, including Ailinglaplap, Jaluit and Arno. The 2016 drought caused more widespread and higher losses in education, especially in Jaluit, Ailinglaplap, Arno and Mili.
6.3 Recovery needsIt is evident that students who lost education during the 2016 drought should be given the opportunity to compensate for such losses, perhaps through a supplemental program of studies in the next school year, so that they may recover from the negative effect of the disaster. Such needs are defined, quantified and included in the post-disaster recovery program summarized in Table 16, which focuses on the most affected islands and atolls.
Table 16: Education recovery needs, 2017
Program of activity value (uSD) responsible agency
Establish after-school programs for students who missed school during the drought in the remote atolls that were severely affected, e.g. Lib Elem., Lukoj Elem., and Katiej Elem
13,000 MOE/public school system
Summer school classes for Majuro schools (Ajeltake and Laura Elem. schools)
35,000 MOE/public school system
Summer school classes for Ebeye Public Elementary School on Kwajalein
16,000 MOE/public school system
Student feeding program: lunch for Ebeye and Majuro schools 65,000 MOE/public school system
Vitamins to be given to students (folic acid, multi-vitamins, high energy, etc. Other vitamins are donated by UNICEF and WHO)
300,000 MOE/public school system, Ministry of Health, WHO, UNICEF, etc.
Estimates for education recovery needs were based on the education loss data. In the outer islands, summer classes are difficult to conduct due to the public school system‘s policy on teachers’ summer development on Majuro. As a result, after-school classes represent the only opportunity for these students to recover the education they lost due to the drought, while on Majuro and Ebeye, students who missed out because of the drought will attend summer classes.
Table 17: Education risk reduction needs, 2017
Disaster risk reduction activity value (uSD) responsible agency
Dig wells for individual schools (85 public schools) 80,000 MOE/public school system and community
Maintain broken plumbing system water supply line
Replace rain gutter systems (all 87 public schools, primary and secondary)
70,000 MOE/public school system
Absenteeism – disaggregate gender data 10,000 MOE/public school system
Provide reverse osmosis units to supply Ebeye schools (500 gallons per unit per day plus maintenance)
10,000 MOE/public school system and grant providers
total 170,000
Source: Estimations of the assessment team using official information
Table 17 shows what it is needed to reduce the risk of absenteeism this coming year. Work begins with the Majuro schools and in the near future with the remote island schools that were severely affected by the drought. Since there is very limited space on Ebeye (Kwajalein), it is best to provide the schools with reverse osmosis units and 1500-gallon water storage units. All schools use rain water from their limited capacity storages for everyday activities, including toilet, except Woja Elementary School, Jaluit High School and Marshall Islands High School.
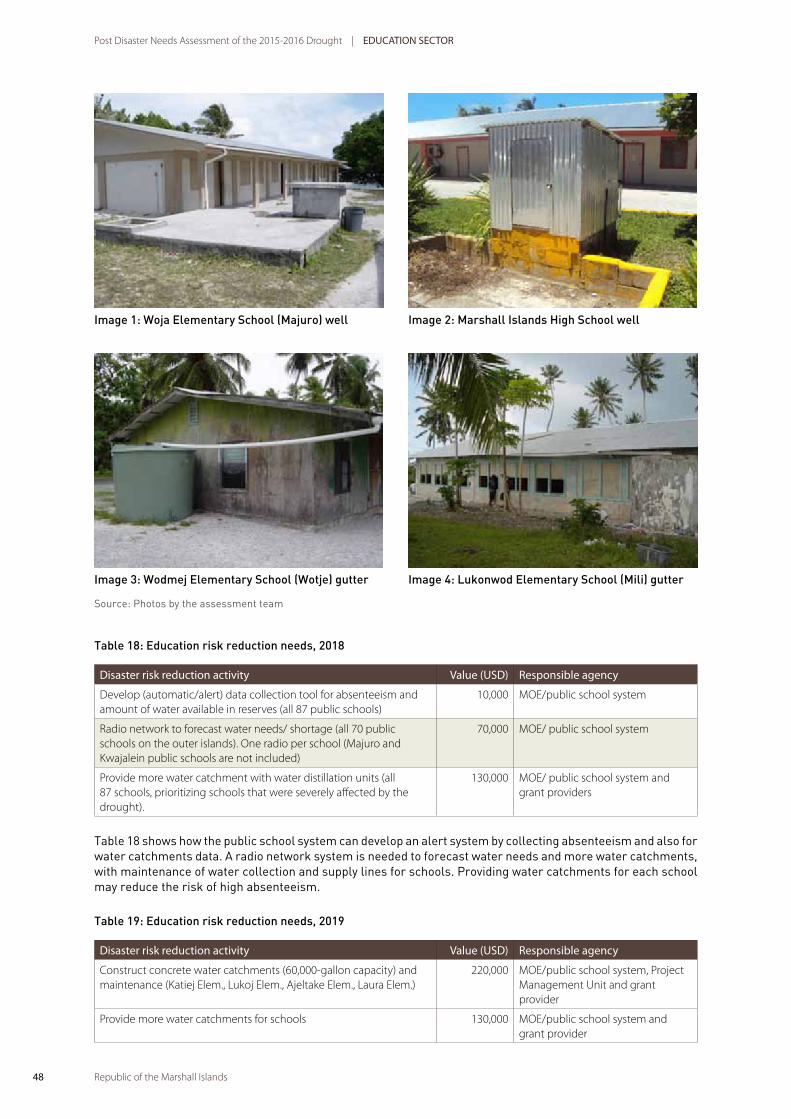
Republic of the Marshall Islands 48 Republic of the Marshall Islands
Post Disaster Needs Assessment of the 2015-2016 Drought | EDucatiON SEctOr
Image 1: Woja Elementary School (Majuro) well
Image 3: Wodmej Elementary School (Wotje) gutter
Source: Photos by the assessment team
Table 18: Education risk reduction needs, 2018
Disaster risk reduction activity value (uSD) responsible agency
Develop (automatic/alert) data collection tool for absenteeism and amount of water available in reserves (all 87 public schools)
10,000 MOE/public school system
Radio network to forecast water needs/ shortage (all 70 public schools on the outer islands). One radio per school (Majuro and Kwajalein public schools are not included)
70,000 MOE/ public school system
Provide more water catchment with water distillation units (all 87 schools, prioritizing schools that were severely affected by the drought).
130,000 MOE/ public school system and grant providers
Table 18 shows how the public school system can develop an alert system by collecting absenteeism and also for water catchments data. A radio network system is needed to forecast water needs and more water catchments, with maintenance of water collection and supply lines for schools. Providing water catchments for each school may reduce the risk of high absenteeism.
Table 19: Education risk reduction needs, 2019
Disaster risk reduction activity value (uSD) responsible agency
Construct concrete water catchments (60,000-gallon capacity) and maintenance (Katiej Elem., Lukoj Elem., Ajeltake Elem., Laura Elem.)
220,000 MOE/public school system, Project Management Unit and grant provider
Provide more water catchments for schools 130,000 MOE/public school system and grant provider
Image 2: Marshall Islands High School well
Image 4: Lukonwod Elementary School (Mili) gutter

Republic of the Marshall Islands 49Republic of the Marshall Islands
Post Disaster Needs Assessment of the 2015-2016 Drought | EDucatiON SEctOr Post Disaster Needs Assessment of the 2015-2016 Drought | EDucatiON SEctOr
Image 5: Marshall Islands High School catchments
Source: Photos by the assessment team
The activities in Table 19 will address the water shortage problem in the schools like it did in Buoj Elementary School. Catchments of 60,000-gallon capacity will be supplied neighboring islets such as Aerok and Jobwan. Concrete water catchments are recommended for the schools most affected.
Image 6: Ulien Elementary School, Arno
Image 7: Nallo Elementary School (Mili) catchment
Image 9: Ajeltake Elementary School (Majuro) catchment
Source: Photos by the assessment team
Image 8: Mejrirok Elementary School (Jaluit) catchment
Image 10: Mejel Elementary School catchment

Republic of the Marshall Islands 50

Republic of the Marshall Islands
INFRASTRUCTURE SECTORS
51

Republic of the Marshall Islands 52 Republic of the Marshall Islands
Post Disaster Needs Assessment of the 2015-2016 Drought | Executive Summary
Republic of the Marshall Islands
Post Disaster Needs Assessment of the 2015-2016 Drought | Executive Summary
Republic of the Marshall Islands
Post Disaster Needs Assessment of the 2015-2016 Drought | Executive Summary
WATER AND SANITATION SECTOR
7
52

Republic of the Marshall Islands 53Republic of the Marshall Islands
Post Disaster Needs Assessment of the 2015-2016 Drought | Executive Summary Post Disaster Needs Assessment of the 2015-2016 Drought | WatEr aND SaNitatiON SEctOr
Republic of the Marshall Islands
Post Disaster Needs Assessment of the 2015-2016 Drought | Executive Summary
Image 11: Water sources in MajuroSource: Photo courtesy of Marshall Islands Journal.
The strong connection of the water sector to health, education and the general quality of life, and the current risks associated with the changing climate make the water sector a priority in the Marshall Islands. General background information on the water sector can be found in Annex 5.
7.1 Drought effectsSanitationIt was determined early in the assessment that there was no damage to sanitation infrastructure, nor was there any change in economic flows to sanitation services. In the urban centers of Ebeye and Majuro, a dedicated salt-water network provides water for toilet flushing. A sewerage network discharges the sewage direct into the ocean. In the rural setting, the use of toilets that flush into septic tanks and pits predominate. Flushing water is derived from secondary sources, such as unprotected wells. It was beyond the scope of this assessment to look further into this aspect of the sector but it will need to be considered as part of disaster risk reduction and the normal development agenda.
During the drought, the health and hygiene needs of women and girls suffered from the lack of good quality water for bathing. A total of 3,279 female hygiene kits for women and girls of reproductive age were distributed in the first round of delivery, costing USD 34,102 (excluding the cost of transport for distribution). This was funded by USAID and implemented by the International Organization for Migration in partnership with WUTMI. In addition, in early September 2016, a second round of 1,155 female hygiene kits costing USD 16,102 will be distributed to severely and moderately affected islands and atolls. These losses were identified after the deadline and the overall losses in this sector are calculated on the cautious side. The first round of these kits, packed in reusable, zippered tote bags, contained menstrual hygiene supplies including underwear, tight pants, sanitary pads, diapers, hand sanitizers and soap. The contents were adjusted to meet women’s preferences for the second round. The quantity supplied was based on the estimated number of women per atoll/island and was sufficient. The distribution of female hygiene kits provides an opportunity to assess women’s well-being and raises awareness of sexual and reproductive health and rights.

Republic of the Marshall Islands 54 Republic of the Marshall Islands
Post Disaster Needs Assessment of the 2015-2016 Drought | WatEr aND SaNitatiON SEctOr
Water sourcesIn the Republic of the Marshall Islands, rainwater is the largest primary source of drinking water. This is typically captured by a household’s roof catchment to a tank of approximately 1,500 gallons. With year round constant rainfall, this supplies an average family of seven. Comparing the WHO/UNICEF Joint Monitoring Program data to the data of similar nations in the Coalition of Low Lying Atoll Nations on Climate Change (CANCC)20, RMI has the highest percentage of water sourced from rainwater of any in the coalition, and, indeed, of any Pacific nation, thus making it particularly vulnerable to changing rainfall patterns.
There is also comparably an underutilization of groundwater resources compared to other atoll nations in both urban and rural settings. The reason for this is difficult to ascertain, but there is a widely held perception that the water is too saline and not safe to drink. The Environmental Protection Agency samples of groundwater did show a range of salinity levels, but the majority of wells tested where still within normal aesthetic levels for palatability. Hand-dug well construction and sanitation practices were poor, so it is highly likely that these wells were contaminated with pathogens. This represents an opportunity for water security diversification through water safety planning and hygiene promotion.
In the urban centers of Majuro and Ebeye, which contain 74% of the population,21 there are more households using bottled water as a primary source of water than water from the utility (tap water). Bottled water is between 80 to 1000 times more expensive than water from the utility. It is also important to note the RMI tap water percentage is the lowest of all CANCC nations. This suggests that there is a financial willingness to pay for safe water, which the utility would be in a good position to provide, should suitable investment be available.
Table 20: Percentage of population using primary water
coalition of Low Lying atoll Nations on climate change (caNcc)
marshall islands %
Federated States of micronesia %
Kiribati %
tokelau %
maldives %
classification urban rural urban rural urban rural urban rural urban rural
tap water 12.1 - 28.5 31 67.2 6.3 80.9 56.9 1.1
Ground water 0.6 0.6 3.6 10.7 23 88.5 1.3 1.4
rainwater 71.2 98.2 47.1 42 9.4 4.3 6.3 94.8
Bottled water 14.5 0.1 16.5 5.8 0.3 0.1 34.9 0.5
Source: WHO/UNICEF Joint Monitoring Program 2015
Utility benchmarkingBoth the Majuro Water and Sewer Company (MWSC) and Kwajalein Atoll Joint Utilities Resources Inc (KAJUR) undertake benchmarking with the Pacific Water and Wastes Association (PWWA), using criteria set out by the International Benchmarking Network for Water and Sanitation Utilities (IBNET). The IBNET Apgar score assesses a utility’s health, based on six indicators that provide insight into the utility’s operational, financial, and social performance (see Annex 6 for APGAR classifications) (Table 21).
Table 21: PWWA Apgar benchmarking for MWSC and KAJUR 2015
apgar indicator
Water coverage (%)
Sewerage coverage (%)
Non-revenue
water (m3/km/day)
affordability (% revenues
per capita/gross
national income)
collection period (days)
Operating cost
coverage (ratio)
apgarscore
KaJur 91% 100% 4.4 0.4% 1,035 0.11 8.0
mWSc 26% 60% 2.6 4.8% 517 1.15 3.0
20 CANCC nations currently include: Kiribati, Maldives, Marshall Islands, Tokelau and Tuvalu21 Census, 2011

Republic of the Marshall Islands 55Republic of the Marshall Islands
Post Disaster Needs Assessment of the 2015-2016 Drought | WatEr aND SaNitatiON SEctOr Post Disaster Needs Assessment of the 2015-2016 Drought | WatEr aND SaNitatiON SEctOr
63
concerns from the community, triggered planning for mobilizing temporary salt water reverse osmosis units to meet production shortfalls, but the unit was never utilized.
Figure 14: Majuro International Airport runway catchment production outflow (gallons) Source: Estimations of the assessment team using official information In rural areas, household tanks began to empty during the first quarter of 201624, requiring communities to resort to alternative sources such as groundwater (including in some cases from unprotected wells), coconuts, bottled water and desalination units. In 35 communities, temporary 360 GPD (gallons per day) reverse osmosis units were installed. In outer islands, average household water usage before the drought was estimated at 18 GPD25 which, considering the average household of seven, is at the low end of the SPHERE humanitarian response standards of 2–4 GPD per person.26 This low consumption rate contributes to outer island community resilience during times of drought, but is significantly lower than the level of access enjoyed by those Marshallese living in urban areas. Time to collect water almost doubled during the drought, which significantly reduced labor capacity of the household. The assessment was unable to conclusively demonstrate increased treatment time or cost. The situation was similar in Majuro, but the average household consumption is much higher and is estimated at over 50 GPD.27 The 27% of households connected to the MWSC drinking water supply network have consumption closer to 100 GPD.28 These consumption estimates do not include toilet flushing, which 60% of all households are supplied with separately through a salt-‐water network. The higher consumption rate for Majuro households makes the urban population more susceptible to the drought and saw household catchments depleted early in the last quarter of 2015.29
24 Combined food security and WASH assessment PDNA 2016 25 Combined food security and WASH assessment PDNA 2016 26 SPHERE standards recommend a minimum ~0.7–0.8 gallons for drinking for survival and 1.3–3.2 gallons for basic cleaning and washing needs. 27 Combined food security and WASH assessment PDNA 2016 28 MWSC PDNA team 29 Combined food security and WASH assessment PDNA 2016
0
2,000,000
4,000,000
6,000,000
8,000,000
10,000,000
12,000,000
14,000,000
16,000,000
18,000,000
2013 2014 2015 2016
22 Safe water that has been chlorinated contains a free chlorine residual greater than 0.2 mg/L23 DHS 200724 Combined food security and WASH assessment PDNA 201625 Combined food security and WASH assessment PDNA 2016
KAJUR gets its water from two salt water reverse osmosis plants and, although it has high coverage, the service is irregular and limited to a maximum of 45 minutes only two days a week. Because of this level of service, it does not charge for water (making their affordability indicator positive) so its relatively good Apgar score is artificially high. Normally, drinking water is collected from the plant directly in 3-5 gallon containers, and piped water filling household rainwater tanks and used for cooking and cleaning.
MWSC gets its water primarily from the International Airport runway’s artificial catchment, which is augmented by the Laura Lens bore-field and a smaller rainwater source in the Dalap-Uliga-Darrit (DUD) area. Its Apgar score puts it squarely in the critically low zone, with water coverage, affordability and collection period being its major weaknesses. It currently supplies water for four hours, three days a week and, like KAJUR, does not supply safe water22 to the entire network.
Mortality and morbidityAcute respiratory illness and dehydration caused by severe diarrhea are major causes of childhood mortality in Marshall Islands.23 Further information on morbidity and mortality can be found in the Health Sector report (Section 5).
7.2 Assessment of drought effectsWith 79% of the population relying on rainwater as a primary source of water and the typical household storage of around 1500 gallons, RMI is vulnerable to water security shocks during extended periods of low rainfall.
MWSC saw a significant decrease in water production from January to April 2016 due to falling production from the airport catchment (Figure 14). With uncertainty over the sustainable yield during the drought, RMI EPA limited MWSC’s capacity to pump from the Laura Lens. This limit, along with concerns from the community, triggered planning for mobilizing temporary salt water reverse osmosis units to meet production shortfalls, but the unit was never utilized.
Figure 14: Majuro International Airport runway catchment production outflow (gallons)
Source: Estimations of the assessment team using official information
In rural areas, household tanks began to empty during the first quarter of 201624, requiring communities to resort to alternative sources such as groundwater (including in some cases from unprotected wells), coconuts, bottled water and desalination units. In 35 communities, temporary 360 GPD (gallons per day) reverse osmosis units were installed. In outer islands, average household water usage before the drought was estimated at 18 GPD25 which, considering the average household of seven, is at the low end of the SPHERE humanitarian response standards of 2–4 GPD per person.26 This low consumption rate contributes to outer island community resilience

Republic of the Marshall Islands 56 Republic of the Marshall Islands
Post Disaster Needs Assessment of the 2015-2016 Drought | WatEr aND SaNitatiON SEctOr
during times of drought, but is significantly lower than the level of access enjoyed by those Marshallese living in urban areas. Time to collect water almost doubled during the drought, which significantly reduced labor capacity of the household. The assessment was unable to conclusively demonstrate increased treatment time or cost.
The situation was similar in Majuro, but the average household consumption is much higher and is estimated at over 50 GPD.27 The 27% of households connected to the MWSC drinking water supply network have consumption closer to 100 GPD.28 These consumption estimates do not include toilet flushing, which 60% of all households are supplied with separately through a salt-water network. The higher consumption rate for Majuro households makes the urban population more susceptible to the drought and saw household catchments depleted early in the last quarter of 2015.30
In Majuro, 77% of the population use rainwater as their primary water source. Of those, only 19% of households have secondary piped water from MWSC.30 There was a 5% increase in household connection to MWSC during the drought, and those not connected utilized paid water deliveries, increased bottled water consumption and free temporary water collection points. It was estimated from the combined Food and WASH survey that the increased cost of water incurred by households in the urban areas31 was in the order of USD 650,000.
Image 12: Typical temporary water collection pointPhoto courtesy Marshall Islands Journal
To meet the need of the community, 21 temporary water collection points were installed at various locations around Majuro. Water was supplied from a 20,000 GPD reverse osmosis unit at the College of the Marshall Islands and delivered daily by trucks operated by the MWSC and Majuro Atoll Local Government. As reported by Majuro focus group participants, this was insufficient. Long lines, inconvenient schedules, and strict limits led to increased tensions and fighting. The estimate for water collection time in urban and rural areas increased significantly. Estimates for loss in reproductive labor due to increased water collection time are in the order of USD 500,000 and USD 400,000 for urban and rural households respectively.32
26 SPHERE standards recommend a minimum ~0.7–0.8 gallons for drinking for survival and 1.3–3.2 gallons for basic cleaning and washing needs.
27 Combined food security and WASH assessment PDNA 201628 MWSC PDNA team29 Combined food security and WASH assessment PDNA 201630 DHS 200731 Majuro and Ebeye32 Estimates use minimum wage of USD 2.00/hour.

Republic of the Marshall Islands 57Republic of the Marshall Islands
Post Disaster Needs Assessment of the 2015-2016 Drought | WatEr aND SaNitatiON SEctOr Post Disaster Needs Assessment of the 2015-2016 Drought | WatEr aND SaNitatiON SEctOr
33 Combined food security and WASH assessment PDNA 201634 ADB (http://www.adb.org/projects/documents/ebeye-water-supply-and-sanitation-project-rrp)35 Combined food security and WASH assessment PDNA 201636 Combined food security and WASH assessment PDNA 201637 This figure for both MWSC and KAJUR represents an increase in revenue during the drought.38 These losses are captured here for information purposes only and represent a loss to the NDMO, not the water sector.
Table 22: Water collection times
collection time (minutes) collection at the home No of respondents
urban Pre-drought 18 41% 34
Post-drought 29 15%
rural Pre-drought 24 41% 22
Post-drought 45 9%
Source: Combined Food and WASH assessment
In Ebeye, the average household consumption is estimated at approximately 4233 to 56 GPD34. Unlike Majuro, piped water coverage is over 90%, so although household water catchments ran out in the last quarter of 2015,35 the community was able to access some limited climate resilient production from the KAJUR salt water reverse osmosis plant. Although only limited production is currently available, this also highlights the importance of utilities in urban centers during a drought to meet the needs of the community. As the utilities increase their financial and technical viability, they will be able to supply more good quality water to more of the population.
The effect of the lack of available water supply on education was significant, with absenteeism reaching as high as 20% in Majuro. Further details are available in the education sector report (see Section 6). The effect on health of the lack of water and sanitation were difficult to ascertain from the Ministry of Health. There were over 2000 cases of diarrhea during the drought, but this did not represent a change in the normal disease burden. It should be noted that, on average, only 40% of those who became ill from waterborne diseases sought medical treatment at the clinic36 and in Majuro public service announcements informed people not to attend the hospital as they had no medicine. Further details are available in the health sector report (see Section 5).
Changes in economic flows in the water sectorHaving limited water, MWSC was unable to meet the increasing customer demand through their network. This resulted in residential, commercial and government billings remaining fairly constant. There was, however, almost a 200% increase in revenue from tanker-delivered water from October 2015 to April 2016 for people not connected to the network, although even with trucks running 24 hours a day, they not able to keep up with demand. The increased revenue was offset by some small increase in operational costs from increased abstraction from the Laura Lens and higher fuel cost. The net positive effect at MWSC was approximately USD 130,000. KAJUR had a similar net positive effect, with insignificant change to operational costs and a USD 30,000 increase in tanker-delivered water revenue.
Free temporary public water distribution on Majuro was paid for by the National Disaster Management Office (NDMO). The major costs were fuel (USD 53,000) tanks, pumps and temporary materials for the construction of the distribution points (USD 45,000), water from College of the Marshall Islands (USD 23,000) and salaries (USD 1,500).
The distribution of reverse osmosis (RO) units to the outer islands was paid for by the NDMO. The major costs were transport (USD 366,000), 12 new RO units and critical spares to repair existing units (USD 226,000) and salaries (USD 18,000).
Table 23: Damage and losses (USD) in the water and sanitation sector by sub-sector
Sub-sector Losses (uSD) Private Public (uSD)
mWSc 132,384 37 132,384
KaJur 30,0001212 30,000
rO distribution (610,856)38 (610,856)
urban distribution (122,133)13 (122,133)
Sector total 162,384 162,384
Source: Estimations of the assessment team using official information

Republic of the Marshall Islands 58 Republic of the Marshall Islands
Post Disaster Needs Assessment of the 2015-2016 Drought | WatEr aND SaNitatiON SEctOr
Social impact of damage and loss
“With or without the drought, life is hard”
Outer island respondent
On the outer islands, nearly all households have on-site drinking water and rely almost exclusively on rainwater. Secondary water sources are some distance from homes, and that distance is associated with increased risk for women, children, and other vulnerable community members.
During the drought, daily activity centered on water collection in urban areas, where women often fetched water. This put their children at risk if they were left at home alone, and at risk if they accompanied their mothers, as the filling stations were often crowded and required long wait times. The recent RMI Family Health and Safety Study (Jansen and Abraham 2014) shows that 65% of women believed it was acceptable for their partner to beat them if they did not complete their chores, such as cooking, washing and cleaning. The lack of water access, combined with the increased time burden for both men and women to secure water for household use, potentially exacerbates gender-based violence.
Many students did not attend school (and some schools closed for full or half days) because of lack of water for drinking at school/home, for washrooms at school, for washing uniforms, and helping with water collection at home. Menstrual hygiene was supported by the distribution of dignity kits during the drought, and distribution is ongoing.
“People were lining up at the water station from morning until midnight. Children were pushed away and were told by the adults to go to the end of the line.”
Ebeye focus group respondent
For all focus groups in both urban and outer islands, respondents stated that their lives would have been easier had there been adequate access to water during the drought.
The effects of the drought on urban populations in both Majuro and Ebeye were not felt as much as in the other islands due to the immediate free access to RO units.
7.3 Recovery needsWith the rain now returning and the water sector back to normal, there is only one outstanding recovery activity that this assessment recommends:
• retrievalandpre-positioningofreverseosmosisunits.
To improve future resilience in the water sector, this assessment recommends three key disaster risk reduction strategies:
• watersafetyplanning,supportedbydatacaptureandanalysis;
• MajurourbanclimateresiliencethroughLauraLensenhancedmonitoring;and
• improvedgovernanceandplanning.
It should be noted that the objective of this assessment is not to provide recommendations on the investment required for the large infrastructure deficit that currently exist in the water sector. Fortunately for RMI, there is already substantial investment in both urban utilities and outer island communities in the water sector. What is clear from this assessment is that there is a need for strategies that will allow these infrastructure investments to reduce risk to droughts through integrated and efficient approaches to developing resilience.
Republic of the Marshall Islands 59Republic of the Marshall Islands
Post Disaster Needs Assessment of the 2015-2016 Drought | WatEr aND SaNitatiON SEctOr Post Disaster Needs Assessment of the 2015-2016 Drought | WatEr aND SaNitatiON SEctOr
39 Huxel, 1973, Anthony, S.S., Griggs, J.E., and Peterson, F. 1989; Hamlin and Anthony 1987; Griggs and Peterson 1989; Mink 1996; Presley, T.K. 2005, Koda et al. 2015 and Sinclair et al. 2016 to name a few.
40 http://www.adb.org/sites/default/files/project-document/173757/46346-001-tacr-01-appendixes-m-r.pdf
RO retrieval and pre-positioningWith the rain returning, the NDMO and the International Organization for Migration, who are USAID’s primary implementing partners, are retrieving the RO units from the outer islands. Although there is community pressure to leave the units in place, there is no example of community-level RO equipment functioning sustainably without subsidies, despite outreach to all major WASH support agencies. RO equipment should, therefore, only be considered as a fully-funded and temporary ‘lifesaving’ solution whilst more cost-effective options are put in place (Parker 2016). Once retrieved, they will need to be serviced and stored appropriately. There is a need for spare parts, labor and suitable storage facilities. It is also advisable to bring together the agencies involved in the operation to debrief, capture lessons learned and allow for the creation of formal recommendations for future emergencies. This exercise would not only be of value to RMI but also to other regional actors. Discussion should focus on roles, responsibilities and funding mechanisms, with KAJUR supported to take a lead role in providing RO technical expertise and supporting the northern atolls.
Data management for water safety planningIn an emergency, timely, accurate and actionable information has the ability to save lives. Currently, RMI has little baseline data available. It is recommended that RMI EPA be supported to build a national geographical information systems (GIS) database.
A high number of RO units were placed in wells not adversely affected by salinity. There needs to be a better understanding of the safe utilization of groundwater during emergencies. Currently RMI EPA recommends discontinuing use at 500 mg/L TDS (total dissolved solids). TDS influence taste and can be used to indicate corrosion or scale build-up in pipes. Current TDS limits of 500 mg/L are based on non-mandatory US-EPA water quality standards which do not present a risk to human health, the palatable limit being 1200 mg/L. Scope exists to improve groundwater access through safe planning to eliminate sources of contamination, particularly pathogens.
Focus group participants noted that “their children did not get as sick using the RO”. Considering 98% of the population receives their water from rainwater, this highlights the need for better hygiene promotion on the safe storage of water.
Additional funding will be required to support EPA extension services for the atoll outreach and training program on a three-year rolling basis to enable collection of critical data and promote awareness of water security anticipation, planning and action. Key activities of the program should include a multi-sector monitoring programme for water demand and supply (quality and quantity); water safety planning; hygiene promotion; and asset condition of water supply systems, maintenance and repair.
Majuro urban climate resilience through enhanced monitoring of the Laura LensThe Laura fresh water lens has been well studied39 with conservative sustainable abstraction estimates between 300,000 and 600,000 GPD. Actual MWSC abstraction between 2013 and 2015 was on average only 60,000 GPD. The Laura Lens at current recommended rates of abstraction (350,000 GPD) provides MWSC with enough water to meet the current total monthly demand of Majuro. During the drought, abstraction was limited because of a miscommunication between EPA and the technical advice of the Japan International Research Centre for Agricultural Science (JIRCAS), which limited total abstraction to 44,000 (GPD. This forced the government to consider using salt water reverse osmosis (SWRO) to meet the demand, and arrangements were made to hire a SWRO package plant, which cost the government USD 100,000 in shipping and associated contract fees.
This cost could have been avoided had the appropriate abstraction agreements and monitoring program been in place. In the long term, if the Laura Lens continues to be under-utilized and agreement cannot be reached, this volume of water will need to come from SWRO. Using the current KAJUR SWRO upgrade as an example, the estimated capital cost to provide similar 400,000 GPD through SWRO would be in the order of USD 3,000,000, with ongoing annual operational and maintenance of USD 200,000 pa.40 By securing abstraction from the Laura Lens, this large capital cost to RMI can be deferred and an economically efficient, climate-resilient water source can be secured.

Republic of the Marshall Islands
60
WATER and SANITATION POLICY
Vision: All Marshallese citizens with access to clean and adequate water supplies; and a level of hygiene and sanitation comparable to world standards.
GO
ALPO
LICY
TARG
ETST
RATE
GIE
S
1: Reduce the occurrence of
waterborne illness
2: Ensure water resource
sustainability
3: Ensure utilitiesare financially
solvent
4: Target thedisadvantaged
5: Be resilient to climate variability
and extreme events
Diarrheal disease shall be reduced through water quality improvements
and monitoring and social marketing
By 2015, reduce occurrence of
gastroenteritis by 50%
Water Quality Monitoring
Social Marketing Campaigns
Groundwater is a common pool resource and shall be protected
with collective and effective
management
By 2015, all water management
organizations have an integrated water
resource plan
Water Committees
Water and Sanitation Commission
Water and Sanitation Office
The cost of operation and maintenance of water
and sanitation systems shall be recovered from service users through a
fair and transparent tariff
By 2015, all water and sanitation service organizations are financially solvent
Water and Sanitation Tariffs
Water and Sanitation Service Management
Government investment in water and sanitation service improvements shall be prioritized at
those lacking access to improved water and
sanitation and drinking water quality deficiencies
By 2015, the 20% most disadvantaged
households have access to improved water and
sanitation
Targeting the Disadvantaged
Subsidies for disadvantaged HH
Facilities for the disadvantaged
Behavior change for the disadvantaged
Ensure water and sanitation provision through proactive risk reduction and
comprehensive monitoring
By 2015, all vulnerability risks rated”High” or
above are reduced from the national water and sanitation assessment
Resource Monitoring
Vulnerability Assessment
Drought and Extreme weather resistance
Republic of the Marshall Islands
Post Disaster Needs Assessment of the 2015-2016 Drought | WatEr aND SaNitatiON SEctOr
An agreement between EPA and MWSC on abstraction rates for all conditions, including droughts, needs to be formalized in a memorandum of understanding signed by the relevant authorities. There would also need to be increased funding for EPA to conduct enhanced monitoring of the bore field and establish appropriate triggers and protocols with MWSC. A full list of recommended actions has been proposed in the report by Sinclair et al. 2016.
Governance and planningThe water sector is suffering from poor vertical coordination from actors at all levels, limited horizontal cooperation with other sectors such as education and health, and a lack of whole-of-system thinking. This is resulting in an inability to mitigate the risk from natural disasters and adapt to a changing climate effectively and efficiently. The National Water and Sanitation Policy is urgently required to be adopted and implemented in RMI to direct investment in the sector, improve water and sanitation services, and sustainably manage the limited fresh water resources (Figure 15). Developed and presented to cabinet in 2013, its relevance is only more pressing with the Ministry of Finance confirming over USD 70 million by external actors into the water sector either approved or in the pipeline in the next five years. Without this policy, and indeed the National Water Office, governments and communities will fail to align or communicate their strategies and resources, resulting in replication, inefficiencies and even conflicting efforts. There is an urgent need to promote dialogue and cooperation among government departments and agencies, including budget sharing and decision making, to create value-added interventions that address multiple needs and interests. This will result in a more holistic and efficient approach to developing resilience.
By way of an example, drought resilience in urban areas must come through the financial and technical viability of the two water utilities. Strategies such as the politically popular catchment distribution to households will counter-intuitively reduce drought resilience through reducing the utilities’ financial viability. Another example is the expansion in coverage of toilet facilities, which is integral to meeting Sustainable Development Goal targets. If, however, this is not done in coordination with water safety planning, it runs the risk of contaminating both ground and marine waters. These examples highlight some important challenges the National Water Office faces in creating an integrated, coordinated and cooperative water sector.
Figure 15: Draft Water and Sanitation Policy 2013Source: Government of the

Republic of the Marshall Islands 61Republic of the Marshall Islands
Post Disaster Needs Assessment of the 2015-2016 Drought | WatEr aND SaNitatiON SEctOr Post Disaster Needs Assessment of the 2015-2016 Drought | WatEr aND SaNitatiON SEctOr
Table 24: Recovery needs (USD) in the water sector
2016 Program of activity value (uSD) responsible agency
Water Recovery of 360GPD RO units, maintenance and prepositioning to stores in Ebeye and Majuro.
110,00041 MWSC, KAJUR
Source: Estimations of the assessment team using official information
Table 25: Disaster risk reduction needs (USD) in the water sector
Program of activity value (uSD) responsible agency
2017
Adopt and implement the National Water and Sanitation Policy, creating the National Water Office
80,000 EPA
Laura Lens MoU and enhanced monitoring trial 20,000 EPA, MWSC
Data management for water safety planning 25,000 EPA
RO annual maintenance and storage 10,000 MWSC, KAJUR
Construction of an RO warehouse in Majuro and Ebeye 200,000 MWSC, KAJUR
2018
National Water Office 70,000 EPA
Laura Lens enhanced monitoring 10,000 EPA, MWSC
Data management for water safety planning 20,000 EPA
RO annual maintenance and storage 20,000 MWSC, KAJUR
Source: Estimations of the assessment team using official information
41 Recovery and spares funded (USD 110,000)
Republic of the Marshall Islands 62 Republic of the Marshall Islands
Post Disaster Needs Assessment of the 2015-2016 Drought | Executive Summary
Republic of the Marshall Islands
Post Disaster Needs Assessment of the 2015-2016 Drought | Executive Summary
Republic of the Marshall Islands
Post Disaster Needs Assessment of the 2015-2016 Drought | Executive Summary
ELECTRICITY SECTOR
8
62

Republic of the Marshall Islands 63Republic of the Marshall Islands
Post Disaster Needs Assessment of the 2015-2016 Drought | Executive Summary Post Disaster Needs Assessment of the 2015-2016 Drought | ELEctricity SEctOr
Republic of the Marshall Islands
Post Disaster Needs Assessment of the 2015-2016 Drought | Executive Summary
Diesel-powered thermal power plants, a waste-heat recovery system and solar power plants, all owned by the RMI Energy Company, generate electricity and distribute it to consumers in Majuro, Jaluit and Wotje. Another relatively large electricity system, run by KAJUR, is located on the island of Ebeye, Kwajalein Atoll. There are other isolated power plants in Kili, Bikini, Rongelap and Enewetak.
Total electricity generation in those four systems amounted to 54,718 megawatt hours (MWh) in FY 2015; 99% of which was obtained from the diesel-powered thermal units, and the balance from waste-heat recovery and solar plants. There are three main consumer sectors in the four atolls: residential, commercial and government. In FY 2015, sales of electricity to residential consumers amounted to 25,724 MWh (47% of the total sales); sales to commercial consumers were 20,115 MWh (37%), and 10,934 MWh was sold to the government (16%). Differential rates were charged in accordance with the following tariff: 0.346 USD/KWh to residential consumers; 0.406 USD/KWh to commercial consumers and 0.416 USD/KWh to government consumption.
8.1 Drought impact on the sectorIn order to analyze the possible impact of the drought on the electrical sector, an analysis was conducted on the performance of the sector over the period 2010 to 2016.42 Meteorological data were examined, as well as information on the production and overall and sectorial consumption of electricity, and of the performance of the country’s economy.
A comparison between annual rates of rainfall and consumption of electricity revealed that, during years of lower-than-normal precipitation, overall consumption of electricity increased. It was found that during FY 2013 and FY 2016 – when meteorological droughts occurred (See Annex 1 for description of drought) – sales of electricity increased. Furthermore, the contribution of the electricity sector to the country’s gross domestic product also increased during the same drought periods.
Further analysis of meteorological data shows that, during drought years, air temperatures rose, which in turn created a higher residential demand for electricity to operate fans, air conditioners and other appliances. Figure 16 shows monthly values of air temperature in Majuro in comparison to the long-term average, and provides evidence that, during the drought periods that occurred in 2012–2013 and 2015–2016, the air temperature was consistently above normal. Figure 17 shows the values of monthly electricity sales to the residential sector at Majuro in comparison to the long-term average value of sales for the period 2010 to 2016, and provides further evidence of the increase in electricity demand and sales during drought periods. Similar patterns were found for Kwajalein, but not for the case of Jaluit and Wotje probably because of their smaller urban or residential population.
72
conducted on the performance of the sector over the period 2010 to 2016.42 Meteorological data were examined, as well as information on the production and overall and sectorial consumption of electricity, and of the performance of the country’s economy. A comparison between annual rates of rainfall and consumption of electricity revealed that, during years of lower-‐than-‐normal precipitation, overall consumption of electricity increased. It was found that during FY 2013 and FY 2016 – when meteorological droughts occurred (See Annex 1 for description of drought) – sales of electricity increased. Furthermore, the contribution of the electricity sector to the country’s gross domestic product also increased during the same drought periods. Further analysis of meteorological data shows that, during drought years, air temperatures rose, which in turn created a higher residential demand for electricity to operate fans, air conditioners and other appliances. Figure 16 shows monthly values of air temperature in Majuro in comparison to the long-‐term average, and provides evidence that, during the drought periods that occurred in 2012–2013 and 2015–2016, the air temperature was consistently above normal. Figure 17 shows the values of monthly electricity sales to the residential sector at Majuro in comparison to the long-‐term average value of sales for the period 2010 to 2016, and provides further evidence of the increase in electricity demand and sales during drought periods. Similar patterns were found for Kwajalein, but not for the case of Jaluit and Wotje probably because of their smaller urban or residential population.
Figure 16: Monthly air temperature at Majuro vis-‐à-‐vis long-‐term average temperature, 2010 to 2016 Source: RMI Meteorological Office and the National Oceanic and Atmospheric Administration
42 The Marshalls Energy Company provided information on electricity production and sales information for the period 2010 to 2016.
Figure 16: Monthly air temperature at Majuro vis-à-vis long-term average temperature, 2010 to 2016Source: RMI Meteorological Office and the National Oceanic and Atmospheric Administration
42 The Marshalls Energy Company provided information on electricity production and sales information for the period 2010 to 2016.
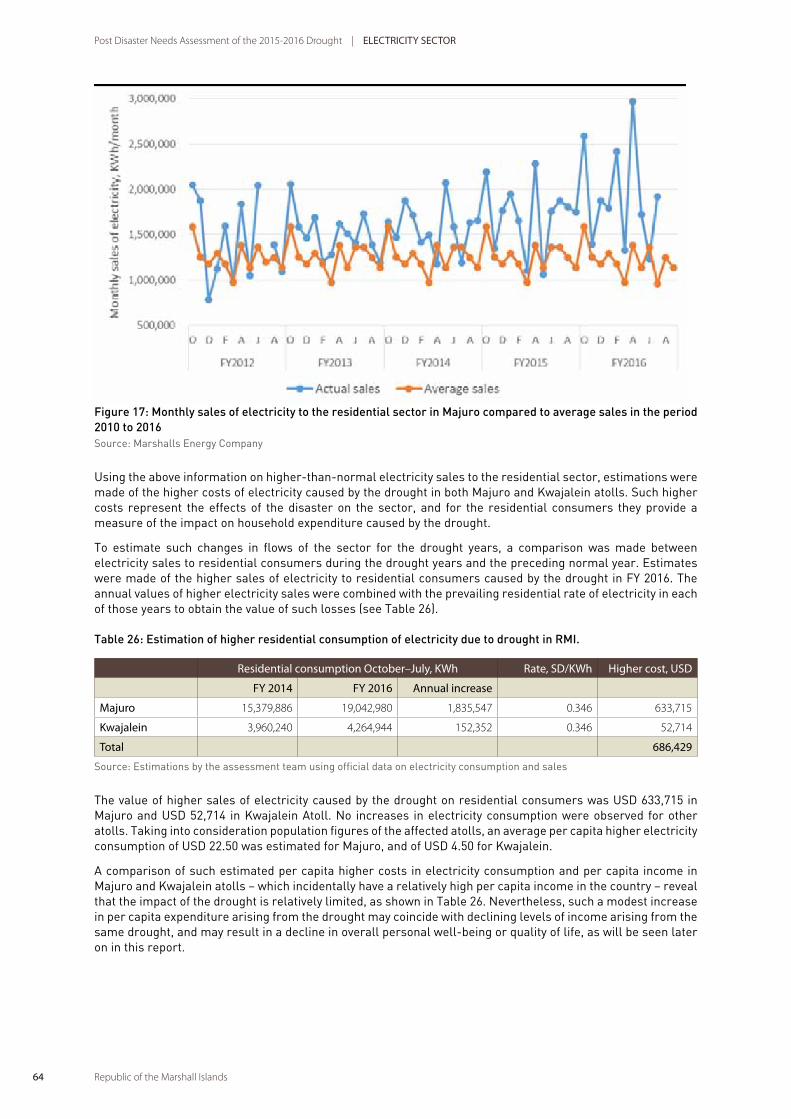
Republic of the Marshall Islands 64 Republic of the Marshall Islands
Post Disaster Needs Assessment of the 2015-2016 Drought | ELEctricity SEctOr
73
Figure 17: Monthly sales of electricity to the residential sector in Majuro compared to average sales in the period 2010 to 2016 Source: Marshalls Energy Company Using the above information on higher-‐than-‐normal electricity sales to the residential sector, estimations were made of the higher costs of electricity caused by the drought in both Majuro and Kwajalein atolls. Such higher costs represent the effects of the disaster on the sector, and for the residential consumers they provide a measure of the impact on household expenditure caused by the drought. To estimate such changes in flows of the sector for the drought years, a comparison was made between electricity sales to residential consumers during the drought years and the preceding normal year. Estimates were made of the higher sales of electricity to residential consumers caused by the drought in FY 2016. The annual values of higher electricity sales were combined with the prevailing residential rate of electricity in each of those years to obtain the value of such losses (see Table 26). Table 26: Estimation of higher residential consumption of electricity due to drought in RMI. Residential consumption October–July, KWh Rate,
USD/KWh Higher cost, USD
FY 2014 FY 2016 Annual increase
Majuro 15,379,886 19,042,980 1,835,547 0.346 633,715 Kwajalein 3,960,240 4,264,944 152,352 0.346 52,714 Total 686,429 Source: Estimations by the assessment team using official data on electricity consumption and sales
Sailesh Sen 2/27/2017 9:11 AMFormatted: Font:Not Bold
Sailesh Sen 2/27/2017 9:11 AMFormatted: Font:Not Bold, Not Italic
Sailesh Sen 2/27/2017 9:10 AMDeleted: Table 26
Figure 17: Monthly sales of electricity to the residential sector in Majuro compared to average sales in the period 2010 to 2016Source: Marshalls Energy Company
Using the above information on higher-than-normal electricity sales to the residential sector, estimations were made of the higher costs of electricity caused by the drought in both Majuro and Kwajalein atolls. Such higher costs represent the effects of the disaster on the sector, and for the residential consumers they provide a measure of the impact on household expenditure caused by the drought.
To estimate such changes in flows of the sector for the drought years, a comparison was made between electricity sales to residential consumers during the drought years and the preceding normal year. Estimates were made of the higher sales of electricity to residential consumers caused by the drought in FY 2016. The annual values of higher electricity sales were combined with the prevailing residential rate of electricity in each of those years to obtain the value of such losses (see Table 26).
Table 26: Estimation of higher residential consumption of electricity due to drought in RMI.
residential consumption October–July, KWh rate, SD/KWh Higher cost, uSD
Fy 2014 Fy 2016 annual increase
majuro 15,379,886 19,042,980 1,835,547 0.346 633,715
Kwajalein 3,960,240 4,264,944 152,352 0.346 52,714
total 686,429
Source: Estimations by the assessment team using official data on electricity consumption and sales
The value of higher sales of electricity caused by the drought on residential consumers was USD 633,715 in Majuro and USD 52,714 in Kwajalein Atoll. No increases in electricity consumption were observed for other atolls. Taking into consideration population figures of the affected atolls, an average per capita higher electricity consumption of USD 22.50 was estimated for Majuro, and of USD 4.50 for Kwajalein.
A comparison of such estimated per capita higher costs in electricity consumption and per capita income in Majuro and Kwajalein atolls – which incidentally have a relatively high per capita income in the country – reveal that the impact of the drought is relatively limited, as shown in Table 26. Nevertheless, such a modest increase in per capita expenditure arising from the drought may coincide with declining levels of income arising from the same drought, and may result in a decline in overall personal well-being or quality of life, as will be seen later on in this report.

Republic of the Marshall Islands 65Republic of the Marshall Islands
Post Disaster Needs Assessment of the 2015-2016 Drought | ELEctricity SEctOr Post Disaster Needs Assessment of the 2015-2016 Drought | ELEctricity SEctOr
Table 27: Estimation of higher electricity consumption costs and comparison to per capita and household income
annual income, uSD Higher electricity cost, uSD
Per person Per household Per person Per household
majuro 2,854 19,119 22.5 150.7
Kwajalein 2,630 21,827 4.5 37.6
Source: Estimations by the assessment team
Since there is no detailed quantitative information on collective electricity services for the rest of the Islands and Atolls, no attempt was made to estimate higher costs of electricity elsewhere in the country.
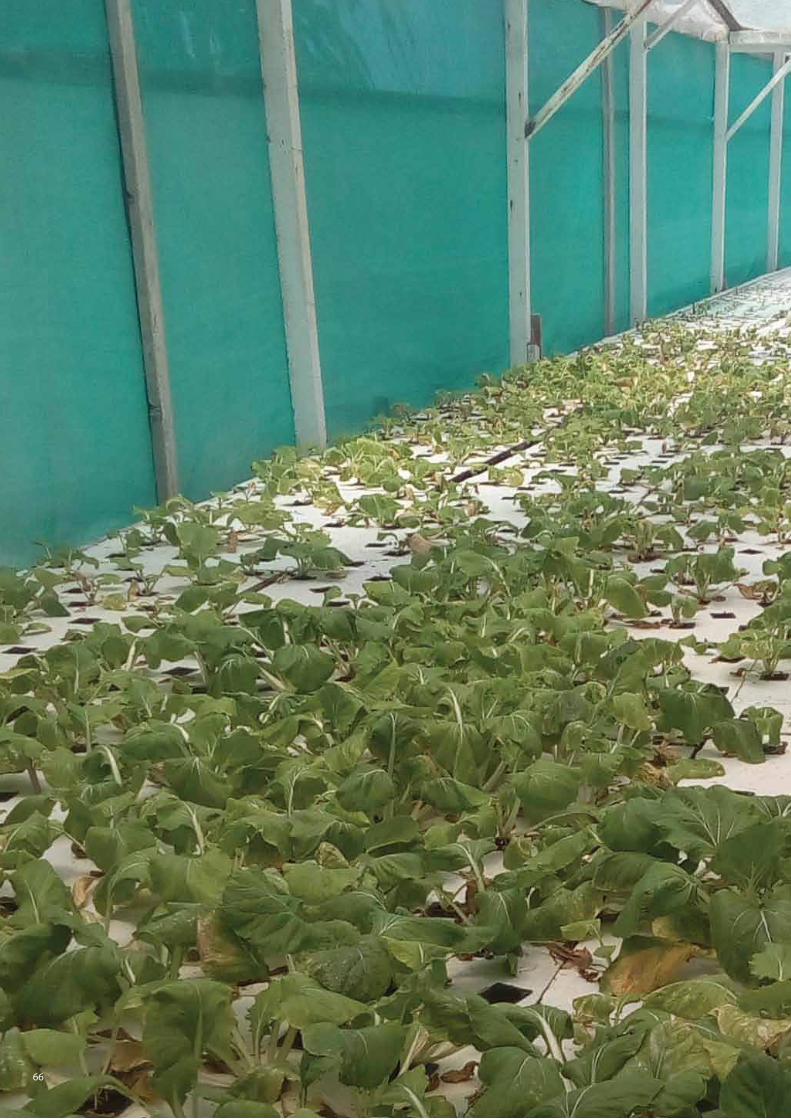
Republic of the Marshall Islands 66

Republic of the Marshall Islands
CROSS-CUTTING ISSUES
67

Republic of the Marshall Islands 68 Republic of the Marshall Islands
Post Disaster Needs Assessment of the 2015-2016 Drought | Executive Summary
Republic of the Marshall Islands
Post Disaster Needs Assessment of the 2015-2016 Drought | Executive Summary
Republic of the Marshall Islands
Post Disaster Needs Assessment of the 2015-2016 Drought | Executive Summary
GENDER AND SOCIAL INCLUSION
9
68
Republic of the Marshall Islands 69Republic of the Marshall Islands
Post Disaster Needs Assessment of the 2015-2016 Drought | Executive Summary Post Disaster Needs Assessment of the 2015-2016 Drought | GENDEr aND SOciaL iNcLuSiON
Republic of the Marshall Islands
Post Disaster Needs Assessment of the 2015-2016 Drought | Executive Summary
9.1 BackgroundTraditionally, Marshall Islands is a matrilineal society and women are decision-makers and owners of land. Women are recognized for their significant contribution to the peaceful development and well-being of families, communities and society as a whole. Fundamental values include caring for each other, respect, reciprocity and partnership.
However, as in many Pacific Island countries, these traditional beliefs and women’s customary rights coexist with dissonant gender stereotypes, gender roles and inequality. Stereotypes include the belief that the place of a woman is in the home while men should occupy the public space and be the breadwinner. Positions of leadership and decision-making are regarded as male roles. Women mostly care for children and make decisions regarding medical care for children. Men typically have higher incomes than women, or are the sole source of income for the household; with women making decisions regarding household spending or, as in many families, both parents making these decisions.
“ILO MANTIN MAJÕL, EMAAN EJ BOSS ÑAN BAAMLE EO.”
IN MARSHALLESE CUSTOM, A MAN IS THE BOSS OF A FAMILY
Woman from Likiep
Gender equality and women’s empowerment remain enormous challenges for the country. Overall, women’s highest level of education is lower than that of men, and women are much less likely to participate in the labor force. In 2011, 47% of adult men aged 25 years and over had completed high school or higher education compared with 39% of adult women (EPPSO 2012). School enrolment statistics show nearly equal enrolment of males and females, with girls comprising 49% of elementary students and 51% of secondary school students. Net enrolment rates point to higher enrolment of girls than boys, especially at secondary school level. Although attendance rates disaggregated by sex are not available, overall absentee rates for 2015 are 12% for Majuro and Ebeye and 3% for the outer islands.
Childbearing starts early and is nearly universal among Marshallese women. Fertility rates have declined from 8.7 (1964) but remain high at an average of 4.1 births for each woman of reproductive age, and the teenage pregnancy rate is one of the highest in the Pacific, with 14% of women giving birth in 2012 aged 15 to 19 years: in 2011 the annual number of births to women 15 to 19 years of age per 1,000 women in that age group was 85 (EPPSO 2012; MOH 2013). Women on average marry when they are 24 years old, compared with 26 years for men, and 26% of women aged between 20 to 24 years are married or in a union before age 18, with the rate for men just over half this at 12% (EPPSO 2012).
Violence against women and girls is alarmingly high, with 51% of women experiencing intimate partner physical and/or sexual violence in their lifetime and 18% of women currently experiencing physical and/or sexual violence. Two out of every three women are survivors of physical and/or sexual violence by an intimate partner or another person in their lifetime. Attitudes to domestic violence perpetrate prevalence, with 85% of women agreeing that domestic violence is justified under certain circumstances (MIA 2014).
Women’s participation in the workforce force stands at 28% in terms of the work to population ratio, 23% points lower than the male equivalent, which stands at 51%. This suggests that many people were significantly under-employed, if not actually unemployed; although there is no information about how these women and men use their time in terms of productive and reproductive work. Working men are more likely to work for wages or salaries than women, and women are more likely to work producing goods for sale than men, with 30% of women working in craft and related occupations compared with 23% of men. In 2011, an estimated 26% of households were headed by women and a large proportion, 80%, of these households were in the urban areas of Majuro and Kwajalein (EPPSO 2012).
In 2011, 26% of households were headed by a woman, with above average rates of female headship in Lib, Kwajalein, Enewetak and Majuro. In all four places there was a gender gap in the average annual income of men and women in favor of men, with men in Enewetak having average annual incomes 54% higher than women and Lib having the narrowest gap at 3%. Female household heads were reported to have average annual incomes of USD 4,503, compared to USD 7,913 for male household heads. While this 43% gap does not include the income of other household members, it points to the vulnerability of female-headed households. Almost 40% of female household heads were not partnered or married compared with 10% of male-headed households; 54% of these women were widowed; and 38% were aged 50 years and older (EPPSO 2012).

Republic of the Marshall Islands 70 Republic of the Marshall Islands
Post Disaster Needs Assessment of the 2015-2016 Drought | GENDEr aND SOciaL iNcLuSiON
Other major challenges are the low representation of women in the Nitijela (three out of 33 members are women), despite the Marshall Islands having a woman as president, as well as the low proportion of women in senior management positions. In the public service, women comprise 43% of employees and 38% of management positions, yet their average earnings are slightly higher than men’s. This is possibly because, on average, women in the public service are more highly qualified than men (PSC 2014). Women are under-represented on the boards of statutory bodies and state-owned enterprises, making up 25% of board members. Tobolar, the state-owned copra processing plant, has a board of seven members with one women currently serving as chair.
There is very little information about morbidity and mortality trends for women and men. Non-communicable diseases (NCDs) are at epidemic levels, with about 70% of deaths for both men and women aged 15 to 49 years attributed to NCDs in 2013. Men accounted for about 60% of NCD-related deaths, mostly related to diabetes (IHME 2010). Providing equitable access to affordable health care is a major challenge, with 94% of rural women and 79% of urban women reporting problems in accessing healthcare, regardless of age, number of children, education, or wealth quintile in (MIA 2014). Within the lifetime of the cohort of the population exposed to fallout radiation in 1954, the excess cancers caused by the radiation are estimated at 530; with an expected total number of cancers (fatal plus non-fatal) of about 6,130 (NCI 2004).With women being mostly responsible for the health of their family, they are on the front line for ‘outbreak-prone diseases’ such a pink-eye (including chlamydial conjunctivitis), diarrhea, hepatitis and tuberculosis.
Overall, 6,210 persons or 12% of the population reported having some form of disability in 2011, with females reporting a slightly higher rate (12%) than males (11%). Most children aged between five and 18 years living with a disability were attending school – 73% of boys and 81% of girls – a difference in favor of girls, which is generally consistent with overall sex ratios for educational enrolment. In terms of the type of disability, vision impairment was the most common, possible related to diabetes, followed by difficulty in mobility, hearing and concentrating or remembering.
Recent research examining the need for child protection in RMI found that there was little knowledge within communities about plans in place to deal with natural disasters and effects of climate change, and that children, who make up about 40% of the population, were the group most vulnerable to the impacts of disasters (UNICEF Pacific 2012). In 2007 12% of girls and 14% of boys under five years of age were malnourished, with higher rates of malnourishment in rural areas and among the poorest wealth quintiles (EPPSO 2009).
9.2 Effects of the droughtThe drought affected the activities of families in terms of reduced income from handicrafts because of reduced supply of materials (pandanus, coconut, vines, etc.) although incomes from copra actually increased because of the acquisition of copra by Tobolar being not only more frequent but also from a wider range of atolls. In general, however, the fragility of outer island economics is strained under disaster conditions. Many families in RMI, especially in the outer islands, produce a significant proportion of their own food, notably fish, traditional tree crops like coconut, breadfruit and pandanus, and other crops such as bananas and taro. During the drought, fishermen reported that they had to go further to get their normal fish catch, resulting in more time spent fishing. Most atolls and islands reported the total loss of local crops and traditional medicines. Many reported having to change from their ‘traditional’ diet to relying on imported goods and canned food.
During the research, families reported on the increased burden of the drought in terms of normal household roles and responsibilities.43 A wife and mother of three reported spending three extra hours a day collecting and fetching water during the drought, while a young man from Arno spent two hours a day collecting his family’s drinking water from the RO unit some distance away. Everyone spoken with highlighted the cost of the drought in terms of additional financial and time burdens to secure potable water for drinking and other water for household tasks. The drought research indicated that it is mostly men, and young men, in households who collect drinking water, because of their physical strength, while water resources are managed by both women and men, based on their household roles and responsibilities. However, when water supplies were at their lowest levels, whole families would go to the water stations to collect and carry as much water as they could. Women in women-headed households relied on family members, friends and neighbors for their drinking water – the traditional social protection systems and social capital. Children’s education was affected by the need to collect drinking water in the mornings, the lack of drinking water and sanitation in some schools, the closure of one school for 20 days affecting 39 children, not being able to attend school because of insufficient water to bathe or wash school uniforms and general lassitude related to the high temperatures and insufficient drinking water.
43 Annex 1 contains a summary of the main observations made during the focus group and key respondent interviews conducted in the second week of August 2016.

Republic of the Marshall Islands 71Republic of the Marshall Islands
Post Disaster Needs Assessment of the 2015-2016 Drought | GENDEr aND SOciaL iNcLuSiON Post Disaster Needs Assessment of the 2015-2016 Drought | GENDEr aND SOciaL iNcLuSiON
Women are largely responsible for the health and well-being of their family, especially their children and older persons. The drought worsened seasonal disease outbreaks, notably conjunctivitis, diarrhea, influenza and scabies. Based on the information from the incidence of drought-related diseases in 2016 and the years previous, the drought-related disease burden was especially high for families living in Aur, Jabat, Lae and Mili in terms of the proportion of households affected by the incidence of one or more of these diseases. In 2011, 25% of households in the island of Lae had a female household head, and these households would have felt the cost of care even more acutely. Breastfeeding mothers reported drinking between five to eight cups of water a day during the drought, which they considered adequate and is consistent with compensation for water lost through breast-feeding, which is estimated at 600 to 700 mL/d (Hydration for Health, 2016). In 2007, children were tested for signs of malnutrition and it was found that 17% showed signs of malnutrition, and overall 13% were observed to be malnourished after various tests and targeted observations. Malnutrition was more prevalent in the outer islands (rural areas) than in urban areas (DHS, 2007). The drought impact assessment shows that children with malnutrition treated in hospital increased almost five-fold, implying that the overall level of child malnutrition could have substantially increased.
Low-income families were faced with difficult and stressful decisions about spending their limited incomes on water security rather than other regular purchases. At the same time, a number of community groups were fund-raising for conferences, with one women’s group tasked to raise as much as USD 16,000, while other groups reported lower values of around USD 5,000. This is on top of the activities like bingo evenings, with key respondents in Majuro noting that during the drought there was an increase in potential winnings; perhaps to entice more people to participate.
While the copra processing plant, Tobolar, reported increased copra tonnage during the 2016 drought, the figures do not reveal the inconsistencies in copra collection from outer islands and the number of households able to sell their copra during each collection trip. For example, Ailinglaplap atoll had four pick-ups in FY 2015, which increased to seven pick-ups in FY 2016. This collection schedule implies that families might or might not have received income from copra prior to the drought, impeding their ability to prepare for the drought when warnings were issued.
9.3 Recovery strategy and needsWhile women and other social groups have been disproportionally affected by the drought of 2016, women’s contribution to the household economy is substantial. Women play a critical role in recovery and resilience; post-disaster recovery resources must strive to safeguard, restore and promote the economic engagement and participation of disadvantaged groups. Women’s economic recovery must be protected and accorded the same status and importance as that of men. Targeted investment through extension, financial inclusion, soft loans and skills development must be made in areas with a high representation of women, particularly in the informal sector in agriculture, markets and other forms of vulnerable employment. Alternative livelihoods appropriate for remote communities need to be identified and promoted in areas like aquaculture (sea cucumber farming, for example) and hydroponics. Recovery efforts must redress gender inequalities or, at the very least, not perpetuate unequal access to power and resources.
Broader disaster risk reduction recommendationsSubsistence agriculture is the mainstay of the atolls and islands of RMI and extension services for women, especially young women, must be provided, particularly where there is an opportunity to sell any surplus production. Investment in subsistence agriculture must be done in tandem with non-farm skills and market development, as well as financial literacy capacity strengthening.
Food security in times of drought could be improved with the promotion of indigenous knowledge and practices related to farming, harvesting and food preservation, while maximizing the use of modern agricultural inputs and practices to increase production volume.
Public activities targeting disaster risk management must ensure that women, especially young women, have equal access to jobs and employment, which would include programs to provide child care to enable women to participate.
Drought warnings must be conveyed regularly through as many communication channels as possible so that all people have access to information about the anticipated severity and duration of the drought to improve preparedness. This would include the public radio broadcasting station, mass SMS text messaging, and messages disseminated through local government, as well as all other means possible such as through traditional leaders,

Republic of the Marshall Islands 72 Republic of the Marshall Islands Republic of the Marshall Islands
Post Disaster Needs Assessment of the 2015-2016 Drought | GENDEr aND SOciaL iNcLuSiON
churches, health centers, schools, and WUTMI chapters. Many families living in the urban areas regularly communicate with family members in the outer islands and they should be encouraged to inform their clans about drought warnings. Such communications must provide sufficient time for families to prepare, and must be broadcast frequently with ‘real time’ status reports and associated updates. Local government and traditional leaders must mobilize to ensure that communities make every possible preparation.
The contribution that handicrafts make to the Marshall Island economy needs to be accurately quantified for the different types of handicrafts produced, input materials, intermediate consumption and cost of production. The value and market chain for handicrafts needs to be better understood, as do the gender roles of women and men in handicraft production.
Republic of the Marshall Islands

Republic of the Marshall Islands 73Republic of the Marshall Islands Republic of the Marshall Islands
Post Disaster Needs Assessment of the 2015-2016 Drought | GENDEr aND SOciaL iNcLuSiON Post Disaster Needs Assessment of the 2015-2016 Drought | Executive Summary
Republic of the Marshall Islands
Post Disaster Needs Assessment of the 2015-2016 Drought | Executive Summary
DISASTER RISK MANAGEMENT
10
73

Republic of the Marshall Islands 74 Republic of the Marshall Islands
Post Disaster Needs Assessment of the 2015-2016 Drought | DiSaStEr riSK maNaGEmENt
RMI faces disaster risks from several hazards – typhoons, storm surges, droughts and flooding – that are closely related to and derive from climate variability and change. To address disaster risks from these hazards, combined with exposure and vulnerability factors, the country has developed various policies and strategies, including the establishment of a National Disaster Management Office and the Joint National Action Plan for Disaster Risk Management and Climate Change Adaptation.
RMI sustained drought conditions, resulting from a protracted El Niño system that started building up in early 2015 and continued until at least July in some areas. The Government of RMI began responding to mitigate effects, based on seasonal weather forecasts, and proactively initiated emergency response measures that began in early 2016. This most recent episode of drought, induced by rainfall deficiency across the Marshall Islands, was exacerbated by water depletion in water storage facilities, a rise in salinity of groundwater in some islands to unsafe levels, and limited availability of reverse osmosis equipment. This resulted in negative impacts on agriculture and food availability. Consequently, the government declared an emergency on 3 February 2016 and later upgraded it to a declaration of disaster on 4 March 2016.
10.1 Disaster risk management sector backgroundDisaster management (DM) was formalized with the passing of the National Disaster Management Plan and the enactment of the Disaster Assistance Act, both in 1987, which established the National Disaster Management Committee and the National Disaster Management Office (NDMO) located in the Office of the Chief Secretary.
In the past, national effort was focused heavily on conventional consequence management. In early 2000 the national approach was reformed to include more risk based management approach and the concept of disaster risk reduction and prevention was first introduced with the passing of the Disaster Risk Management National Action Plan (DRM-NAP) in 2008. The plan is aligned both with the international and regional policy frameworks such as the Hyogo Framework for Action and the Regional Strategy for Disaster Risk Reduction.
The Joint National Action Plan for Disaster Risk Management and Climate Change (JNAP) was later developed through a country-wide, national multi-stakeholder consultation process which took into account the broad odjectives of the Climate Change Policy Framework and the DRM-NAP. In 2014 the President and Cabinet endorsed the JNAP. The joint strategic approach will provide a comprehensive guide for implementation of risk reduction measures relating to disasters and climate change.
Implementation of JNAP across key sectors suffers from persistent capacity constraints, both in terms of human and financial resources. While local governments for Majuro and Ebeye have disaster risk reduction initiatives in place, there is a need for more robust disaster risk reduction, in emergency preparedness, response and recovery plans will be aligned with the Sendai approach of building back better during any reconstruction plans. Outside of the more urbanized areas, disaster risk management has been primarily reactive than proactive. There are, however, currently initiatives under JNAP to mitigate risk of all hazards through the JNAP’s 6 strategic goals.
Regulatory framework“The Vision 2018: The Strategic Development Plan Framework 2003–2018” establishes a 15-year framework of priorities and strategies. This is to be followed by master plans of ministries and statutory agencies, which are mandated under Vision 2018 and focus on major policy areas, and action plans that are tailored toward the achievement of the national vision. These will elaborate on programs and projects with the appropriate costing. The national goal is summarized as increased self-reliance, renewed economic growth, equitable distribution, improved public health, improved educational outcomes, international competitiveness, and environmental sustainability. Priority sectors are education, health, environment, and infrastructure development and maintenance. The National Strategic Plan is an example of an inter-sectoral action plan.
After the enactment of the Disaster Assistance Act in 1987, RMI saw the passing of a Hazard Mitigation Plan in 1994, a National Disaster Manual, and an Airport Disaster Plan. A Drought Disaster Plan was passed in 1996, followed by the drafting of a revised National Disaster Management Plan in 1997. One of the later legislative activities on the DRM front was the development of a Standard Hazard Mitigation Plan in 2005.
More recently, the government, in conjunction with SPC-Geoscience Division, the Secretariat of the Pacific Regional Environment Programme, the United Nations and other partners, has developed several institutional frameworks, including the following:
• SendaiFrameworkforDisasterRiskReduction2015–2030

Republic of the Marshall Islands 75Republic of the Marshall Islands
Post Disaster Needs Assessment of the 2015-2016 Drought | DiSaStEr riSK maNaGEmENt Post Disaster Needs Assessment of the 2015-2016 Drought | DiSaStEr riSK maNaGEmENt
• PacificDisasterRiskReductionandDisasterManagementFrameworkforAction(RegionalFrameworkfor Action) 2005–2015
• NationalActionPlanforDisasterRiskManagement2008–2018
• MarshallIslandsEmergencyResponsePlan,2010
• PolicyforClimateChangeAdaptation,2006
• JointNationalActionPlan(JNAP)forDisasterRiskManagementandClimateChangeAdaptation,2011–2018
10.2 Institutional arrangementsThe National Disaster Management Office
The National Disaster Management Office (NDMO) is the government agency responsible for the coordination of disaster risk management. It is located within the Chief Secretary’s Office and the Director reports through the Deputy Chief Secretary to the Chief Secretary. NDMO’s main responsibilities are to assist the Chief Secretary in the exercise of functions under the Disaster Assistance Act 1987, including capacity building and institutional strengthening at national and municipal/island level with respect to prevention, mitigation, preparedness, response and recovery. For instance, NDMO has started to train outer island focal points to increase awareness and capacity throughout the DRM cycle and has also established disaster committees in remote outer islands to act as the focal point and first responders to disaster. Temporary officers are used if and when full-time positions cannot be accommodated.
NDMO has four full-time staff with one stationed at Ebeye. The current organizational chart is shown in Figure 18.
Figure 18: National Disaster Management Office
President
Minister in Assistance
Chief Secretary
Deputy Chief Secretary, Majuro
Director NDMO
Joint National Action Plan Coordinator Administrative Assistant II EbeyeDisaster Assistance Officer
Outer islands focal points/ Disaster Committee
Outer islands focal points/ Disaster Committee
Temporary officers
Deputy Chief Secretary, Ebeye
National Disaster Committee

Republic of the Marshall Islands 76 Republic of the Marshall Islands
Post Disaster Needs Assessment of the 2015-2016 Drought | DiSaStEr riSK maNaGEmENt
Local agenciesDisaster risk management has been mainstreamed into various agencies and programmes. The Ministry of Internal Affairs is the administrative coordinator for local councils established in the each of the habited islands and headed by a mayor. Council activities include local police services, solid waste collection, and maintenance of local roads. The ministry is a key partner in disaster risk reduction and management issues at national and local levels, such as through the Annual Mayors’ Conferences, the Local Government Division, Marshall Islands Mayors’ Association and mobile teams.
A community-based area management framework called Reimaanlok Conservation Strategy provides relevant agencies with a collection of tools for community engagement to leverage cultural heritage for development, including disaster risk management, thereby enhancing resilience. The strategy takes an ecosystem approach in addressing community-based disaster risk reduction issues through conservation efforts implemented by the Coastal Management Advisory Committee.
10.3 Mechanisms and activities The Joint National Action Plan for Disaster Risk Management and Climate Change (JNAP) was developed in a multi-stakeholder process conducted in 2010–2011. The JNAP matrix aligns with actions identified under the National Action Plan for Disaster Risk Management 2008–2018 and the National Climate Change Policy Framework to provide a comprehensive guide for implementation of risk reduction measures relating to disaster and climate change. The implementation and monitoring of the progress of JNAP across key sectors requires significant increases in human, technical and financial resources.
Complementing the national measures there are a number of risk reduction partnership projects. These include: UNDP-GEF funds for the Pacific Adaptation to Climate Change project focusing on water resources; the East-West Centre, Australia’s Pacific Climate Change Science Program; and the EU funds from the EDF10 funding stream. Funding support is also provided by Compact Funding and USAID, ROC Taiwan, the Australian Department of Foreign Affairs and Trade and its regional partners, including SPC Geo Science Division, ADB, WHO, IOM, Marshall Islands Red Cross/IFRC, and the Secretariat of the Pacific Regional Environment Programme; and the Bureau of Oceans and International Environmental and Scientific Affairs grant through the US Embassy in Majuro.
10.4 The responseThe Office of the Chief Secretary and the Emergency Operations Centre (EOC) are leading the disaster response with the five national clusters (water and sanitation, health, logistics, food security and agriculture, and infrastructure and shelter) to identify and meet immediate needs emerging from the El Niño-induced extended drought. The government coordinated a joint preliminary damage assessment with the support of an assessment team from the US government comprising the WASH (water, sanitation and hygiene) sector, agriculture, health, logistics, the Federal Emergency Management Agency and the United States Agency for International Development/Office of US Foreign Disaster Assistance. The government and international partners responded to the drought disaster in various ways, including financial, human resource, materials and technical assistance. Among others, the UN system coordinated and provided support for emergency needs assessment as well as non-food commodities. For swift response RMI has setup a Disaster Assistance Emergency Fund and a Contingency Fund.
Every fiscal year the RMI and US governments each contribute between USD 300,000.00 and USD 500,000.00 to the Disaster Assistance Emergency Fund. This is a matching grant and is used only when the RMI government declares a state of emergency or disaster and the US government concurs. The Contingency Fund is resourced annually only by the RMI Government with USD 200,000.00 appropriated each fiscal year. This fund can be tapped into for any emergency, including disasters. The decision to use the Contingency Fund rests solely with the RMI Government.
Emergency Operation CenterThe National Emergency Operations Centre (EOC), under the direction of the Chief Secretary, demonstrated a high level of commitment and leadership to ensure timely response to the affected populations as the El Niño drought effects became apparent across the country. The EOC was activated upon the Declaration of a State of

Republic of the Marshall Islands 77Republic of the Marshall Islands
Post Disaster Needs Assessment of the 2015-2016 Drought | DiSaStEr riSK maNaGEmENt Post Disaster Needs Assessment of the 2015-2016 Drought | DiSaStEr riSK maNaGEmENt
Emergency on February 3rd, 2016 and coordinated the four activated clusters (out of a total of five): Water and Sanitation (WASH), Health, Logistics, and Food Security and Agriculture. There are no terms of reference for the clusters, the Emergency Operation Centre or other DRM structures. Under the leadership of the NDMO, rapid needs assessments and deployment of WASH supplies to meet immediate lifesaving needs were coordinated. The National Disaster Management Office (NDMO) utilizes the EOC and its clusters to provide recommendations to the National Disaster Committee for decision making and further recommendations to Cabinet. In addition, the NDMO has begun to establish outer island disaster committees and disaster focal points with assistance from the International Organization for Migration. The focal points and committees will be responsible for relaying early warnings, assisting the community to prepare for disasters and reporting through standardized reporting forms. There are still many communities that need to establish committees and strengthen focal points.
Cluster systemDuring the 2013 drought response in the northern Islands of RMI, the national cluster system was introduced. Since 2013, the system has been tested during multiple medium and small size events, such as the 2014 inundations and Typhoon Nangka, which initiated the creation of the infrastructure and shelter cluster. Disaster response is coordinated through five clusters that can be activated when the need arises. These clusters are: water and sanitation (WASH), health, logistics, food security and agriculture, and the infrastructure and shelter cluster, thus, the national cluster system has been institutionalized into the disaster risk management operations structure. Different clusters have different levels of operational capacity depending on how often they have been activated and their composition. The WASH cluster was the most active cluster during the 2016 El Niño drought response, and also has the largest membership, bringing together government agencies, non-governmental organizations and civil society.
El Niño 2016 forecasting and the early warning systemThe RM Weather Service Office (WSO) is reasonably well equipped and staffed by local staff. The office operations include undertaking a full cycle of manual synoptic and upper-air observations transmitted to the Global Telecommunication System/Integrated WMO Information System (WSO), and communicating warnings developed by National Oceanographic and Atmospheric Administration: National Weather Service (NOAA NWS) to RMI authorities and communities. Detection of the El-Niño and early warnings were well received and disseminated to the RMI authorities and communities by the WSO well ahead of time. Through its established support from NOAA NWS, the WSO received forecasts, rainfall outlooks and drought monitoring information. Both long-term and short-term rainfall outlooks and predictions were also provided by the NOAA’s Pacific ENSO Applications Climate Centre and Guam Forecast Office. These were of help during the identification of the atolls that were forecasted to be hardest hit. Unfortunately, the forecast and actual impact were very different, which highlights the need for RMI authorities to start analyzing the real-time actual rainfall and temperature data to better target the response, whilst recognizing the lack of analyzing capacity in country. In addition, spatial distribution of automated weather stations is to be improved.
10.5 Losses in the disaster risk management sectorThe disaster risk management sector losses are mostly covered within:
• thesocialsector;
• theproductivesector;
• theinfrastructuresector;
• cross-cuttingissues;and
• themacro-socialimpact.
Direct costs incurred for response activities that are not captured in the sectors mentioned above are included in Table 28, yet a breakdown of costs for activities proved impossible in the limited timeframe of this assessment and has thus been excluded from the total damage and losses, likely causing the total losses to be underestimated.
The total of for the combined sectors in disaster risk reduction and separately for disaster risk management needs can be viewed in Annexes 8 and 9 respectively.
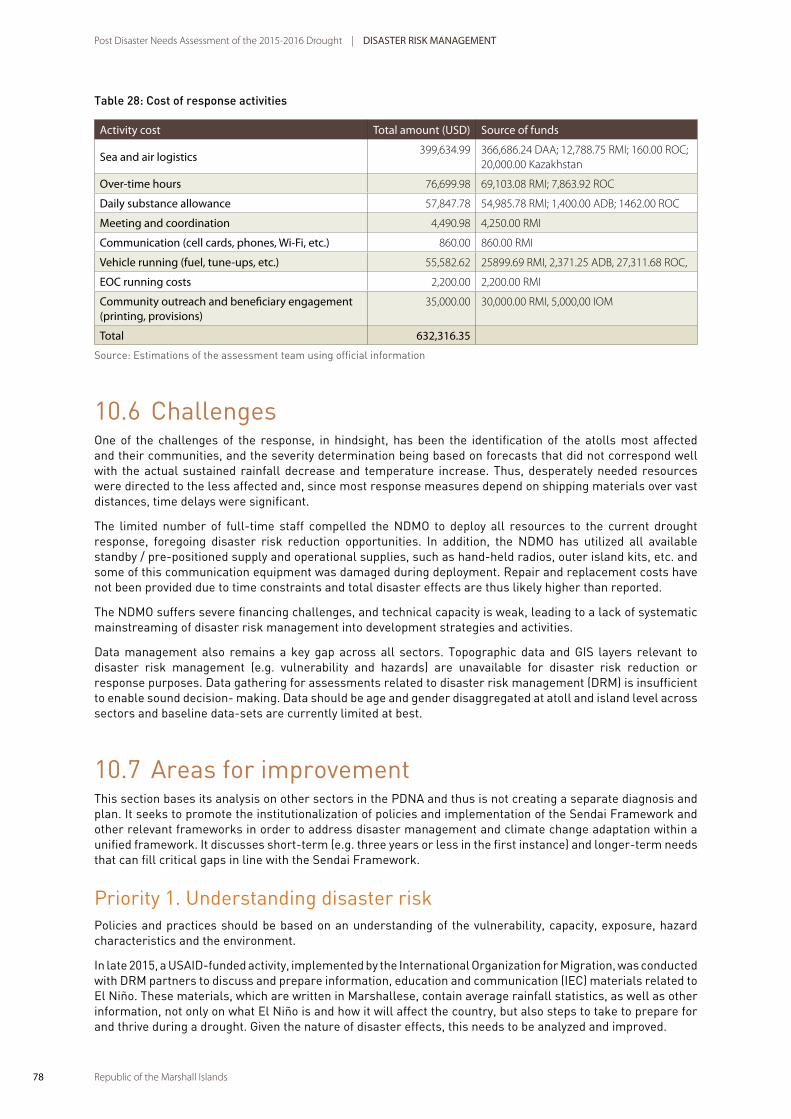
Republic of the Marshall Islands 78 Republic of the Marshall Islands
Post Disaster Needs Assessment of the 2015-2016 Drought | DiSaStEr riSK maNaGEmENt
Table 28: Cost of response activities
activity cost total amount (uSD) Source of funds
Sea and air logistics399,634.99 366,686.24 DAA; 12,788.75 RMI; 160.00 ROC;
20,000.00 Kazakhstan
Over-time hours 76,699.98 69,103.08 RMI; 7,863.92 ROC
Daily substance allowance 57,847.78 54,985.78 RMI; 1,400.00 ADB; 1462.00 ROC
meeting and coordination 4,490.98 4,250.00 RMI
communication (cell cards, phones, Wi-Fi, etc.) 860.00 860.00 RMI
vehicle running (fuel, tune-ups, etc.) 55,582.62 25899.69 RMI, 2,371.25 ADB, 27,311.68 ROC,
EOc running costs 2,200.00 2,200.00 RMI
community outreach and beneficiary engagement (printing, provisions)
35,000.00 30,000.00 RMI, 5,000,00 IOM
total 632,316.35
Source: Estimations of the assessment team using official information
10.6 ChallengesOne of the challenges of the response, in hindsight, has been the identification of the atolls most affected and their communities, and the severity determination being based on forecasts that did not correspond well with the actual sustained rainfall decrease and temperature increase. Thus, desperately needed resources were directed to the less affected and, since most response measures depend on shipping materials over vast distances, time delays were significant.
The limited number of full-time staff compelled the NDMO to deploy all resources to the current drought response, foregoing disaster risk reduction opportunities. In addition, the NDMO has utilized all available standby / pre-positioned supply and operational supplies, such as hand-held radios, outer island kits, etc. and some of this communication equipment was damaged during deployment. Repair and replacement costs have not been provided due to time constraints and total disaster effects are thus likely higher than reported.
The NDMO suffers severe financing challenges, and technical capacity is weak, leading to a lack of systematic mainstreaming of disaster risk management into development strategies and activities.
Data management also remains a key gap across all sectors. Topographic data and GIS layers relevant to disaster risk management (e.g. vulnerability and hazards) are unavailable for disaster risk reduction or response purposes. Data gathering for assessments related to disaster risk management (DRM) is insufficient to enable sound decision- making. Data should be age and gender disaggregated at atoll and island level across sectors and baseline data-sets are currently limited at best.
10.7 Areas for improvementThis section bases its analysis on other sectors in the PDNA and thus is not creating a separate diagnosis and plan. It seeks to promote the institutionalization of policies and implementation of the Sendai Framework and other relevant frameworks in order to address disaster management and climate change adaptation within a unified framework. It discusses short-term (e.g. three years or less in the first instance) and longer-term needs that can fill critical gaps in line with the Sendai Framework.
Priority 1. Understanding disaster riskPolicies and practices should be based on an understanding of the vulnerability, capacity, exposure, hazard characteristics and the environment.
In late 2015, a USAID-funded activity, implemented by the International Organization for Migration, was conducted with DRM partners to discuss and prepare information, education and communication (IEC) materials related to El Niño. These materials, which are written in Marshallese, contain average rainfall statistics, as well as other information, not only on what El Niño is and how it will affect the country, but also steps to take to prepare for and thrive during a drought. Given the nature of disaster effects, this needs to be analyzed and improved.
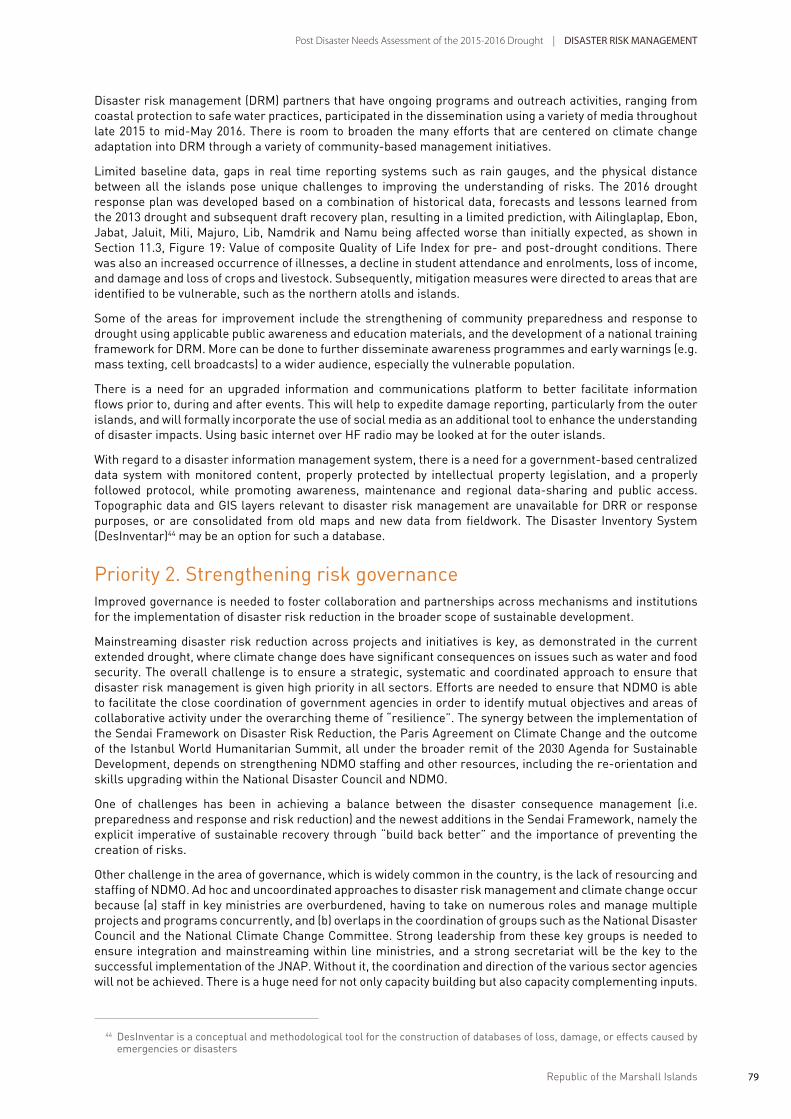
Republic of the Marshall Islands 79Republic of the Marshall Islands
Post Disaster Needs Assessment of the 2015-2016 Drought | DiSaStEr riSK maNaGEmENt Post Disaster Needs Assessment of the 2015-2016 Drought | DiSaStEr riSK maNaGEmENt
Disaster risk management (DRM) partners that have ongoing programs and outreach activities, ranging from coastal protection to safe water practices, participated in the dissemination using a variety of media throughout late 2015 to mid-May 2016. There is room to broaden the many efforts that are centered on climate change adaptation into DRM through a variety of community-based management initiatives.
Limited baseline data, gaps in real time reporting systems such as rain gauges, and the physical distance between all the islands pose unique challenges to improving the understanding of risks. The 2016 drought response plan was developed based on a combination of historical data, forecasts and lessons learned from the 2013 drought and subsequent draft recovery plan, resulting in a limited prediction, with Ailinglaplap, Ebon, Jabat, Jaluit, Mili, Majuro, Lib, Namdrik and Namu being affected worse than initially expected, as shown in Section 11.3, Figure 19: Value of composite Quality of Life Index for pre- and post-drought conditions. There was also an increased occurrence of illnesses, a decline in student attendance and enrolments, loss of income, and damage and loss of crops and livestock. Subsequently, mitigation measures were directed to areas that are identified to be vulnerable, such as the northern atolls and islands.
Some of the areas for improvement include the strengthening of community preparedness and response to drought using applicable public awareness and education materials, and the development of a national training framework for DRM. More can be done to further disseminate awareness programmes and early warnings (e.g. mass texting, cell broadcasts) to a wider audience, especially the vulnerable population.
There is a need for an upgraded information and communications platform to better facilitate information flows prior to, during and after events. This will help to expedite damage reporting, particularly from the outer islands, and will formally incorporate the use of social media as an additional tool to enhance the understanding of disaster impacts. Using basic internet over HF radio may be looked at for the outer islands.
With regard to a disaster information management system, there is a need for a government-based centralized data system with monitored content, properly protected by intellectual property legislation, and a properly followed protocol, while promoting awareness, maintenance and regional data-sharing and public access. Topographic data and GIS layers relevant to disaster risk management are unavailable for DRR or response purposes, or are consolidated from old maps and new data from fieldwork. The Disaster Inventory System (DesInventar)44 may be an option for such a database.
Priority 2. Strengthening risk governanceImproved governance is needed to foster collaboration and partnerships across mechanisms and institutions for the implementation of disaster risk reduction in the broader scope of sustainable development.
Mainstreaming disaster risk reduction across projects and initiatives is key, as demonstrated in the current extended drought, where climate change does have significant consequences on issues such as water and food security. The overall challenge is to ensure a strategic, systematic and coordinated approach to ensure that disaster risk management is given high priority in all sectors. Efforts are needed to ensure that NDMO is able to facilitate the close coordination of government agencies in order to identify mutual objectives and areas of collaborative activity under the overarching theme of “resilience”. The synergy between the implementation of the Sendai Framework on Disaster Risk Reduction, the Paris Agreement on Climate Change and the outcome of the Istanbul World Humanitarian Summit, all under the broader remit of the 2030 Agenda for Sustainable Development, depends on strengthening NDMO staffing and other resources, including the re-orientation and skills upgrading within the National Disaster Council and NDMO.
One of challenges has been in achieving a balance between the disaster consequence management (i.e. preparedness and response and risk reduction) and the newest additions in the Sendai Framework, namely the explicit imperative of sustainable recovery through “build back better” and the importance of preventing the creation of risks.
Other challenge in the area of governance, which is widely common in the country, is the lack of resourcing and staffing of NDMO. Ad hoc and uncoordinated approaches to disaster risk management and climate change occur because (a) staff in key ministries are overburdened, having to take on numerous roles and manage multiple projects and programs concurrently, and (b) overlaps in the coordination of groups such as the National Disaster Council and the National Climate Change Committee. Strong leadership from these key groups is needed to ensure integration and mainstreaming within line ministries, and a strong secretariat will be the key to the successful implementation of the JNAP. Without it, the coordination and direction of the various sector agencies will not be achieved. There is a huge need for not only capacity building but also capacity complementing inputs.
44 DesInventar is a conceptual and methodological tool for the construction of databases of loss, damage, or effects caused by emergencies or disasters

Republic of the Marshall Islands 80 Republic of the Marshall Islands
Post Disaster Needs Assessment of the 2015-2016 Drought | DiSaStEr riSK maNaGEmENt
Another challenge, again a common challenge in the country, is the gap in effective linkages between national government and local level governments, civil society, and the private sector. A number of local councils face resource shortfalls and are unable to attend to their critical services such as the management of water, sanitation and hygiene – sub-sectors that will be most affected in future cases of water-related disasters. This could lead to a potential health disaster and impede resilience. The national and local governments need to improve coordination and formulate a common vision for risk reduction. In many respects, this will require government to extend the participatory approaches being practiced during the development of the various disaster risk management documents and plans into the implementation phase.
Since the 2013 drought response, the introduction of clusters and the designation of government agencies’ leads has improved partnerships across the various government agencies and non-government organisations (NGOs). One of the key challenges to the coordination is the lack of ability of partners to sustain their engagement through dedicated and knowledgeable staff from the beginning to the end of the disaster risk management processes. The high level of participation in cluster meetings in the initial days of emergency usually drops as the responders have their own ‘regular jobs’.
There is a need for increased participation and engagement in the private sector, NGOs and civil society organizations across the sectors. Many of them are awaiting guidance on how to become more engaged. It is important that the strategic window in the post-onset of the 2016 drought be utilized as a key opportunity to promote their engagement in whole facets and cycles of disaster risk management. Similarly, there is a unique opportunity for the government to leverage the strong partnerships and communication that has been built with international partners such as Economic and Social Commission for Asia and the Pacific, the International Organization for Migration, the International Federation of Red Cross and Red Crescent Societies, Pacific Community, UN Development Programme and the UN Office for the Coordination of Humanitarian Affairs.
There is a strategic window to leverage the unique and special relationship between RMI and the US Government in the area of emergency response under Article X of the Compact of Free Association. The mechanism that was outlined into an operational blue-print during the 2013 drought has been better understood and put into use during the 2016 drought, which led to faster and improved communication and programme implementation through USAID and IOM. A better understanding of the financial mechanisms available would further benefit the NDMO and RMI as a whole.
Other areas where risk governance could be strengthened include: the need to further develop procedures for the disaster warning and monitoring system; validation and promotion of indigenous knowledge to enhance good governance through increased participation of community decision making; and the engagement of women and other marginalized groups such as youth, the elderly and the disabled in community DRM decision-making processes.
Administrative data collection, compilation and analysis systems in all sectors, including education and health, should be reviewed to identify the changes required to provide timely and reliable sex disaggregated statistics. Capacity strengthening is then required so that the data are then analyzed, interpreted and disseminated in a timely and appropriate manner to the affected groups.
Priority 3. Investing in disaster risk reduction for resiliencePublic and private investment in structural and non-structural measures to enhance resilience as drivers of innovation, growth and job creation
The Marshall Islands already face many challenges associated with gaining economic and fiscal self-sufficiency, and these are made greater by the occurrence of natural disasters. The 2016 extended drought demonstrated the extent to which the government’s post-disaster budget execution process, which relies on a variety of financial tools to access immediate post-disaster cash resources, is constrained by the size of the economy. Moreover, not all currently followed procedures are embedded within the financial legislature, including those related to the unique requirements of post-disaster financing, i.e. full recovery.
In FY 2016, the government established the Disaster Fund with approximately USD 1.4 million for drought response. Such ex-post financial measures take time to mobilize and require cabinet approval following the declaration of disaster. The actual reprogramming of funds between ministries can take even longer. Consequently, the government needs to rely on donor support to fund post-disaster expenditure from various sources, including USA, ROC Taiwan, Australia, ADB and India.
The government needs to develop a comprehensive disaster risk financing strategy, which includes consideration of national budget, private funding sources, funding and grants from international development partners and

Republic of the Marshall Islands 81Republic of the Marshall Islands
Post Disaster Needs Assessment of the 2015-2016 Drought | DiSaStEr riSK maNaGEmENt Post Disaster Needs Assessment of the 2015-2016 Drought | DiSaStEr riSK maNaGEmENt
others. Such a strategy should also take into consideration the contingency liability placed on the national budget – based on the disaster risk profile, past disaster expenditure, and calculation of damage and losses provided by this PDNA – and thereby strengthen the overall contingency planning and budgeting capacity.
The government feels the need to establish domestic sources of finance for post-disaster relief in light of uncertainty surrounding international assistance. This includes the potential expansion of the coverage of the Pacific Catastrophe Risk Assessment and Financing Initiative (PCRAFI) into drought-induced hazards. RMI’s participation in the disaster risk insurance will provide additional availability of disaster risk financing, and advocacy for the creation of a new insurance product to cover drought is important, but its triggers need careful deliberation.
Investment in climate resilience, such as water infrastructure improvement, will also be needed to enhance the resilience level and thus reduce the burden on disaster response finance.
To this end, there is a need to identify the gaps in the current financing mechanism. Measures are needed to establish additional post-disaster financing mechanisms, including a climate resilience project that will have a contingency emergency response component, which release could be triggered by the declaration of a national emergency. This could be designed to complement the PCRAFI insurance program, as well as the national contingency funds. Furthermore, new insurance products could also be explored from private insurance service providers to the private sector, including individuals, households and businesses.
In term of accountability, there is room to strengthen the government’s capacity for project management, coordination, monitoring and evaluation. This covers areas such as procurement, financial management, and contract and project management.
PDNA also gives ample options to apply resilience building activities into existing and future projects and programmes.
Priority 4. Enhancing risk managementStrengthen preparedness, response and recovery at all levels as a critical opportunity for disaster risk reduction and its integration into development
Climate-proofing measures. The government is implementing various sustainable development projects, including those that seek to bolster water supply systems, such as individual and community water-harvesting projects, in order to reduce the risks from future droughts. There is a golden opportunity to optimize the synergy between disaster risk reduction and climate change adaptation, and demonstrate them in actual on-the-ground disaster management projects. Bringing together disaster mitigation and considerations of climate variability, or “climate-proofing measures”, will go a long way to enhancing water supply systems.
Incident command system. The limited number of staff available prevents a fully functional common incident management system within NDMO. Also, there is a lack of clarity of roles, responsibilities and empowerment of individuals who are in key decision-making positions. Consequently, all operations and recommendations are passed through NDMO to the Chief Secretary and NDC for final decision-making. To remedy this, there needs to be more staff with better capacity in order to develop a fully functional incident command system with organizational function descriptions and standard operating procedures in place.
Disaster assessment system. During the early stages of the drought, the initial information was gathered through the meteorological forecast, combined with field visits and reporting from outer islands via the NTA 6.5 short wave radio. In the process of standardizing assessment forms for slow onset disaster with technical assistance from IOM and Marshall Islands Red Cross, NDMO updated the assessment forms that were used during the 2013 into “drought situational overview forms” to monitor and report on the 2016 drought. There is, however, much room for improvement in standardizing the assessment forms, communication mechanisms, the writing of reports and data collation, as well as familiarization with needs assessment forms in order to strengthen reporting mechanisms and timely response. Data can then be verified against actual rainfall and temperature data from the Meteorological Office.
Relief tracking system. The EOC currently has limited capacity for a central level comprehensive relief tracking system. There is lack of staff to conduct response activities and even fewer who have the capacity to manage a comprehensive real-time tracking of relief activities from all clusters. Additionally, there is the need for individual agencies that support the emergency response to report their planned and completed activities to clusters and keep detailed records within their own organizations. Terms of reference (ToRs) and legislation need to be updated to reflect these assumed responsibilities.

Republic of the Marshall Islands 82 Republic of the Marshall Islands
Post Disaster Needs Assessment of the 2015-2016 Drought | DiSaStEr riSK maNaGEmENt
Recovery coordination. The National Disaster Council (NDC) has various standing committees and working groups that are supposed to be relevant throughout the cycle of disaster risk management. There is the need to harmonize these entities to ensure that the coordination mechanisms under the cluster system that were used during response will also be utilized in the drought recovery coordination under the direction and coordination of NDMO. ToRs need to be developed for NDC, the clusters, standing committees, and the Disaster Committee (DisCom), as well as the responsibilities of mayors and other community representatives in the outer islands.
10.8 Recovery needs for disaster risk managementThere is a need for continued focus on the preparedness phase of the disaster risk management cycle to ensure that, when emergencies occur, there are effective and tested response mechanisms in place. A majority of the recovery needs are outlined in JNAP. Tables 29, 30 and 31 summarizes the most urgent and pressing needs to not only implement JNAP, but also to recover from the 2016 drought and be able to cope with future events. This includes an increased number of dedicated staff at NDMO who have the technical capacity work with technical assistance organizations such as IOM, SPC, the Red Cross and the UN to improve standard operating procedures and planning, strengthen communication and early warning mechanisms, and coordinate responses (including strengthened information management). Much work has been done and there have been improvements over the past several emergencies, yet there is much still to be done.
Table 29: Disaster risk management needs 2017
Disaster risk management Program of activity value (uSD) responsible agency
Establish a drought recovery plan 2017–2019
Establish drought recovery plan 2017–2019 with affected community participation
16,000 Office of the Chief Secretary
review the enactment of the Disaster assistance act of 1987
Legislative review and update of the act and related plans and manuals
24,000 Office of the Chief Secretary, Legislative Agency/Department
Early warning system (EWS) Standard operating procedures for warnings and dissemination reviewed; install automated rain gauges for equal geographic coverage
10,000 Weather Service Office (WSO)
review and strengthen damage assessment
Improve damage assessment forms and data collection mechanisms and ensure value-adding of the forms to inform both response and recovery (e.g. PDNA process)
8,000 Office of the Chief Secretary
Enhance analysis capacity of met Office
Enhance data manipulation capacity of technical staff
9,000 WSO
Formalize coordination and sharing of information among stakeholders, e.g. NDmO (some real-time), health and agriculture sectors
Administrative data collection, compilation and analysis systems in all sectors, including meteorology, education and health, to be strengthened and broadened to include analysis and visualization
119,000 WSO, Office of the Chief Secretary; Economic Policy, Planning and Statistics Office
capacity building Establishment and/or strengthening of outer island disaster committees, including resilience enhancements, evacuation drills and disaster plan updates in eight inhabited locations (cover all in three years)
100,000 JNAP, NDMO
Facilities improvements in the Emergency Operations center
Safety equipment, outer island radio, other communication equipment and office hardware (computer, printers, etc.)
100,000 NDMOOffice of the Chief Secretary
Outer island communication equipment for early warning
Feasibility and implementation of EWS communication enhancements, e.g. Chatty Beetles45
50,000 WSONDMO
45 A terminal and system designed to provide weather alerts and notifications to remote locations where communication options are limited
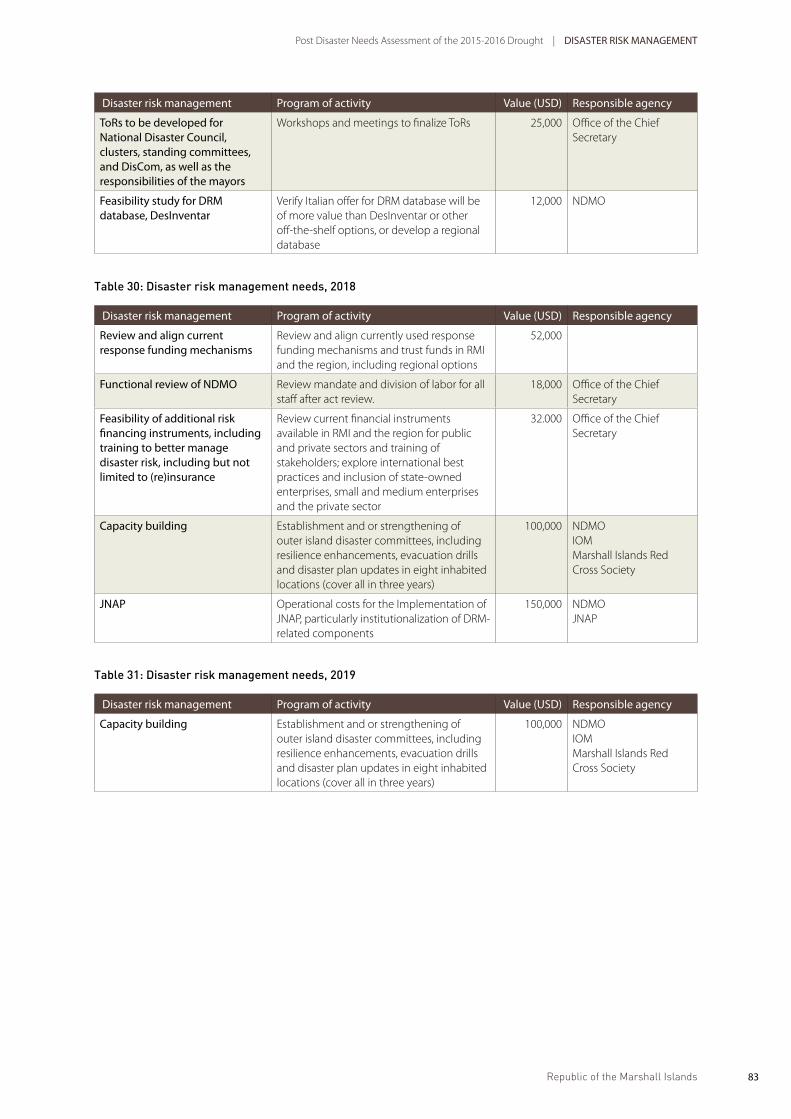
Republic of the Marshall Islands 83Republic of the Marshall Islands
Post Disaster Needs Assessment of the 2015-2016 Drought | DiSaStEr riSK maNaGEmENt Post Disaster Needs Assessment of the 2015-2016 Drought | DiSaStEr riSK maNaGEmENt
Disaster risk management Program of activity value (uSD) responsible agency
tors to be developed for National Disaster council, clusters, standing committees, and Discom, as well as the responsibilities of the mayors
Workshops and meetings to finalize ToRs 25,000 Office of the Chief Secretary
Feasibility study for Drm database, Desinventar
Verify Italian offer for DRM database will be of more value than DesInventar or other off-the-shelf options, or develop a regional database
12,000 NDMO
Table 30: Disaster risk management needs, 2018
Disaster risk management Program of activity value (uSD) responsible agency
review and align current response funding mechanisms
Review and align currently used response funding mechanisms and trust funds in RMI and the region, including regional options
52,000
Functional review of NDmO Review mandate and division of labor for all staff after act review.
18,000 Office of the Chief Secretary
Feasibility of additional risk financing instruments, including training to better manage disaster risk, including but not limited to (re)insurance
Review current financial instruments available in RMI and the region for public and private sectors and training of stakeholders; explore international best practices and inclusion of state-owned enterprises, small and medium enterprises and the private sector
32.000 Office of the Chief Secretary
capacity building Establishment and or strengthening of outer island disaster committees, including resilience enhancements, evacuation drills and disaster plan updates in eight inhabited locations (cover all in three years)
100,000 NDMOIOMMarshall Islands Red Cross Society
JNaP Operational costs for the Implementation of JNAP, particularly institutionalization of DRM-related components
150,000 NDMOJNAP
Table 31: Disaster risk management needs, 2019
Disaster risk management Program of activity value (uSD) responsible agency
capacity building Establishment and or strengthening of outer island disaster committees, including resilience enhancements, evacuation drills and disaster plan updates in eight inhabited locations (cover all in three years)
100,000 NDMOIOMMarshall Islands Red Cross Society

Republic of the Marshall Islands 84

Republic of the Marshall Islands
MACRO-SOCIAL IMPACT
85

Republic of the Marshall Islands 86 Republic of the Marshall Islands
Post Disaster Needs Assessment of the 2015-2016 Drought | Executive Summary
Republic of the Marshall Islands
Post Disaster Needs Assessment of the 2015-2016 Drought | Executive Summary
Republic of the Marshall Islands
Post Disaster Needs Assessment of the 2015-2016 Drought | Executive Summary
EMPLOYMENT, LIVELIHOODS AND SOCIAL IMPACT
11
86
Republic of the Marshall Islands 87Republic of the Marshall Islands
Post Disaster Needs Assessment of the 2015-2016 Drought | Executive Summary Post Disaster Needs Assessment of the 2015-2016 Drought | EmPLOymENt, LivELiHOODS aND SOciaL imPact
Republic of the Marshall Islands
Post Disaster Needs Assessment of the 2015-2016 Drought | Executive Summary
11.1 SummaryThe 2016 drought in the Marshall Islands (RMI) has affected 53,158 persons or 7,738 households located across 23 permanently inhabited atolls.
It is estimated that, during FY 2016, approximately 7,084 work days (or its equivalent of 27 full-time jobs) and USD 71,120 of personal income have been lost as a net result of a drought-induced shift in production. Whilst output losses in agriculture (–11.6%) and manufacturing (–5.4%) caused a decline in employment and income, the commercial sector appears to have made a modest gain (+ 1.0%) through increased sales of food and beverage items..46
In absolute numbers, the highest personal income loss has been endured by workers in the urban islands (USD 54,910), followed by workers in the near and serviced islands, USD 14,877 and USD 2,699 respectively. Workers in the outer islands have made a modest gain in personal income of USD 766 due to a temporary increase of commercial activities.47 However, this geographical distribution of lost personal income is to a large extent a reflection of the widespread income inequality in the islands that preceded the drought (workers on atolls close to the urban centers are paid higher wages and thus lose more). In relative terms, low-paid and subsistence workers in the outer islands are expected to suffer disproportionately, as pre-disaster per capita income and the drought-induced per capita losses are negatively correlated: households on Jabat Atoll have lost the equivalent of 67% of their annual per capita income, and households in Lae and Wotho approximately 50%.
As a result, poverty and hardship are especially likely to increase among youth with low educational attainment and/or irregular employment in the urban centers and low-income households in the outer islands. Women-headed households with care-giving responsibilities due to high-rates of adolescent fertility and/or diabetes-related disabilities are of particular concern.
An estimated USD 670.00 is needed to provide a comprehensive employment and livelihoods recovery strategy. This includes an emphasis on the development of national policies and plans and demand-driven programmes on skills and entrepreneurship development, including a focus on strengthening existing institutions that deliver these services. In the long term, coherent policy action is needed such as a national employment policy and national action plans on youth employment to: (a) create resilience at the household level towards climate-induced income shocks; (b) to create sufficient employment opportunities for RMI’s aspirant youth’ and (c) to prepare RMI’s labor market for the termination of the Compact agreement with the USA by 2023.
11.2 Pre-disaster contextNational trends: Geographic isolation, rapid urbanization, high population growth, inequality and a lingering transition from subsistence production to the cash-economy create a challenging labor market environment in the country. Combined with a breakdown of traditional community-based social protection systems, reoccurring climate-induced income shocks, and slow economic growth rates since the onset of the global financial crisis, Marshallese households have experienced difficulties in making a decent living. At the macro level this is reflected by indicators such as stagnant levels of per capita income and insufficient job creation. Similar insights are gained at the micro level where, during a 2006 community survey, a number of households stated they perceived their quality of life as “worse” or “much worse” compared to only three years before. As the termination of the US Compact Agreement in 2023 is approaching rapidly, policy makers face serious administrative, economic and social challenges.
RMI’s labor force: The 2011 census reported a working-age population (15 to 64 years) of 30,800 persons, which is 58% of RMI’s total population. Of these, 40% were classified as economically active, forming an employed workforce of 12,647 – 65% males and 35% females. According to the 2015 Skills Demand Survey, the Marshallese labor force can generally be characterized by low levels of literacy and numeracy, poor work habits, high absenteeism and male dominance. A low employment to population ratio of 0.41 indicates high levels of under- and unemployment.
Employment and unemployment: Unemployment is predominantly an urban phenomenon, as the vast majority of Marshallese households in the outer islands continue to engage in a subsistence economy. A dramatic drift of population from the outer islands to the urban centers of Majuro and Ebeye has rendered RMI the most
46 These estimations refer exclusively to the isolated impact of the FY 2016 drought on employment and personal income. Other exogenous factors that occurred simultaneously but were caused by the drought, such as the higher purchases of copra, may provoke different estimations during subsequent analyses.
47 The categorisation of islands aligns with the 2015 Socio-Economic Vulnerability Assessment of the RMI by Abbott and Gardner. The categories are as follows: Urban islands: Majuro & Kwajalein. Near islands: Arno, Aur & Mili. Serviced islands: Enewetak, Jaluit, Kili, Likiep & Wotje. Outer islands: Ailinglaplap, Ailuk, Ebon, Jabat, Lib, Maloelap, Mejit, Namdrik, Namu, Lae, Ujae,Utirik and Wotho.

Republic of the Marshall Islands 88 Republic of the Marshall Islands
Post Disaster Needs Assessment of the 2015-2016 Drought | EmPLOymENt, LivELiHOODS aND SOciaL imPact
rapidly urbanizing country in the Pacific. In 2011, 70% of the population and 80.5% of all young people (15 to 24 years) lived in the two urban centers, resulting in overcrowded and poor quality housing conditions and a staggering unemployment rate of 35.6% (25.1% on Majuro and 46.4% on Ebeye). These trends are in particular affecting Marshallese youth, which is indicated by a devastating youth unemployment rate of 58.5%. As Table 32 indicates, unemployment tends to decrease with age and higher degrees of educational attainment, rendering young, low-skilled workers vulnerable to socio-economic marginalization. This situation appears to be even more severe among women: female unemployment exceeds male unemployment by far, and throughout all age groups, as well as at comparable educational attainment. Care-taking responsibilities in the household, caused by historically high rates of adolescent fertility48 and diabetes-related disabilities are one possible explanation for the disadvantaged labor market position of Marshallese women.
Table 32: Unemployment by gender, age, and education (percentage)
total male Female
age groups, years
15–24 58.5 59.2 57.8
25–39 31.4 24.9 39.1
40–59 17.7 12.4 25.7
60+ 3.1 1.6 5.6
Education
Primary or less 37.8 33.3 44.2
Some secondary 41.9 34.9 49.9
High school graduate 28.2 21.8 35.8
Some college or more 16.3 13.8 19.6
Source: Assessment team calculations
As a result of sluggish private sector development, the public sector is dominating RMI’s labor force and economy. According to the 2015 Skills Demand Survey, 38.4% were employed in the public sector and 39.7% in private sector enterprises. Whilst there is an almost equal share of male and female employees in the public sector, two-thirds of all jobs in the private sector are occupied by males.
Employment by economic activity: In 2011, the majority of Marshallese workers were employed in the service sector (72.7%), which includes administrative work in the public sector as well as the production of other types of service in households and other private sector entities, followed by industry (16.3%) and agriculture (11%). The Marshallese labor market and economy are thus overly dependent on the service sector, which is also reflected in a large negative trade balance of USD 10.2 billion (2014), indicating that Marshallese households rely to a large extent on imported goods for their consumption.
48 According to UNFPA, the highest levels of teenage pregnancy in the region are found in both the rural and urban centres of RMI, with 85 per 1,000 being teenage women (aged 15–19 years).
98
Primary or less 37.8 33.3 44.2 Some secondary 41.9 34.9 49.9 High school graduate 28.2 21.8 35.8 Some college or more 16.3 13.8 19.6 Source: Assessment team calculations As a result of sluggish private sector development, the public sector is dominating RMI’s labor force and economy. According to the 2015 Skills Demand Survey, 38.4% were employed in the public sector and 39.7% in private sector enterprises. Whilst there is an almost equal share of male and female employees in the public sector, two-‐thirds of all jobs in the private sector are occupied by males. Employment by economic activity: In 2011, the majority of Marshallese workers were employed in the service sector (72.7%), which includes administrative work in the public sector as well as the production of other types of service in households and other private sector entities, followed by industry (16.3%) and agriculture (11%). The Marshallese labor market and economy are thus overly dependent on the service sector, which is also reflected in a large negative trade balance of USD 10.2 billion (2014), indicating that Marshallese households rely to a large extent on imported goods for their consumption.
Figure 19: Employment by economic activity and gender Source: Assessment team calculations A comparison of male and female workers by main economic activity reveals a predominance of men in “traditional” male occupations, in particular in construction, utilities, manufacturing, natural resources sectors and transportation (see Figure 19). Albeit to a lesser extent, men continue to outnumber women in various types of service-‐related activities. The only exception is the category “accommodation and food services” which employs slightly more women than men. Overall, RMI is far from reaching gender parity at the work place.
0 500 1000 1500 2000 2500 3000 3500
Agriculture, forestry and mining
Manufacturing
URlRes and repair & installaRon of equipment
ConstrucRon and related acRviRes
Wholesale & retail trade, repair of motor vehicles
TransportaRon, storage & courier acRviRes
AccommodaRon & food service acRviRes
AcRviRes of households as employers
UndifferenRated goods-‐ & services-‐ producing acRviRes of households for own use
Other services
Male Female
Figure 19: Employment by economic activity and genderSource: Assessment team calculations
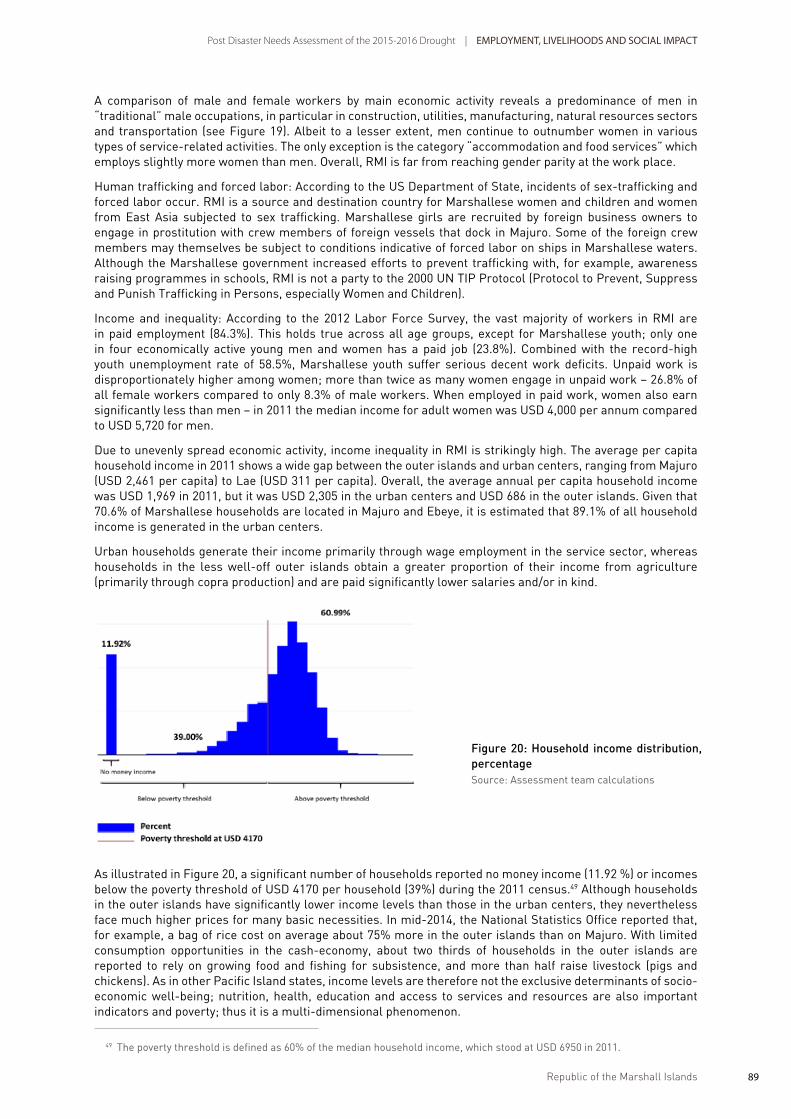
Republic of the Marshall Islands 89Republic of the Marshall Islands
Post Disaster Needs Assessment of the 2015-2016 Drought | EmPLOymENt, LivELiHOODS aND SOciaL imPact Post Disaster Needs Assessment of the 2015-2016 Drought | EmPLOymENt, LivELiHOODS aND SOciaL imPact
99
Human trafficking and forced labor: According to the US Department of State, incidents of sex-‐trafficking and forced labor occur. RMI is a source and destination country for Marshallese women and children and women from East Asia subjected to sex trafficking. Marshallese girls are recruited by foreign business owners to engage in prostitution with crew members of foreign vessels that dock in Majuro. Some of the foreign crew members may themselves be subject to conditions indicative of forced labor on ships in Marshallese waters. Although the Marshallese government increased efforts to prevent trafficking with, for example, awareness raising programmes in schools, RMI is not a party to the 2000 UN TIP Protocol (Protocol to Prevent, Suppress and Punish Trafficking in Persons, especially Women and Children). Income and inequality: According to the 2012 Labor Force Survey, the vast majority of workers in RMI are in paid employment (84.3%). This holds true across all age groups, except for Marshallese youth; only one in four economically active young men and women has a paid job (23.8%). Combined with the record-‐high youth unemployment rate of 58.5%, Marshallese youth suffer serious decent work deficits. Unpaid work is disproportionately higher among women; more than twice as many women engage in unpaid work – 26.8% of all female workers compared to only 8.3% of male workers. When employed in paid work, women also earn significantly less than men – in 2011 the median income for adult women was USD 4,000 per annum compared to USD 5,720 for men. Due to unevenly spread economic activity, income inequality in RMI is strikingly high. The average per capita household income in 2011 shows a wide gap between the outer islands and urban centers, ranging from Majuro (USD 2,461 per capita) to Lae (USD 311 per capita). Overall, the average annual per capita household income was USD 1,969 in 2011, but it was USD 2,305 in the urban centers and USD 686 in the outer islands. Given that 70.6% of Marshallese households are located in Majuro and Ebeye, it is estimated that 89.1% of all household income is generated in the urban centers. Urban households generate their income primarily through wage employment in the service sector, whereas households in the less well-‐off outer islands obtain a greater proportion of their income from agriculture (primarily through copra production) and are paid significantly lower salaries and/or in kind.
Figure 20: Household income distribution, percentageSource: Assessment team calculations
49 The poverty threshold is defined as 60% of the median household income, which stood at USD 6950 in 2011.
A comparison of male and female workers by main economic activity reveals a predominance of men in “traditional” male occupations, in particular in construction, utilities, manufacturing, natural resources sectors and transportation (see Figure 19). Albeit to a lesser extent, men continue to outnumber women in various types of service-related activities. The only exception is the category “accommodation and food services” which employs slightly more women than men. Overall, RMI is far from reaching gender parity at the work place.
Human trafficking and forced labor: According to the US Department of State, incidents of sex-trafficking and forced labor occur. RMI is a source and destination country for Marshallese women and children and women from East Asia subjected to sex trafficking. Marshallese girls are recruited by foreign business owners to engage in prostitution with crew members of foreign vessels that dock in Majuro. Some of the foreign crew members may themselves be subject to conditions indicative of forced labor on ships in Marshallese waters. Although the Marshallese government increased efforts to prevent trafficking with, for example, awareness raising programmes in schools, RMI is not a party to the 2000 UN TIP Protocol (Protocol to Prevent, Suppress and Punish Trafficking in Persons, especially Women and Children).
Income and inequality: According to the 2012 Labor Force Survey, the vast majority of workers in RMI are in paid employment (84.3%). This holds true across all age groups, except for Marshallese youth; only one in four economically active young men and women has a paid job (23.8%). Combined with the record-high youth unemployment rate of 58.5%, Marshallese youth suffer serious decent work deficits. Unpaid work is disproportionately higher among women; more than twice as many women engage in unpaid work – 26.8% of all female workers compared to only 8.3% of male workers. When employed in paid work, women also earn significantly less than men – in 2011 the median income for adult women was USD 4,000 per annum compared to USD 5,720 for men.
Due to unevenly spread economic activity, income inequality in RMI is strikingly high. The average per capita household income in 2011 shows a wide gap between the outer islands and urban centers, ranging from Majuro (USD 2,461 per capita) to Lae (USD 311 per capita). Overall, the average annual per capita household income was USD 1,969 in 2011, but it was USD 2,305 in the urban centers and USD 686 in the outer islands. Given that 70.6% of Marshallese households are located in Majuro and Ebeye, it is estimated that 89.1% of all household income is generated in the urban centers.
Urban households generate their income primarily through wage employment in the service sector, whereas households in the less well-off outer islands obtain a greater proportion of their income from agriculture (primarily through copra production) and are paid significantly lower salaries and/or in kind.
As illustrated in Figure 20, a significant number of households reported no money income (11.92 %) or incomes below the poverty threshold of USD 4170 per household (39%) during the 2011 census.49 Although households in the outer islands have significantly lower income levels than those in the urban centers, they nevertheless face much higher prices for many basic necessities. In mid-2014, the National Statistics Office reported that, for example, a bag of rice cost on average about 75% more in the outer islands than on Majuro. With limited consumption opportunities in the cash-economy, about two thirds of households in the outer islands are reported to rely on growing food and fishing for subsistence, and more than half raise livestock (pigs and chickens). As in other Pacific Island states, income levels are therefore not the exclusive determinants of socio-economic well-being; nutrition, health, education and access to services and resources are also important indicators and poverty; thus it is a multi-dimensional phenomenon.
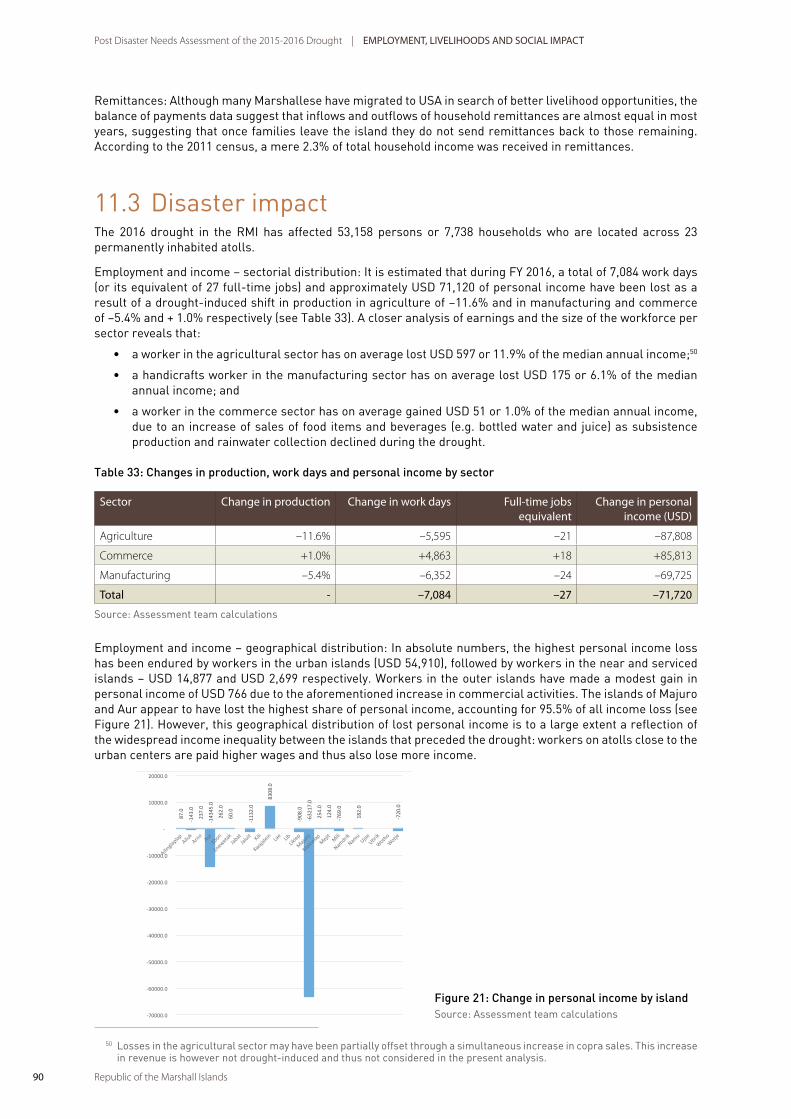
Republic of the Marshall Islands 90 Republic of the Marshall Islands
Post Disaster Needs Assessment of the 2015-2016 Drought | EmPLOymENt, LivELiHOODS aND SOciaL imPact
Remittances: Although many Marshallese have migrated to USA in search of better livelihood opportunities, the balance of payments data suggest that inflows and outflows of household remittances are almost equal in most years, suggesting that once families leave the island they do not send remittances back to those remaining. According to the 2011 census, a mere 2.3% of total household income was received in remittances.
11.3 Disaster impactThe 2016 drought in the RMI has affected 53,158 persons or 7,738 households who are located across 23 permanently inhabited atolls.
Employment and income – sectorial distribution: It is estimated that during FY 2016, a total of 7,084 work days (or its equivalent of 27 full-time jobs) and approximately USD 71,120 of personal income have been lost as a result of a drought-induced shift in production in agriculture of –11.6% and in manufacturing and commerce of –5.4% and + 1.0% respectively (see Table 33). A closer analysis of earnings and the size of the workforce per sector reveals that:
• aworkerintheagriculturalsectorhasonaveragelostUSD597or11.9%ofthemedianannualincome;50
• ahandicraftsworkerinthemanufacturingsectorhasonaveragelostUSD175or6.1%ofthemedianannual income; and
• aworkerinthecommercesectorhasonaveragegainedUSD51or1.0%ofthemedianannualincome,due to an increase of sales of food items and beverages (e.g. bottled water and juice) as subsistence production and rainwater collection declined during the drought.
Table 33: Changes in production, work days and personal income by sector
Sector change in production change in work days Full-time jobs equivalent
change in personal income (uSD)
Agriculture –11.6% –5,595 –21 –87,808
Commerce +1.0% +4,863 +18 +85,813
Manufacturing –5.4% –6,352 –24 –69,725
total - –7,084 –27 –71,720
Source: Assessment team calculations
Employment and income – geographical distribution: In absolute numbers, the highest personal income loss has been endured by workers in the urban islands (USD 54,910), followed by workers in the near and serviced islands – USD 14,877 and USD 2,699 respectively. Workers in the outer islands have made a modest gain in personal income of USD 766 due to the aforementioned increase in commercial activities. The islands of Majuro and Aur appear to have lost the highest share of personal income, accounting for 95.5% of all income loss (see Figure 21). However, this geographical distribution of lost personal income is to a large extent a reflection of the widespread income inequality between the islands that preceded the drought: workers on atolls close to the urban centers are paid higher wages and thus also lose more income.
50 Losses in the agricultural sector may have been partially offset through a simultaneous increase in copra sales. This increase in revenue is however not drought-induced and thus not considered in the present analysis.
101
production days equivalent income (USD) Agriculture –11.6% –5,595 –21 –87,808 Commerce +1.0% +4,863 +18 +85,813 Manufacturing –5.4% –6,352 –24 –69,725 Total -‐ –7,084 –27 –71,720 Source: Assessment team calculations Employment and income – geographical distribution: In absolute numbers, the highest personal income loss has been endured by workers in the urban islands (USD 54,910), followed by workers in the near and serviced islands – USD 14,877 and USD 2,699 respectively. Workers in the outer islands have made a modest gain in personal income of USD 766 due to the aforementioned increase in commercial activities. The islands of Majuro and Aur appear to have lost the highest share of personal income, accounting for 95.5% of all income loss (see Figure 21). However, this geographical distribution of lost personal income is to a large extent a reflection of the widespread income inequality between the islands that preceded the drought: workers on atolls close to the urban centers are paid higher wages and thus also lose more income.
Figure 21: Change in personal income by island
87.
0
-‐143
.0
237
.0
-‐143
45.0
262
.0
60.
0
-‐113
2.0
830
8.0
-‐908
.0
-‐632
17.0
254
.0
124
.0
-‐769
.0
182
.0
-‐720
.0
-‐70000.0
-‐60000.0
-‐50000.0
-‐40000.0
-‐30000.0
-‐20000.0
-‐10000.0
-‐
10000.0
20000.0
Figure 21: Change in personal income by islandSource: Assessment team calculations
Republic of the Marshall Islands 91Republic of the Marshall Islands
Post Disaster Needs Assessment of the 2015-2016 Drought | EmPLOymENt, LivELiHOODS aND SOciaL imPact Post Disaster Needs Assessment of the 2015-2016 Drought | EmPLOymENt, LivELiHOODS aND SOciaL imPact
In relative terms, subsistence workers and households with no money income and/or those below the poverty threshold (up to 39% of the total population. See Figure 21) in the outer islands are expected to suffer a disproportionately severe livelihoods impact as pre-disaster per capita income and the drought-induced per capita losses are negatively correlated. Households on Jabat Atoll have lost the equivalent of 67% of their annual per capita income, and households on Lae and Wotho approximately 50% (see also the Quality of Life, Section 13, of this report).
Livelihoods and social impact: As a result of the aforementioned loss in personal income and increased expenditure to compensate for shortfalls in subsistence production and rainwater collection, poverty and hardship are likely to increase among urban and rural households. A series of focus group discussions was held during the PDNA with stakeholders from affected communities. They provided additional qualitative information about the coping strategies that household employ.
A central concern seems to be an increasing dependence on the cash economy to purchase food items and beverages that were previously provided through home-based production. In an attempt to smoothen consumption, many households reported increased expenditure on essential items, such as flour, rice, ramen, canned food and water, as well as bleach (to treat water) and other cleaning products, whilst spending less on non-essential items. Households in remote locations reported being forced to purchase gasoline to travel to other islands to access water stations. In other instances, households lamented the long waits at public wells, which resulted in an increase in time poverty, especially amongst (young) men.
The decline in agricultural production not only affected subsistence farmers but also interrupted the value chain of natural resource-based products. A scarcity of pandanus leaves has caused a sharp decline in handicrafts manufacturing (see Section 9) which is one of the principal income-generating activities for Marshallese women and their families. To cope with income loss, women reported resorting to community-based saving schemes and/or borrowing in-kind with friends and family.
A lack of readily-available drinking water has also negatively affected school attendance rates. Women report that children have arrived at school later and/or have left school earlier to get water and/or completely abstain from attending due to the spread of infectious diseases such as diarrhea and conjunctivitis. In other instances, children stayed at home to help their parents look for food and water. This drought-induced disruption of education is particular severe, given that RMI has already struggled prior to the drought with low educational attainment rates and an insufficiently skilled labor force.
Households also appear to have been forced to reduce meal intakes and/or consume lower quality food and beverages to cope with a shortfall in subsistence production and higher expenditure on food imports. Evidence from the health sector assessment (Section 9) and the Quality of Life Index (Section 13) suggests an increase in malnutrition among children and adolescents that may cause stunting and impede personal development in the medium and long term. A deterioration in the health of household members will also increase the care-giving burden of women and therefore restrict the access of women to enter or re-enter the labor market. In a context of high rates of adolescent fertility and diabetes-related disabilities, women were already (prior to the drought) struggling with time poverty. The decline in handicrafts production, combined with greater household responsibilities, is thus likely to lower female labor force participation even further.
To sum up, although the FY 2016 drought appears to have caused a comparatively low income decline (a mere 0.3% of total losses), the impact on household well-being is nevertheless likely to be severe and sustained. As stated in the first section of this chapter, poverty and hardship are not only evident in low income levels but are a function of low educational attainment, poor nutrition and health, and a lack of access to services and resources. The most vulnerable segments of the Marshallese population are thus expected to see their livelihoods further deteriorate – these are in particular youth with low educational attainment and/or irregular employment in the urban centers, low-income households in the outer islands, and women-headed households with care-giving responsibilities.
11.4 Recovery strategy and needsWhile recovery needs must arrest loss of income through social protection and immediate income generation activities, it is imperative that medium and long term labor and employment outcomes are maximized. Therefore, activities must be aligned to the National Strategic Plan 2015–2017 and the National Human Resource Development Plan 2014–2019. In the same instance, activities must also support the capacity building of institutions and personnel with the aim of promoting decent work, protecting jobs and being better prepared for future disasters.
A key target group will be unemployed young women and men who make up 58.5% of the population, the largest youth unemployment rate in the Pacific and possibly one of the largest in the world. Even if young people secure

Republic of the Marshall Islands 92 Republic of the Marshall Islands Republic of the Marshall Islands
Post Disaster Needs Assessment of the 2015-2016 Drought | EmPLOymENt, LivELiHOODS aND SOciaL imPact
employment, only one out of four economically active youths are in paid employment. Decent work deficits effect women and young women more with 26.8% of all female workers in unpaid work and generally earning less than men. Policy and programmes supporting the transition of young people from school to work should be developed, including protection and promotion of rights of young people.
The institutional capacities of the National Training Centre will be strengthened to design and deliver programmes. Programmes will target youths in urban areas (Majuro and Ebeye) and later extend its services to the atolls most effected (Jabat, Lae and Wotho). Limited waged employment offers the potential for inculcating entrepreneurship among young people to support self-development and livelihoods. Hence, there is a need to develop partnerships with the Chamber of Commerce to support its charter and develop the local private sector. For skills development, a database of foreign workers will be established within the Division of Labor (Ministry of Foreign Affairs) to fill local skills gaps and inform policies and training programmes of training providers. To support the eradication of trafficking and forced labor, support will be provided to the industry-based workers’ organizations.
For women-headed households, support programmes should be developed first as part of a social protection programme to supplement nutrition for the children, as well as health care measures provided by medical services. Thereafter, there should be links to employment support programmes, such as priority access to public work opportunities, skills training, and provision of inputs for their productive activities.
Table 34: Recovery needs (USD) in the employment livelihoods and social impact section
activities value uSD responsible agencies
Short term
National training of trainers on career counselling 15,000 NTC, Ministry of Education, Ministry of Youth, National Youth Council, ILO
Start your business (SYB) training for youths in Majuro and Ebeye
30,000 NTC, Chamber of Commerce, Ministry of Resources and Development, Office of Commerce and Investment, UNDP, ILO
Training on rights of young workers and national labor laws, including developing a pocket guide
30,000 National Youth Council, Industry-based workers’ organizations, ILO
An entrepreneurship advocacy programme, including establishment of a young entrepreneurs council.
20,000 Chamber of Commerce, SPC, Pacific Youth Council, National Youth Council, UNDP, ILO
Set up of a national employment services center 40,000 NTC, ILO
Establishment of a foreign workers database, inclusive of skills, qualifications etc.
10,000 Division of Labor (Ministry of Foreign Affairs), Immigration and ILO
Trafficking and forced labor training, including programme for eradication
30,000 Workers organizations, Division of Labor (Ministry of Foreign Affairs), Chamber of Commerce and ILO
medium to long term
A national action plan on youth employment 60,000 All relevant ministries, Chamber of Commerce, workers’ organizations, National Youth Council, PYC, SPC, UNDP, ILO
Development of locally tailored SYB training materials 35,000 NTC, Office of Commerce and Investment, Chamber of Commerce, ILO
Training of trainers and certification of local business trainers
50,000 NTC, ILO
Career counselling part of Ministry of Education curriculum
100,000 Ministry of Education, NTC, ILO
Private sector development programme, including database establishment and business development services
50,000 Office of Commerce and Investment, Chamber of Commerce, UNDP, ILO
Demand-driven skills training programmes 100,000 NTC, ILO
National employment policy 100,000 Government, Chamber of Commerce, workers’ organisations, UNDP, ILO
Social protection and emergency employment programme for women-headed households
100,000 Ministry of Health, Community Development Division (Ministry of Foreign Affairs), NTC
tOtaL 770.00
Source: Estimations of the assessment team using official information
Republic of the Marshall Islands
Post Disaster Needs Assessment of the 2015-2016 Drought | Executive Summary
Republic of the Marshall Islands 93Republic of the Marshall Islands Republic of the Marshall Islands
Post Disaster Needs Assessment of the 2015-2016 Drought | EmPLOymENt, LivELiHOODS aND SOciaL imPact Post Disaster Needs Assessment of the 2015-2016 Drought | Executive Summary
Republic of the Marshall Islands
Post Disaster Needs Assessment of the 2015-2016 Drought | Executive Summary
PERSONAL INCOME
12
93

Republic of the Marshall Islands 94 Republic of the Marshall Islands
Post Disaster Needs Assessment of the 2015-2016 Drought | PErSONaL iNcOmE
12.1 General commentsQuantitative information on personal income for all atolls in RMI is available in the 2011 census. To be used as baseline for purposes of the drought impact and needs assessment, such data were adjusted for inflation, as shown in Table 35.
Table 35: Inflation-adjusted per capita income for all atolls
Per capita income uSD/person Per capita income uSD/person
ailinglaplap 779 Likiep 962
ailuk 486 majuro 2,854
arno 629 maloelap 1,283
aur 995 mejit 638
Ebon 529 mili 863
Enewetak 1,513 Namdrik 573
Jabat 600 Namu 734
Jaluit 943 ujae 692
Kili 1,878 utrik 1,138
Kwajalein 2,630 Wotho 1,270
Lae 296 Wotje 1,068
Lib 742
Source: Estimations by the assessment team on the basis of the 2011 census
Drought impact on personal income levelsIn the absence of post-drought personal income information – because not sufficient time was available to carry out a survey on the matter during the drought assessment – it became necessary to use the value of production flow decline as a proxy for personal income decline.
The changes in the value of production flow in the sectors of agriculture, livestock, manufacturing, and wholesale and retail trade were used to ascertain decline in personal income for the labor force involved in these sectors. It was assumed that the labor force employed in education, health, water and sanitation, electricity and other sectors would not sustain income losses as they have permanent employment, which would not normally vary as a result of disasters.
Due consideration was given to the fact that production losses occurred in the agriculture, livestock, and industry sectors, while gains in production happened in the case of the commerce sector due to higher-than-normal sales of bottled water and food, as demanded by the drought. In view of those considerations, a net value of per capita production losses was estimated, as shown in Table 36.
Table 36: Estimation of personal income decline due to impact of the FY 2016 drought
Drought effects on production, uSD Population in 2016
income decline uSD/person
Decline increase Net decline
ailinglaplap 33,407 - 33,407 1,641 20
ailuk 22,199 - 22,199 284 78
arno 182,583 - 182,583 1,690 108
aur 105,971 - 105,971 484 219
Ebon 105 - 105 637 0
Enewetak 55,237 - 55,237 598 92
Jabat 13,621 - 13,621 80 171
Jaluit 12,142 - 12,142 1,840 7
Kili 2,502 - 2,502 474 5
Kwajalein 23,731 - 23,731 11,625 2

Republic of the Marshall Islands 95Republic of the Marshall Islands
Post Disaster Needs Assessment of the 2015-2016 Drought | PErSONaL iNcOmE Post Disaster Needs Assessment of the 2015-2016 Drought | PErSONaL iNcOmE
107
Figure 22: Personal income decline as a percentage of pre-‐drought income levels per atoll Source: Estimations by the assessment team 12.2 Estimation of post-‐disaster needs There is a clear need to assist the affected persons to recover from the decline in personal income caused by the drought, as well as to achieve a higher resilience to similar losses in the future. Recovery needs. The amount and value of recovery needs concerning personal income are equivalent to the value of income losses sustained by the affected population. Very often, based on such needs, special schemes of “cash-‐for-‐work” and “food-‐for-‐work” are set up as a way to assist household heads to recover after a disaster. In the case of the FY 2016 drought, however, there is another factor to consider for the definition of such recovery needs. Purchases of copra by the Tobolar Authority during FY 201651 have been much
51 The data provide quantities and value of purchases to July 2016 only.
0% 10% 20% 30% 40% 50% 60% 70% 80% 90% 100%
Jabat
Mejit
Aur
Arno
Ailuk
Maloelap
Lae
Namu
Wotje
Mili
Lib
Enewetak
Likiep
URrik
Wotho
Ailanglaplap
28.5
22.9
22.0
17.2
16.0
14.9
13.0
12.7
12.2
7.7
7.1
6.1
4.1
3.8
2.9
2.6
Percent income loss in comparison to pre-‐drought levels
% income loss Pre-‐drought income
Drought effects on production, uSD Population in 2016
income decline uSD/person
Decline increase Net decline
Lae 13,767 - 13,767 358 38
Lib 8,297 - 8,297 158 52
Likiep 14,100 - 14,100 357 39
majuro 964,483 256,900 707,583 29,706 24
maloelap 118,457 - 118,457 620 191
mejit 47,263 - 47,263 323 146
mili 42,443 - 42,443 640 66
Namdrik 166 - 166 425 0
Namu 68,530 - 68,530 734 93
rongelap 109 - 109 138 1
ujae 14,651 - 14,651 336 44
utrik 15,991 - 15,991 436 37
Wotho 10,704 - 10,704 82 131
Wotje 109,627 - 109,627 856 128
Source: Estimations by the assessment team
An analysis of the data in Table 36 reveals that the most affected persons in terms of personal income decline are those residing in Jabot Atoll, who lost 28.5% of their normal personal income because of the production disruption caused by the drought. Residents of Mejit and Aur were the second most affected, with a decline of about 22%. The residents of Arno, Ailuk and Maloelap faced income decline of around 15%. Fourth most affected were residents of Lae, Namu, and Wotje, with personal income decline between 10 and 14%.
Figure 22: Personal income decline as a percentage of pre-drought income levels per atoll
Source: Estimations by the assessment team

Republic of the Marshall Islands 96 Republic of the Marshall Islands
Post Disaster Needs Assessment of the 2015-2016 Drought | PErSONaL iNcOmE
12.2 Estimation of post-disaster needs There is a clear need to assist the affected persons to recover from the decline in personal income caused by the drought, as well as to achieve a higher resilience to similar losses in the future.
Recovery needs. The amount and value of recovery needs concerning personal income are equivalent to the value of income losses sustained by the affected population. Very often, based on such needs, special schemes of “cash-for-work” and “food-for-work” are set up as a way to assist household heads to recover after a disaster.
In the case of the FY 2016 drought, however, there is another factor to consider for the definition of such recovery needs. Purchases of copra by the Tobolar Authority during FY 201651 have been much higher than last year, as caused by the more frequent acquisition of copra from the producers, a factor not related to the occurrence of the drought. These higher purchases of copra by Tobolar have in fact raised the personal income of producers, thereby providing a partial cushioning effect of the drought-induced personal income losses. Table 37 reveals the variation of copra purchases between FY 2016 over FY 2015 for all atolls/islands.
Table 37: Copra purchases by Tobolar Authority in FY 2015 and FY 2016
Fy2015 purchases Fy2016 purchases increase in purchases
Short tons value, uSD Short tons value, uSD Short tons value, uSD
ailinglaplap 633 316,390 1,129 564,255 496 247,865
ailuk 54 27,225 70 35,105 16 7,880
arno 1,179 589,435 979 489,450 –200 –99,985
aur 269 134,485 412 205,850 143 71,365
Ebon 173 86,545 351 175,525 178 88,980
Jabot 25 12,610 77 38,465 52 25,855
Jaluit 316 158,015 158 78,915 –158 –79,100
Kili - - - - - -
Kwajalein 25 12,355 90 45,105 66 32,750
Lae 45 22,475 108 54,140 63 31,665
Lip 55 27,405 67 33,565 12 6,160
Likiep 45 22,650 141 70,445 96 47,795
majuro 176 88,095 147 73,665 –29 –14,430
maloelap 379 189,605 376 188,225 –3 –1,380
mejit 121 60,705 148 74,065 27 13,360
mili 586 293,015 722 361,130 136 68,115
Namrik 282 141,080 404 202,160 122 61,080
Namu 318 158,975 264 132,020 –54 –26,955
ujae 22 11,240 102 51,015 80 39,775
utrok 69 34,590 117 58,330 47 23,740
Wotje 255 127,470 233 116,720 –22 –10,750
Wotho 24 11,995 45 22,270 21 10,275
Source: Estimations by the assessment team
The data in Table 37 reveal that total purchases of copra up to end-July 2016 were higher than in the entire FY 2015, which will increase once data for August and September 2016 are included. This increase in purchases is higher in several of the atolls, although in some of them – notably in Arno, Jaluit, Namu, Majuro, Wotje, and to a lesser extent in Maloelap – the purchases may have been lower. The above has compensated, in some cases, for the value of production losses sustained by the residents of some atolls/islands.
During discussions with Tobolar Authority officials, it was learned that the volume of purchases is more a function of the frequency of visits to each atoll made by Tobolar boats, and of the lead time given by the announcement in each atoll of the arrival of the boats to collect the product. This consideration points to the
51 The data provide quantities and value of purchases to July 2016 only.

Republic of the Marshall Islands 97Republic of the Marshall Islands
Post Disaster Needs Assessment of the 2015-2016 Drought | PErSONaL iNcOmE Post Disaster Needs Assessment of the 2015-2016 Drought | PErSONaL iNcOmE
possibility that future copra purchases might be used as a way of financing the recovery of personal income in the atolls/islands where personal income decline was highest. These atolls most affected would be targeted for increasing copra purchases by Tobolar, and a sufficient advance notice given to their inhabitants to facilitate copra collection.
The estimated additional copra purchases that would enable full personal income recovery in the affected atolls/islands are shown in Table 38. It should be noted, however, that these numbers will need to be modified after including in the analysis the value of higher copra purchases made by Tobolar in the months of August and September 2016, which – as mentioned earlier – have not been taken into consideration.
Table 38: Estimates of additional higher copra purchases required for personal income recovery
additional copra purchases
Pounds Short tons
ailuk 57,276 29
arno 1,130,273 565
aur 138,425 69
Jabat 68,203 34
Jaluit 48,567 24
Kili 4,671 2
Likiep 57,095 29
majuro 3,094,884 1,547
maloelap 371,240 186
mejit 51,703 26
Namdrik 63,187 32
utrik 305,082 153
Wotho 8,078 4
Wotje 448,096 224
Source: Estimations by the assessment team
Risk reduction needs. As indicated earlier, there is a need to increase the population’s resilience against disasters in terms of personal income diversification. Only in that fashion will it be possible to enable households to take advantage of other income sources whenever a disaster occurs. A number of initiatives in that regard were identified and costed in the recovery needs under the Employment, Livelihoods and Social Protection section (Section 11).
Republic of the Marshall Islands 98 Republic of the Marshall Islands
Post Disaster Needs Assessment of the 2015-2016 Drought | Executive Summary
Republic of the Marshall Islands
Post Disaster Needs Assessment of the 2015-2016 Drought | Executive Summary
Republic of the Marshall Islands
Post Disaster Needs Assessment of the 2015-2016 Drought | Executive Summary
QUALITY OF LIFE DECLINE
13
98
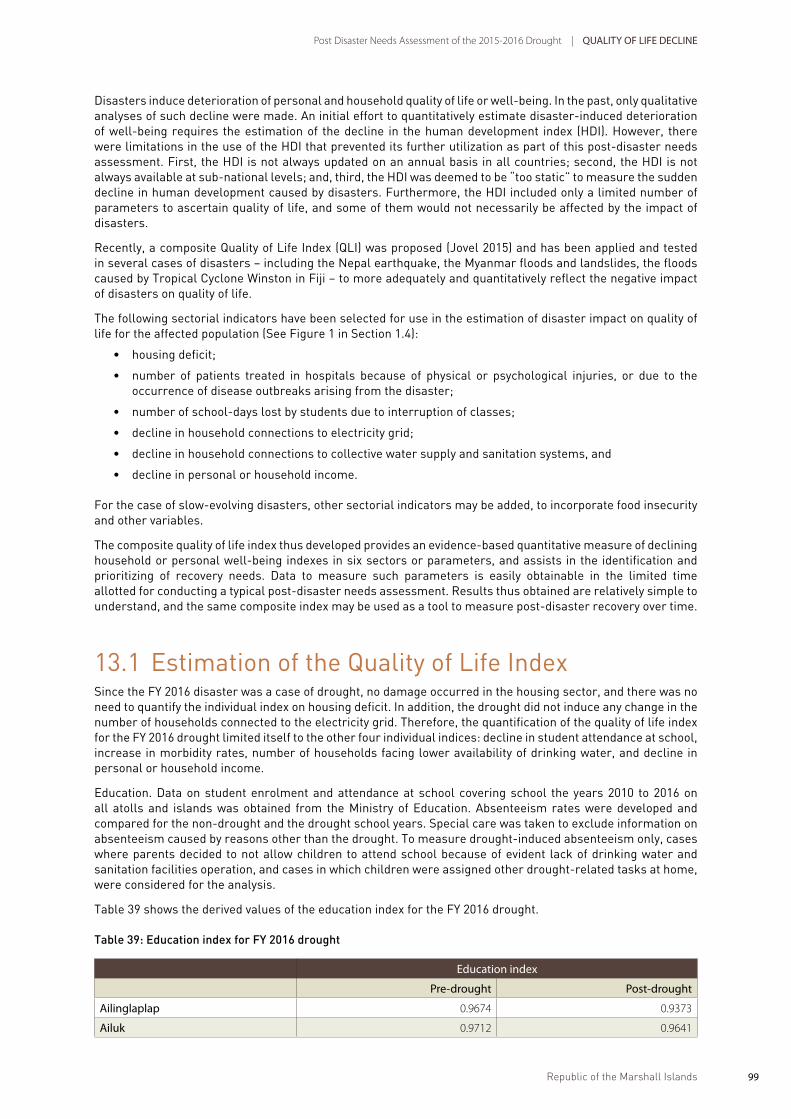
Republic of the Marshall Islands 99Republic of the Marshall Islands
Post Disaster Needs Assessment of the 2015-2016 Drought | Executive Summary Post Disaster Needs Assessment of the 2015-2016 Drought | QuaLity OF LiFE DEcLiNE
Republic of the Marshall Islands
Post Disaster Needs Assessment of the 2015-2016 Drought | Executive Summary
Disasters induce deterioration of personal and household quality of life or well-being. In the past, only qualitative analyses of such decline were made. An initial effort to quantitatively estimate disaster-induced deterioration of well-being requires the estimation of the decline in the human development index (HDI). However, there were limitations in the use of the HDI that prevented its further utilization as part of this post-disaster needs assessment. First, the HDI is not always updated on an annual basis in all countries; second, the HDI is not always available at sub-national levels; and, third, the HDI was deemed to be “too static” to measure the sudden decline in human development caused by disasters. Furthermore, the HDI included only a limited number of parameters to ascertain quality of life, and some of them would not necessarily be affected by the impact of disasters.
Recently, a composite Quality of Life Index (QLI) was proposed (Jovel 2015) and has been applied and tested in several cases of disasters – including the Nepal earthquake, the Myanmar floods and landslides, the floods caused by Tropical Cyclone Winston in Fiji – to more adequately and quantitatively reflect the negative impact of disasters on quality of life.
The following sectorial indicators have been selected for use in the estimation of disaster impact on quality of life for the affected population (See Figure 1 in Section 1.4):
• housingdeficit;
• number of patients treated in hospitals because of physical or psychological injuries, or due to theoccurrence of disease outbreaks arising from the disaster;
• numberofschool-dayslostbystudentsduetointerruptionofclasses;
• declineinhouseholdconnectionstoelectricitygrid;
• declineinhouseholdconnectionstocollectivewatersupplyandsanitationsystems,and
• declineinpersonalorhouseholdincome.
For the case of slow-evolving disasters, other sectorial indicators may be added, to incorporate food insecurity and other variables.
The composite quality of life index thus developed provides an evidence-based quantitative measure of declining household or personal well-being indexes in six sectors or parameters, and assists in the identification and prioritizing of recovery needs. Data to measure such parameters is easily obtainable in the limited time allotted for conducting a typical post-disaster needs assessment. Results thus obtained are relatively simple to understand, and the same composite index may be used as a tool to measure post-disaster recovery over time.
13.1 Estimation of the Quality of Life IndexSince the FY 2016 disaster was a case of drought, no damage occurred in the housing sector, and there was no need to quantify the individual index on housing deficit. In addition, the drought did not induce any change in the number of households connected to the electricity grid. Therefore, the quantification of the quality of life index for the FY 2016 drought limited itself to the other four individual indices: decline in student attendance at school, increase in morbidity rates, number of households facing lower availability of drinking water, and decline in personal or household income.
Education. Data on student enrolment and attendance at school covering school the years 2010 to 2016 on all atolls and islands was obtained from the Ministry of Education. Absenteeism rates were developed and compared for the non-drought and the drought school years. Special care was taken to exclude information on absenteeism caused by reasons other than the drought. To measure drought-induced absenteeism only, cases where parents decided to not allow children to attend school because of evident lack of drinking water and sanitation facilities operation, and cases in which children were assigned other drought-related tasks at home, were considered for the analysis.
Table 39 shows the derived values of the education index for the FY 2016 drought.
Table 39: Education index for FY 2016 drought
Education index
Pre-drought Post-drought
ailinglaplap 0.9674 0.9373
ailuk 0.9712 0.9641

Republic of the Marshall Islands 100 Republic of the Marshall Islands
Post Disaster Needs Assessment of the 2015-2016 Drought | QuaLity OF LiFE DEcLiNE
Education index
Pre-drought Post-drought
arno 0.9531 0.9489
aur 0.9723 0.9801
Ebon 0.9893 0.9908
Enewetak 0.9399 0.9310
Jabat 0.9848 0.9800
Jaluit 0.9819 0.9813
Kili 0.9181 0.9168
Kwajalein 0.8990 0.9184
Lae 0.9833 0.9789
Lib 0.9296 0.8940
Likiep 0.9867 0.9704
majuro 0.8975 0.7991
maloelap 0.9700 0.9503
mejit 0.9668 0.9891
mili 0.9564 0.9712
Namrik 0.9817 0.9449
Namu 0.9736 0.9788
ujae 0.9848 0.9890
utrik 0.9879 0.9837
Wotho 0.9930 0.9886
Wotje 0.9821 0.9622
Source: Estimations by the assessment team, using official information
The atolls/islands where the decline in the education index was highest were Majuro (11%); Lib, Namrik and Ailinglaplap with around 3%; and Maloelap, Likiep and Wotje, with about 2%.
Health. Information on surveillance of disease was made available by the Ministry of Health, for all atolls and islands, for the period between FY 2011 and FY 2016. The increase in morbidity rates for four drought-related diseases – diarrhea, influenza, conjunctivitis and scabies – was determined from such information. In addition, data were collected on increases in malnutrition rates arising from the FY 2016 drought.
Table 40 reveals the health indices derived from the analysis of the above information.
Table 40: Health index for FY 2016 drought
Health index
Pre-drought Post-drought
ailinglaplap 0.9939 0.6709
ailuk 1.0000 0.5288
arno 0.9941 0.7071
aur 1.0000 0.4627
Ebon 1.0000 0.7959
Enewetak 0.8594 0.6352
Jabat 1.0000 0.3607
Jaluit 0.9897 0.6690
Kili 1.0000 0.8944
Kwajalein 0.9948 0.9086
Lae 0.9665 0.4636
Lib 1.0000 0.7602
Likiep 1.0000 0.4907
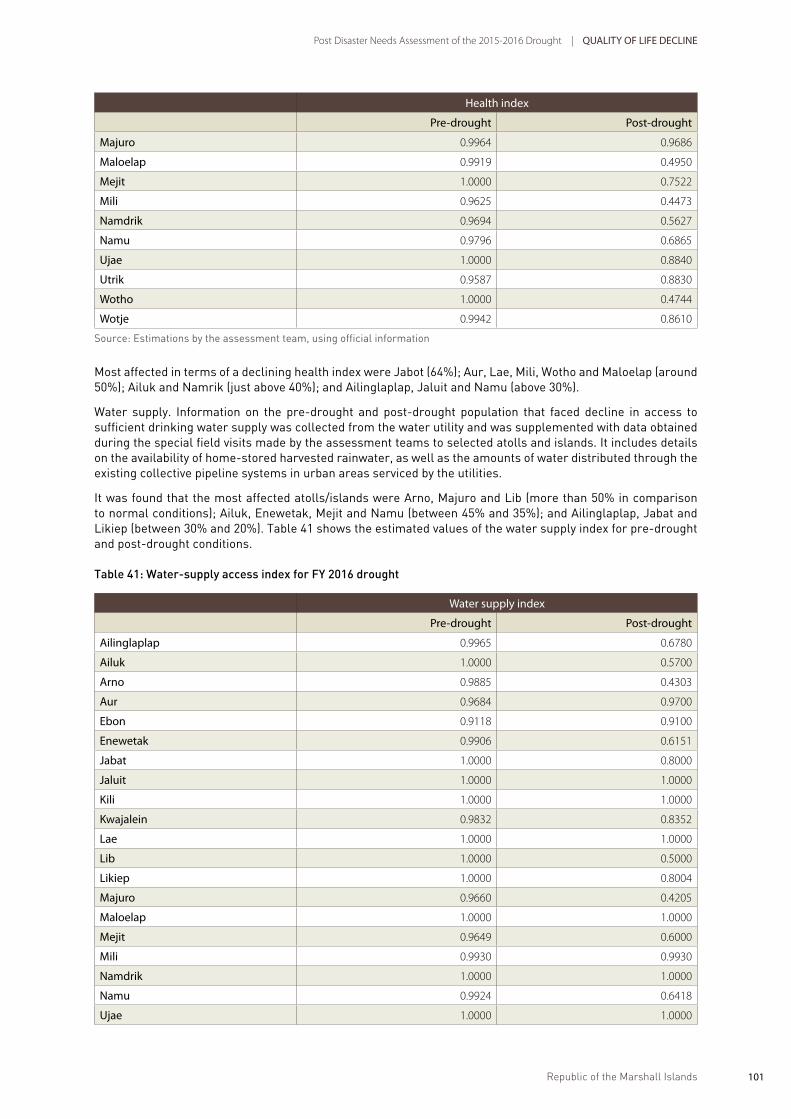
Republic of the Marshall Islands 101Republic of the Marshall Islands
Post Disaster Needs Assessment of the 2015-2016 Drought | QuaLity OF LiFE DEcLiNE Post Disaster Needs Assessment of the 2015-2016 Drought | QuaLity OF LiFE DEcLiNE
Health index
Pre-drought Post-drought
majuro 0.9964 0.9686
maloelap 0.9919 0.4950
mejit 1.0000 0.7522
mili 0.9625 0.4473
Namdrik 0.9694 0.5627
Namu 0.9796 0.6865
ujae 1.0000 0.8840
utrik 0.9587 0.8830
Wotho 1.0000 0.4744
Wotje 0.9942 0.8610
Source: Estimations by the assessment team, using official information
Most affected in terms of a declining health index were Jabot (64%); Aur, Lae, Mili, Wotho and Maloelap (around 50%); Ailuk and Namrik (just above 40%); and Ailinglaplap, Jaluit and Namu (above 30%).
Water supply. Information on the pre-drought and post-drought population that faced decline in access to sufficient drinking water supply was collected from the water utility and was supplemented with data obtained during the special field visits made by the assessment teams to selected atolls and islands. It includes details on the availability of home-stored harvested rainwater, as well as the amounts of water distributed through the existing collective pipeline systems in urban areas serviced by the utilities.
It was found that the most affected atolls/islands were Arno, Majuro and Lib (more than 50% in comparison to normal conditions); Ailuk, Enewetak, Mejit and Namu (between 45% and 35%); and Ailinglaplap, Jabat and Likiep (between 30% and 20%). Table 41 shows the estimated values of the water supply index for pre-drought and post-drought conditions.
Table 41: Water-supply access index for FY 2016 drought
Water supply index
Pre-drought Post-drought
ailinglaplap 0.9965 0.6780
ailuk 1.0000 0.5700
arno 0.9885 0.4303
aur 0.9684 0.9700
Ebon 0.9118 0.9100
Enewetak 0.9906 0.6151
Jabat 1.0000 0.8000
Jaluit 1.0000 1.0000
Kili 1.0000 1.0000
Kwajalein 0.9832 0.8352
Lae 1.0000 1.0000
Lib 1.0000 0.5000
Likiep 1.0000 0.8004
majuro 0.9660 0.4205
maloelap 1.0000 1.0000
mejit 0.9649 0.6000
mili 0.9930 0.9930
Namdrik 1.0000 1.0000
Namu 0.9924 0.6418
ujae 1.0000 1.0000
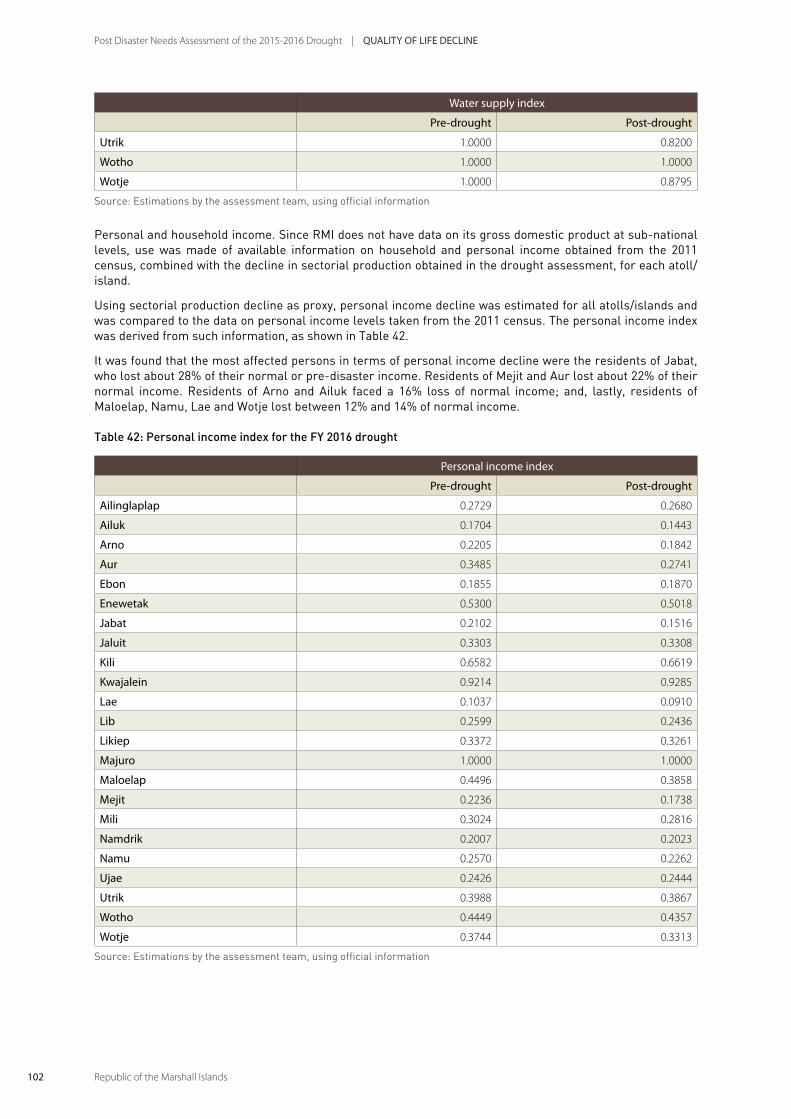
Republic of the Marshall Islands 102 Republic of the Marshall Islands
Post Disaster Needs Assessment of the 2015-2016 Drought | QuaLity OF LiFE DEcLiNE
Water supply index
Pre-drought Post-drought
utrik 1.0000 0.8200
Wotho 1.0000 1.0000
Wotje 1.0000 0.8795
Source: Estimations by the assessment team, using official information
Personal and household income. Since RMI does not have data on its gross domestic product at sub-national levels, use was made of available information on household and personal income obtained from the 2011 census, combined with the decline in sectorial production obtained in the drought assessment, for each atoll/island.
Using sectorial production decline as proxy, personal income decline was estimated for all atolls/islands and was compared to the data on personal income levels taken from the 2011 census. The personal income index was derived from such information, as shown in Table 42.
It was found that the most affected persons in terms of personal income decline were the residents of Jabat, who lost about 28% of their normal or pre-disaster income. Residents of Mejit and Aur lost about 22% of their normal income. Residents of Arno and Ailuk faced a 16% loss of normal income; and, lastly, residents of Maloelap, Namu, Lae and Wotje lost between 12% and 14% of normal income.
Table 42: Personal income index for the FY 2016 drought
Personal income index
Pre-drought Post-drought
ailinglaplap 0.2729 0.2680
ailuk 0.1704 0.1443
arno 0.2205 0.1842
aur 0.3485 0.2741
Ebon 0.1855 0.1870
Enewetak 0.5300 0.5018
Jabat 0.2102 0.1516
Jaluit 0.3303 0.3308
Kili 0.6582 0.6619
Kwajalein 0.9214 0.9285
Lae 0.1037 0.0910
Lib 0.2599 0.2436
Likiep 0.3372 0.3261
majuro 1.0000 1.0000
maloelap 0.4496 0.3858
mejit 0.2236 0.1738
mili 0.3024 0.2816
Namdrik 0.2007 0.2023
Namu 0.2570 0.2262
ujae 0.2426 0.2444
utrik 0.3988 0.3867
Wotho 0.4449 0.4357
Wotje 0.3744 0.3313
Source: Estimations by the assessment team, using official information

Republic of the Marshall Islands 103Republic of the Marshall Islands
Post Disaster Needs Assessment of the 2015-2016 Drought | QuaLity OF LiFE DEcLiNE Post Disaster Needs Assessment of the 2015-2016 Drought | QuaLity OF LiFE DEcLiNE
13.2 Composite Quality-of-Life IndexThe equal weighting of the above-described four sectorial indices enabled the estimation of the Composite Quality of Life Index for each of the atoll/islands, before and after the FY 2016 drought. The values are shown in Table 43 and in Figure 21.
Table 43: Composite Quality of Life Index for pre-drought and post-drought conditions
composite QLi
Pre-drought Post-drought
ailinglaplap 0.8077 0.6385
ailuk 0.7854 0.5518
arno 0.7891 0.5676
aur 0.8223 0.6717
Ebon 0.7717 0.7209
Enewetak 0.8300 0.6708
Jabat 0.7987 0.5731
Jaluit 0.8255 0.7453
Kili 0.8941 0.8683
Kwajalein 0.9496 0.8976
Lae 0.7634 0.6334
Lib 0.7974 0.5994
Likiep 0.8310 0.6469
majuro 0.9649 0.7970
maloelap 0.8529 0.7078
mejit 0.7888 0.6288
mili 0.8036 0.6733
Namdrik 0.7880 0.6775
Namu 0.8006 0.6333
ujae 0.8069 0.7794
utrik 0.8363 0.7684
Wotho 0.8595 0.7247
Wotje 0.8377 0.7585
Source: Estimations by the assessment team, using official information
The highest decline in terms of the Composite Quality of Life Index (QLI) occurred in the case of persons residing in Ailuk (30% decline). Residents of Jabot, Arno, Lib, Likiep and Namu atolls sustained a decline of between 21% and 28%. Persons residing in Enewetak, Aur, Majuro, Maloelap, Lae, and Mili, faced a decline ranging between 15% and 20% (see Figures 23 and 24).

Republic of the Marshall Islands 104 Republic of the Marshall Islands
Post Disaster Needs Assessment of the 2015-2016 Drought | QuaLity OF LiFE DEcLiNE
115
Jabat 0.7987 0.5731 Jaluit 0.8255 0.7453 Kili 0.8941 0.8683 Kwajalein 0.9496 0.8976 Lae 0.7634 0.6334 Lib 0.7974 0.5994 Likiep 0.8310 0.6469 Majuro 0.9649 0.7970 Maloelap 0.8529 0.7078 Mejit 0.7888 0.6288 Mili 0.8036 0.6733 Namdrik 0.7880 0.6775 Namu 0.8006 0.6333 Ujae 0.8069 0.7794 Utrik 0.8363 0.7684 Wotho 0.8595 0.7247 Wotje 0.8377 0.7585 Source: Estimations by the assessment team, using official information The highest decline in terms of the Composite Quality of Life Index (QLI) occurred in the case of persons residing in Ailuk (30% decline). Residents of Jabot, Arno, Lib, Likiep and Namu atolls sustained a decline of between 21% and 28%. Persons residing in Enewetak, Aur, Majuro, Maloelap, Lae, and Mili, faced a decline ranging between 15% and 20% (see Figures 23 and 24).
Figure 23: Value of Composite Quality-‐of-‐Life Index for pre-‐ and post-‐drought conditions Source: Estimations by the assessment team
0.5000
0.5500
0.6000
0.6500
0.7000
0.7500
0.8000
0.8500
0.9000
0.9500
1.0000 Composite quality of life index
Pre-‐drought Post-‐drought
Figure 23: Value of Composite Quality-of-Life Index for pre- and post-drought conditions
Source: Estimations by the assessment team

Republic of the Marshall Islands 105Republic of the Marshall Islands
Post Disaster Needs Assessment of the 2015-2016 Drought | QuaLity OF LiFE DEcLiNE Post Disaster Needs Assessment of the 2015-2016 Drought | QuaLity OF LiFE DEcLiNE
116
A.
B.
Figure 24: Most affected atolls/islands in terms of quality of life index decline: A. The graph shows the composite QLI decline as a percentage; B. Shows the QLI percentage decline in geographical terms.
5 10 15 20 25 30
Ailuk Jabat Arno
Lib Likiep Namu Mejit
Enewetak Aur
Majuro Maloelap
Lae Mili
Wotho Nambrik
Jaluit Wotje URrik
Percent decline in QLI
116
A.
B.
Figure 24: Most affected atolls/islands in terms of quality of life index decline: A. The graph shows the composite QLI decline as a percentage; B. Shows the QLI percentage decline in geographical terms.
5 10 15 20 25 30
Ailuk Jabat Arno
Lib Likiep Namu Mejit
Enewetak Aur
Majuro Maloelap
Lae Mili
Wotho Nambrik
Jaluit Wotje URrik
Percent decline in QLI A.
B.
Figure 24: Most affected atolls/islands in terms of quality of life index decline: A. The graph shows the composite QLI decline as a percentage; B. Shows the QLI percentage decline in geographical terms.
Source: Estimations by the assessment team
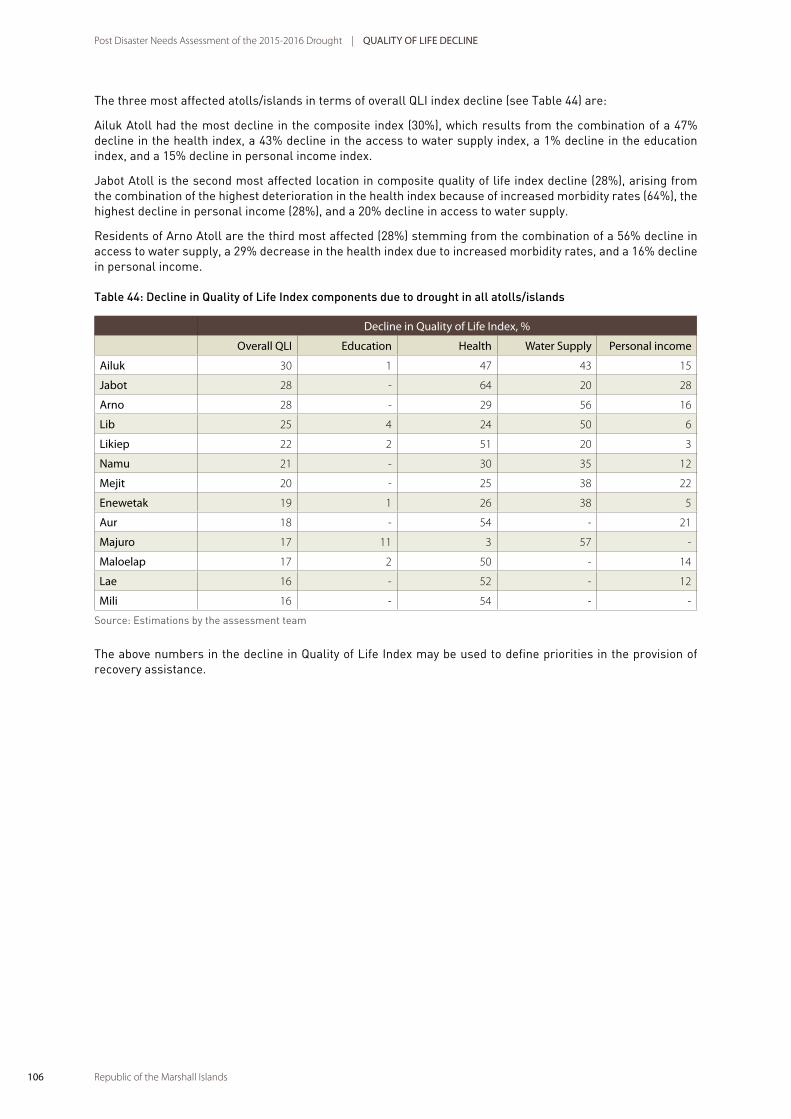
Republic of the Marshall Islands 106 Republic of the Marshall Islands Republic of the Marshall Islands
Post Disaster Needs Assessment of the 2015-2016 Drought | QuaLity OF LiFE DEcLiNE
The three most affected atolls/islands in terms of overall QLI index decline (see Table 44) are:
Ailuk Atoll had the most decline in the composite index (30%), which results from the combination of a 47% decline in the health index, a 43% decline in the access to water supply index, a 1% decline in the education index, and a 15% decline in personal income index.
Jabot Atoll is the second most affected location in composite quality of life index decline (28%), arising from the combination of the highest deterioration in the health index because of increased morbidity rates (64%), the highest decline in personal income (28%), and a 20% decline in access to water supply.
Residents of Arno Atoll are the third most affected (28%) stemming from the combination of a 56% decline in access to water supply, a 29% decrease in the health index due to increased morbidity rates, and a 16% decline in personal income.
Table 44: Decline in Quality of Life Index components due to drought in all atolls/islands
Decline in Quality of Life index, %
Overall QLi Education Health Water Supply Personal income
ailuk 30 1 47 43 15
Jabot 28 - 64 20 28
arno 28 - 29 56 16
Lib 25 4 24 50 6
Likiep 22 2 51 20 3
Namu 21 - 30 35 12
mejit 20 - 25 38 22
Enewetak 19 1 26 38 5
aur 18 - 54 - 21
majuro 17 11 3 57 -
maloelap 17 2 50 - 14
Lae 16 - 52 - 12
mili 16 - 54 - -
Source: Estimations by the assessment team
The above numbers in the decline in Quality of Life Index may be used to define priorities in the provision of recovery assistance.
Republic of the Marshall Islands 107Republic of the Marshall Islands Republic of the Marshall Islands
Post Disaster Needs Assessment of the 2015-2016 Drought | QuaLity OF LiFE DEcLiNE Post Disaster Needs Assessment of the 2015-2016 Drought | Executive Summary
Republic of the Marshall Islands
Post Disaster Needs Assessment of the 2015-2016 Drought | Executive Summary
BIBLIOGRAPHY
107

Republic of the Marshall Islands 108 Republic of the Marshall Islands Republic of the Marshall Islands
Post Disaster Needs Assessment of the 2015-2016 Drought | BiBLiOGraPHy
Abbott, D. and Gardner, J. 2015. Socio-Economic Vulnerability Assessment of the Republic of the Marshall Islands, Asian Development Bank: Manila.
Ahmad, R. and Weiser, E. 2006. Fostering public participation in budget-making. Asian Development Bank: Manila.
EPPSO (Economic Policy, Planning and Statistics Office). 2007. Republic of the Marshall Islands demographic and health survey 2007. Majuro, Republic of Marshall Islands: EPPSO.
EPPSO (Economic Policy, Planning and Statistics Office). 2009. Demographic and Health Survey Report 2007. Republic of the Marshall Islands and SPC Statistics for Development Programme.
EPPSO (Economic Policy, Planning and Statistics Office). 2012. 2011 Census Report. Republic of the Marshall Islands and SPC Statistics for Development Programme.
FAO (Food and Agricultural Organization). 2000. Food Security Brief-Marshall Islands.
GRMI (Government of the Republic of the Marshall Islands) 2006 Community survey. Majuro: Government of the Republic of the Marshall Islands.
GRMI (Government of the Republic of the Marshall Islands) 2011 Population census. Majuro: Government of the Republic of the Marshall Islands.
GRMI (Government of the Republic of the Marshall Islands) 2012 Labor force survey. Majuro: Government of the Republic of the Marshall Islands.
GRMI (Government of the Republic of the Marshall Islands) 2015 RMI Socio-economic vulnerability assessment. Majuro: Government of the Republic of the Marshall Islands.
GRMI (Government of the Republic of the Marshall Islands) 2015 Employer skills needs survey. Majuro: Government of the Republic of the Marshall Islands.
GRMI (Government of Republic of the Marshall Islands) (2015). Trade Policy of Republic of the Marshall Islands. Ministry of Resources and Development, Trade and Investment Division. Republic of the Marshall Islands.
GRMI (Government of the Republic of the Marshall Islands). 2016. State report on the Convention on the Elimination of All Forms of Discrimination against Women (CEDAW). Majuro: Republic of the Marshall Islands.
Hydration for Health. Hydration in pregnancy and breastfeeding - During lactation. http://www.h4hinitiative.com/h4h-academy/hydration-lab/hydration-pregnancy-and-breastfeeding/during-lactation. Accessed 17/09/2016.
IHME (Institute for Health Metrics and Evaluation). 2010. GBD Compare | Viz Hub http://vizhub.healthdata.org/gbd-compare/
IMO (International Organization for Migration). 2016. Marshall Islands: El Niño drought response. IOM Marshall Islands Situation Report #2 – May 05, 2016. Available online at: http://newscentral.exsees.com/item/4420be7756c62f7285ed93bc99b01063-f5dbfae4b5e69a1d1d76d9a248dc3496.
JMP (Joint Monitoring Programme). 2015. Progress on sanitation and drinking-water: 2015 update. Joint Monitoring Programme, WHO and UNICEF.
Jovel, R. 2015. Estimation of disaster-induced losses to define post-disaster recovery requirements. In Asian Disaster Management News, Volume 22, Asian Disaster Preparedness Center, Bangkok, Thailand.
MOH (Ministry of Health). 2013. Annual Report 2012. Majuro: Republic of the Marshall Islands.
MIA (Ministry of Internal Affairs). 2014. National study on family health and safety. Majuro: Republic of the Marshall Islands.
National Cancer Institute. 2004. Estimation of the baseline number of cancers among Marshallese and the number of cancers attributable to exposure to fallout from nuclear weapons testing conducted in the Marshall Islands.
Parker, A. April/May 2016. Child-focused assessment of El Niño drought impact, response and gaps in RMI and FSM. Vanuatu. UNICEF.
EU (European Union), GFDRR (Global Facility for Disaster Reduction and Recovery), United Nations. Undated. PDNA Guidelines Vol B. Employment, livelihoods and social protection.
PWWA (Pacific Water and Wastes Association). 2015. htp://www.pwwa.ws/index.php?page=Database.
Public Service Commission. 2015. State of the service report 2014. Majuro: Government of the Republic of the Marshall Islands.
Sinclair, P., Galvis, S., Loco, A., Kumar, A. 2016. Assessment of the 2015-2016 Drought Impacts on the Laura Fresh Groundwater Lens, Majuro Atoll, Republic of Marshall Islands. SPC Report Technical Report SPC00010.
UNICEF Pacific. 2012. Child protection baseline report: Republic of the Marshall Islands. Suva, Fiji: UNICEF Pacific.
US State Department. 2016. Trafficking in persons report.
WHO, et al., 2007. A joint statement, community based management of severe acute malnutrition, http://www.unicef.org/publications/files/Community_Based_Management_of_Sever_Acute__Malnutirtion.pdf and http://www.unicef.org/eapro/UNICEF_program_guidance_on_management_of_SAM_2015.pdf
Republic of the Marshall Islands

Republic of the Marshall Islands Republic of the Marshall Islands Republic of the Marshall Islands
Post Disaster Needs Assessment of the 2015-2016 Drought | BiBLiOGraPHy Post Disaster Needs Assessment of the 2015-2016 Drought | Executive Summary
Republic of the Marshall Islands
Post Disaster Needs Assessment of the 2015-2016 Drought | Executive Summary
ANNEXES
109
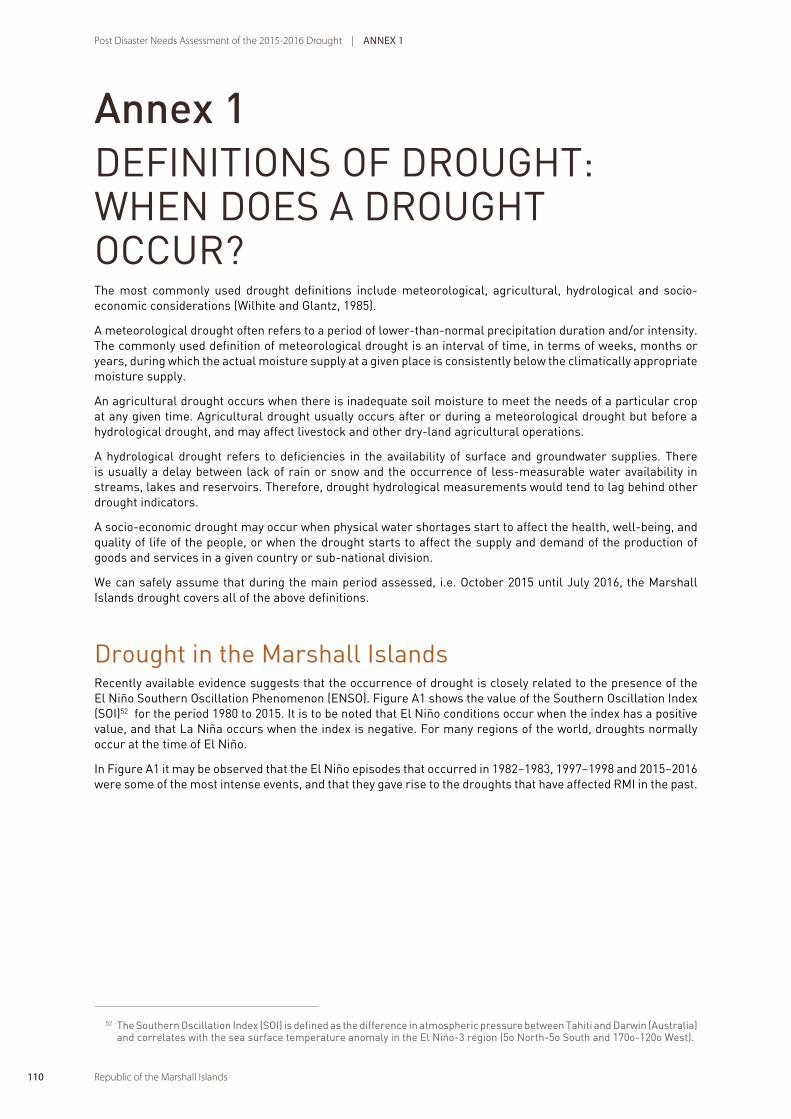
Republic of the Marshall Islands 110 Republic of the Marshall Islands
Post Disaster Needs Assessment of the 2015-2016 Drought | aNNEx 1
Annex 1DEFINITIONS OF DROuGHT: WHEN DOES A DROuGHT OCCuR?The most commonly used drought definitions include meteorological, agricultural, hydrological and socio-economic considerations (Wilhite and Glantz, 1985).
A meteorological drought often refers to a period of lower-than-normal precipitation duration and/or intensity. The commonly used definition of meteorological drought is an interval of time, in terms of weeks, months or years, during which the actual moisture supply at a given place is consistently below the climatically appropriate moisture supply.
An agricultural drought occurs when there is inadequate soil moisture to meet the needs of a particular crop at any given time. Agricultural drought usually occurs after or during a meteorological drought but before a hydrological drought, and may affect livestock and other dry-land agricultural operations.
A hydrological drought refers to deficiencies in the availability of surface and groundwater supplies. There is usually a delay between lack of rain or snow and the occurrence of less-measurable water availability in streams, lakes and reservoirs. Therefore, drought hydrological measurements would tend to lag behind other drought indicators.
A socio-economic drought may occur when physical water shortages start to affect the health, well-being, and quality of life of the people, or when the drought starts to affect the supply and demand of the production of goods and services in a given country or sub-national division.
We can safely assume that during the main period assessed, i.e. October 2015 until July 2016, the Marshall Islands drought covers all of the above definitions.
Drought in the Marshall IslandsRecently available evidence suggests that the occurrence of drought is closely related to the presence of the El Niño Southern Oscillation Phenomenon (ENSO). Figure A1 shows the value of the Southern Oscillation Index (SOI)52 for the period 1980 to 2015. It is to be noted that El Niño conditions occur when the index has a positive value, and that La Niña occurs when the index is negative. For many regions of the world, droughts normally occur at the time of El Niño.
In Figure A1 it may be observed that the El Niño episodes that occurred in 1982–1983, 1997–1998 and 2015–2016 were some of the most intense events, and that they gave rise to the droughts that have affected RMI in the past.
52 The Southern Oscillation Index (SOI) is defined as the difference in atmospheric pressure between Tahiti and Darwin (Australia) and correlates with the sea surface temperature anomaly in the El Niño-3 region (5o North-5o South and 170o-120o West).

Republic of the Marshall Islands 111Republic of the Marshall Islands
Post Disaster Needs Assessment of the 2015-2016 Drought | aNNEx 1 Post Disaster Needs Assessment of the 2015-2016 Drought | aNNEx 1
122
Figure A1: Variation of the El Niño Southern Oscillation Index 1980–2016
Source: National Oceanic and Atmospheric Administration Figure A2: Annual rainfall rates and average monthly rainfall at Majuro, RMI, 1980–2016
Source: Majuro Meteorological Service A comparison of the annual rainfall rates measured at Majuro (see Figure A2) with the El Niño Index chart shown in Figure A1 shows the correlation between the Southern Oscillation Index and
-‐2.5
-‐2
-‐1.5
-‐1
-‐0.5
0
0.5
1
1.5
2
2.5
3
1980 1985 1990 1995 2000 2005 2010 2015
SOU
THER
N O
SCIL
LATI
ON
IND
EX
2,000
2,500
3,000
3,500
4,000
4,500
5,000
1980 1990 2000 2010
Ann
ual P
reci
pita
Ron,
mm
Annual Average
3,218 mm
Figure A2: Annual rainfall rates and average monthly rainfall at Majuro, RMI, 1980–2016
Source: Majuro Meteorological Service
A comparison of the annual rainfall rates measured at Majuro (see Figure A2) with the El Niño Index chart shown in Figure A1 shows the correlation between the Southern Oscillation Index and precipitation on the island, with a delay of about one year between the peak value of the index and the decline of annual rainfall on the island.
A similar situation is seen when analyzing annual rainfall at other locations within RMI, such as in Kwajalein (see Figure A3). Data from Kwajalein for the period 2010 to 2016 indicate that monthly rainfall started falling below the average in the fourth quarter of 2012 and continued below normal for nearly all of 2013. Furthermore, a similar drought started in the fourth quarter of 2015 and has continued until at least early August 2016.
Figure A1: Variation of the El Niño Southern Oscillation Index 1980–2016
Source: National Oceanic and Atmospheric Administration

Republic of the Marshall Islands 112 Republic of the Marshall Islands
Post Disaster Needs Assessment of the 2015-2016 Drought | aNNEx 1
123
precipitation on the island, with a delay of about one year between the peak value of the index and the decline of annual rainfall on the island. A similar situation is seen when analyzing annual rainfall at other locations within RMI, such as in Kwajalein (see Figure A3). Data from Kwajalein for the period 2010 to 2016 indicate that monthly rainfall started falling below the average in the fourth quarter of 2012 and continued below normal for nearly all of 2013. Furthermore, a similar drought started in the fourth quarter of 2015 and has continued until at least early August 2016. Figure A3: Monthly rainfall rates and average monthly rainfall at Kwajalein, 2010 to 2016
Source: Majuro Meteorological Service It can be seen that drought periods for RMI have lasted for more than 12 months in the present decade, and that monthly rainfall during the same period has declined to less than 10% of the normal precipitation rates for two or more months, which shows the severity of rainfall shortages. Obviously, there are differences in drought severity among the atolls, but this, in combination with the prevailing vulnerability of the population, helps to give a picture of the effect of the drought on each island and atoll. The expected duration of the current drought cannot be known at this time, since insufficient data are available for that purpose. Moreover, although rainfall resumed at the start of August, it is not possible to know whether the current drought is finished. Reference Wilhite, D.A.; and M.H. Glantz. 1985. Understanding the Drought Phenomenon: The Role of Definitions. Water International. vol 10, part 3, pages 111–120.
-‐
100
200
300
400
500
600
700
J M M J S N J M M J S N J M M J S N J M M J S N J M M J S N J M M J S N J M M J S N
2010 2011 2012 2013 2014 2015 2016
Mon
thly
rain
fall,
mm
Actual rainfall Average rainfall
Figure A3: Monthly rainfall rates and average monthly rainfall at Kwajalein, 2010 to 2016
Source: Majuro Meteorological Service
It can be seen that drought periods for RMI have lasted for more than 12 months in the present decade, and that monthly rainfall during the same period has declined to less than 10% of the normal precipitation rates for two or more months, which shows the severity of rainfall shortages. Obviously, there are differences in drought severity among the atolls, but this, in combination with the prevailing vulnerability of the population, helps to give a picture of the effect of the drought on each island and atoll.
The expected duration of the current drought cannot be known at this time, since insufficient data are available for that purpose. Moreover, although rainfall resumed at the start of August, it is not possible to know whether the current drought is finished.
ReferenceWilhite, D.A.; and M.H. Glantz. 1985. Understanding the Drought Phenomenon: The Role of Definitions. Water International. Vol 10, part 3, pages 111–120.
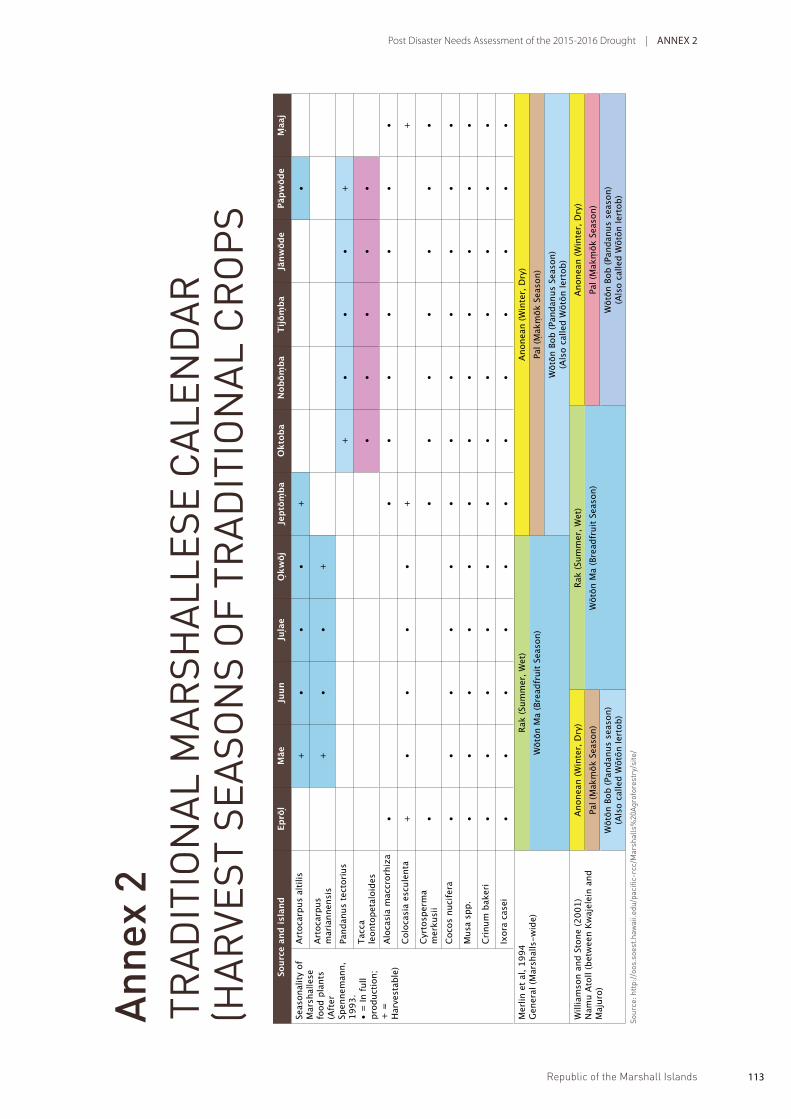
Republic of the Marshall Islands 113Republic of the Marshall Islands
Post Disaster Needs Assessment of the 2015-2016 Drought | aNNEx 1 Post Disaster Needs Assessment of the 2015-2016 Drought | aNNEx 2
Ann
ex 2
TR
AD
ITIO
NA
L M
AR
SHA
LLES
E C
ALE
ND
AR
(H
AR
vEST
SEA
SON
S O
F TR
AD
ITIO
NA
L C
RO
PS
Sour
ce a
nd is
land
Eprol
Mae
Juun
Julae
Okwoj
Jeptom
baOktoba
Nobom
baTijomba
Janwode
Papwode
Maaj
Seas
onal
ity o
f M
arsh
alle
se
food
pla
nts
(Aft
er
Spen
nem
ann,
19
93.
• =
In fu
ll pr
oduc
tion;
+ =
H
arve
stab
le)
Arto
carp
us a
ltilis
+•
••
+•
Arto
carp
us
mar
iann
ensi
s+
••
+
Pand
anus
tect
oriu
s+
••
•+
Tacc
a le
onto
peta
loid
es•
••
••
Aloc
asia
mac
cror
hiza
••
••
••
••
Colo
casi
a es
cule
nta
+•
••
•+
+
Cyrt
ospe
rma
mer
kusi
i•
••
••
••
•
Coco
s nu
cife
ra•
••
••
••
••
••
•
Mus
a sp
p.
••
••
••
••
••
••
Crin
um b
aker
i•
••
••
••
••
••
•
Ixor
a ca
sei
••
••
••
••
••
••
Mer
lin e
t al,
1994
Gene
ral (
Mar
shal
ls-w
ide)
Rak
(Sum
mer
, Wet
)An
onea
n (W
inte
r, D
ry)
Wōt
ōn M
a (B
read
frui
t Sea
son)
Pal (
Ṃak
ṃōk
Sea
son)
Wōt
ōn B
ob (P
anda
nus
Seas
on)
(Als
o ca
lled
Wōt
ōn Ie
rtob
)W
illia
mso
n an
d St
one
(200
1)N
amu
Atol
l (be
twee
n Kw
ajel
ein
and
Maj
uro)
Anon
ean
(Win
ter,
Dry
)Ra
k (S
umm
er, W
et)
Anon
ean
(Win
ter,
Dry
)Pa
l (Ṃ
akṃ
ōk S
easo
n)W
ōtōn
Ma
(Bre
adfr
uit S
easo
n)Pa
l (Ṃ
akṃ
ōk S
easo
n)W
ōtōn
Bob
(Pan
danu
s se
ason
)(A
lso
calle
d W
ōtōn
Iert
ob)
Wōt
ōn B
ob (P
anda
nus
seas
on)
(Als
o ca
lled
Wōt
ōn Ie
rtob
)So
urce
: htt
p://
oos.
soes
t.haw
aii.e
du/p
acifi
c-rc
c/M
arsh
alls
%20
Agr
ofor
estr
y/si
te/
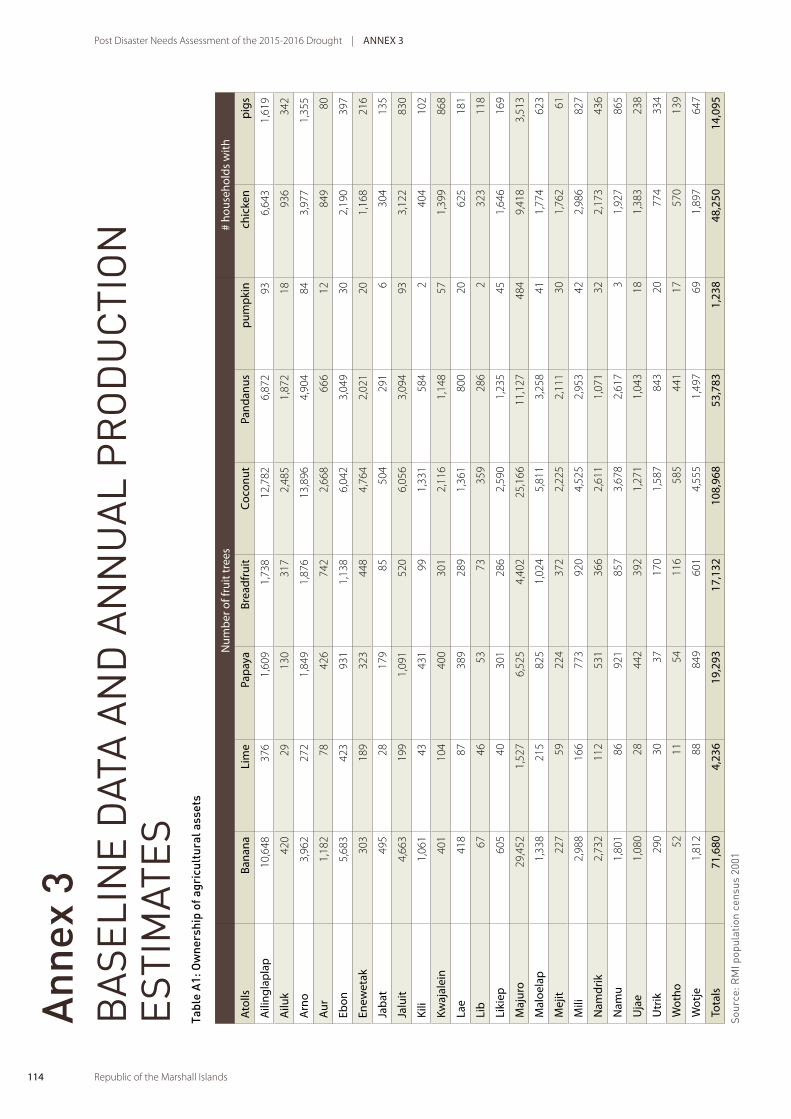
Republic of the Marshall Islands 114 Republic of the Marshall Islands
Post Disaster Needs Assessment of the 2015-2016 Drought | aNNEx 3
Ann
ex 3
bA
SELI
NE
DAT
A A
ND
AN
Nu
AL
PR
OD
uC
TIO
N
ESTI
MAT
ESTa
ble
A1:
Ow
ners
hip
of a
gric
ultu
ral a
sset
s
Num
ber
of f
ruit
tree
s#
hous
ehol
ds w
ith
ato
llsBa
nana
Lim
ePa
pay
aBr
eadf
ruit
coc
onut
Pand
anus
pum
pki
n ch
icke
n p
igs
aili
ngla
pla
p10
,648
376
1,60
91,
738
12,7
826,
872
936,
643
1,61
9
ailu
k42
029
130
317
2,48
51,
872
1893
634
2
arn
o3,
962
272
1,84
91,
876
13,8
964,
904
843,
977
1,35
5
aur
1,18
278
426
742
2,66
866
612
849
80
Ebon
5,68
342
393
11,
138
6,04
23,
049
302,
190
397
Enew
etak
303
189
323
448
4,76
42,
021
201,
168
216
Jab
at49
528
179
8550
429
16
304
135
Jalu
it4,
663
199
1,09
152
06,
056
3,09
493
3,12
283
0
Kili
1,06
143
431
991,
331
584
240
410
2
Kwaj
alei
n40
110
440
030
12,
116
1,14
857
1,39
986
8
Lae
418
8738
928
91,
361
800
2062
518
1
Lib
6746
5373
359
286
232
311
8
Liki
ep60
540
301
286
2,59
01,
235
451,
646
169
maj
uro
29,4
521,
527
6,52
54,
402
25,1
6611
,127
484
9,41
83,
513
mal
oela
p1,
338
215
825
1,02
45,
811
3,25
841
1,77
462
3
mej
it22
759
224
372
2,22
52,
111
301,
762
61
mili
2,98
816
677
392
04,
525
2,95
342
2,98
682
7
Nam
drik
2,73
211
253
136
62,
611
1,07
132
2,17
343
6
Nam
u1,
801
8692
185
73,
678
2,61
73
1,92
786
5
uja
e1,
080
2844
239
21,
271
1,04
318
1,38
323
8
utr
ik29
030
3717
01,
587
843
2077
433
4
Wot
ho52
1154
116
585
441
1757
013
9
Wot
je1,
812
8884
960
14,
555
1,49
769
1,89
764
7
tota
ls71
,680
4,23
619
,293
17,1
3210
8,96
853
,783
1,23
848
,250
14,0
95
Sour
ce: R
MI p
opul
atio
n ce
nsus
200
1

Republic of the Marshall Islands 115Republic of the Marshall Islands
Post Disaster Needs Assessment of the 2015-2016 Drought | aNNEx 3 Post Disaster Needs Assessment of the 2015-2016 Drought | aNNEx 3
Tabl
e A
2: P
rodu
ctiv
ity
of a
gric
ultu
ral a
sset
s
ave
rage
pro
duct
ion
(t/t
ree/
year
)a
vera
ge p
rodu
ctio
n (t
/yea
r)
ato
llsBa
nana
Lim
ePa
pay
aBr
eadf
ruit
coc
onut
Pand
anus
pum
pki
nBa
nana
Lim
ePa
pay
aBr
eadf
ruit
coc
onut
Pand
anus
*p
ump
kin
aili
ngla
pla
p0.
0225
0.1
0.03
0.24
0.3
0.01
50.
2424
038
4841
73,
835
5222
ailu
k0.
0225
0.1
0.03
0.24
0.3
0.01
50.
249
34
7675
144
arn
o0.
0225
0.1
0.03
0.24
0.3
0.01
50.
2489
2755
450
417
3720
aur
0.02
250.
10.
030.
240.
30.
015
0.24
278
1317
880
53
Ebon
0.02
250.
10.
030.
240.
30.
015
0.24
128
4228
273
181
237
Enew
etak
0.02
250.
10.
030.
240.
30.
015
0.24
719
1010
814
315
1
Jab
at0.
0225
0.1
0.03
0.24
0.3
0.01
50.
2411
35
2015
25
Jalu
it0.
0225
0.1
0.03
0.24
0.3
0.01
50.
2410
520
3312
518
223
22
Kili
0.02
250.
10.
030.
240.
30.
015
0.24
244
1324
404
0
Kwaj
alei
n0.
0225
0.1
0.03
0.24
0.3
0.01
50.
249
1012
7263
914
Lae
0.02
250.
10.
030.
240.
30.
015
0.24
99
1269
416
5
Lib
0.02
250.
10.
030.
240.
30.
015
0.24
25
218
112
0
Liki
ep0.
0225
0.1
0.03
0.24
0.3
0.01
50.
2414
49
6978
911
maj
uro
0.02
250.
10.
030.
240.
30.
015
0.24
663
153
196
1,05
675
583
116
mal
oela
p0.
0225
0.1
0.03
0.24
0.3
0.01
50.
2430
2225
246
174
2410
mej
it0.
0225
0.1
0.03
0.24
0.3
0.01
50.
245
67
8967
167
mili
0.02
250.
10.
030.
240.
30.
015
0.24
6717
2322
113
622
10
Nam
drik
0.02
250.
10.
030.
240.
30.
015
0.24
6111
1688
788
8
Nam
u0.
0225
0.1
0.03
0.24
0.3
0.01
50.
2441
928
206
110
201
uja
e0.
0225
0.1
0.03
0.24
0.3
0.01
50.
2424
313
9438
84
utr
ik0.
0225
0.1
0.03
0.24
0.3
0.01
50.
247
31
4148
65
Wot
ho0.
0225
0.1
0.03
0.24
0.3
0.01
50.
241
12
2818
34
Wot
je0.
0225
0.1
0.03
0.24
0.3
0.01
50.
2441
925
144
137
1117
tota
ls
1,61
342
457
94,
112
6,72
040
329
7
Sour
ce: P
rodu
ctio
n es
timat
ed b
y M
oR&
D te
am*
Onl
y ar
ound
50%
of p
anda
nus
vari
etie
s be
ar fr
uit

Republic of the Marshall Islands 116 Republic of the Marshall Islands
Post Disaster Needs Assessment of the 2015-2016 Drought | aNNEx 3
Tabl
e A
3: F
arm
gat
e pr
ices
Farm
gat
e p
rice
uSD
/sho
rt to
n
Bana
naLi
me
Pap
aya
Brea
dfru
itco
conu
tPa
ndan
usPu
mp
kin
chic
ken
pig
s
600.
020
00.0
2000
.020
00.0
250.
020
00.0
1500
.020
.040
.0
600.
020
00.0
2000
.020
00.0
250.
020
00.0
1500
.020
.040
.0
600.
020
00.0
2000
.020
00.0
250.
020
00.0
1500
.020
.040
.0
600.
020
00.0
2000
.020
00.0
250.
020
00.0
1500
.020
.040
.0
600.
020
00.0
2000
.020
00.0
250.
020
00.0
1500
.020
.040
.0
600.
020
00.0
2000
.020
00.0
250.
020
00.0
1500
.020
.040
.0
600.
020
00.0
2000
.020
00.0
250.
020
00.0
1500
.020
.040
.0
600.
020
00.0
2000
.020
00.0
250.
020
00.0
1500
.020
.040
.0
600.
020
00.0
2000
.020
00.0
250.
020
00.0
1500
.020
.040
.0
1100
.030
00.0
3000
.030
00.0
500.
033
33.3
1500
.020
.040
.0
600.
020
00.0
2000
.020
00.0
250.
020
00.0
1500
.020
.040
.0
600.
020
00.0
2000
.020
00.0
500.
020
00.0
1500
.020
.040
.0
600.
020
00.0
2000
.020
00.0
250.
020
00.0
1500
.020
.040
.0
1100
.030
00.0
3000
.030
00.0
500.
033
33.3
1500
.020
.040
.0
600.
020
00.0
2000
.020
00.0
250.
020
00.0
1500
.020
.040
.0
600.
020
00.0
2000
.020
00.0
250.
020
00.0
1500
.020
.040
.0
600.
020
00.0
2000
.020
00.0
250.
020
00.0
1500
.020
.040
.0
600.
020
00.0
2000
.020
00.0
250.
020
00.0
1500
.020
.040
.0
600.
020
00.0
2000
.020
00.0
250.
020
00.0
1500
.020
.040
. 0
600.
020
00.0
2000
.020
00.0
250.
020
00.0
1500
.020
.040
.0
600.
020
00.0
2000
.020
00.0
250.
020
00.0
1500
.020
.040
.0
600.
020
00.0
2000
.020
00.0
250.
020
00.0
1500
.020
.040
.0
600.
020
00.0
2000
.020
00.0
250.
020
00.0
1500
.020
.040
.0
Sour
ce: E
stim
ated
by
MR
&D
team

Republic of the Marshall Islands 117Republic of the Marshall Islands
Post Disaster Needs Assessment of the 2015-2016 Drought | aNNEx 3 Post Disaster Needs Assessment of the 2015-2016 Drought | aNNEx 4
Ann
ex 4
DR
Ou
GH
T IM
PAC
T O
N C
RO
PS
AN
D L
IvES
TOC
KTa
ble
A4:
Dro
ught
impa
ct o
n cr
ops
and
lives
tock
(% d
ecre
ase
in p
rodu
ctio
n, n
umbe
r of
mon
ths
prod
ucti
on w
as a
ffec
ted)
maj
uro
ato
ll W
otje
ato
ll m
ejit
ato
ll u
trik
ato
ll La
ea
toll
mal
oela
pa
iluk
%
de
crea
se#
mon
ths
imp
act
%
decr
ease
# m
onth
s im
pac
t%
de
crea
se#
mon
ths
imp
act
%
decr
ease
# m
onth
s im
pac
t%
de
crea
se#
mon
ths
imp
act
%
decr
ease
# m
onth
s im
pac
t%
de
crea
se#
mon
ths
imp
act
Bana
na25
450
4
10
04
Lim
e
25
3
Pap
aya
253
503
Brea
dfru
it60
475
450
440
425
360
3
taro
50
4
coc
onut
604
756
506
503
253
753
756
Pand
anus
804
753
503
404
603
753
Pum
pki
n
10
04
100
3
chi
cken
s
10
Pigs
5
10
ave
rage
%
all c
rop
s55
67
67
43
25
68
88
ato
ll Li
kiap
ato
ll W
otho
ato
ll a
iling
lap
lap
ato
ll a
ura
toll
Nam
ua
toll
uja
ea
toll
arn
o
%
de
crea
se#
mon
ths
imp
act
%
decr
ease
# m
onth
s im
pac
t%
de
crea
se#
mon
ths
imp
act
%
decr
ease
# m
onth
s im
pac
t%
de
crea
se#
mon
ths
imp
act
%
decr
ease
# m
onth
s im
pac
t%
de
crea
se#
mon
ths
imp
act
Bana
na50
325
4
25
3
25
325
6
Lim
e
Pap
aya
254
Brea
dfru
it25
350
310
375
450
325
350
3
taro
coc
onut
253
504
104
754
504
253
506

Republic of the Marshall Islands 118 Republic of the Marshall Islands
Post Disaster Needs Assessment of the 2015-2016 Drought | aNNEx 4
ato
ll Li
kiap
ato
ll W
otho
ato
ll a
iling
lap
lap
ato
ll a
ura
toll
Nam
ua
toll
uja
ea
toll
arn
o
%
de
crea
se#
mon
ths
imp
act
%
decr
ease
# m
onth
s im
pac
t%
de
crea
se#
mon
ths
imp
act
%
decr
ease
# m
onth
s im
pac
t%
de
crea
se#
mon
ths
imp
act
%
decr
ease
# m
onth
s im
pac
t%
de
crea
se#
mon
ths
imp
act
Pand
anus
253
503
103
754
503
253
Pum
pki
n
chi
cken
s
10
0
Pigs
10
10
0
ave
rage
%
all c
rop
s33
38
10
58
50
25
33
ato
ll En
ewet
akJa
bat
Jalu
itKi
liKw
ajal
ein
Lib
mili
%
de
crea
se#
mon
ths
imp
act
%
decr
ease
# m
onth
s im
pac
t%
de
crea
se#
mon
ths
imp
act
%
decr
ease
# m
onth
s im
pac
t%
de
crea
se#
mon
ths
imp
act
%
decr
ease
# m
onth
s im
pac
t%
de
crea
se#
mon
ths
imp
act
Bana
na
50
4
50
450
425
3
Lim
e
50
4
Pap
aya
504
Brea
dfru
it50
450
410
310
3
50
425
3
taro
50
4
coc
onut
504
876
104
104
504
504
253
Pand
anus
504
504
103
103
504
253
Pum
pki
n10
04
504
504
chi
cken
s
Pigs
ave
rage
%
all c
rop
s67
50
10
10
50
50
31
% d
ecre
ase
in
pro
duct
ion
76
–100
%
50
–75%
25
–49%
0–
24%

Republic of the Marshall Islands 119Republic of the Marshall Islands
Post Disaster Needs Assessment of the 2015-2016 Drought | aNNEx 4 Post Disaster Needs Assessment of the 2015-2016 Drought | aNNEx 5
Annex 5bACKGROuND TO THE WATER SECTOR IN RMIRMI’s geography of 29 low-lying atolls and five islands with no surface water and limited groundwater makes communities vulnerable to the changing rainfall patterns and sea-level rise. The predicted sea-level rise of 3–16 cm by 203053 and extreme tide events, as well as higher rainfall with longer and more intense dry periods, will significantly exacerbate the current water security issues facing RMI.
Strategic and policy contextRMI’s national strategic direction and development comes from two connected national plans: (i) The Vision 2018:TheStrategicDevelopmentPlanFramework2003–2018;and(ii)theNationalStrategicPlan2015−2017.In relation to water, Vision 2018 has two key vison statements: “Enabling all citizens to access clean and adequate water supplies” and a “level of hygiene and sanitation comparable to world standards”. A number of national sector strategies/plans support the National Strategic Plan 2015–2017, including the yet to be enacted National Water and Sanitation Policy. The National Water Task Force is responsible for the implementation and monitoring of the sector strategies and plans.
There are two state-owned enterprises (SOEs) that supply water to the urban population (74% of RMI population): the Majuro Water and Sewer Company Inc (MWSC)54 and Kwajalein Joint Utility Resource Inc. (KAJUR).55 The SOEs responsible for solid waste management were not included in the assessment as they were assessed early on and found not to be affected by the drought.
The RMI Environmental Protection Agency has the mandate on water governance and water quality monitoring. The Office of Environmental Planning and Policy Coordination is the lead agency for coordination of climate change-related issues. The National Disaster Management Organization (NDMO) leads the coordination and implementation of disaster response, recovery and mitigation. The Weather Service Office (WSO) monitors and analyses local and international weather information. NDMO is responsible for issuing warnings and for analysis to advise planning and response strategies to drought, cyclone, storm surges and earthquakes. Local governments under the Planning and Zoning Act are responsible for water-use planning and enforcing standards.
Baseline development indicatorsAccording to the Joint Monitoring Programme of UNICEF/WHO, RMI has met the Millennium Development Goal targets for water supply and has made good progress in sanitation56 (Figure A4). The launch of the United Nations Sustainable Development Goals has introduced new targets, notably Goal 6, which: “to ensure availability and sustainable management of water and sanitation for all”. The focus shifts from ensuring basic access (which RMI has achieved) to providing increasing levels of service by climbing the drinking water and sanitation ladders and providing further development opportunities.
53 The projections for the Marshall Islands for 2030, 2055 and 2090 under the B1, A1B and A2 emission scenarios indicate a sea-levelriseof3−16cmby2030,11−30cmby2055,and22−62cmby2090(AustralianBureauofMeteorology,2011).
54 Services the Majuro Atoll population, approximately 52% of RMI55 Services the Kwajalein Atoll population, approximately 22% of RMI56 http://www.wssinfo.org/fileadmin/user_upload/resources/JMP-Update-report-2015_English.pdf

Republic of the Marshall Islands
12%
5%
4%
3%
7%
92%
77%
Shared facilities
Drinking water other unimproved
Other unimproved facilities
Drinking water piped onto premises
Open defecation
Drinking water other improved source
Improved facilities
120 Republic of the Marshall Islands
Post Disaster Needs Assessment of the 2015-2016 Drought | aNNEx 5
Figure A4: Sanitation and drinking water access, Marshall Islands, 2015
Source: WHO/UNICEF Joint Monitoring Programme 2015

Republic of the Marshall Islands 121Republic of the Marshall Islands
Post Disaster Needs Assessment of the 2015-2016 Drought | aNNEx 5 Post Disaster Needs Assessment of the 2015-2016 Drought | aNNEx 6
Annex 6CLASSIFICATION OF APGAR SCORES
indicator value average value of apgar score for 2010
1.1 Water coverage 0 if<= 75%1 if between 75% and 90%2 if > 90%
1.14
2.1 Sewerage coverage 0 if <= 50%1 if between 50 and 80%2 if > 80%
1.20
6.2 Non-revenue water 0 if >= 40%1 if > 10 and < 402 if < 10%
1.09
19.1 Affordability 0 if > 2.5 %1 if between 1.0% and 2.5%2 if <= 1.0%
1.78
23.1 Collection period 0 if >= 180 days1 if between 90 and 180 days2 if <90 days
1.61
24.1 Operating cost coverage 0 if < 11 if between 1 and 1.402 if >=1.40
0.82
Overall apgar score critically low <=3.63.6 to critically low <= 7.2Normal>7.2
7.92
Source: IBNET DatabaseNote: the benchmarks as set reflect current database characteristics. The participation of ever more utilities and changes in their performance over time will likely necessitate adjustment of the benchmarks.

Republic of the Marshall Islands 122 Republic of the Marshall Islands
Post Disaster Needs Assessment of the 2015-2016 Drought | aNNEx 7
Annex 7SuMMARy OF FOCuS GROuP ObSERvATIONS FOR GENDER AND INCLuSIvITy
Site Focus groups Observations
arno Arno WUTMI chapter
Three villages combined:
Tinak
Kilange
Malel
Drought was worse in 2013.
With or without the drought, life is hard.
Well water salty – used for washing
RO Unit not converting enough fresh water from the salt water before it was moved to the next weto.
Local plants died during the drought, affecting both food supply and income production. (Even coconuts were becoming scarce.)
Need more water tanks.
Shipments of foods and supplies were inconsistent.
Government needs to provide more RO Units to every weto to ensure there is enough water.
Government needs to provide fair distribution of water catchments to every household and provide training for the care and maintenance of the catchments and testing quality water.
During the drought:
- Handicraft production decreased by 50%.
- Copra production decreased by 90%.
After the drought:
- Handicraft production is still decreasing (at the most by 50%)
- Copra has nearly recovered – up to 90% normal production
majuro Youth
Ladies of Elefa handicraft shop
Fishermen (Laura)
Ladies of Local market
Marshall Islands Disability Persons Organization
Ministry of Internal Affairs
Wellness
Current drought worse than 2013: hotter, longer, more fights, stealing water, widespread sicknesses – pinkeye, flu, diarrhea – plants were dying.
Need more water catchments, filling stations, and RO Units.
Urban/overpopulated areas experienced more fights over water.
In less populated areas, community members helped each other out and shared water. Good quantity of water supply.
Most vulnerable groups for collecting water were the ones without transportation, the elderly, and disabled.
Filling stations did not have convenient hours of operation.
No limit to filling containers, causing uneven water distribution (Youth – Ajeltake).
Double water filling due to confusion in not knowing who belongs to which household.
Filling stations were neglected – dirty and unclean water.
Landowners abused privileges and took water from communities.
Many filling stations were open only once weekly.
Not enough water and filling stations ran out.
Handicraft products were affected and people had to order supplies from outer islands (Elefa and local market).

Republic of the Marshall Islands 123Republic of the Marshall Islands
Post Disaster Needs Assessment of the 2015-2016 Drought | aNNEx 7 Post Disaster Needs Assessment of the 2015-2016 Drought | aNNEx 7
Site Focus groups Observations
For water conservation, many showered less – once weekly.
Distance to water station was inconvenient for some.
Increased spending during drought on water and supplies.
Frequent ailments and increased medical and transportation fees.
No existing community disaster committee or not aware of any.
There is a need for improved and frequent transportation, especially in rural areas.
(Disability) – Government should provide transportation during disasters and droughts. Also, make it disability-friendly and affordable, even free transportation for persons with disability.
(Disability) – designate a line or areas (at fill stations, etc.) for disabled and priority groups. Improve accessibility and availability for persons with disability.
(Disability) – Government should provide a water delivery system to homes of persons with disabilities.
Many people were aware of what to do during a drought but lacked the resources.
The production of local medicine was minimal due to dying plant.s
A lot of children were out of school during the drought for various reasons.
Government leaders abused the distribution of water catchments.
(Fishermen) – Before drought:
- 4–5 hours of fishing
(Fishermen) – During drought:
- 10 hours of fishing
- Fish migrated and fishermen travelled further out to sea to catch fish
- 1 gallon of drinking water per six fishermen during a 10-hour work shift
(Local Market: independent handicraft lady) – Before drought:
- Estimated profit: USD 300/weekly
(Local Market: independent handicraft lady) – During drought:
- No consistent weekly profit deposit
- Deposits were below USD 300
mili Men (Mili)
Women (Mili)
2015/2016 drought worse: longer and hotter.
Increase in money spending on food items (rice, flour, sugar) which all require water.
Telecommunications via HF Radio-07 and CB Radio-15.
More time spent treating/boiling drinking water to prevent illnesses.
Delayed meal time.
Fewer showers taken.
Develop health problems such as diarrhea, pink-eye, fever, and coughing.
Well-water used for household needs such as cleaning, washing, etc.
Need more water catchments, filling stations, RO Units.
Five gallons of drinking water per day.
Repair and clean existing concrete water catchments.
Need to secure catchments and filling stations with fences and locks.
Need more water catchments.
Need water-filling schedule.
The vulnerable groups that found it difficult to collect water were the ones without transportation.
Need assistance to repair the concrete water tanks, install two more water stations.

Republic of the Marshall Islands 124 Republic of the Marshall Islands
Post Disaster Needs Assessment of the 2015-2016 Drought | aNNEx 7
Site Focus groups Observations
Likiep Women (26–43 yrs) Melang Island
Women (40–70 yrs) Melang Island
Women (21–39 yrs) Jebel Island
Men (19–22 yrs) Melang Island,
Women (22–40 yrs) Likiep
Need more water distribution: more pontoons, RO Units.
Collected 5–10 gallons/day.
Well-water used for bathing and washing.
No schedule for filling.
Need testing kits for water quality.
Local foods eaten during hard times and emergencies were destroyed by the drought.
Communication and information relayed through radio station, HF/CB radio, internet, telephone, acting mayor, and mayor – but still need to improve access to communications.
Need watering system for crop plants/trees.
Groups that had difficulty accessing water: elderly, larger families, those living far from the filling station, families without water catchments, and those living on small islands.
Spent more money on food, water, and medicines.
Need more government field trips as families are relying more on imported water, foods and supplies.
Need water catchments for every household.
Need transport for water such as pushcarts.
No water for plants – the trees died.
Spend more time away from family due to longer fishing hours.
Need better attention and medical care for pregnant/breastfeeding mothers.
Need more medicines.
Livelihood and income through handicraft was severely affected due to drought destroying the plants.
Ebeye Women
Youth
This drought was worse than 2013.
Ebeye has only one water station so we need more; one in Rak Town, one in the middle, and one in North Camp.
There are two huge water tanks in Rock Town and North Camp and three at the Mon Ko near the public school. These water tanks should be fixed, cleaned, and filled for water storage and also install new water pumps.
People were lining up at the water station from morning until midnight. Children were pushed away and were told by the adults to go to the end of the line.
More RO units needed.
Water catchments in each weto and quarterly check the water and treatment.
Should continue providing people with information about the drought and shouldn’t be done only once. I heard only once and it stopped.
We had no access to communication system before and during the drought; only had the radio station but not everyone has a portable radio. We received information about the drought by word of mouth, churches and women’s groups.
Not enough drinking water per day.
Kwajalein limited access to water only two gallons per day for employees.
Fetching water back and forth but was not enough.
For drinking water 25 gallons but that’s it. When we went back for refill, the line was really long and we didn’t want to wait in line again.
Sometimes not enough water for baths and washing because I come home late from work and the line is already long.
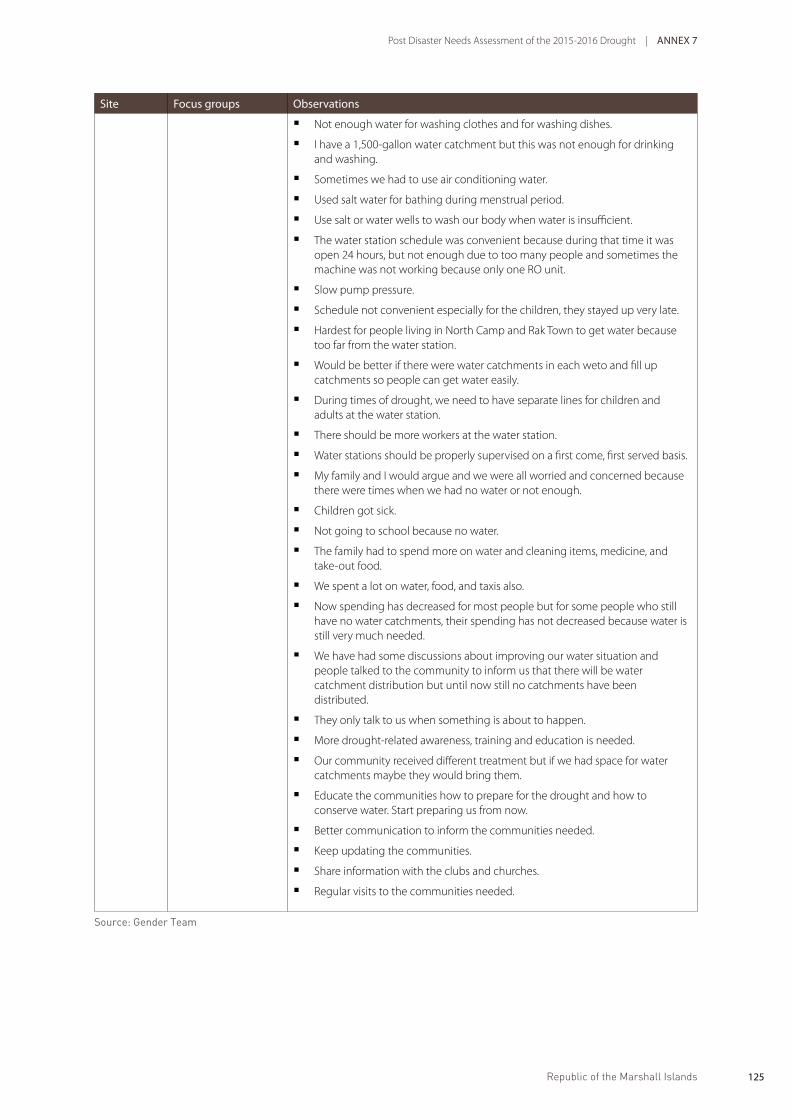
Republic of the Marshall Islands 125Republic of the Marshall Islands
Post Disaster Needs Assessment of the 2015-2016 Drought | aNNEx 7 Post Disaster Needs Assessment of the 2015-2016 Drought | aNNEx 7
Site Focus groups Observations
Not enough water for washing clothes and for washing dishes.
I have a 1,500-gallon water catchment but this was not enough for drinking and washing.
Sometimes we had to use air conditioning water.
Used salt water for bathing during menstrual period.
Use salt or water wells to wash our body when water is insufficient.
The water station schedule was convenient because during that time it was open 24 hours, but not enough due to too many people and sometimes the machine was not working because only one RO unit.
Slow pump pressure.
Schedule not convenient especially for the children, they stayed up very late.
Hardest for people living in North Camp and Rak Town to get water because too far from the water station.
Would be better if there were water catchments in each weto and fill up catchments so people can get water easily.
During times of drought, we need to have separate lines for children and adults at the water station.
There should be more workers at the water station.
Water stations should be properly supervised on a first come, first served basis.
My family and I would argue and we were all worried and concerned because there were times when we had no water or not enough.
Children got sick.
Not going to school because no water.
The family had to spend more on water and cleaning items, medicine, and take-out food.
We spent a lot on water, food, and taxis also.
Now spending has decreased for most people but for some people who still have no water catchments, their spending has not decreased because water is still very much needed.
We have had some discussions about improving our water situation and people talked to the community to inform us that there will be water catchment distribution but until now still no catchments have been distributed.
They only talk to us when something is about to happen.
More drought-related awareness, training and education is needed.
Our community received different treatment but if we had space for water catchments maybe they would bring them.
Educate the communities how to prepare for the drought and how to conserve water. Start preparing us from now.
Better communication to inform the communities needed.
Keep updating the communities.
Share information with the clubs and churches.
Regular visits to the communities needed.
Source: Gender Team

Republic of the Marshall Islands 126 Republic of the Marshall Islands
Post Disaster Needs Assessment of the 2015-2016 Drought | aNNEx 8
Annex 8SuMMARy OF SECTOR DISASTER RISK REDuCTION NEEDS
Program of activity 2017 value (uSD)
2018 value (uSD)
2019 value (uSD)
responsible agency
crops and livestock
Support promotion of indigenous knowledge and innovative ideas for resilient agriculture techniques (intercropping, fruit tree planting, integrated farming systems using permaculture technique, food preservation) using Cull institutional knowledge for irradiated coral atoll soil remediation and rehabilitation techniques, in the 16 most affected (agriculture) atolls (Majuro, Aur, Wotje, Maloelap, Arno, Mili, Mejit, Jabot, Kwajalein, Likiep, Ailuk, Utirik, Wotho, Ujae, Lae and Enewetak.)
100,000 Ministry of Resource and Development, local government, Council of Iroj, landowners, FAO, SPC, WUTMI, others partners (tbc)
Support MR&D in production and dissemination (free distribution) of drought-tolerant crops, including coconut, drought-resilient breadfruit, sweet potatoes and taro varieties (kata), drought-tolerant fruit trees: fig tebro, sea-almond, sea-grape, amaranth, etc.
100,000 Ministry of Resource and Development, local government, Council of Iroj, landowners, FAO, SPC, WUTMI
Promotion of school gardening and kitchen gardens to improve diet diversification, dissemination and knowledge of compost-making techniques and resilience techniques against drought (including water conservation techniques – drip irrigation – and traditional storage techniques) in the 16 most affected (agriculture) atolls (Majuro, Aur, Wotje, Maloelap, Arno, Mili, Mejit, Jabot, Kwajalein, Likiep, Ailuk, Utirik, Wotho, Ujae, Lae and Enewetok.
100,000 Ministry of Resource and Development, College of the Marshall Island grant, PRELP (Pacific Resource for Education and Learning), SPC, FAO
Support gender-balanced research into traditional farming, harvesting, food preservation and integrated traditional agro-forestry practices and an income diversification programme that would include an economic feasibility study for aquaculture production – giant clams, seaweeds, sea cucumber, lobster, pearls.
80,000 Ministry of Resource and Development, NGOs, WUTMI, SPC or FAO, local government, landowners
Support R&D in developing quality crop and livestock baseline data
100,000 Ministry of Resource and Development, EPPSO
commerce and industry
None envisaged
Health
Establishment of Local Councils, training and simulation exercises planned.
125,000 Ministry of Health
Capacity development such as environmental health management training and enhanced health monitoring, outer islands communication, surveillance, segregated data generation (age, sex, etc.) collection and management, and for warnings.
74,075 Ministry of Health
Awareness programmes, e.g. newspapers, cell broadcasts, radio & TV
20,000 Ministry of Health, NDMO

Republic of the Marshall Islands 127Republic of the Marshall Islands
Post Disaster Needs Assessment of the 2015-2016 Drought | aNNEx 8 Post Disaster Needs Assessment of the 2015-2016 Drought | aNNEx 8
Program of activity 2017 value (uSD)
2018 value (uSD)
2019 value (uSD)
responsible agency
Health Communication System Development (Repair of equipment and training of users in the current 8 DAMA sites)
436,000 Ministry of Health, planned and funded by US
Education
Dig wells for individual schools (85 public schools) 80,000 Ministry of Education/public school system (PSS) and community
Maintain broken plumbing system water supply line 70,000 Ministry of Education/PSS
Replace rain gutter systems (all 87 public schools primary and secondary)
Absenteeism - disaggregate gender data 10,000 Ministry of Education/PSS
Provide Reverse Osmosis Units to supply Ebeye Schools (500 gallons per unit per day plus maintenance).
10,000 Ministry of Education/PSS and grant providers
Develop (automatic/alert) Data collection tool in absenteeism and amount of water available in reserves (all 87 public schools)
10,000 Ministry of Education/PSS
Radio network to forecast water needs/ shortage (all 70 public schools in the outer islands. One radio per school Majuro and Kwajalein public schools are not included).
70,000 Ministry of Education/ PSS
Provide more water catchment with water distillation unit (all 87 schools prioritizing schools that were highly affected by the drought).
130,000 Ministry of Education/ PSS and grant providers
Construct concrete water catchments (60,000 capacity) and maintenance (Katiej Elem., Lukoj Elem., Ajeltake Elem., Laura Elem.)
120,000 100,000 Ministry of Education/PSS, PMU and grant provider
Provide more water catchments for schools 130,000 Ministry of Education/ PSS and grant provider
Water
Adopt and implement National Water and Sanitation Policy creating the National Water Office.
80,000 Environmental Protection Agency
Laura Lens MoU and enhanced monitoring trial 20,000 Environmental Protection Agency, MWSC57
Data management for water safety planning 25,000 Environmental Protection Agency
RO annual maintenance and storage 10,000 MWSC, KAJUR58
Construction of a RO warehouse Majuro and Ebeye 200,000 MWSC, KAJUR
National Water Office 70,000 Environmental Protection Agency
Laura Lens enhanced monitoring 10,000 Environmental Protection Agency, MWSC
Data management for water safety planning 20,000 Environmental Protection Agency
RO annual maintenance and storage 20,000 MWSC, KAJUR
total recovery needs 1,160,075 450,000 230,000
total for three Fys 1,840,075
57 Majuro Water and Sewer Company58 Kwajalein Atoll Joint Utility Resources

Republic of the Marshall Islands 128 Republic of the Marshall Islands
Post Disaster Needs Assessment of the 2015-2016 Drought | aNNEx 9
Annex 9SuMMARy OF SECTOR DISASTER RISK MANAGEMENT NEEDS
Disaster risk management (Drm)
Program of activity 2017 (uSD)
2018 (uSD)
2019 (uSD)
responsible agency
Establish Drought Recovery Plan 2017–2019
Establish Drought Recovery Plan 2017–2019 with affected community participation
16,000 Office of the Chief Secretary
Functional review of the NDMO
Review mandate and division of labour for all staff after act review.
18,000 Office of the Chief Secretary
Review of the enactment of the Disaster Assistance Act of 1987
Legislative review and update of the act and related plans and manuals
24,000 Office of the Chief Secretary, Legislative Agency/Department
Early warning system Standard operating procedures for warnings and dissemination reviewed. Install automated rain gauges for equal geographic coverage
10,000 Weather Service Office (WSO)
Review and strengthen damage assessments
Improve damage assessment forms and data collection mechanisms and ensure value adding of the forms to inform both response and recovery (e.g. PDNA process)
8,000 Office of the Chief Secretary
Enhance analysis capacity of the Met Office
Enhance data manipulation capacity of technical staff
9,000 WSO
Formalize coordination and sharing of information among stakeholders, e.g. NDMO (some real-time), health and agriculture personnel.
Administrative data collection, compilation and analysis systems in all sectors, including meteorology, education and health to be strengthened and broadened to include analysis and visualization
119,000 WSO, Office of the Chief Secretary
Capacity building Establishment and or strengthening of outer island disaster committees, including resilience enhancements, evacuation drills and disaster plan updates in eight inhabited locations (cover all in three years)
100,000 100,000 100,000 JNAP, NDMO, International Organization for Migration (IOM), Marshall Islands Red Cross Society
Facilities improvement (Emergency Operations Center)
Safety equipment, outer island radio, other communication equipment and office hardware (computer, printers, etc.)
100,000 NDMO, Office of the Chief Secretary

Republic of the Marshall Islands 129Republic of the Marshall Islands
Post Disaster Needs Assessment of the 2015-2016 Drought | aNNEx 9 Post Disaster Needs Assessment of the 2015-2016 Drought | aNNEx 9
Disaster risk management (Drm)
Program of activity 2017 (uSD)
2018 (uSD)
2019 (uSD)
responsible agency
Outer island communication equipment for early warning
Feasibility and implementation of EWS communication enhancements, e.g. Chatty Beetles
50,000 WSO, NDMO
ToRs to be developed for the National Disaster Council, clusters, standing committees, DisCom, as well as the responsibilities of mayors
Workshops and meetings to finalize ToRs
25,000 Office of the Chief Secretary
Feasibility study for DRM database, DesInventar
Verify the Italian offer for DRM database will be of more value than DesInventar
12,000 NDMO
Review and align current response funding mechanisms
Review and align currently-used response funding mechanisms and trust funds in RMI and the region, including regional options
52,000 Office of the Chief Secretary
Feasibility of additional risk-financing instruments, including training to better manage disaster risk, including but not limited to (re)insurance
Review current financial instruments available in-country and in the region for public and private sectors and training of stakeholders. Explore international best practices and inclusion of state-owned enterprises, small and medium enterprises and the private sector
32,000 Office of the Chief Secretary
JNAP implementation Operational costs for the implementation of JNAP, particularly institutionalization of DRM-related components
80,000 70,000 NDMO, JNAP
total Drm needs per Fy 543,000 212,000 170,000
total for three Fys 925,000

Republic of the Marshall Islands 130 Republic of the Marshall Islands
Post Disaster Needs Assessment of the 2015-2016 Drought | Executive Summary

Republic of the Marshall Islands Republic of the Marshall Islands
Post Disaster Needs Assessment of the 2015-2016 Drought | Executive Summary

132 Republic of the Marshall Islands Republic of the Marshall Islands
Post Disaster Needs Assessment of the 2015-2016 Drought | EXECUTIVE SUMMARY
Recommended