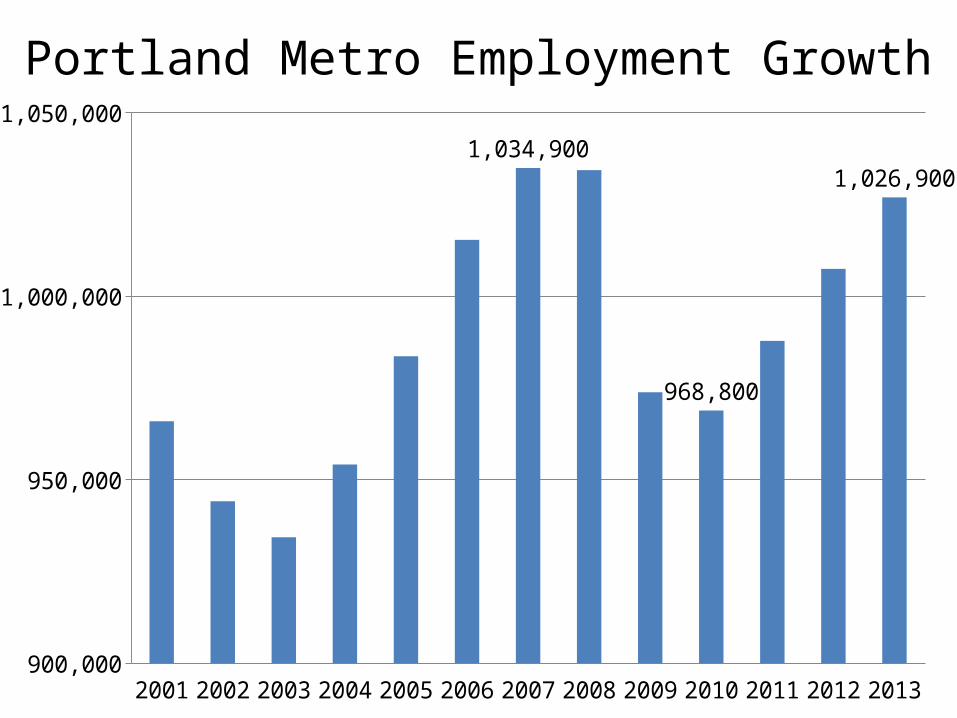
Portland Metro Employment Growth
2001 2002 2003 2004 2005 2006 2007 2008 2009 2010 2011 2012 2013900,000
950,000
1,000,000
1,050,000
1,034,900
968,800
1,026,900
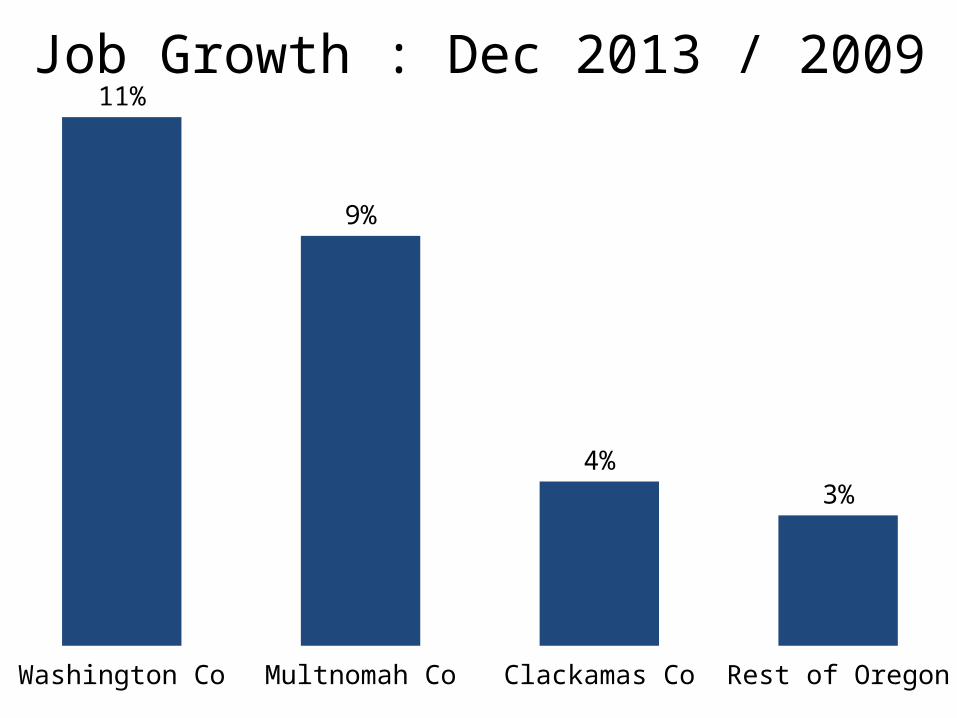
Job Growth : Dec 2013 / 2009
Washington Co Multnomah Co Clackamas Co Rest of Oregon
11%
9%
4%3%
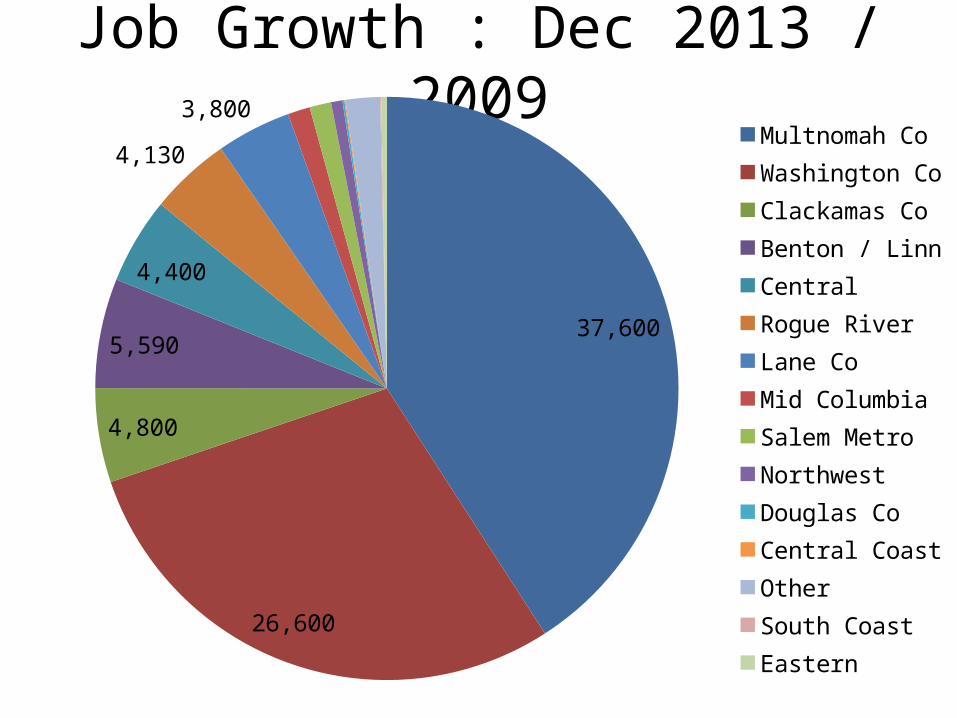
Job Growth : Dec 2013 / 2009
37,600
26,600
4,800
5,590
4,400
4,130
3,800
Multnomah CoWashington CoClackamas CoBenton / LinnCentralRogue RiverLane CoMid ColumbiaSalem MetroNorthwestDouglas CoCentral CoastOtherSouth CoastEastern
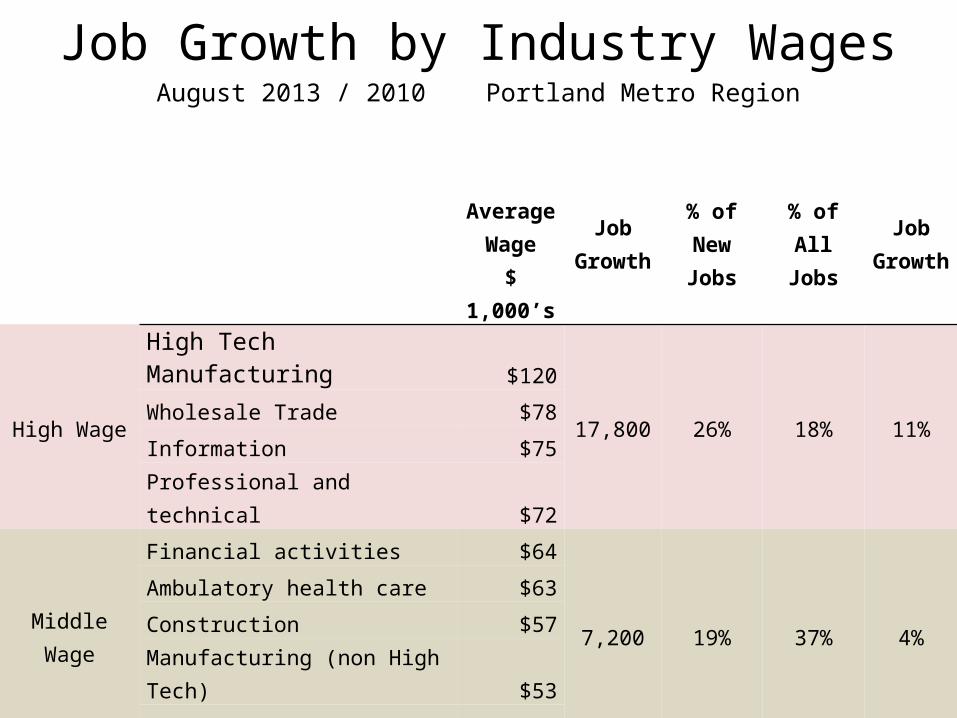
Average Wage
$ 1,000’s
Job Growth
% of New Jobs
% of All Jobs
Job Growth
High Wage
High Tech Manufacturing $120
17,800 26% 18% 11%Wholesale Trade $78
Information $75
Professional and technical $72
Middle Wage
Financial activities $64
7,200 19% 37% 4%
Ambulatory health care $63
Construction $57
Manufacturing (non High Tech) $53
Government $52
Low Wage
Retail trade $28
24,300 35% 26% 10%Employment services $31
Nursing and residential care $25
Leisure and hospitality $20
Job Growth by Industry WagesAugust 2013 / 2010 Portland Metro Region
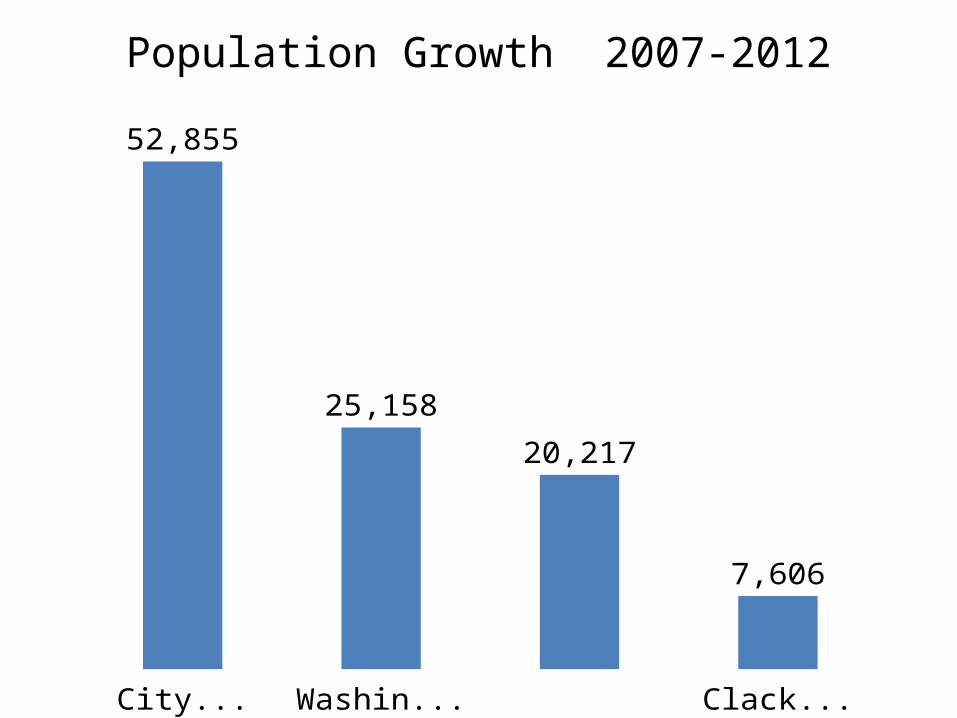
Population Growth 2007-2012
City of Port-land
Washington County
Clark County Clackamas County
52,855
25,158
20,217
7,606
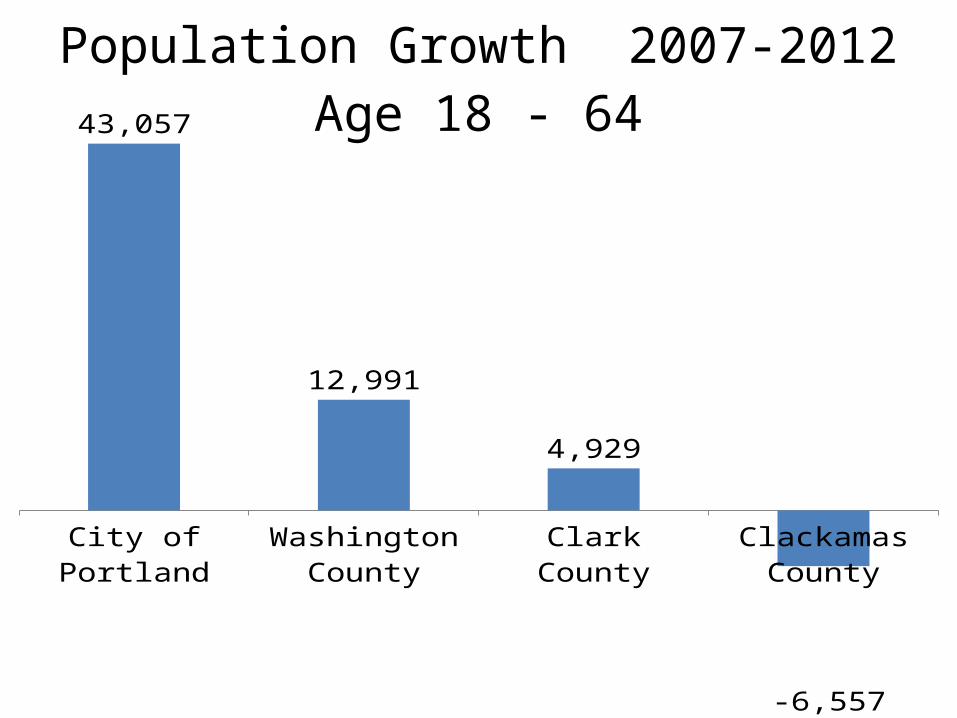
Population Growth 2007-2012Age 18 - 64
City of Port-land
Washington County
Clark County Clackamas County
43,057
12,991
4,929
-6,557
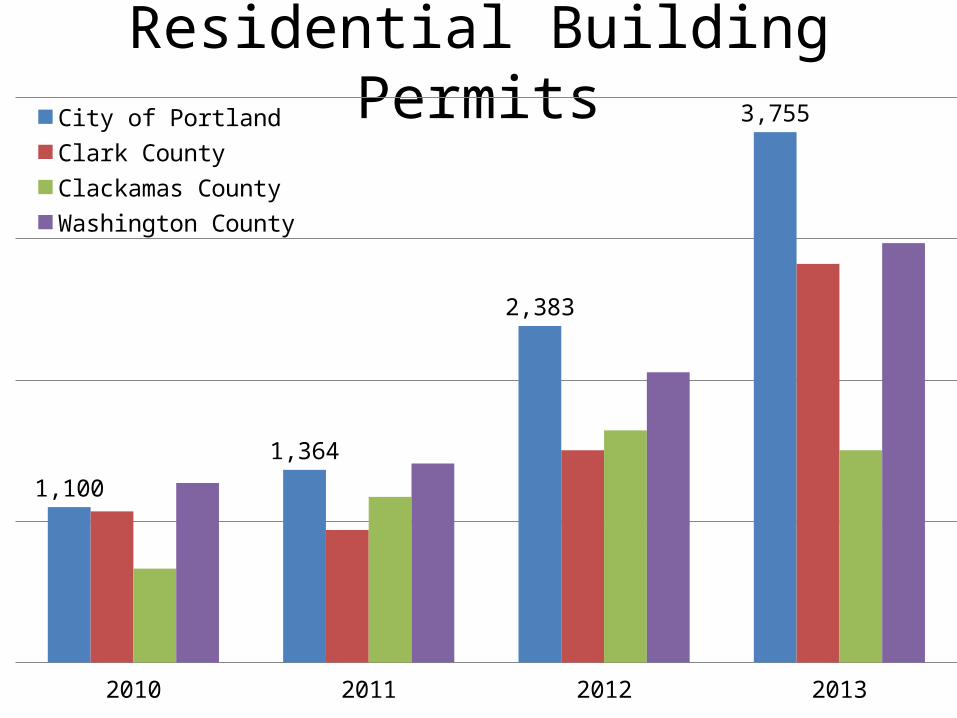
Residential Building Permits
2010 2011 2012 2013
1,100
1,364
2,383
3,755 City of Portland
Clark County
Clackamas County
Washington County
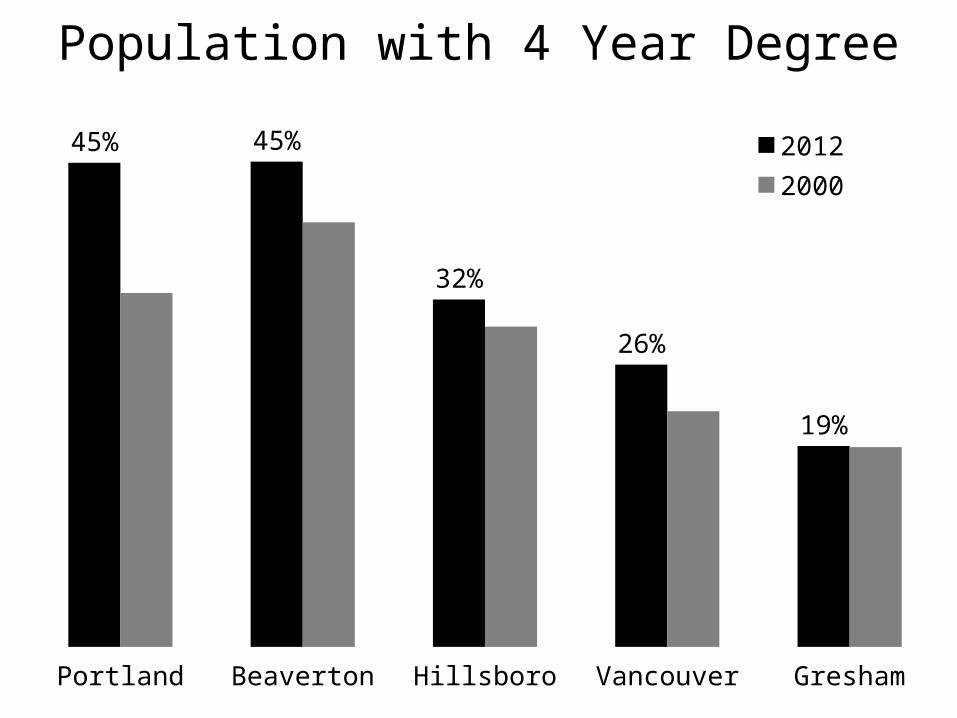
Population with 4 Year Degree
Portland Beaverton Hillsboro Vancouver Gresham
45% 45%
32%
26%
19%
2012
2000
College Degree & Average Wage
18% 22% 26% 30% 34% 38% 42% 46% 50%$12
$14
$16
$18
$20
$22
$24
$26
Los Angeles
San Francisco
Seattle
Phoenix
San DiegoDenver
Sacramento
Salt Lake City
Portland
Las Vegas
San Jose
Albuqerque
Fresno
Tucson
Austin Houston
Dallas
San Antonio
El Paso
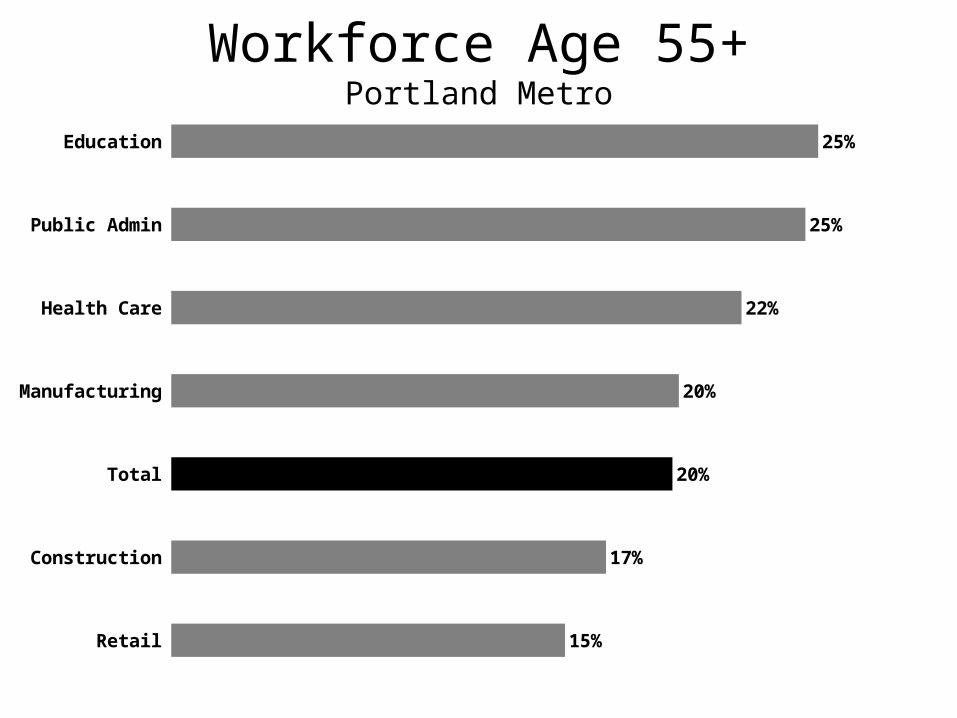
Workforce Age 55+Portland Metro
Retail
Construction
Total
Manufacturing
Health Care
Public Admin
Education
15%
17%
20%
20%
22%
25%
25%
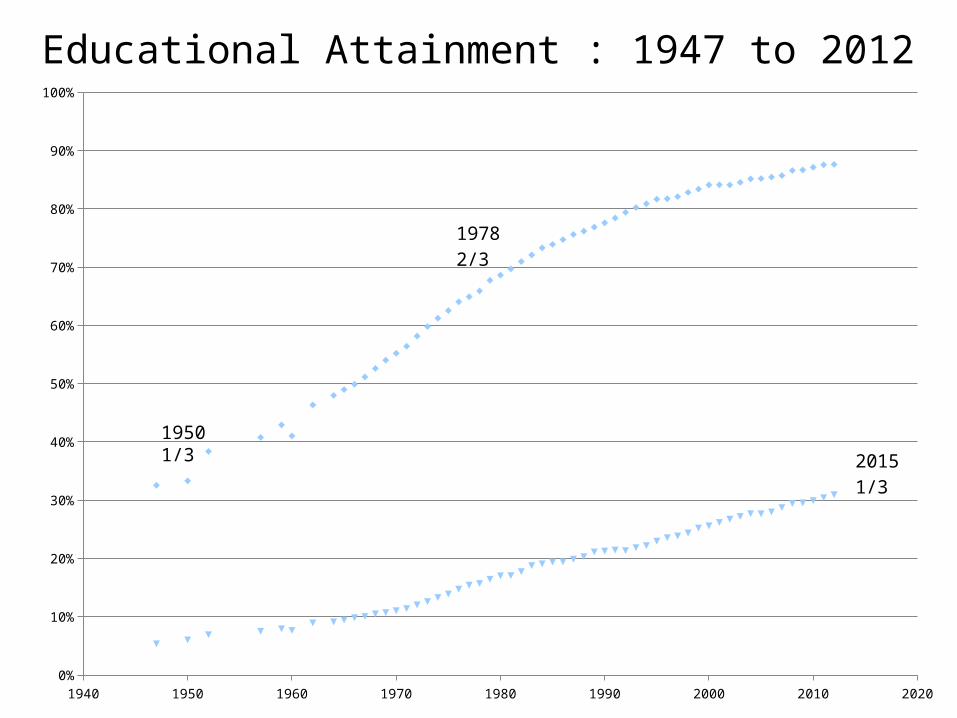
Educational Attainment : 1947 to 2012
1940 1950 1960 1970 1980 1990 2000 2010 20200%
10%
20%
30%
40%
50%
60%
70%
80%
90%
100%
19782/3
20151/3
19501/3
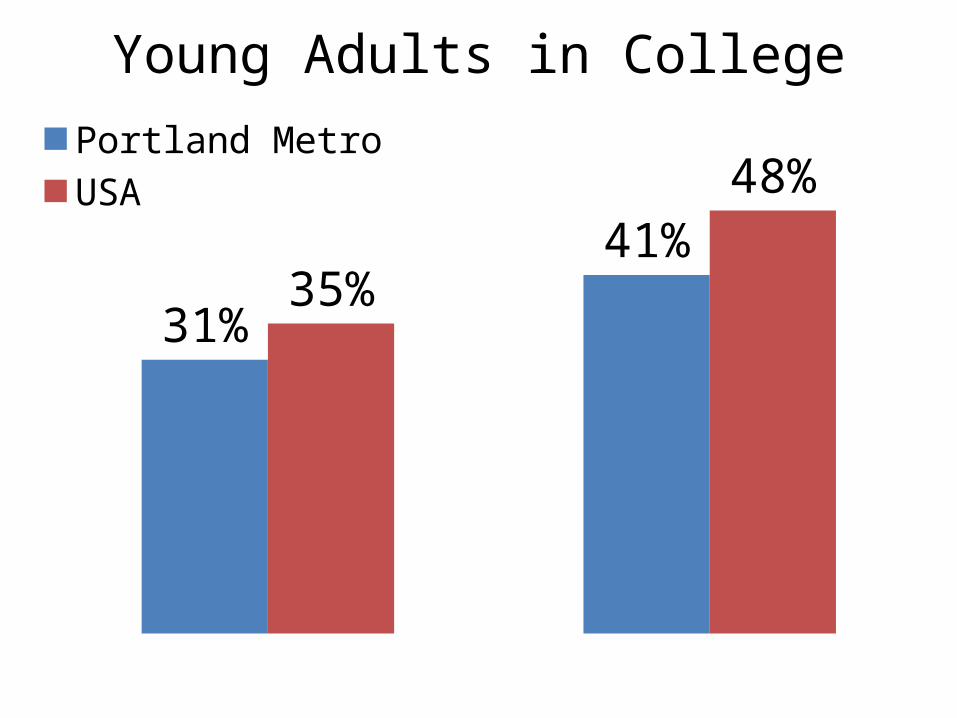
Young Adults in College
2005 2012
31%
41%35%
48%Portland MetroUSA
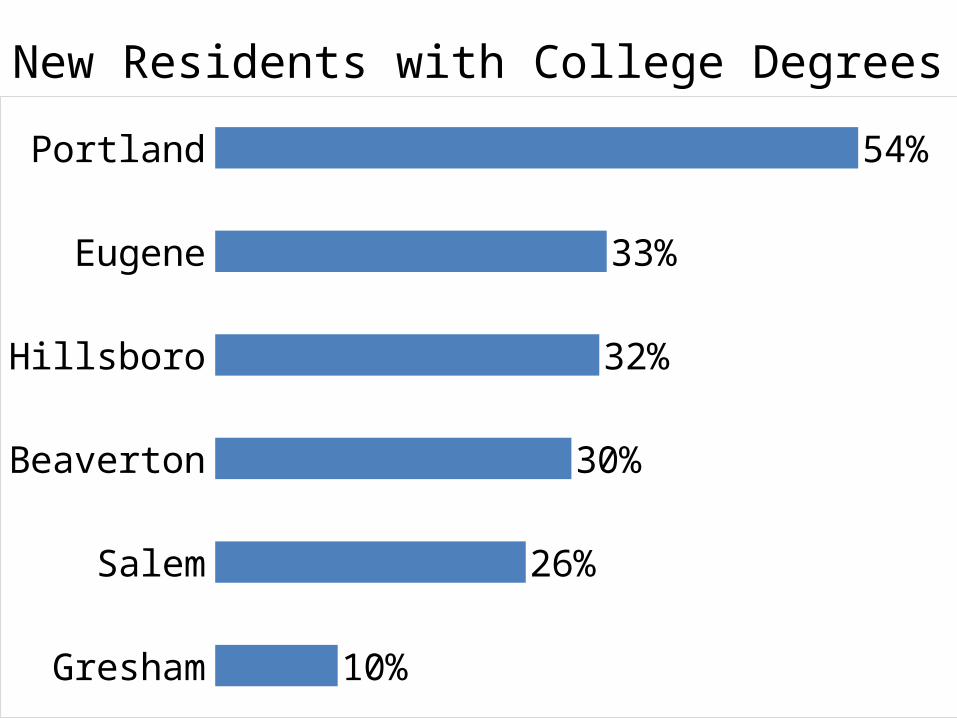
New Residents with College Degrees
Gresham
Salem
Beaverton
Hillsboro
Eugene
Portland
10%
26%
30%
32%
33%
54%
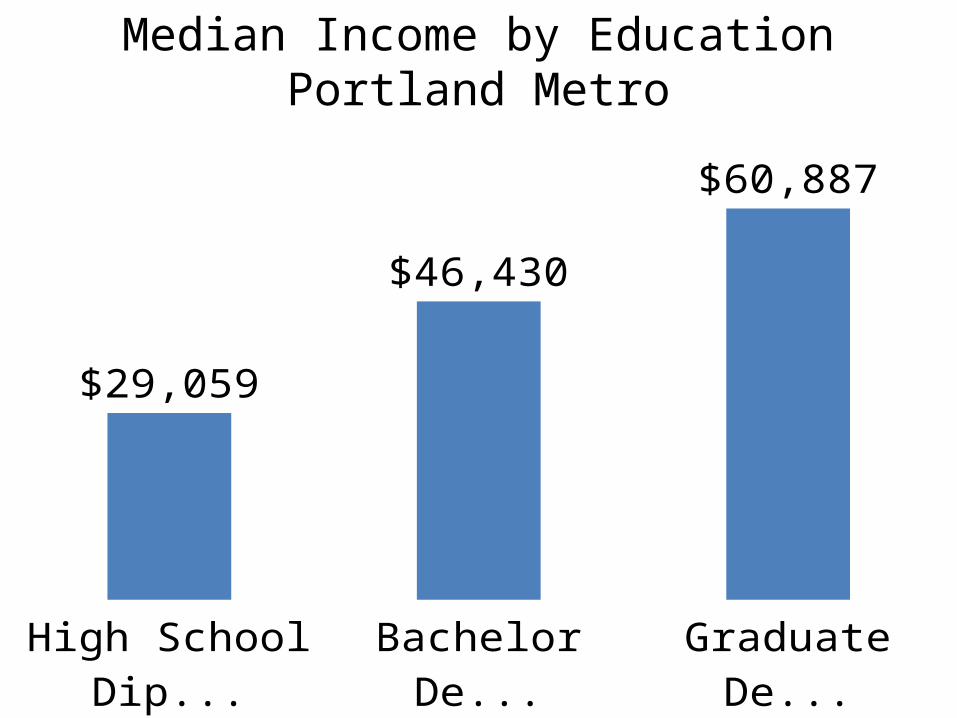
Median Income by EducationPortland Metro
High School Diploma
Bachelor Degree
Graduate Degree
$29,059
$46,430
$60,887
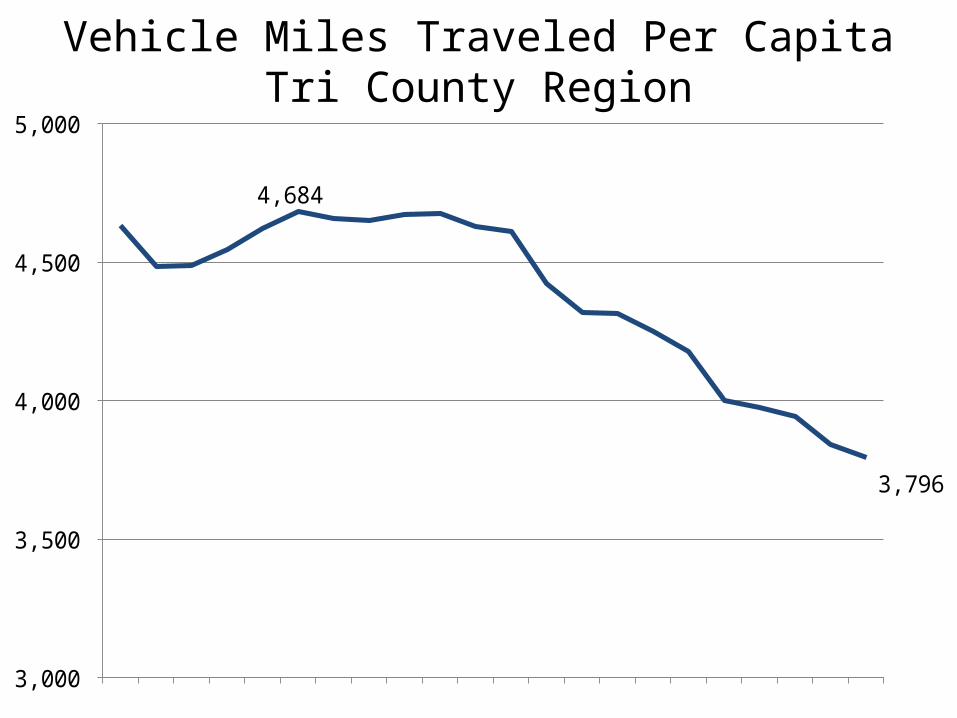
Vehicle Miles Traveled Per CapitaTri County Region
199
199
199
199
199
200
200
200
200
200
201
3,000
3,500
4,000
4,500
5,000
4,684
3,796
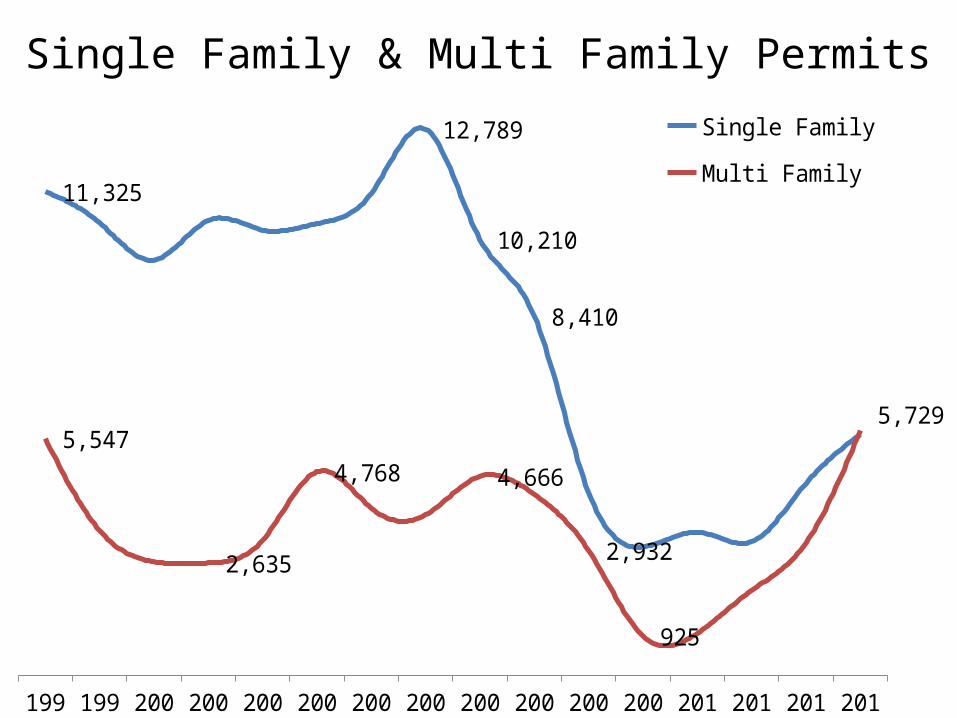
Single Family & Multi Family Permits
1998 1999 2000 2001 2002 2003 2004 2005 2006 2007 2008 2009 2010 2011 2012 2013
11,325
12,789
10,210
8,410
5,547
2,635
4,768 4,666
2,932
925
5,729
Single Family
Multi Family
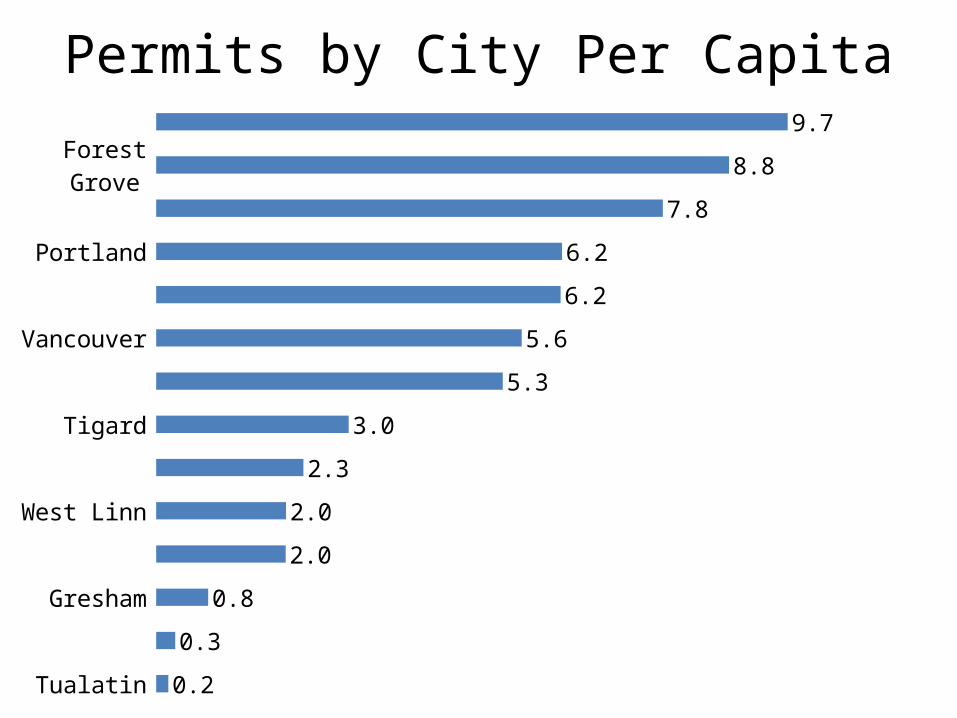
Permits by City Per Capita
Tualatin
Milwaukie
Gresham
Lake Oswego
West Linn
McMinnville
Tigard
Oregon City
Vancouver
Beaverton
Portland
Hillsboro
Forest Grove
Wilsonville
0.2
0.3
0.8
2.0
2.0
2.3
3.0
5.3
5.6
6.2
6.2
7.8
8.8
9.7
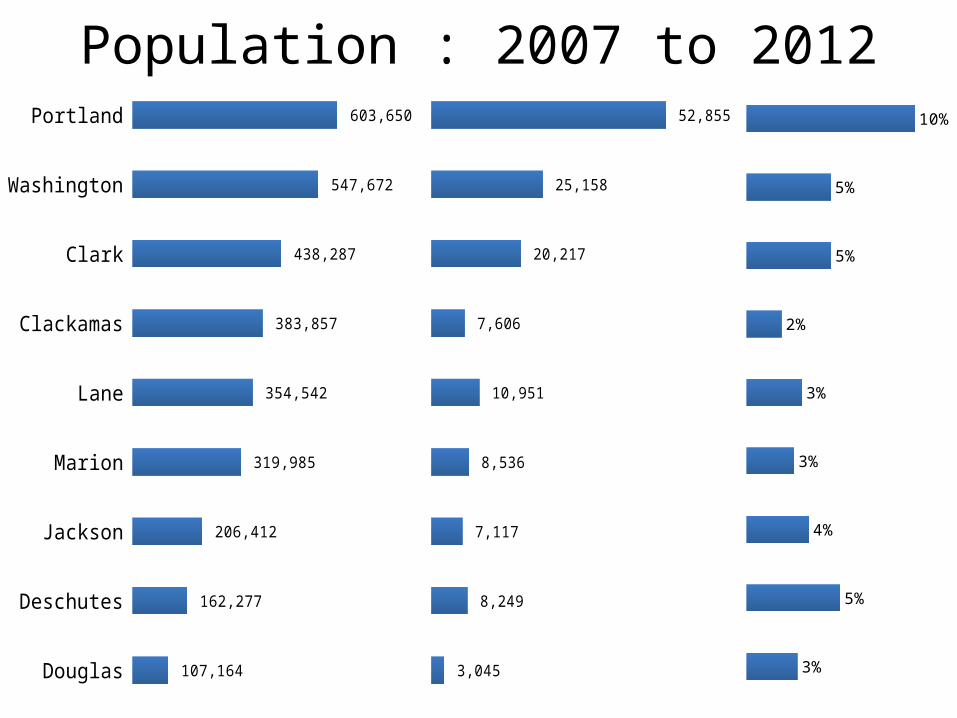
Population : 2007 to 2012
Douglas
Deschutes
Jackson
Marion
Lane
Clackamas
Clark
Washington
Portland
107,164
162,277
206,412
319,985
354,542
383,857
438,287
547,672
603,650
3,045
8,249
7,117
8,536
10,951
7,606
20,217
25,158
52,855
3%
5%
4%
3%
3%
2%
5%
5%
10%
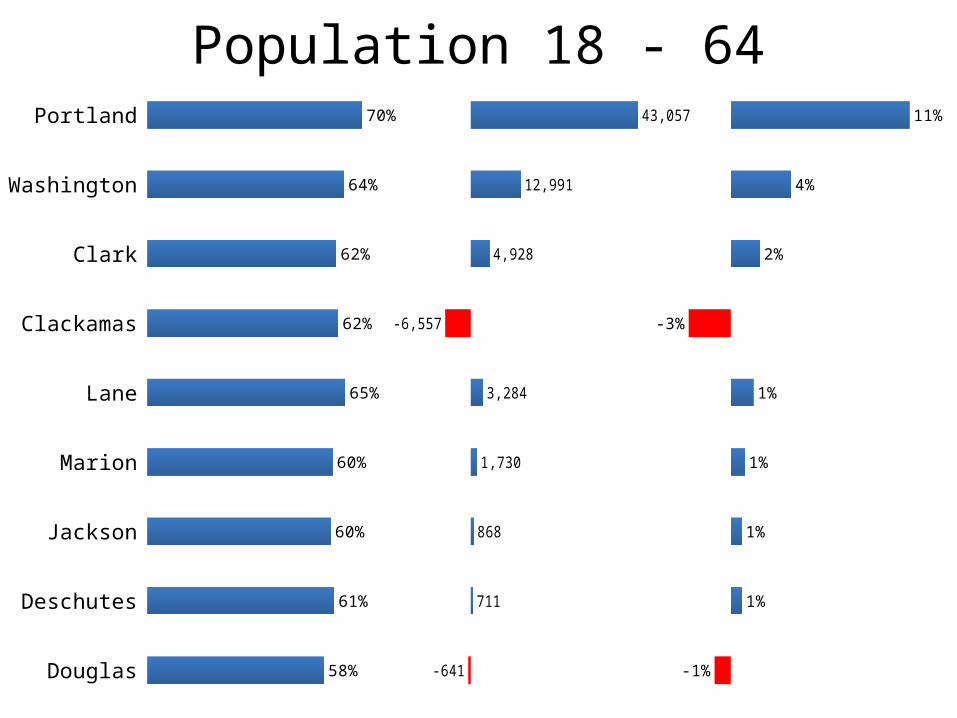
Population 18 - 64
Douglas
Deschutes
Jackson
Marion
Lane
Clackamas
Clark
Washington
Portland
58%
61%
60%
60%
65%
62%
62%
64%
70%
-641
711
868
1,730
3,284
-6,557
4,928
12,991
43,057
-1%
1%
1%
1%
1%
-3%
2%
4%
11%
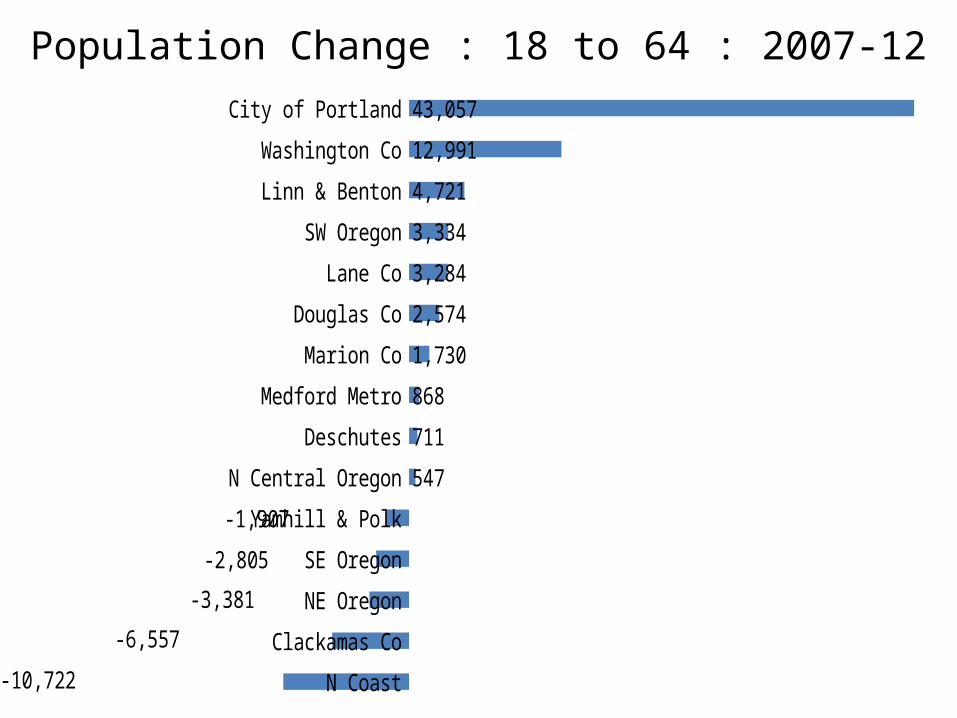
Population Change : 18 to 64 : 2007-12
N Coast
Clackamas Co
NE Oregon
SE Oregon
Yamhill & Polk
N Central Oregon
Deschutes
Medford Metro
Marion Co
Douglas Co
Lane Co
SW Oregon
Linn & Benton
Washington Co
City of Portland
-10,722
-6,557
-3,381
-2,805
-1,907
547
711
868
1,730
2,574
3,284
3,334
4,721
12,991
43,057
Recommended


![unit 4 slides - new template [Read-Only] - Oregon · OEM Points of Contact Public Assistance Julie Slevin Joseph Murray Julie.slevin@state.or.us Joseph.murray@state.or.us 503‐378‐2911](https://img.pdfslide.us/doc/110x75/604989cc07e7a537403a69d0/unit-4-slides-new-template-read-only-oregon-oem-points-of-contact-public-assistance.jpg)