POLITECNICO DI TORINO
Department of Electronics and Telecommunications
Master of Science in Nanotechnologies for ICTs
MASTER THESIS
POLYMER PEN LITHOGRAPHY
FOR BIOACTIVE SURFACE FUNCTIONALIZATION
Supervisors:
PROF. FABRIZIO GIORGIS (POLITO)
PD Dr. Dr. MICHAEL HIRTZ (KIT)
Student:
AFZAL SYED USAMA BIN S229582
DECEMBER 2018

1
SUMMARY
Polymer Pen Lithography (PPL) which is a hybrid of Dip-Pen Nanolithography (DPN) and soft
lithography technique namely Microcontact Printing (µCP) has been tested for its pros and cons
in patterning functional phospholipids under varying instances using high resolution
characterization techniques. Although, having the advantage of simultaneously printing at several
points of the substrate covering area on the order of millimeter by employing a
Polydimethylsiloxane (PDMS) stamp however PPL is yet to make a mark to prove its ability to
print pure lipids without admixing with carrier lipids which is not possible by cantilever-based
scanning probe lithography techniques such as its parent technique DPN. The detailed analysis
reveals a theoretically expected result of phospholipid layers stacked over the base Self
Assembled Monolayer (SAM) of the phospholipid which is a direct result of adsorption of the
Phosphate head over the hydrophilic glass or Silicon Dioxide substrate which assembles the
monolayer constituting the hydrophilic head and hydrophobic tail in a regularly arranged manner.
A statistical method is proposed which not only quantifies the stacked phospholipid layers in
water, mimicking its natural state being the main constituent of cell membrane in blood plasma,
but also has the potential to quantify the Scanning Probe Microscopy (SPM) probe which is used
to characterize the sample such that the probe can be said to have certain factor which represent
the destruction caused to the particular phospholipid feature while traversing over the sample in
water. Moreover, the net overall charge of the phospholipid is observed to affect the topographic
image due to the nature of characterization method used therefore a printing methodology to
enhance the contrast is proposed to achieve optimum and reliable results. Finally, the difference
between the feature is observed in different operating regimes based on the deformation and
hence the contact area of the PDMS stamp which is observed to dictate the characteristics of the
deposited feature.
2
PERSONAL CONTRIBUTION
At the time of publication of the thesis report the author is enrolled at Politecnico Di Torino
(POLITO), Corso Duca degli Abruzzi, 24, 10129 Torino, Italy in an MS Nanotechnologies for
ICTs program offered by Department of Electronics and Telecommunications (DET) Corso
Castelfidardo, 39, 10129 Torino, Italy. The thesis is carried out under the supervision of Prof.
Fabrizio Giorgis who is the Vice Head of Department of Applied Science and Technology
(DISAT), Corso Duca degli Abruzzi, 24, 10129 Torino, Italy.
The experimental work of the thesis under POLITO’s ‘Thesis in a Company’ category is carried
out at Institute of Nanotechnology (INT), Karlsruhe Institute of Technology (KIT) Hermann-von-
Helmholtz-Platz 1, D-76344 Eggenstein-Leopoldshafen, Germany under the external supervision
of the group leader of DPN and related techniques’ PD Dr. Dr. Michael Hirtz. All the
experimental work and remarks are conducted by the author led by the lab supervisor at guest
institute Dr. Uwe Bog. The only exception is for the SICM characterization and evaluation which
is carried out at Institute of Physics, University of Munster, D-48149 Munster, Germany and
Center for Nanotechnology (CeNTech), D-48149 Munster, Germany by Dr. Joo Hyoung Kim
supervised by Prof. Kristina Riehemann and Prof. Harald Fuchs with the SICM software and
hardware provided by Dr. Goo-Eun Jung of Park Systems Corp., KANC 4F, Gwanggyo-ro 109,
Suwon 16229, Korea.

3
ACKNOWLEDGEMENTS
I express my heartfelt gratefulness to both my supervisors Dr. Dr. Michael Hirtz from INT, KIT
and my home university supervisor Prof. Fabrizio Giorgis (DISAT, POLITO) for their endless
support, both logistic and moral, throughout the research period. Specifically, I’d like to thank
Dr. Dr. Michael Hirtz for helping me out with the formal procedure at INT which made me feel
right at home and for being patient with me for the trivial and redundant questions I might have
asked during our weekly informative and interactive sessions. Similarly, I’d like to thank Prof.
Fabrizio Giorgis for appreciating and approving my thesis topic which encouraged me to translate
my zest for knowledge in this field to passionate practical demonstration by usage of the
equipments I had before only learnt in theory and read about in quality research papers.
I am also thankful to all my respected professors in POLITO from DET and DISAT who
introduced me to the wonderful world of nanotechnology which for me gets more interesting each
passing day. I also express my gratitude to INT, KIT for being so welcoming, facilitating me with
all the logistic necessities and providing me an ideal environment for research. Last but not the
least, I’d like to thank my colleagues from DPN and related techniques research group especially
my lab supervisor Dr. Uwe Bog for teaching me optimal methods of implementing Polymer Pen
Lithography and using Atomic Force Microscopy for its characterization.
Needless to say, all of this research and academia stage would not have been a part of my life if
it was not for my family’s constant moral and financial support.

4
TABLE OF CONTENTS
1. Introduction ........................................................................................................................ 6
2. Methodology ...................................................................................................................... 8
2.1 Derivation of the printing methodology ..................................................................................... 8
2.1.1 Micro Contact Printing .................................................................................................... 9
2.1.2 Dip Pen Nanolithography .............................................................................................. 11
2.1.3 Polymer Pen Lithography .............................................................................................. 12
2.2 Nature of the ink ....................................................................................................................... 14
3. Results and Discussion .................................................................................................... 16
3.1 Slightly Charged Phospholipid Inks ........................................................................................... 18
3.1.1 Ink α1............................................................................................................................. 19
3.1.2 Ink β1 ............................................................................................................................. 21
3.1.3 Outlook .......................................................................................................................... 23
3.2 Moderately Charged Phospholipid Inks .................................................................................... 24
3.2.1 Ink α2............................................................................................................................. 26
3.2.2 Ink β2 ............................................................................................................................. 28
3.2.3 Sample with multiplexing of ink α2 and ink β2 ............................................................. 31
3.2.4 Outlook .......................................................................................................................... 33
3.3 Highly Charged Phospholipid Inks ............................................................................................. 33
3.3.1 Ink γ ............................................................................................................................... 34
3.4 Lipid known to have good adherence to glass substrate .......................................................... 37
3.4.1 Completely decompressed PDMS pyramid ................................................................... 38
3.4.2 Partially decompressed PDMS pyramid ........................................................................ 40
3.4.3 Decompressed PDMS pyramid tip ................................................................................ 41
3.5 Pure Lipid ink deposition without carrier lipid over glass substrate ......................................... 42
3.5.1 Completely decompressed PDMS pyramid ................................................................... 42
3.5.2 Partially decompressed PDMS pyramid ........................................................................ 43
3.6 Proposed Lipid Quantification Method for future studies........................................................ 44
4. Experimental Setup .......................................................................................................... 48

5
4.1 Ink .............................................................................................................................................. 48
4.2 PPL Stamp Fabrication .............................................................................................................. 48
4.3 Substrates ................................................................................................................................. 50
4.4 Printing Process ......................................................................................................................... 51
4.5 Characterization Parameters .................................................................................................... 53
4.5.1 Fluorescence Microscopy .............................................................................................. 53
4.5.2 SICM .............................................................................................................................. 55
4.5.3 AFM ............................................................................................................................... 56
5. Conclusion ....................................................................................................................... 60
6. References ........................................................................................................................ 62
I LIST OF ABBREVIATIONS .......................................................................................... 65
II DEDICATION ................................................................................................................. 66
6
1. Introduction
PPL (Polymer Pen Lithography) has been able to able to find applications in numerous fields to
date but its primary use still lies in the deposition of bio-inks which have vast uses in biochemistry
and cell biology. PPL is cantilever-free scanning probe lithography technique which has been
shown [6] to obtain adjustable sized, high throughput, multiplexed patterns allowing deposition
of different inks with a reasonably high compactness (area efficiency) over the substrate. It has
been combined with thiol–acrylate photopolymerization chemistry for the creation of brush-
polymer microarrays over large areas and nanometer-scale control over print position and size,
therefore this technique of combination of localized photochemistry and functional-group
tolerant chemistry finds application in diverse problems in biology, materials chemistry, and
organic electronics [12].
PPL is basically an additive serial writing lithography method. Conventional lithography methods
find application in many fields such as in the development of ICs, MEMS, video displays and
projectors, data storage disks, biochips, miniaturized sensors, microfluidic devices, fine tunable
bandgap photonic devices and diffraction devices. PPL stands out due to its low-cost, cantilever
free design and high-throughput scanning probe lithography scheme that utilizes a soft
elastomeric tip array as opposed to hard Si-based cantilever to deliver inks to a substrate surface
in a direct write manner, the ink delivery is time and force dependent which determines feature
size at either nanometer, micrometer, or macroscopic scales using the same tip array. PPL has
been demonstrated to be capable of printing the complete range of DPN (Dip Pen
Nanotlithography) printable inks except for thermal DPN inks [13]. Additionally, a new group of
dry inks which cannot be printed using DPN such as high gel–liquid phase transition temperature
inks and non-soluble inks can also be printed using PPL due to the µCP (Micro Contact Printing)
like “stamping” mode of transport hence inks neither need to be liquid nor need to be soluble in
any carrier [13].
The bio-ink that has been employed for the PDMS stamp in deposition over glass substrate for
this case is phospholipids. A generic phospholipid constitutes a hydrophilic phosphate group head
and a hydrophobic fatty acid tails with a glycerol molecule in between. Phospholipids are the
main constituents of cell membranes and tend to deposit with micro contact printing or DPN etc.
by formation of SAM (Self Assembled Monolayers) with the hydrophilic head adsorbing over

7
the hydrophilic substrate. SAM are also known to rearrange themselves in an orderly manner.
Lipid bilayers tend to form because of the amphiphilic characteristic of the lipids. Depending on
the diffusion which in turns depend on the dwell time, chamber humidity and temperature of the
deposition technique number of stack of lipid bilayers may stack up over the hanging hydrophobic
tail of the SAM. Being the major part of the plasma membrane of living cells researchers are
usually interested in observing the behavior of the lipid immersed in physiological buffer so that
it can be used to model how lipid would behave in blood plasma which constitutes 90% water.
Scanning ion conductance microscopy (SICM) and atomic force microscopy (AFM) are the
primary techniques used hereafter to characterize the phospholipids and determine their behavior
in liquid. As the AFM is inherently destructive in nature a statistical method is to be proposed
which not only quantifies the stacked phospholipid layers in water, mimicking its natural state
being the main constituent of cell membrane in blood plasma, but also if possible measure the
probe characteristics which is used to characterize the sample such that the probe can be said to
have certain factor which represent the destruction caused to the particular phospholipid feature
while traversing over the sample in liquid. Moreover, correlation of the overall charge of the
phospholipid needs to be seen as to how it affects the topographic image due to the nature of
characterization method used therefore a printing methodology to enhance the contrast is required
to be proposed to achieve optimum and reliable results. Finally, the effect on the feature needs to
be observed with high resolution for different deposition regimes based on the deformation and
hence the contact area of the PDMS stamp which is known to dictate the characteristics of the
deposited feature.

8
2. Methodology
2.1 Derivation of the printing methodology PPL is the primary techniques used in this study to deposit lipid features over the substrate. In
the last few years printing technologies, e.g. flexography, soft lithography, screen, gravure and
inkjet printing gained the attention of manufacturing industries due to their low-cost, high volume
and high-throughput production of electronic components or devices which are lightweight and
small, thin and flexible, inexpensive and disposable. Printing methods are in general additive
processes unlike the traditional lithographic techniques in the semiconductor and MEMS industry
such as photolithography which are inherently subtractive. Figure 2-1 displays how the additive
process is different in the sense that the desired pattern is directly implemented over the substrate
whereas for the traditional case the material is deposited over the substrate and then the undesired
part is selectively removed from the top of the substrate and sometimes also the bulk of the
material as in the case of for example bulk micromachining in MEMS.
Figure 2-1 Comparison between traditional subtractive patterning vs additive processes
In the recent past there have been numerous efforts to develop a molecular printing technique
having high throughput, high spatial positioning precision/resolution, high density integration
and higher control over the feature size and shape. PPL brings all these advantages together in a

9
single technique. PPL can be thought of as being derived from the combination of micro contact
printing and dip pen nanolithography. The remaining Section shows how it combines the
advantages of the two techniques to come up with all the advantages.
2.1.1 Micro Contact Printing Micro Contact Printing is a soft lithography method of printing over a substrate. Soft
lithography is principally a non-photolithographic strategy based on self-assembly and replica
molding. It is a convenient, effective and low-cost method for manufacturing micro- and
nanostructures by an elastomeric stamp with patterned relief structures on its surface which is
used to generate micro and nano patterns and structures [10]. Industrially for micro- and
nanostructures, photolithography is dominating but soft lithography is pretty much the close
second. In soft lithography generally, polydimethylsiloxane (PDMS) is used as the elastomer
due to low glass transition temperature. As in cast molding, at room temperature prepolymer
being liquid can be shaped up using a Silicon Master of complementary shape, after the
crosslinking/curing agent is mixed at raised temperature the PDMS hardens and the Si Master
can be easily peeled off the structure thereafter. The complementary Si Master is fabricated
using microfabrication techniques such as electron beam lithography for precision in getting the
desired arbitrary shape. Figure 2-2 displays the stepwise preparation of the PDMS stamp.
Figure 2-2 Graphic display of the steps involved in preparation of a PDMS stamp from Si Master [10]
10
PDMS stamp properties of being chemically inactive, having a less value i.e. 21.6 dyn/cm of
interfacial free energy, being non-hydroscopic, having high thermal stability in air, being
transparent and being durable ensure its use in the current soft lithography world. However
there are some draw backs which hinders soft lithography from becoming the dominant means
of industrial fabrications, these include post cure shrinking displayed at the bottom of figure 2-
2, swelling by organic solvents, lesser accuracy due to elasticity and expansion and lastly the
range of aspect ratio needs to be taken care of due to softness as it may lead to defects as a
result of deformation [10]. Microcontact printing utilizes the PDMS stamp to pattern self-
assembled monolayers (SAMs) [11] by contacting the surface of the substrate. Self-assembly is
the spontaneous rearrangement of the subunits of the deposited ink, which is usually a ‘bioink’
such as protein, DNA and cell membrane, onto the substrate such that the whole structure is in
the lowest possible form energetically. Other than monolayers self-assembly, microcontact
printing is also used in self-assembly in two or three dimensions as well. The most popular
microcontact printing technique which is relevant to this study is the one in which a planar
stamp is used to print on a planar surface, however either of the stamp or the substrate need not
necessarily be planar in general.
Soft lithography has many advantages such as being convenient, inexpensive, accessible to
chemists, biologists, and material scientists, having basis in self-assembly which tends to
minimize certain types of defects, most soft lithographic processes are additive and minimize
waste of materials, readily adapted to rapid prototyping for feature sizes >20 mm, isotropic
mechanical deformation of PDMS mold or stamp provides routes to complex patterns, having
no diffraction limit features as small as 30 nm have been fabricated, nonplanar surfaces (lenses,
optical fibers, and capillaries) can be used as substrates, generation and replication of three-
dimensional topologies or structures are possible, optical transparency of the mask allows
through-mask registration and processing, good control over surface chemistry, very useful for
interfacial engineering, a broad range of materials can be used: functional polymers, sol–gel
materials, colloidal materials, suspensions, solutions of salts, and precursors to carbon
materials, glasses, and ceramics being applicable to manufacturing: production of
indistinguishable copies at low cost, applicable in patterning large areas. The disadvantages
include patterns in the stamp or mold may distorting due to the deformation (pairing, sagging,
swelling, and shrinking) of the elastomer used, difficulty in achieving accurate registration with
elastomers (<1 mm), doubtable compatibility with current integrated circuit processes and

11
materials, defect levels higher than for photolithography, µCP works well with only a limited
range of surfaces [10].
2.1.2 Dip-Pen Nanolithography DPN was invented in 1999 by the Mirkin Group, and it can be used to deposit molecules and
materials on surfaces with sub-50 nm resolution [3]. It uses an AFM tip to selectively place
different types of molecules at specific sites within a nano-scale pattern without using an
intermediate such as resist or stamp. It has the ability to pattern with a wide variety of ‘inks’ and
works best with ‘bioinks’ that tend to form SAMs as shown in figure 2-3 where the molecules
are seen to adsorb to the surface of Au substrate by the ink forming a meniscus controlled by
environment humidity and temperature which in turn effect the resolution of the technique.
Therefore, it is a cantilever-based serial writing technique which has displayed been displayed to
be compatible with many inks, from small organic molecules to organic and biological polymers,
and from colloidal particles to metal ions and sols [1]. DPN is a particularly attractive tool for
patterning biological and soft organic structures onto surfaces in ambient or inert environments
without exposing them to ionizing UV or electron-beam radiation and without risking cross-
contamination. Amongst many research activities utilizing the method all around the world some
highlights include the use of DPN for in situ studies of surface reactivity and exchange chemistry,
patterning biomolecular micro- and nanoarrays, building tailored chemical surfaces for studying
and controlling biorecognition processes from the molecular to cellular level, generating
chemical templates for the controlled orthogonal assembly of materials on surfaces and the use
of DPN as a rapid prototyping tool for generating hard nanostructures using chemical etching on
a length-scale comparable, or even superior, to that obtainable with e-beam lithography [1].
Figure 2-3 AFM tip traversing over the substrate leaving the traces of SAM behind [3]
12
materials on surfaces and the use of DPN as a rapid prototyping tool for generating hard
nanostructures using chemical etching on a length-scale comparable, or even superior, to that
obtainable with e-beam lithography [1]. In short, the combination of resolution, registration, and
direct-write capability offered by DPN distinguishes it from any alternative conventional
lithographic strategy and makes DPN a promising tool for patterning soft organic and biological
nanostructures
2.1.3 Polymer Pen Lithography PPL was reported [6] as a low-cost, high-throughput scanning probe lithography method that uses
a soft elastomeric tip array, rather than tips mounted on individual cantilevers, to deliver inks to
a surface in a “directwrite” manner. Polymer pen lithography merges the feature size control of
DPN with the large-area capability of microcontact printing. Because ink delivery is time and
force dependent, features on the nanometer, micrometer, and macroscopic length scales can be
formed with the same tip array due to the piezo electric control typical of SPM methods. PPL
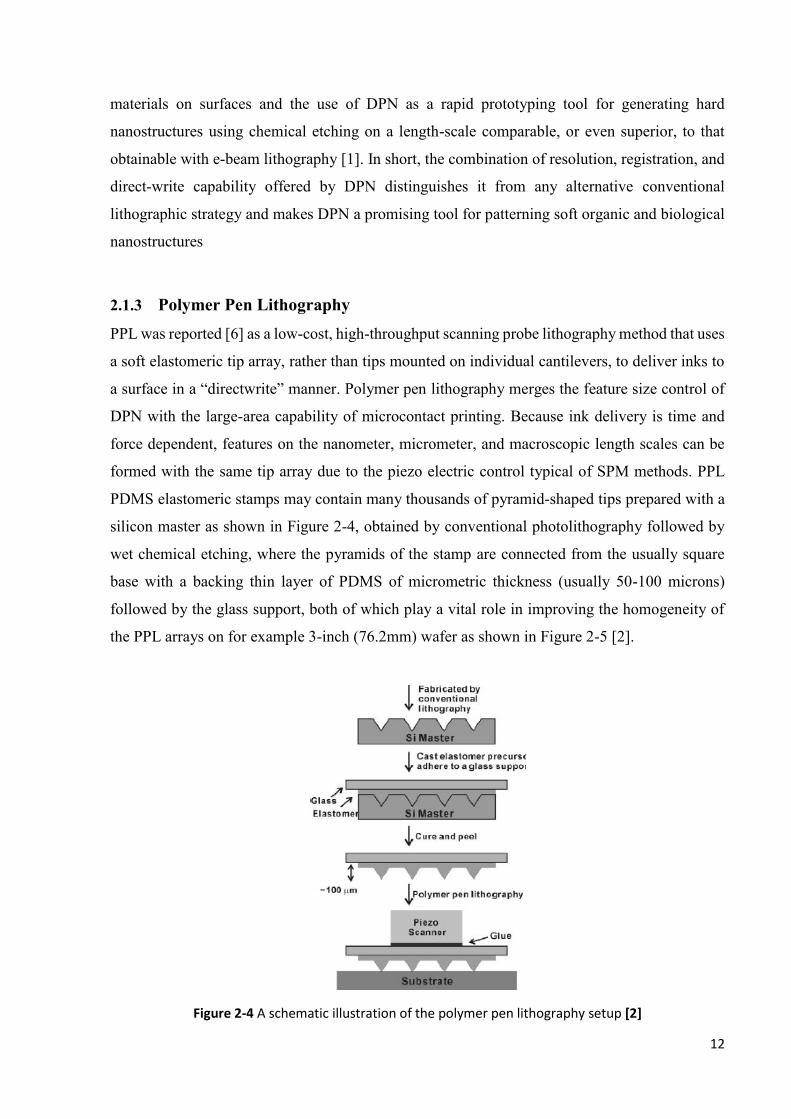
PDMS elastomeric stamps may contain many thousands of pyramid-shaped tips prepared with a
silicon master as shown in Figure 2-4, obtained by conventional photolithography followed by
wet chemical etching, where the pyramids of the stamp are connected from the usually square
base with a backing thin layer of PDMS of micrometric thickness (usually 50-100 microns)
followed by the glass support, both of which play a vital role in improving the homogeneity of
the PPL arrays on for example 3-inch (76.2mm) wafer as shown in Figure 2-5 [2].
Figure 2-4 A schematic illustration of the polymer pen lithography setup [2]

13
Figure 2-5 A photograph of an 11-million-pen array [2]
In PPL, similar to cantilever-based SPM lithography techniques the array tips are sharp and
delivers ink upon making contact with the substrate at only the point of contact. The point of
contact can be visually observed under a camera while printing as the transparent polymer pen
array is seen to be elastically deformed upon contact resulting in an increased light reflection
from the tip of the pyramids. This observation also comes in handy to position the array or in
other words the stamp in parallel to the substrate in order to have homogenous distribution of ink
as required in most of the applications where intentional feature size gradient as used in some
studies [14] is not required. The number of pyramid pens can be in millions with their quantity
depending on the tip to tip spacing in between the pens, the dimension of the base of the pens and
eventually since the base of the pens consume finite area it also depends on the maximum
capability of the equipment to hold a stamp of given area.
PPL has been used with varying strategies for the printing of functional phospholipid patterns
that provide tunable feature size and feature density gradients over surface areas of several square
millimeters by controlling the printing parameters, having shown two operate in two transfer
modes of either of its pre cursor techniques’ [14]. Each of these modes leads to different feature
morphologies as by increasing the force applied to the elastomeric pens the tip−surface contact
area increases enhancing the ink delivery rate, a switch between a DPN and μCP transfer mode
can thus be triggered. This results in a range of deposition properties of the ink feature from quasi-
DPN to quasi-µCP which can be fine-tuned by the piezoelectric controller. Moreover, PPL has
been demonstrated to possess the capability to do multiplexing [4], which is the integration of
14
more than one ink in an interdigitated microscale pattern and is still a challenge for microcontact
printing. On the other hand, there is a strong demand for interdigitated patterns of more than one
protein on subcellular to cellular length scales in the lower micrometer range in biological
experiments.
2.2 Nature of the ink The bio-ink that has been employed for the PDMS stamp in deposition over glass substrate for
this case is phospholipids. A generic phospholipid constitutes a hydrophilic phosphate group head
and a hydrophobic fatty acid tails with a glycerol molecule in between. Phospholipids are the
main constituents of cell membranes and tend to deposit with micro contact printing or DPN etc.
by formation of SAM (Self Assembled Monolayers) with the hydrophilic head adsorbing over
the hydrophilic substrate. SAM are also known to rearrange themselves in an orderly manner.
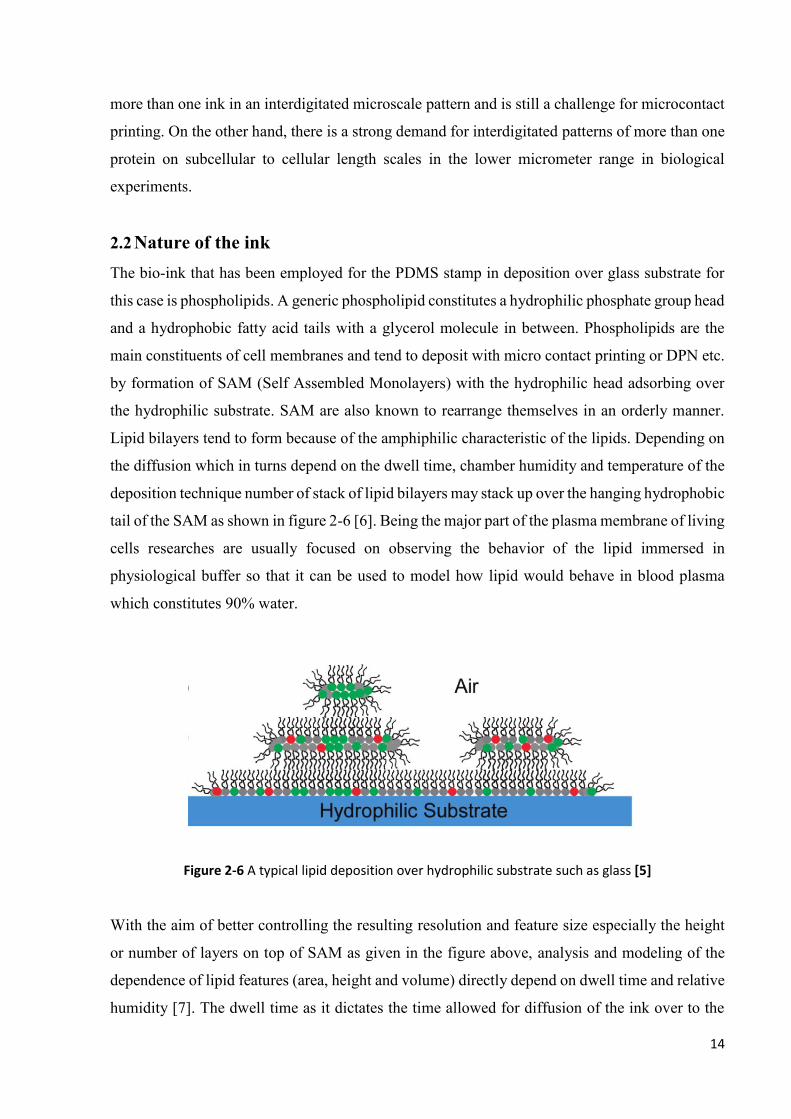
Lipid bilayers tend to form because of the amphiphilic characteristic of the lipids. Depending on
the diffusion which in turns depend on the dwell time, chamber humidity and temperature of the
deposition technique number of stack of lipid bilayers may stack up over the hanging hydrophobic
tail of the SAM as shown in figure 2-6 [6]. Being the major part of the plasma membrane of living
cells researches are usually focused on observing the behavior of the lipid immersed in
physiological buffer so that it can be used to model how lipid would behave in blood plasma
which constitutes 90% water.
Figure 2-6 A typical lipid deposition over hydrophilic substrate such as glass [5]
With the aim of better controlling the resulting resolution and feature size especially the height
or number of layers on top of SAM as given in the figure above, analysis and modeling of the
dependence of lipid features (area, height and volume) directly depend on dwell time and relative
humidity [7]. The dwell time as it dictates the time allowed for diffusion of the ink over to the

15
substrate and humidity as in the quasi-DPN mode it dictates the size of meniscus formed leading
expressing the amount and resolution of lipid transfer. Feature shape is usually controlled by the
substrate surface energy. Generally, a short dwell time growth is controlled by meniscus diffusion
while at long dwell times surface diffusion is the dominant factor. The critical point for the switch
of regime depends on the humidity for a given dwell time.
In contrast, if the surface of the substrate is hydrophobic such as graphene the lipid formation
instead of figure 2-6 would rather be similar to figure 2-7 [8] as the hydrophobic tail will be
attached to the substrate instead of the hydrophilic head as in the previous case.
Figure 2-7 A typical lipid deposition over hydrophobic substrate such as graphene [8]
16
3. Results and Discussion
Knowledge about surface charge of certain biological objects gives key information for
understanding their structures, functions, and their behavior in a wide range of metabolisms.
Recently, surface charge mapping methods within physiological condition based on various
Scanning Ion Conductance Microscopy (SICM) measurement schemes have been developed
and suggested. Although they have shown great capability for computing surface charge density
and understanding biological events in electrostatic perspective from various samples ranging
from lipid patches to live cells, there were little attempts to present well-defined, periodic,
reproducible “standard sample” for these measurement methods, which is essential to achieve
general applicability and calibration capability for whole scanning probe microscopy (SPM)
measurement schemes. Here the study shows surface charge mapping associated with
amplitude-based bias-modulated (BM-) SICM for various types of standard samples printed on
glass substrates, which have different surface charge densities. Thereafter AFM images of the
lipids have been used as the control, and it as found that BM-SICM mode has shown good
stability, image quality, and reproducibility. It is highly expected that armed with our “standard
samples”, SICM-based surface charge mapping method would have a greater momentum for its
standardization and enhancement of its reliability.
Electrostatic force is the most accountable and fundamental physical interaction (among 4
fundamental physical interactions) between biological entities especially at their molecular
level [19]. Thus, knowledge on surface charge distribution of biological substances is essential
to understand their physicochemical behaviors inside a physiological buffer. However, despite
of its importance with this information, measuring surface charge density of some sample
within physiological conditions (ionic strength in the order of 100 mM where most of metabolic
activities happen) has been quite challenging due to the presence of very tight Debye layer (less
than 1 nm) formed in the vicinity of sample surface. Though Zeta potential measurement is the
most widely used method for probing surface charge information for small (micro to nano)
materials [20,21], this has its own limitations, firstly it usually assumes that the material under
study should be colloidal particles, secondly the measured values largely fluctuate at
physiological conditions (i.e. high ionic strength), and finally applying this method to ‘real’
biological systems such as live cell membranes is challenging, where they are usually supported

17
by certain substrates or scaffolds in more complex dimensions than 0-dimensional particles.
From these aspects, surface charge mapping based on the scanning probe microscope (SPM)
offers much attractions for measuring surface charge density, first because this value has
basically 2-dimensional feature (C/m2) as SPM scans this 2D area, and second because SPM is
operable within physiological conditions. There are noted attempts using atomic force
microscope (AFM), the most widely used type of SPM, by surface functionalization of tip with
some charged molecules [22]. But for this case too, experiments were done in a moderate ionic
strength (~1 mM, hundred-fold dilute compared to physiological condition), and quantitative
analysis was not available. Recently, two groups have shown capability for quantitative surface
charge mapping method within physiological conditions based on scanning ion conductance
microscopy (SICM) [23-28]. Even though these group use different measurement mode of
SICM (Unwin et al. used a spectroscopy-based hopping mode, while Dong et al. exploited the
conventional DC-SICM raster scanning mode), the basic idea is the same, that the local
conductivity measured by pipette tip does not just indicate typical tip to sample distance, but
also reflects the local ion concentration on the sample spot, where the tip is approached. At
there, the counter-ions are relatively rich and co-ions are less than bulk ion concentration where
the tip is distant (distant so that no couter-ions are absorbed or repelled by the tip) from Debye
layer surrounding the sample. Studies have shown great applicability of this method in a wide
range of samples, from lipid patches to live cells [23-28]. However, despite of this great deal of
works on surface charge mapping studies within physiological conditions, very little attention
has been paid to the development of “standard sample” for this method, which is essential to
achieve general applicability and calibration capability for whole scanning probe microscopy
(SPM) measurement methods. The samples which are called “standard samples” for the surface
charge mapping method should show a periodic structure, whose sizes are well matched to
typical scanning dimensions of SICM, and at the same time a well-defined electrostatic surface
charge distribution, possibly coinciding with their topographic features, for ease of recognition.
To show these features, we have studied polymer-pen-lithographied (PPL) lipid features, whose
substrates are glasses (with negative charge from expressed hydroxyl group or silanol group on
the surface here also within aqueous solution with neutral pH) for both cases. From these two
groups of samples, we could see different pipette-sample interactions according to their surface
charge distribution, showing that these structures could serve as good standard samples for the
surface charge mapping method application. An AFM control is used to appreciate where the
SCIM signal shows variation with the AFM lipid topography due to surface charge density of
the lipid when doing the surface charge mapping.
18
Finally, a statistical method is proposed which not only quantifies the stacked phospholipid
layers in physiological buffer, mimicking its natural state being the main constituent of cell
membrane in blood plasma with ~90% water, but also has the potential to quantify the Scanning
Probe Microscopy (SPM) probe which is used to characterize the sample such that the probe
can be said to have certain factor which represent the destruction caused to the particular
phospholipid feature while traversing over the sample in water.
3.1 Slightly Charged Phospholipid Inks For the first batch of PPL a safe approach was taken to ensure that deposition of the lipid
definitely takes place and at the same time is easily detectable under fluorescence microscope.
There were two variants of inks used namely ink α1 and ink β1 both of which were slightly
negatively charged with detailed composition provided in Section 3.1.1 and Section 3.1.2.
Even though ink α1 samples showed a nice pattern under fluorescence microscope in the lab at
KIT primarily because of bright fluorescence of Rhodamine, the SICM characterization done at
CeNTech, Munster was not very successful for sample which used ∞A probably because DOPC
was not printed along as much or maybe washed away in the KCl solution which immersed the
sample for the SICM traversal.
For the second type of samples though the features were observed because of higher percentage
of primary lipid in ink β1 which did not wash away as much with the immersion in KCl solution.
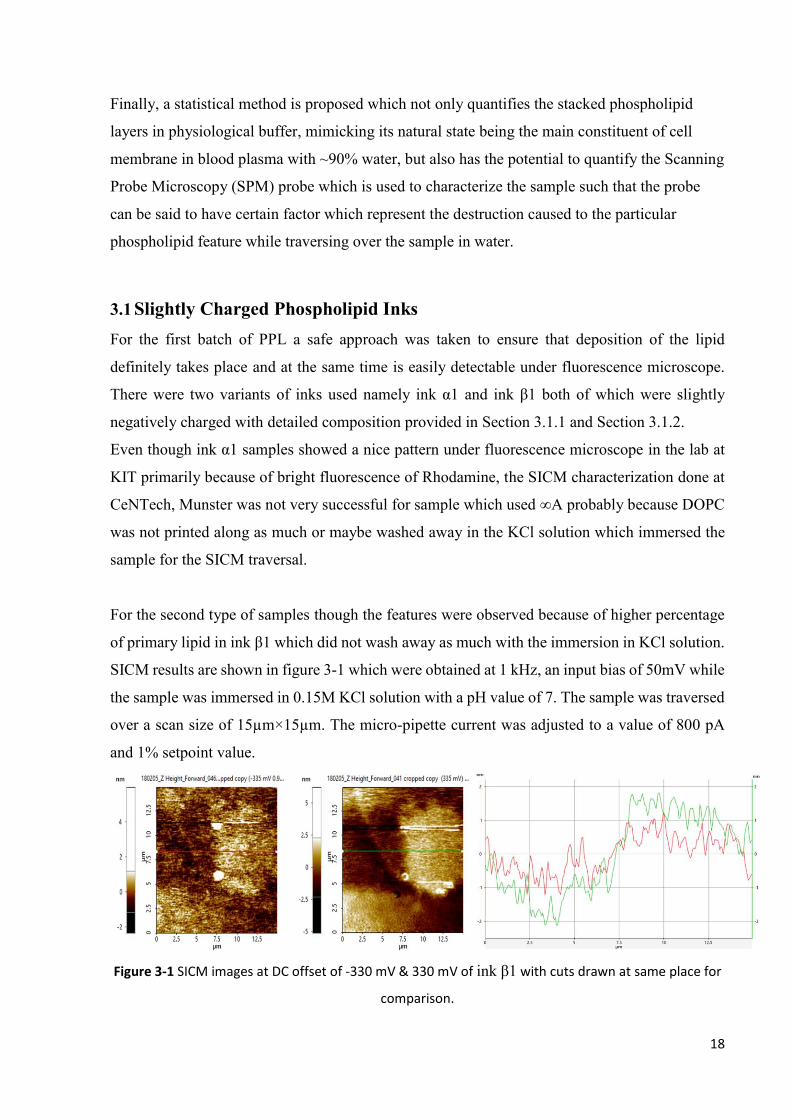
SICM results are shown in figure 3-1 which were obtained at 1 kHz, an input bias of 50mV while
the sample was immersed in 0.15M KCl solution with a pH value of 7. The sample was traversed
over a scan size of 15µm×15µm. The micro-pipette current was adjusted to a value of 800 pA
and 1% setpoint value.
Figure 3-1 SICM images at DC offset of -330 mV & 330 mV of ink β1 with cuts drawn at same place for
comparison.

19
In the DC mode polarity dependent profile, the SICM image comparison at two different DC
offsets of -330 mV and +330mV is drawn but a sharp contrast was not observed for 0 V offset.
The red colored graph in figure 3-1 represents the height profile of the lipid at positive DC
offset along the x-direction of the cut. On the other hand, the green colored graph represents the
height profile of lipid ink at negative DC offset along the x-direction of the cut at the same
place where the cut for the positive DC offset was made. It can be observed that a height of
~2nm is observed at the positive DC offset in contrast to a height of ~1nm at negative DC
offset. Moreover, the glass in both cases seemed to have a negative charge translating to a
negative height as per the working principle of SICM, this implied that the glass has a negative
charge according to the calibration, parameter and environment (KCl immersion) in which the
measurement of SICM was done. Additionally, the group at KIT which was not directly doing
the measurement including myself had realized that the scan size of SICM is too small to be
able to scan several features at once as maximum image size is 15µm×15µm.
3.1.1 Ink α1 The first type of samples was prepared with an ink containing 90 mol% of a very fluid lipid
namely DOPC (1,2-dioleoyl-sn-glycero-3-phosphocholine), with structure as shown in Figure 3-
2, which is well known to easily deposit over glass substrate was used. It was admixed with 10
mol% of Rhodamine ((lissamine rhodamine B sulfonyl) (ammonium salt)), with structure as
shown in Figure 3-3, which is known to have a very bright red fluorescence even in low
concentrations and hence easy to detect under a florescence microscope even if the deposited
features are so small that they are not visible under a bright field optical microscope.
Figure 3-2 Structural Formula of the employed DOPC [29]
As may be observed in Figure 3-2 that DOPC has no overall net charge whereas from the
structural formula of Rhodamine in Figure 3-3 it is clear that it has an overall net charge of -1.
A predominantly neutral ink with 90% of neutral lipid and 10% of negatively charged lipid
tends to be slightly negative and therefore it is expected that it would amount to a reasonable
contrast when characterized under SICM to observe the natural topography of lipid in liquid.
20
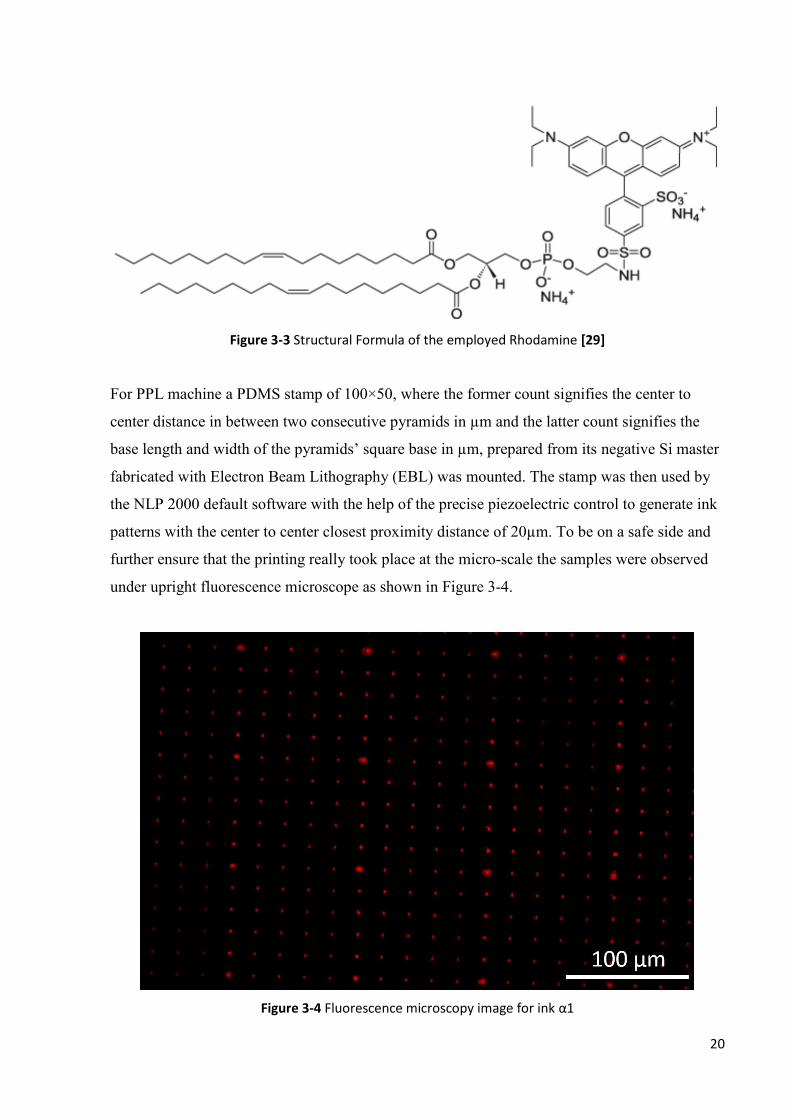
Figure 3-3 Structural Formula of the employed Rhodamine [29]
For PPL machine a PDMS stamp of 100×50, where the former count signifies the center to
center distance in between two consecutive pyramids in µm and the latter count signifies the
base length and width of the pyramids’ square base in µm, prepared from its negative Si master
fabricated with Electron Beam Lithography (EBL) was mounted. The stamp was then used by
the NLP 2000 default software with the help of the precise piezoelectric control to generate ink
patterns with the center to center closest proximity distance of 20µm. To be on a safe side and
further ensure that the printing really took place at the micro-scale the samples were observed
under upright fluorescence microscope as shown in Figure 3-4.
Figure 3-4 Fluorescence microscopy image for ink α1
21
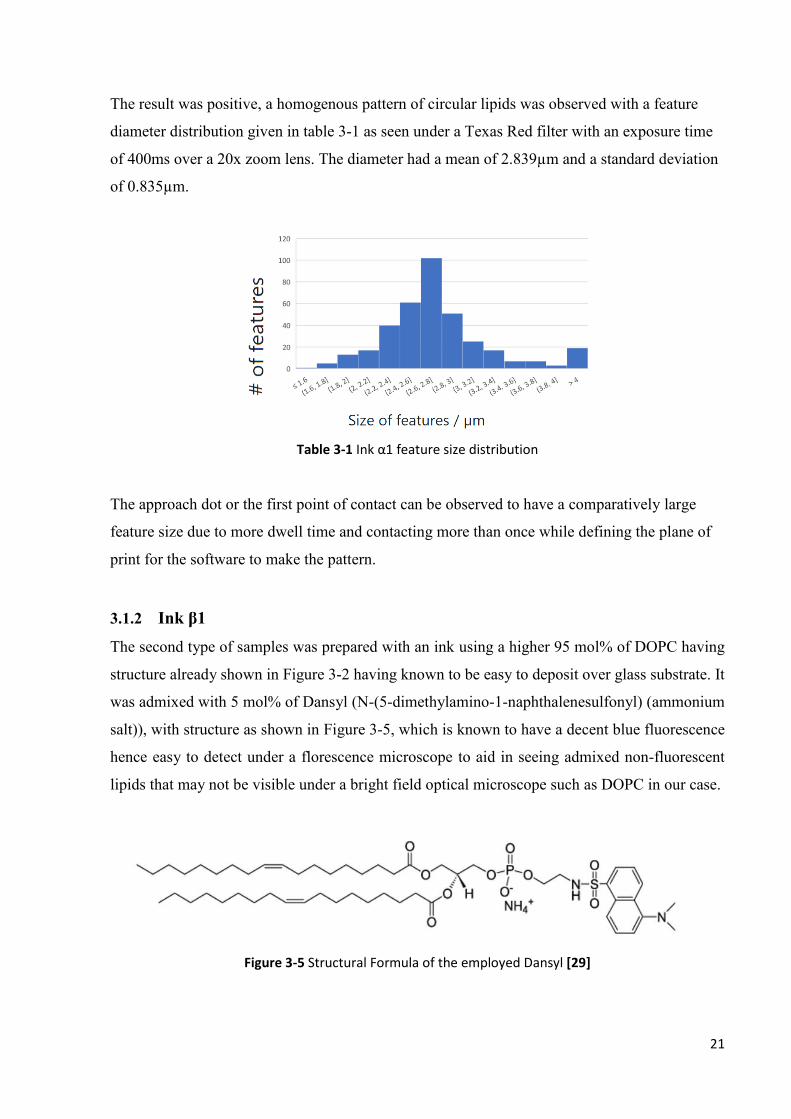
The result was positive, a homogenous pattern of circular lipids was observed with a feature
diameter distribution given in table 3-1 as seen under a Texas Red filter with an exposure time
of 400ms over a 20x zoom lens. The diameter had a mean of 2.839µm and a standard deviation
of 0.835µm.
Table 3-1 Ink α1 feature size distribution
The approach dot or the first point of contact can be observed to have a comparatively large
feature size due to more dwell time and contacting more than once while defining the plane of
print for the software to make the pattern.
3.1.2 Ink β1 The second type of samples was prepared with an ink using a higher 95 mol% of DOPC having
structure already shown in Figure 3-2 having known to be easy to deposit over glass substrate. It
was admixed with 5 mol% of Dansyl (N-(5-dimethylamino-1-naphthalenesulfonyl) (ammonium
salt)), with structure as shown in Figure 3-5, which is known to have a decent blue fluorescence
hence easy to detect under a florescence microscope to aid in seeing admixed non-fluorescent
lipids that may not be visible under a bright field optical microscope such as DOPC in our case.
Figure 3-5 Structural Formula of the employed Dansyl [29]

22
Again, DOPC has no overall net charge apparent while from Figure 3-5 it is clear that Dansyl
has an overall net charge of -1. A predominantly neutral ink with 95% of neutral lipid and 5%
of negatively charged lipid tends to be slightly negative and therefore it is expected that it
would amount to a reasonable contrast when characterized under SICM to observe the natural
topography of lipid in liquid.
For PPL machine a similar PDMS stamp of 100×50, where the former count signifies the center
to center distance in between two consecutive pyramids in µm and the latter count signifies the
base length and width of the pyramids’ square base in µm, prepared from its negative Si master
fabricated with Electron Beam Lithography (EBL) was mounted. Similar printing scheme of
patterns with the center to center closest proximity distance of 20µm was employed. As a litmus
test and ensure that the printing really took place at the micro-scale the samples were observed
under upright fluorescence microscope with result shown in Figure 3-6.
Figure 3-6 Fluorescence microscopy image for ink β1 of Batch no. 1
A homogenous pattern of lipids can be observed with a feature diameter distribution given in
Table 3-2 with a mean value of 10.84µm and standard deviation of 4.754µm under a DAPI
filter with an exposure time of 400ms over a 20x zoom lens.

23
Table 3-2 Ink β1 feature size distribution
The approach dot or the first point of contact once more can be observed to have a
comparatively large feature size due to more dwell time and contacting more than once while
defining the plane of print for the software to make the pattern. Additionally, when compared to
Figure 3-4 the average size of the features can be seen to be larger due to higher mol percentage
of DOPC which, to reiterate, has such viscosity which allows more deposition of the lipids to
the substrate.
3.1.3 Outlook Having noticed that there was not an appreciable charge contrast of the deposited features and
small scan size as apparent from SICM images, for the second batch prepared by PPL number
of strategies were devised to observed better SICM characterization, firstly it would best to
have a higher concentration of charged lipids than 5% or 10% as done previously in the
respective inks so that a high charge contrast is achieved which would result in a better
characterization. Secondly, as DOPC was seen to nicely deposit it could still be used as the
primary constituent in terms of concentration in the inks to act as the carrier lipid for the
charged lipids which may not have as nice deposition properties. Thirdly, the fluorescence lipid
concentration percentage needs to be decreased to avoid false positives as seen in the previous
case for ink α1 where a nice fluorescence microscopy image with bright red features was
observed but nothing appreciable was observed in SICM images. Fourthly, the features need to
be closely packed so that the scan size window of SICM can incorporate more than one feature.
Lastly, it would be even better to prepare a sample which is a multiplex of positively charged
lipid features and negatively charged lipid features so that the charge contrast is even greater
24
and importantly the negative charge tendency of the glass substrate can be either confirmed or
negated.
3.2 Moderately Charged Phospholipid Inks In the light of the decisions made thus far from the last Section, yet again, there were two variants
of inks used namely ink α2 which was moderately positively charged and ink β2 which had a
moderate-high negative charge with detailed composition provided in Section 3.2.1 and Section
3.2.2. The configuration details of the samples prepared by the multiplexing of both ink α2 and
ink β2 are provided in Section 3.2.3
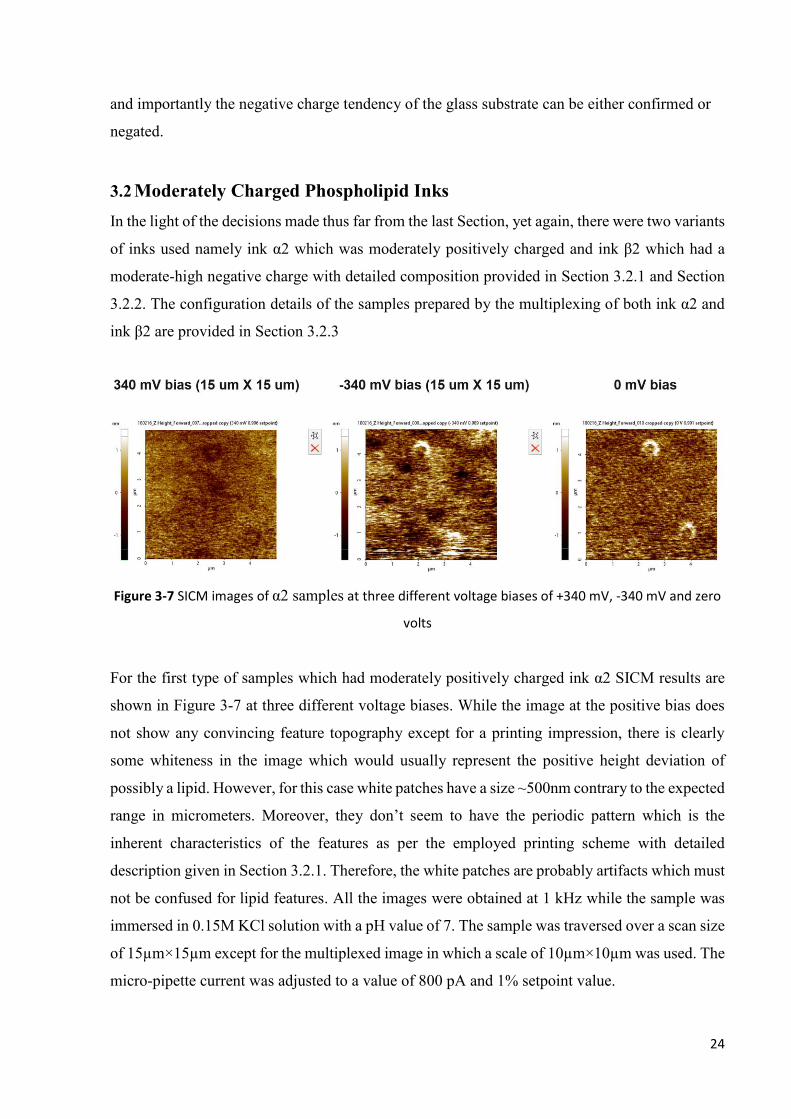
Figure 3-7 SICM images of α2 samples at three different voltage biases of +340 mV, -340 mV and zero
volts
For the first type of samples which had moderately positively charged ink α2 SICM results are
shown in Figure 3-7 at three different voltage biases. While the image at the positive bias does
not show any convincing feature topography except for a printing impression, there is clearly
some whiteness in the image which would usually represent the positive height deviation of
possibly a lipid. However, for this case white patches have a size ~500nm contrary to the expected
range in micrometers. Moreover, they don’t seem to have the periodic pattern which is the
inherent characteristics of the features as per the employed printing scheme with detailed
description given in Section 3.2.1. Therefore, the white patches are probably artifacts which must
not be confused for lipid features. All the images were obtained at 1 kHz while the sample was
immersed in 0.15M KCl solution with a pH value of 7. The sample was traversed over a scan size
of 15µm×15µm except for the multiplexed image in which a scale of 10µm×10µm was used. The
micro-pipette current was adjusted to a value of 800 pA and 1% setpoint value.

25
The second type of sample with moderately-high negatively charged ink β2, unfortunately it did
not give reasonable results except for noise for all biases that were tried with it. After observing
Figure 3-8 it would be safe to assume that the negatively charged lipids are camouflaged in the
negatively charged glass substrate which was doubted from results of the batch with slightly
charged inks in Section 3.1.
Figure 3-8 SICM images of β2 samples at three different voltage biases of +340 mV, -340 mV and zero
volts
The images with which most expectations were associated because of multiplexing of both
moderately charged positive ink α2 and moderately-high charged negative ink β2 definitely
shows white patches as may be observed in Figure 3-9 given below.
Figure 3-9 SICM images of α2 and β2 samples at three different voltage biases of 0 mV, -305 mV and -
305 mV

26
With the decreased 10µm×10µm scale it can be appreciated that the white patches have a size
~500nm contrary to the expected range in micrometers. Moreover, they don’t seem to have the
periodic pattern which is the inherent characteristics of the features as per the employed
printing scheme with detailed description given in Section 3.2.3. Therefore, the white patches
are probably artifacts which must not be confused for lipid features. The negative bias was
observed to enhance the role of artifacts in the image.
3.2.1 Ink α2 This type of samples was prepared with an ink containing 59.95 mol% of DOPC with structure
as shown in Figure 3-2, which was previously used and found to deposit well over the glass
substrate. It was admixed with 39.95 mol% DOTAP (1,2-dioleoyl-3-trimethylammonium-
propane (chloride salt)), with structure as shown in Figure 3-10. For fluorescence purposes 0.1
mol% of Rhodamine was used which is order of magnitude lower than the previous cases to avoid
getting false positive in SICM characterization and since it has a very bright red fluorescence it
glows even in low concentrations and hence easily detectable under a florescence microscope
Figure 3-10 Structural Formula of the employed DOTAP [29]
As maybe observed in Figure 3-2 that DOPC has no overall net charge whereas from the
structural formula of DOTAP in Figure 3-10 it is obvious that it has an overall net charge of +1.
An almost 60% neutral ink with about 40% of positive lipid tends to be moderately positively
charged, consequently it is expected that it would amount to a reasonable contrast with a
previously known to be slightly negative glass substrate when characterized under SICM to
observe the natural topography of lipid in liquid.
For PPL machine a PDMS stamp of 100×50, where the former count signifies the center to
center distance in between two consecutive pyramids in µm and the latter count signifies the
base length and width of the pyramids’ square base in µm, prepared from its negative Si master

27
fabricated with Electron Beam Lithography (EBL) was mounted as done previously. The stamp
was then used by the NLP 2000 default software with the help of the precise piezoelectric
control to generate ink patterns with the center to center closest proximity distance of 20µm
which look like as shown in Figure 3-11 when observed under upright fluorescence microscope.
Figure 3-11 Fluorescence microscopy image for ink α2
A somewhat homogenous pattern of lipids with feature diameter distribution given in table 3-3
was observed with a lens of 10x giving a mean value of 6.897µm and a standard deviation of
1.904µm under a Texas Red filter with an exposure time of 10s.

28
Table 3-3 Ink α2 feature size distribution
The approach dot or the first point of contact can be observed to have a comparatively large
feature size due to more dwell time and contacting more than once while defining the plane of
print for the software to make the pattern.
3.2.2 Ink β2 The second type of samples was prepared with an ink constituting the same 59.95 mol% of DOPC
as for α2 to act as the carrier lipid which ensures printing of the ink. It was admixed with 39.05
mol% of DGS-NTA (1,2-dioleoyl-sn-glycero-3-[(N-(5-amino-1-carboxypentyl)iminodiacetic
acid)succinyl]), with structure as shown in Figure 3-12. The remaining 1 mol% was for PE CF
(1,2-dioleoyl-sn-glycero-3-phosphoethanolamine-N-(carboxyfluorescein) (ammonium salt))
commonly known as fluorescein with structure displayed in Figure 3-13 which is expected to
have a decent green fluorescence aiding detection under a florescence microscope and since it is
not as bright as Rhodamine so one order of magnitude higher molar percentage of fluorescence
lipid is used compared to α2.
Figure 3-12 Structural Formula of DGS-NTA [29]

29
Figure 3-13 Structural Formula of carboxyfluorescein [29]
DOPC as observed already has no overall net charge but from Figure 3-12 DGS-NTA has an
overall net charge of -3. Although only 1 mol% but fluorescein can be considered to have -2 net
charge as well. A 60% neutral ink with about 39% of highly negatively charged lipid and 1
mol% of slightly negatively charged lipid can be thought to be moderately-high negatively
charged and therefore it is expected that it would amount to a reasonable contrast when
characterized under SICM to observe the natural topography of lipid in liquid even if the
substrate is slightly negatively charged glass.
For PPL machine a as in all previous case a PDMS stamp of 100×50, where the former count
signifies the center to center distance in between two consecutive pyramids in µm and the latter
count signifies the base length and width of the pyramids’ square base in µm, prepared from its
negative Si master fabricated with Electron Beam Lithography (EBL) was mounted. Similar
printing scheme of patterns with the center to center closest proximity distance of 20µm was
employed. As a litmus test and ensure that the printing really took place at the micro-scale the
samples were observed under upright fluorescence microscope with result shown in Figure 3-
14.
30
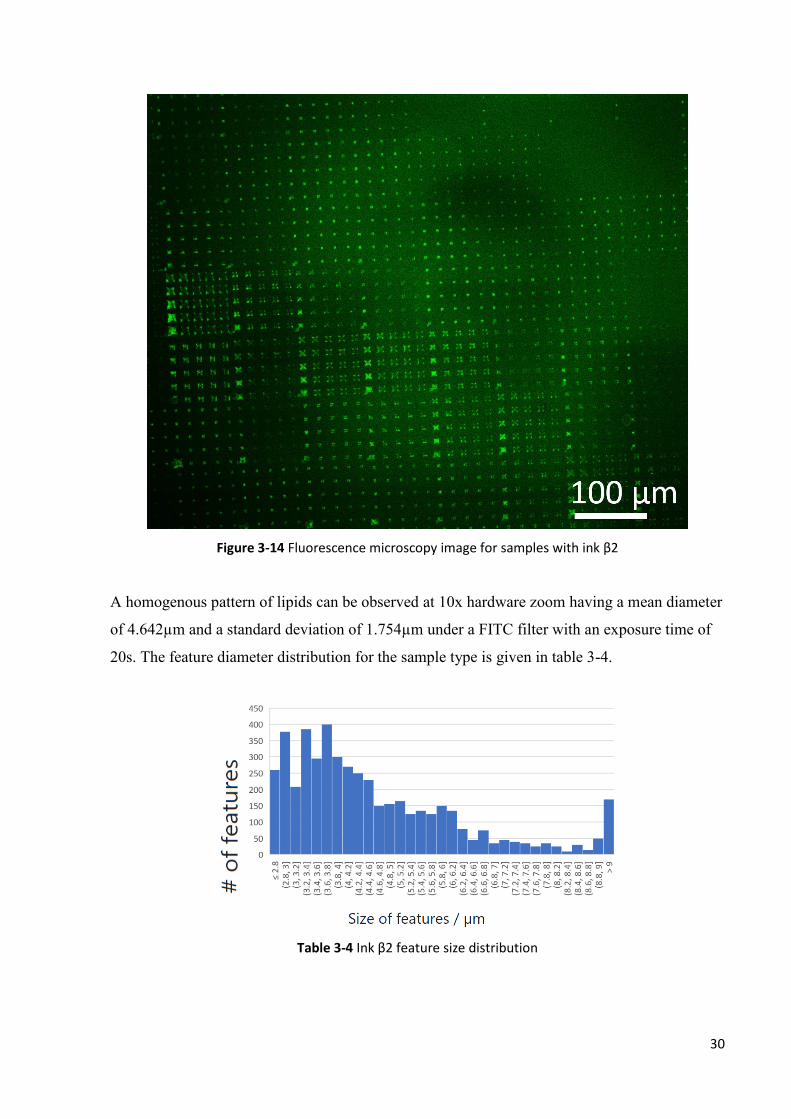
Figure 3-14 Fluorescence microscopy image for samples with ink β2
A homogenous pattern of lipids can be observed at 10x hardware zoom having a mean diameter
of 4.642µm and a standard deviation of 1.754µm under a FITC filter with an exposure time of
20s. The feature diameter distribution for the sample type is given in table 3-4.
Table 3-4 Ink β2 feature size distribution

31
3.2.3 Sample with multiplexing of ink α2 and ink β2 This type of sample was prepared with a multiplexing of overall positively charged ink α2 (details
in Section 3.2.1) as well as overall negatively charged ink β2 (details in Section 3.2.2) within a
close proximity to have a high contrast and both types of lipids within the limited scan size of
SICM.
To print in this multiplexed manner with PPL machine a PDMS stamp with four instead of one
Section of 100×50, where the former count signifies the center to center distance in between
two consecutive pyramids in µm and the latter count signifies the base length and width of the
pyramids’ square base in µm, prepared from its negative Si master fabricated with Electron
Beam Lithography (EBL) was used. The stamp was then used by the NLP 2000 default
software with the help of the precise piezoelectric control to generate ink patterns with the
center to center closest proximity distance of 20µm for each ink. As it can be perceived from
samples with solely ink α2 (details in Section 3.2.1) and solely ink β2 (details in Section 3.2.2)
that the feature sizes were of radius 2µm and 5µm respectively which is not so large as to cause
mixing of both the inks henceforth with 10µm axial offset in both axis inks were multiplexed.
Its fluorescence image can be observed in Figure 3-15 taken from an upright fluorescence
microscope.

32
Figure 3-15 Fluorescence microscopy image for samples with ink α2 multiplexed with ink β2
A somewhat similar homogenous pattern of both inks was observed under a lens of 10x
showing a mean feature diameter of 3.628µm and standard deviation of 1.487µm with a
superposition of images taken under a Texas Red filter and FITC filter at an exposure time of
15s for each filter. The detailed feature diameter distribution is given in table 3-5 below.
Table 3-5 Feature size distribution of samples with multiplexing of ink α2 and ink β2

33
The approach dot or the first point of contact can be observed to have a comparatively large
feature size due to more dwell time and contacting more than once while defining the plane of
print with the software to make the pattern for both ink α2 and ink β2.
3.2.4 Outlook There were many takeaways from the moderately charged ink characterization results obtained
to have an improved iteration thereafter. Consequently, for the third batch prepared by PPL
number of strategies were devised to observed better SICM characterization results, firstly it
was thought that since the lipids are printing very well at half concentration of carrier lipid
namely DOPC it would best to have an even higher concentration of charged lipids than ~40%
as done previously in the respective inks for a high charge contrast. Secondly, as features were
not seen well under SICM for the highly anticipated multiplexed version of ink α2 and ink β2 it
was proposed to even closely pack the features to observe inside the scan size window of
SICM. Lastly, it was projected that multiplexing of inks to have a negative and positive ink side
by side was not that good of an idea, in fact a highly positively charged ink would stand out
better over the negatively charged glass substrate as per the calibration of SICM done at
CeNTech, Munster.
3.3 Highly Charged Phospholipid Inks For the third batch of PPL a highly positively charged lipid ink which was used to draw a high
contrast with the negatively charge glass substrate. The ink viz. ink γ with detailed composition
provided in Section 3.3.1 was used for this purpose. The ink γ samples showed a nice pattern
under fluorescence microscope in the lab at KIT without intermixing of the features for 10µm
closest proximity distance.
Figure 3-16 shows the results obtained with BM-SICM with positive DC offset and Figure 3-17
shows the results obtained with BM-SICM with negative DC offset where brightness corresponds
to the vertical height of the features. The patches were observed to have a periodic pattern to
confirm that they indeed represent lipids.

34
Figure 3-16 BM-SICM image of a PPL-lipid sample with a positive DC offset of 290 mV
With negative offset the features were observed with much less noise as in Figure 3-17 as
compared to results with positive offset.
Figure 3-17 BM-SICM image of a PPL-lipid sample with a negative DC offset of -290 mV
3.3.1 Ink γ The samples were prepared with an ink containing 99 mol% of MVL5 (N1-[2-((1S)-1-[(3-
aminopropyl)amino]-4-[di(3-amino-propyl)amino]butylcarboxamido)ethyl]-3,4-di[oleyloxy]-
benzamide) with structure as shown in Figure 3-18, which was found to deposit over the substrate
by trial and error method. It was admixed with 1 mol% of Rhodamine ((lissamine rhodamine B
35
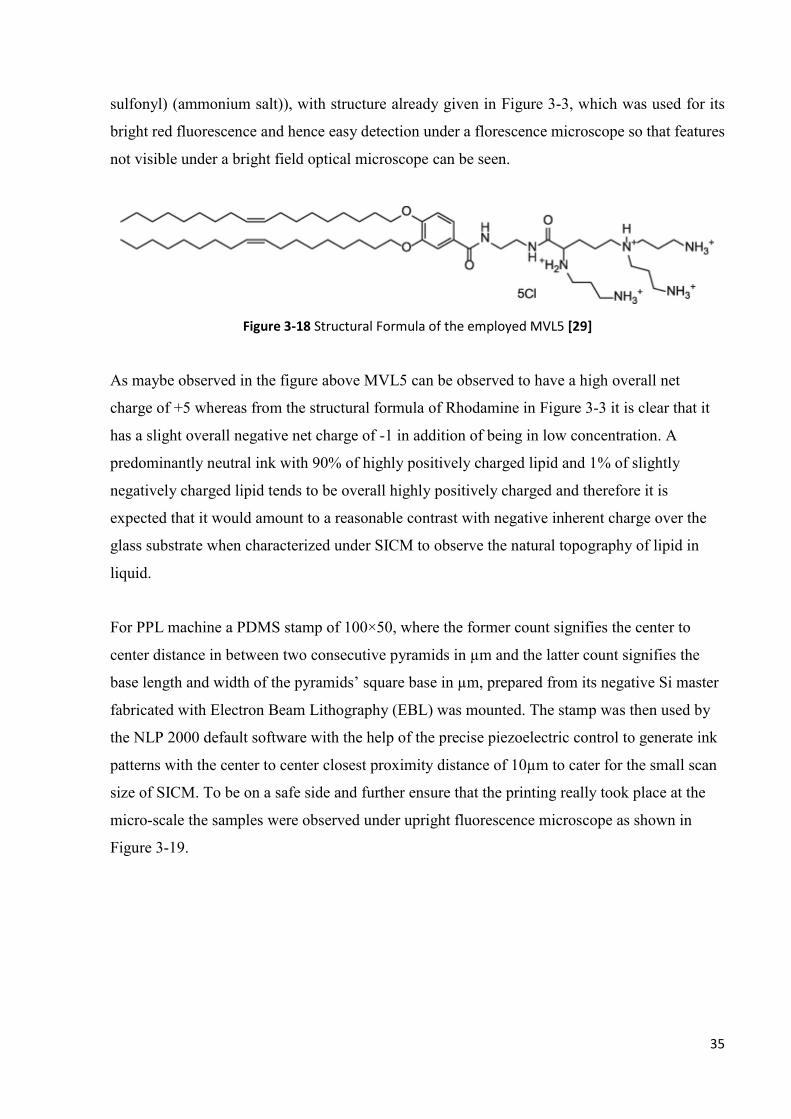
sulfonyl) (ammonium salt)), with structure already given in Figure 3-3, which was used for its
bright red fluorescence and hence easy detection under a florescence microscope so that features
not visible under a bright field optical microscope can be seen.
Figure 3-18 Structural Formula of the employed MVL5 [29]
As maybe observed in the figure above MVL5 can be observed to have a high overall net
charge of +5 whereas from the structural formula of Rhodamine in Figure 3-3 it is clear that it
has a slight overall negative net charge of -1 in addition of being in low concentration. A
predominantly neutral ink with 90% of highly positively charged lipid and 1% of slightly
negatively charged lipid tends to be overall highly positively charged and therefore it is
expected that it would amount to a reasonable contrast with negative inherent charge over the
glass substrate when characterized under SICM to observe the natural topography of lipid in
liquid.
For PPL machine a PDMS stamp of 100×50, where the former count signifies the center to
center distance in between two consecutive pyramids in µm and the latter count signifies the
base length and width of the pyramids’ square base in µm, prepared from its negative Si master
fabricated with Electron Beam Lithography (EBL) was mounted. The stamp was then used by
the NLP 2000 default software with the help of the precise piezoelectric control to generate ink
patterns with the center to center closest proximity distance of 10µm to cater for the small scan
size of SICM. To be on a safe side and further ensure that the printing really took place at the
micro-scale the samples were observed under upright fluorescence microscope as shown in
Figure 3-19.

36
Figure 3-19 Fluorescence microscopy image for ink γ with distance of 10µm
The ink was seen to be deposited well as a homogenous pattern of lipids with mean diameter of
4.616µm and a standard deviation of 2.684µm under a Texas Red filter with an optical zoom of
10x. The detailed feature diameter distribution is given in table 3-6 below.
Table 3-6 Feature size distribution of samples with ink γ
The approach dot or the first point of contact can be observed to have a comparatively large
feature size especially due to suitable viscosity of MVL5, more dwell time and contacting more
than once while defining the plane of print for the software to make the pattern.

37
3.4 Lipid known to have good adherence to glass substrate For the AFM topographical analysis of lipids an ink without fluorescence was employed,
therefore it was necessary to ensure that the constituent of the ink was previously shown to print
perfectly. DOPC with structural formula shown in Figure 3-2 in pure form without admixing
any other type of lipid was used as profile for its dip pen nanolithography deposition with
respect to the dwell time is already known from a study [16] as displayed in Figure 3-20.
Figure 3-20 DOPC height profile against DPN contact dwell time over substrate [16]
As the data is only applicable to DPN therefore it is only valid if the PPL stamp is barely
touching the substrate as proven in a previous study [14] by which PPL has been shown to
operate in 3 different regimes from DPN to hybrid to eventually µCP type mode of operation
with increasing contact area of stamp with the substrate as given in Figure 3-21.

38
Figure 3-21 Different mode of operations of PPL dictated by the contact area [14]
An intentional gradient was introduced to observe how the lipid topography differs in both
modes of operation. A dwell time of 10 sec taking into account the data given Figure 3-20 was
used to safely ensure a definite printing of the lipid over the substrate for detailed SPM
characterization thereafter. The chamber had an environment humidity of 25% at room
temperature and pressure. For characterization a clear distinction between approach dots or
pattern dots was not made and there is a possibility that the feature in question may be from
either of the two forms.
3.4.1 Completely decompressed PDMS pyramid Figure 3-22 shows the feature profile of the lipid with PPL operating in the quasi-µCP mode as
the contact area was high with a blue arrow shown in the figure for visual aid displaying the
amount of decompression of the PDMS pyramid corresponding to the situation in question.

39
Figure 3-22 DOPC print with high decompression of the PDMS pyramid [14]
As may be observed in the figure above the contact area is around 2500 micrometer squared
which is the total area of single PDMS pyramid of the PPL stamp implying a complete
decompression of the pyramid. As the feature is circular it means that quite a lot of spreading
already took place before withdrawing the stamp which means that this feature represents the
approach dot as the image clearly shows the dwell time was high by the standards of DOPC.
The height of the lipid along the cut can be observed to increase in discrete steps and then
apparently decrease due to flattening of the image as per the axial cut. The apparent minimum
in the middle of the cut is an artifact and this minimum is in fact representative of the maximum
height of the feature. After the maximum, an almost mirror image of the first half can be
observed. Over the self-assembled monolayer near the edges of the PDMS pyramids used there
are visible lipid bilayers stacks one over another mounting up till the maximum in the middle.
The asymmetric trench in the middle is a depression as clear reduction of lipid layers around
depression can be observed which may be due to uneven movement while in contact or at the
time of stamp lift-off. At the maximum, height is slightly more than 30nm from the axial cut,
with reference of substrate, which amounts to around 10 lipid bilayers above the self-assembled
monolayer as the height of a single lipid bilayer is around 3nm. This matches well with the
observable AFM image where the discrete lipid steps can be counted to the same amount.

40
3.4.2 Partially decompressed PDMS pyramid Figure 3-24 shows the feature profile of the lipid with PPL operating in the hybrid mode as the
contact area was almost half of the base area of PDMS pyramid with a blue arrow shown in the
figure for visual aid displaying the amount of decompression of the PDMS pyramid
corresponding to the situation in question.
Figure 3-24 DOPC print with intermediate decompression of the PDMS pyramid [14]
As may be observed in the figure above the contact area is around 1250 micrometer squared
which is half of the total base area of single PDMS pyramid of the PPL stamp implying an
intermediate decompression of the pyramid. The height of the lipid along the cut can be
observed to increase rapidly with discrete steps and then there is an apparent decrease to an
almost steady value which again is an artifact as in the last case introduced by flattening. After
the midpoint of steady value which in fact represents the maximum height of lipid, an almost
mirror image of the first half can be observed. Over the wetting layer near the edges of the
PDMS pyramids used as may be observed in the AFM image at the bottom without fingers,
over it are more lipid bilayers stacks having fingers over the circumference. At the maximum,
height is slightly more than 12nm from the axial cut, with reference of substrate, which
amounts to around 4 lipid bilayers above the self-assembled monolayer as the height of a single
lipid bilayer is around 3nm.

41
3.4.3 Decompressed PDMS pyramid tip Figure 3-25 shows the feature profile of the lipid with PPL operating in the quasi-DPN mode as
PDMS pyramid was touching the substrate with its tip decompressed with a blue arrow shown
in the figure for visual aid displaying the decompression of the PDMS pyramid tip
corresponding to the situation in question.
Figure 3-25 DOPC print with decompression of the PDMS pyramid tip [14]
As may be observed in the figure above the contact area is orders of magnitude lower than the
total base area of single PDMS pyramid of the PPL stamp implying a negligible decompression
of the pyramid. The height of the lipid along the cut can be observed to not have sharp edges
and a decreasing profile as in the previous cases but instead have an almost steady profile. This
means that the artifacts are minimal in this case as the lipid height is not very high hence
flattening of the image does not affect much. Not a lot of spreading of ink has taken place as
may be evident from the image with feature being more rectangular than circular. A steady
value of around 4.5nm is observed which amounts to around 2 lipid bilayers above the self-
assembled monolayer as the height of a single lipid bilayer is around 3nm and that of SAM is
around 1.5nm.

42
3.5 Pure Lipid ink deposition without carrier lipid over glass substrate Having successfully deposited highly positively charged pure lipid MVL5 for SICM
characterization opened the potential of PPL in depositing pure lipid inks without the carrier
lipid DOPC which is not possible with DPN. An ink without fluorescence with pure DOPE
lipid having structural formula shown in Figure 3-26 was employed. Unlike DOPC, the printing
properties of pure DOPE using PPL over glass substrate were unknown. DOPC has been
constantly used in this study as the carrier lipid known to deposit well over glass but DOPE
alone was not used in this study anywhere before this. As in the previous case an intentional
gradient like Figure 3-22 was introduced to observe DOPE’s printing in all the regimes over the
glass substrate if it takes place in either of the quasi-DPN meniscus type transfer or quasi-µCP
stamping type mode of operation as the contact area of stamp with the substrate is increased.
A dwell time of 5 sec to ensure sufficient contact of inked stamp to the substrate was used with
chamber humidity of 25% at room temperature and pressure. Subsequently, it was taken for
detailed AFM. Again, a clear distinction between approach dots or pattern dots was not made
and there is a possibility that the feature in question may be from either of the two forms.
Figure 3-26 Structural Formula of the employed DOPE [29]
3.5.1 Completely decompressed PDMS pyramid Figure 3-27 shows the feature profile of the lipid with PPL operating in the quasi-µCP mode as
the contact area was high with a blue arrow shown in the figure for visual aid displaying the
amount of decompression of the PDMS pyramid corresponding to the situation in question.

43
Figure 3-27 DOPE print with high decompression of the PDMS pyramid [14]
For this experiment a stamp with 25µm square base width was used. As may be observed in the
figure above the contact area is around 625 micrometer squared which is the total area of single
PDMS pyramid of the PPL stamp implying a complete decompression of the pyramid. The
height of the lipid along the cut can be observed to display train of impulses in the left half at
regular intervals and negligible deposition in the right half. Feature height slightly above 4nm
was observed which amounts to around 2 lipid bilayers over the wetting monolayer as the
height of a single lipid bilayer is around 3nm.
3.5.2 Partially decompressed PDMS pyramid Figure 3-24 shows the feature profile of DOPE lipid with PPL expected to operate in a more
hybrid mode closer to DPN meniscus type transfer as the contact area was almost half of the
base area of PDMS pyramid with a blue arrow shown in the figure for visual aid displaying the
amount of decompression of the PDMS pyramid corresponding to the situation in question.
However, PPL was still found to deposit somewhat square features and not quasi-circular which
means that the deposition still takes place in stamping mode which is why DOPE lipid transfers
in the first place because without carrier lipid it is not known to deposit with DPN.

44
Figure 3-28 DOPE print with intermediate decompression of the PDMS pyramid [14]
As may be observed in the figure above the contact area is around 400 micrometer squared
which is two thirds the total base area of single PDMS pyramid of the PPL stamp implying an
intermediate decompression of the pyramid. The height of the lipid is relatively uniform unlike
the impulses in the last case. A uniform height of around 4.5nm which amounts to around 3
lipid monolayers as the height of a single lipid monolayer is around 1.5nm.
3.6 Proposed Lipid Quantification Method for future studies The results in the previous subSections have given enough empirical data to find a pattern in the
results and come up with a generic quantification method for lipids. A figurative display
deposited lipid layers is given in Figure 3-29 from a study [18] which has then been labeled as
suited for the derivation of the quantification method. The layer L0 represents the height of a
single layer at the bottom which is the self-assenbled monolayer. L0 is then followed by a the
first inverted lipid bilayer namely L1, followed by the second inverted lipid bilayer L2 and so on
and so forth.

45
Figure 3-29 Graphic display of stacks of lipd layers with assigned labels [18]
As a relatable example for instance Figure 3-30 shows 3-D image of the scenario given in
Section 3.4.3 with a quasi-DPN mode operation of PPL patterning of DOPC lipid.
Figure 3-30 3-D image of DOPC lipid feature patterned by PPL in quasi-DPN mode
The lipid feature can be observed to have discrete heights as limited by the layer thickness
which only comes in discrete value i.e. single lipid bilayer has a thickness of ~3nm. To quantify
the amount of lipid deposited in discrete steps it is necessary to step-wise integrate the planes.

46
Therefore, the proposed method integrates for the factor I0 the self-assembled monolayer which
it takes as the reference normalization factor for the later layers. For the calculation of I0 a z-
axis limited volume integral is to be calculated with limits z=0 to z=1.5nm which is the average
thickness of a single lipid layer. Since one of the three axes is already defined the volume
integral in this case would not be a triple integral but would be reduced to a double integral over
x-y axis. The x-y axis limit of the substrate can be arbitrary as per the requirement of the study
and dimensions of the substrate to be calculated. The following formulas are only valid if the
substrate surface is perfect lying on the x-y plane without any tilt.
I0 = ∬1.5 × 10⁻⁹dxdy
OR
In0 = 1
The formula for I0 is essentially the integral of the layer L0 as displayed in Figure 3-29 which
would amount to a value on the order of 10-9 or similar so a parallel quantification scheme to
make intuitive sense defines normalized integral In0 equal to 1 can be used to get a convenient
relative values for the later layers.
Similarly, I1 can be calculated for the z limits from z=1.5nm to z=4.5nm which would
incorporate the first reversed lipid bilayer over the SAM (self-assembled monolayer).
I1 = ∬3 × 10⁻⁹dxdy
OR
In1 = I1/ 2I0
By this scheme I1 would amount to the absolute integral of the layer L1 as displayed in Figure 3-
29 which would amount to a value on the order of 10-9 or similar so a parallel quantification
scheme to make intuitive sense defines normalized integral In1 such that it would give a value in
between zero to 1 which would intuitively represent the ratio of molecules of lipid in the self -
assembled monolayer which also had another lipid on their top in layer L1.
Classically speaking it is impossible to have a lipid layer over air as there needs to be a
continuous stack of lipids to support the lipids in the upper layer which is the principle this
quantification methods develops upon. Therefore, normalized integral cannot possibly be
greater than 1. In contrast, a value of zero would represent the complete absence of the first
layer. A negative value is impossible to obtain as per the definition.

47
Similarly, I2 can be calculated for the z limits from z=4.5nm to z=7.5nm which would
incorporate the second reversed lipid bilayer over the SAM.
I2 = ∬3 × 10⁻⁹dxdy
OR
In2 = I2/ 2I0
By this scheme I2 would amount to the absolute integral of the layer L2 as displayed in Figure 3-
29 which would amount to a value on the order of 10-9 or similar so a parallel quantification
scheme to make intuitive sense defines normalized integral In2 such that it would give a value in
between zero to 1 which would intuitively represent the ratio of lipid molecules in layer L1
which also had another lipid bilayer on their top in layer L2.
Similarly I3, so on and so forth later layers can be quantified by the generic formula for the m’th
positive integer given below.
Im = ∬3 × 10⁻⁹dxdy
OR
Inm = Im/ 2I0
To end with, this method not only has the capability of quantifying the deposited lipids over the
substrate but can also decisively enumerate how much destructing a characterization technique
such as SPM techniques i.e. AFM and SICM in this case can potentially be to the deposited
lipids. By observing the change in integral values Im and normalized ratios Inm one can easily
observe the worth of these formulas as a tool to compare different characterization methods for
the suitability of samples as delicate as the lipids samples. Moreover, the change in
characterization parameters e.g. voltage setpoint, DC offsets for AFM to ensure minimum
destruction to the samples can be facilitated by means of this quantification method.
This method would particularly come in handy as the research group continues to do the AFM
characterization as done in the previous Section but in physiological buffer unlike air as done in
this study. This is because in physiological buffer the sample is prone to more destruction as
compared to air apparent from the SICM experiments in this study too.
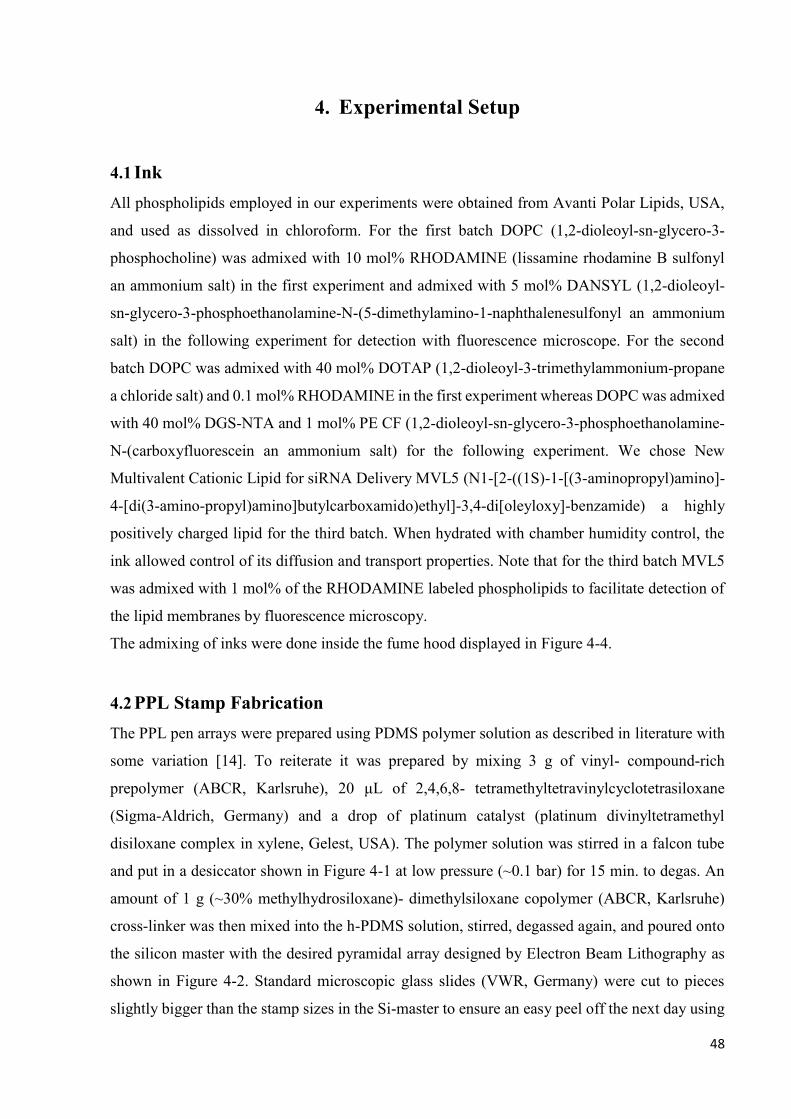
48
4. Experimental Setup
4.1 Ink All phospholipids employed in our experiments were obtained from Avanti Polar Lipids, USA,
and used as dissolved in chloroform. For the first batch DOPC (1,2-dioleoyl-sn-glycero-3-
phosphocholine) was admixed with 10 mol% RHODAMINE (lissamine rhodamine B sulfonyl
an ammonium salt) in the first experiment and admixed with 5 mol% DANSYL (1,2-dioleoyl-
sn-glycero-3-phosphoethanolamine-N-(5-dimethylamino-1-naphthalenesulfonyl an ammonium
salt) in the following experiment for detection with fluorescence microscope. For the second
batch DOPC was admixed with 40 mol% DOTAP (1,2-dioleoyl-3-trimethylammonium-propane
a chloride salt) and 0.1 mol% RHODAMINE in the first experiment whereas DOPC was admixed
with 40 mol% DGS-NTA and 1 mol% PE CF (1,2-dioleoyl-sn-glycero-3-phosphoethanolamine-
N-(carboxyfluorescein an ammonium salt) for the following experiment. We chose New
Multivalent Cationic Lipid for siRNA Delivery MVL5 (N1-[2-((1S)-1-[(3-aminopropyl)amino]-
4-[di(3-amino-propyl)amino]butylcarboxamido)ethyl]-3,4-di[oleyloxy]-benzamide) a highly
positively charged lipid for the third batch. When hydrated with chamber humidity control, the
ink allowed control of its diffusion and transport properties. Note that for the third batch MVL5
was admixed with 1 mol% of the RHODAMINE labeled phospholipids to facilitate detection of
the lipid membranes by fluorescence microscopy.
The admixing of inks were done inside the fume hood displayed in Figure 4-4.
4.2 PPL Stamp Fabrication The PPL pen arrays were prepared using PDMS polymer solution as described in literature with
some variation [14]. To reiterate it was prepared by mixing 3 g of vinyl- compound-rich
prepolymer (ABCR, Karlsruhe), 20 μL of 2,4,6,8- tetramethyltetravinylcyclotetrasiloxane
(Sigma-Aldrich, Germany) and a drop of platinum catalyst (platinum divinyltetramethyl
disiloxane complex in xylene, Gelest, USA). The polymer solution was stirred in a falcon tube
and put in a desiccator shown in Figure 4-1 at low pressure (~0.1 bar) for 15 min. to degas. An
amount of 1 g (~30% methylhydrosiloxane)- dimethylsiloxane copolymer (ABCR, Karlsruhe)
cross-linker was then mixed into the h-PDMS solution, stirred, degassed again, and poured onto
the silicon master with the desired pyramidal array designed by Electron Beam Lithography as
shown in Figure 4-2. Standard microscopic glass slides (VWR, Germany) were cut to pieces
slightly bigger than the stamp sizes in the Si-master to ensure an easy peel off the next day using

49
a scalpel. The glass slides were carefully placed on the filled Si master and pressed down to fill
the inverted pyramids of the Si-master homogeneously and to ensure that none of the air bubbles
remain. The PDMS polymer was cured overnight on a hot plate as shown in Figure 4-3 at 70 °C.
Next day the residual PDMS over the stamp was carefully removed from the side of glass and the
stamp array was detached from the master by using a scalpel. Thereafter the excess PDMS which
could possibly affect printing results was removed from the microscopic glass slide stamp.
Figure 4-1 Desiccator used for the experiment
Figure 4-2 Si masters used for the experiment
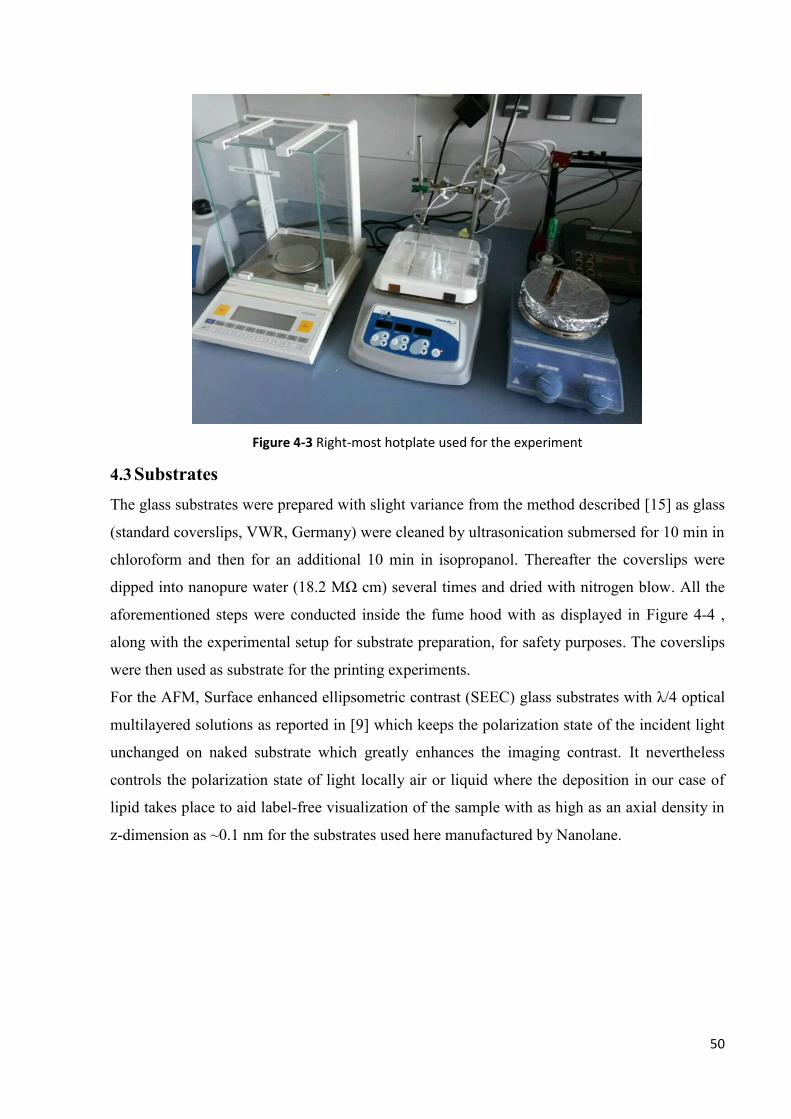
50
Figure 4-3 Right-most hotplate used for the experiment
4.3 Substrates The glass substrates were prepared with slight variance from the method described [15] as glass
(standard coverslips, VWR, Germany) were cleaned by ultrasonication submersed for 10 min in
chloroform and then for an additional 10 min in isopropanol. Thereafter the coverslips were
dipped into nanopure water (18.2 MΩ cm) several times and dried with nitrogen blow. All the
aforementioned steps were conducted inside the fume hood with as displayed in Figure 4-4 ,
along with the experimental setup for substrate preparation, for safety purposes. The coverslips
were then used as substrate for the printing experiments.
For the AFM, Surface enhanced ellipsometric contrast (SEEC) glass substrates with λ/4 optical
multilayered solutions as reported in [9] which keeps the polarization state of the incident light
unchanged on naked substrate which greatly enhances the imaging contrast. It nevertheless
controls the polarization state of light locally air or liquid where the deposition in our case of
lipid takes place to aid label-free visualization of the sample with as high as an axial density in
z-dimension as ~0.1 nm for the substrates used here manufactured by Nanolane.

51
Figure 4-4 Fume hood used for preparation of ink and substrate
4.4 Printing Process Patterns were printed with an NLP 2000 system (NanoInk, USA) as reported previously [15].
The machine used for this study is shown in Figure 4-5. Before inking, stamps were treated with
oxygen plasma (0.2 mbar, 100 W, 10 sccm O2, 2 min, ATTO system, Diener electronics,
Germany) to enhance hydrophilicity of the surface. For each experiment stamps were inked by
spin-coating 2ul of respective inks (30 s at 3500 rpm) to spread the lipids uniformly by the spin
coater on the right most edge of the fume hood in Figure 4-4. The polymer pen array was pasted
on the holder of an NLP 2000 instrument (NanoInk, USA) by two-component epoxy given in
Figure 4-6. The holder shown at the bottom right of Figure 4-7 is custom made in a workshop as
by default NLP 2000 is used for SPT instead of PPL which is in fact the primary focus of this
study, so a different holder was developed. A sacrificial cover slip is consumed for parallel
alignment of stamp and substrate by leveling as the pen array was tilted with respect to the
substrate with the internal controls of the printing setup as appropriate until sufficient balance is
achieved. Ink was printed in such a way as to create an array of dots with minimum of 20μm
horizontal and vertical distance apart for first 2 and last 2 batches, and 10μm horizontal and
vertical distance apart for the third batch.

52
Figure 4-5 NLP 2000 setup used for patterning in all the experiments of the study
Figure 4-6 Two component UHU epoxy used to paste the stamp over the holder

53
Figure 4-7 Customized holder for PPL on bottom right and glass slides used as the base for stamp on
the left-most side
4.5 Characterization Parameters The Fluorescence Microscopy, Scanning Ion Conductance Microscopy (SICM) and Atomic
Force Microscopy (AFM) in air was employed to characterize the phospholipids deposited over
the substrate the details of which are given in the following sub-Sections.
4.5.1 Fluorescence Microscopy Micro-graphs are taken with the DAPI, FITC and texas-red channels of an upright microscope
for the first batch as shown in Figure 4-8.

54
Figure 4-8 Upright fluorescence microscope used for sample characterization
For the second batch inverted microscope shown in Figure 4-9 with the Texas red filter was used
for immediate confirmation of whether printing took place before going for detailed SICM
characterization. The exposure time and zoom value is given in each Section as per the case.
Figure 4-9 Inverted fluorescence microscope used for sample characterization

55
For post image processing ImageJ was used to process the images from fluorescence
microscopy as given in section where results are discussed. Auto thresholding was used to
obtain the area of the lipid features which stood out due to fluorescence over the reference
background substrate. Thereafter area of contours with circularity of greater than 0.1 was
obtained and then their diameter was displayed as a histogram distribution.
4.5.2 SICM SICM studies presented here were performed by an NX-Bio (Park Systems, Suwon, South
Korea). SICM measurements were done in amplitude-based BM-SICM mode [17] provided by
Park Systems both with raster scanning method, not with spectroscopic hopping scheme [23,
25-27]. Typical scanning speed for these two modes was selected to be 0.3 Hz. For amplitude-
based BM-SICM mode applied AC voltage signal wass with drive of 50 mV and 1 kHz
frequency (where we can get the clearest topographic images), and its responsive amplitude of
measured AC current signal was used as feedback value for topographic imaging of our
standard samples [17]. Although McKelvey et al. found that phase signal from detected AC
current was more sensitive for recognizing tip-to-sample distance [17], we cannot use this mode
because of its saw-tooth like artifact in low frequency (~1 Hz) upon the monitored phase value
with unidentified reason. 1 kHz of input AC voltage frequency was still enough for observing
topographic change induced by surface charge from our standard samples according to the
applied DC offset voltages. Control over this amplitude-based BM-SICM mode was done with
SmartScan (ver. 1.0 Build 74 RTM8a, Park Systems, Suwon, South Korea. The SICM images
were flattened and analyzed with the XEI software program (ver. 4.3.0.Build5, Park Systems).
At first, we have examined the reliability of our amplitude-based BM-SICM mode with a
topographic standard sample in a raster-scanning manner. This standard sample was made with
casted PDMS upon the calibration grating (TGZ1, NT-MDT, Moscow, Russia, 20 nm height
with 3 um lateral period). BM-SICM mode produced clear topography for this sample (without
applying any DC offset) as expected. Throughout the whole measurements with SICM,
regardless of the mode under use, the setpoint was chosen to be 1% decrease from the bulk
value of monitored physical quantities (AC amplitude for BM-SICM mode, After checking that
this BM-SICM mode is trustful, we moved onto standard samples for surface charge mapping
of PPL-lipid patches (positively or negatively charged as the case may be) both upon the glass
substrates (negatively charged within neutral pH aqueous solution), which is designed to show
well-defined electrostatic charge contrast from patterned region to the remaining glass.

56
Throughout whole measurements, no meaningful difference in relative amplitude noise level
has been found at these opposite DC offset polarities. For the case of the lipid samples, typical
thickness of patterned layer was in the range of 3~5 nm, indicating that pattern consists of just a
few layers of phospholipids. Even though our lipid ink molecules have more positive charges
per a head (+4).
Till now, we have shown amplitude-based BM-SICM studies on topographic change induced
by surface charge from its standard samples made constituting lipids. Our lipid patterns meet all
needs required for other established SPM measurement schemes, well-defined, periodic
topography and surface charge in large area (larger than mm2 scale). BM-SICM mode was
found to be better at its stability, image quality, and reproducibility with samples imaged at a
frequency of 1 kHz, an input bias of 50mV while the sample was immersed in 0.15M KCl
solution with a pH value of 7. The sample was traversed over a scan size of 15µm×15µm. The
pipette current was adjusted to a value of 800 pA and 1% setpoint value. The values were
recorded at different DC offset for different batches as per the imaging requirement to obtain
optimized image. Finally, it proves that this amplitude-based SICM mode could be used as a
reliable and robust scheme for surface charge mapping studies within physiological conditions.
4.5.3 AFM For a high-resolution and detailed characterization of the patterns of samples from fourth and
fifth batch AFM was employed on a Dimension AFM system (Bruker, Germany) in tapping mode
with HQ:NSC15/Al BS cantilevers (MikroMasch, USA) with 325 kHz nominal resonance
frequency. All measurements were done in air under ambient conditions. The images were taken
with PeakForce QNM mode. Image processing and export was carried out in the onboard
software package. The parameters such as setpoint, scanning frequency etc. were adjusted such
that the best possible image by causing the least possible destruction while traversing the sample
occurred. These values differed for fourth and fifth batches that were characterized by AFM and
even further differed depending on the features deposited in either quasi-DPN, hybrid or quasi-
μCP mode. The case specific details of the parameters are given below.

57
DOPC features with Quasi-DPN mode:
Figure 4-10 AFM parameters for DOPC features with Quasi-DPN mode
DOPC features with hybrid mode:
Figure 4-11 AFM parameters for DOPC features with hybrid mode

58
DOPC features with Quasi-μCP mode:
Figure 4-12 AFM parameters for DOPC features with Quasi-μCP mode
DOPE features with Quasi-DPN mode:
Figure 4-13 AFM parameters for DOPE features with Quasi-DPN mode

59
DOPE features with Quasi-μCP mode:
Figure 4-14 AFM parameters for DOPE features with Quasi-μCP mode
.
60
5. Conclusion
PPL was found to successfully print phospholipids over glass substrate with the control to print
in the operating mode of either of its precursor namely DPN and µCP. With the perfectly
parallel levelling of the PPL stamp with the substrate almost equal precision to that of DPN was
noticed as the stamp master manufactured by EBL is also very accurate in terms of distance in
between the eventual PDMS pyramids used to deposit features. The adsorption of
phospholipids head with glass substrate forming SAM stacked over on top by lipid bilayers was
found to have step-like discrete patterns and understandably so because of the amphiphilic
molecular structure of the lipids employed. A theoretical method is proposed which not only
quantifies the stacked phospholipid layers in physiological solution, mimicking its natural state
being the main constituent of cell membrane in blood plasma, but also has the potential to
quantify the Scanning Probe Microscopy (SPM) probe which is used to characterize the sample
such that the probe can be said to have certain factor which represent the destruction caused to
the particular phospholipid feature while traversing over the sample in water.
As for the characterization results, SICM was found to give best results for phospholipids with
highly positively charged headgroup as it gave rise to the best contrast in terms of charge with
the glass substrate background. The AFM images clearly showed bigger features with larger
contact area of PDMS pyramid touching the substrate at the time of deposition. This
observation is consistent with the fluorescence imaging results from a previous study [14] and
the printing of DOPE via PPL is a successful demonstration that PPL can be used to print lipids
(pure) that cannot be written via DPN. The AFM studies revealed that this is because the PPL
does a more µCP mode in this case (compared to the more DPN mode with DOPC), which is
not obtainable in DPN.
Although the SICM measurements were done with samples immersed in a physiological buffer
but all AFM results in this study were obtained with samples in air which is not reminiscent in
terms of explaining lipids’ natural behavior e.g. being main constituent of plasma membrane in
blood plasma. So, with the opening of gateways to precisely print such lipids with PPL which
are inconceivable to otherwise write via DPN and research group at the hosting institute
61
continuing SPM characterization of lipids inside physiological buffers a lot of potential in terms
of contributing to the field of science and medicine is expected in the near future.

62
6. References
[1] Ginger, David S., Zhang, H. & Mirkin, Chad A. The Evolution of Dip-Pen Nanolithography,
Angewandte Chemie, 43, 30–45, (2004)
[2] Perry, D. et al. Surface charge visualization at viable living cells. J. Am. Chem. Soc. 138, 3152-3160
(2016)
[3] Piner, Richard D., Zhu, J., Xu, F., Hong, S., Mirkin, Chad A. “Dip-Pen” Nanolithography, Science, 283,
661-663, (1999)
[4] Falko Brinkmann , Michael Hirtz , * Alexandra M. Greiner , Markus Weschenfelder , Björn
Waterkotte , Martin Bastmeyer , and Harald Fuchs, Interdigitated Multicolored Bioink Micropatterns by
Multiplexed Polymer Pen Lithography, Small, 9, 3266–3275, (2013)
[5] Michael Hirtz, Remi Corso, Sylwia Sekula-Neuner and Harald Fuchs, Comparative Height
Measurements of Dip-Pen Nanolithography- Produced Lipid Membrane Stacks with Atomic Force,
Fluorescence, and Surface-Enhanced Ellipsometric Contrast Microscopy, Langmuir, 27, 11605–11608,
(2011)
[6] Huo, F., Zheng, Z., Zheng, G., Giam, Louise R., Zhang, H. & Mirkin, Chad A. Polymer Pen Lithography,
Science, 321, 1658-1660, (2008)
[7] A. Urtizberea and M. Hirtz, A diffusive ink transport model for lipid dip-pen nanolithography,
Nanoscale, 7, 15618, (2015)
[8] Michael Hirtz, Antonios Oikonomou, Thanasis Georgiou, Harald Fuchs & Aravind Vijayaraghavan,
Multiplexed biomimetic lipid membranes on graphene by dip-pen nanolithography, Nature
Communications, 4:2591, (2013)
[9] D. Ausserré and M.-P. Valignat, "Surface enhanced ellipsometric contrast (SEEC) basic theory and
λ/4 multilayered solutions," Opt. Express 15, 8329-8339 (2007)
[10] Xia, Younan & Whitesides, George M. Soft Lithography, Angewandte Chemie International Edition,
37, 550-575, (1998).
[11] Wilbur, J. L., Kumar, A. , Kim, E. & Whitesides, G. M. Microfabrication by microcontact printing of
self‐assembled monolayers, Adv. Mater., 6, 600-604, (2004).
[12] S. Bian, S. B. Zieba, W. Morris, X. Han, D. C. Richter, K. A. Brown, C. A. Mirkin & A. B. Braunschweig
Beam pen lithography as a new tool for spatially controlled photochemistry{,} and its utilization in the
synthesis of multivalent glycan arrays, Chem. Sci., 5, 2023-2030, (2014).

63
[13] Hirtz, M. , Sekula‐Neuner, S. , Urtizberea, A. & Fuchs, H. Functional Lipid Assemblies by Dip‐Pen
Nanolithography and Polymer Pen Lithography, In Soft Matter Nanotechnology (eds X. Chen and H.
Fuchs).
[14] Kumar, R., Urtizberea, A., Ghosh, S., Bog, U., Rainer, Q., Lenhert, S., Fuchs, H. & Hirtz, M. Polymer
Pen Lithography with Lipids for Large-Area Gradient Patterns, Langmuir, 33, 8739−8748, (2017).
[15] Brinkmann, F., Hirtz, M., Greiner, A. M., Weschenfelder, M., Waterkotte, B., Bastmeyer, M. &
Fuchs, H. Interdigitated Multicolored Bioink Micropatterns by Multiplexed Polymer Pen Lithography.
Small, 9, No. 19, 3266–3275, (2013).
[16] Urtizberea, A. & Hirtz, M. A diffusive ink transport model for lipid dip-pen nanolithography.
Nanoscale 7, 15618 (2015)
[17] McKelvey, K., Perry, D., Byers, J. C., Colburn, A. W. & Unwin P. R. Bias modulated scanning ion
conductance microscopy. Anal. Chem. 86, 3639−3646 (2014)
[18] Seddon J M, Squires A M, Conn Charlotte E, Ces O, Heron A J, Mulet X, Shearman G C, Templer R
H. Pressure-jump X-ray studies of liquid crystal transitions in lipids. The Royal Society. 364, 2635-2655
(2006)
[19] Leckband, D. & Israelachvili, J. Intermolecular forces in biology. Q. Rev. Biophys. 34, 105-267
(2001)
[20] Hunter, R. J. Zeta potential in colloid science: principles and applications 98-117 (Academic Press,
1988)
[21] Jacobasch, H. J., G. Bauböck & J. Schurz. Problems and results of zeta-potential measurements on
fibers. J. Colloid & Polymer Sci. 263, 3-24 (1985)
[22] Ahimou, F., Denis, F. A., Touhami, A & Dufrêne, Y. F. Probing microbial cell surface charges by
atomic force microscopy. Langmuir 18, 9937-9941 (2002)
[23] McKelvey, K., Kinnear, S. L., Perry, D., Momotenko, M., & Unwin, P. R. Surface charge mapping
with a nanopipette. J. Am. Chem. Soc. 136, 13735-13744 (2014)
[24] Klausen, L. H., Fuhs, T., & Dong, M. Mapping surface charge density of lipid bilayers by quantitative
surface conductivity microscopy. Nat. Commun. 7, 12447 (2016)
[25] Perry, D., Botros, R. A., Momotenko, D., Kinnear, S. L., & Unwin, P. R. Simultaneous nanoscale
surface charge and topographical mapping. ACS Nano 9, 7266-7276 (2015)
[26] Perry, D. et al. Surface charge visualization at viable living cells. J. Am. Chem. Soc. 138, 3152-3160
(2016)

64
[27] Page, A. et al. Fast Nanoscale surface charge mapping with pulsed-potential scanning ion
conductance microscopy. Anal. Chem. 88, 10854−10859 (2016)
[28] Fuhs, T., Klausen, L. H., Sønderskov, S. M., Han, X. & Dong, M. Direct measurement of surface
charge distribution in phase separating supported lipid bilayers. Nanoscale 10, 4538-4544 (2018)
[29] “Avanti Polar Lipids.” Avanti Polar Lipids, avantilipids.com/

65
I LIST OF ABBREVIATIONS
DPN --- Dip pen nanolithography PPL --- Polymer pen lithography AFM --- Atomic force microscopy SEM --- Scanning electron microscopy PE --- Printed electronics PDMS --- Poly-Dimethylsiloxane NMR --- Nuclear magnetic resonance ICs --- Integrated Circuits MEMS --- Micro electromechanical systems SPM --- Scanning probe microscopy µCP --- Microcontact Printing

66
II DEDICATION
This thesis is dedicated to all humankind with a humble request
to have mutual respect and of propagating kindness,
love and tolerance.
Recommended