PSM 1 July 2008
Practical Software and Systems Measurement
Please use Slides #2-7 for your
introductions and slides #8-13 for your
outbrief on Friday, 18 July

PSM 2 July 2008
Practical Software and Systems Measurement
Practical Software and
Systems MeasurementA foundation for objective project management
Measuring in Services Mgt
Tuesday, July 15th
Beth LaymanPSM Users Group Conference
14-18 July 2008
Mystic, Connecticut
PSMPSMPSMPSMPSMPSMPSMPSM

PSM 3 July 2008
Practical Software and Systems Measurement
Measuring in Services Management
• Service Management- Focus on ongoing IT service operations - day-to-
day activities (vs. projects)
- Involves the operation of hardware, software, applications, data, and networks needed to run the business
• Industry models: ITIL, ISO/IEC 20000, eSCM-SP, COBIT, eTOM, and SMBOK- Process Areas we’ll focus on – Event, Incident,
Problem, Release, Change Mgt; Request Fulfillment, Service Desk, Capacity Management
• Measurement is key to effective management

PSM 4 July 2008
Practical Software and Systems Measurement
Objectives of the Workshop
• Begin to examine the proper use of measurement
in service management/service operations
• Develop a preliminary list of common information
needs and potential measures that are useful in
this domain
• Provide lessons learned, barriers, data quality
issues, best practices, how to establish
baselines, etc.
• Provide examples of good practice

PSM 5 July 2008
Practical Software and Systems Measurement
Workshop Agenda
Drafting of ICM entries/measurement specs
-break outs
4:00 – 5:00
Available examples of measures to meet needs
-Show-and-tell; best practices
3:30 – 4:00
Common issues & information needs in ops
shops
-brainstorming & discussion
2:30 – 3:00
Review of ITIL process areas of focus
-Mapping to org structures, technology
2:00 – 2:30
Introductions – Participant Analysis
-Your role in Ops, models your shop uses,
maturity of shop
1:30 – 2:00
PSM 6 July 2008
Practical Software and Systems Measurement
Workshop Background
• PSM history in this area
• Where we’re heading
• Issues, questions, and topics

PSM 7 July 2008
Practical Software and Systems Measurement
Intended Output
• Drafted ICM table
• Recommendations/plans for continued
evolution
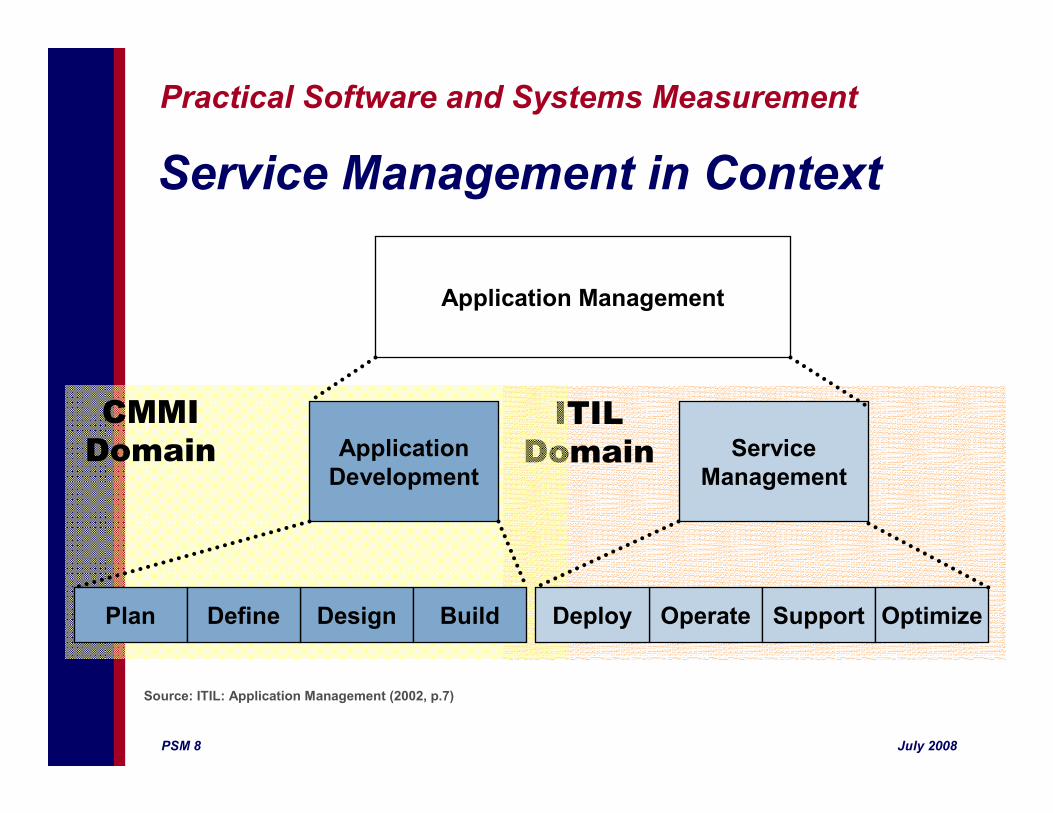
PSM 8 July 2008
Practical Software and Systems Measurement
ITIL
Domain
CMMI
Domain
Service Management in Context
Application Management
Application
Development
Service
Management
Plan Design Build OperateDeploy Support OptimizeDefine
Source: ITIL: Application Management (2002, p.7)

PSM 9 July 2008
Practical Software and Systems Measurement
IT Infrastructure Library (ITIL)
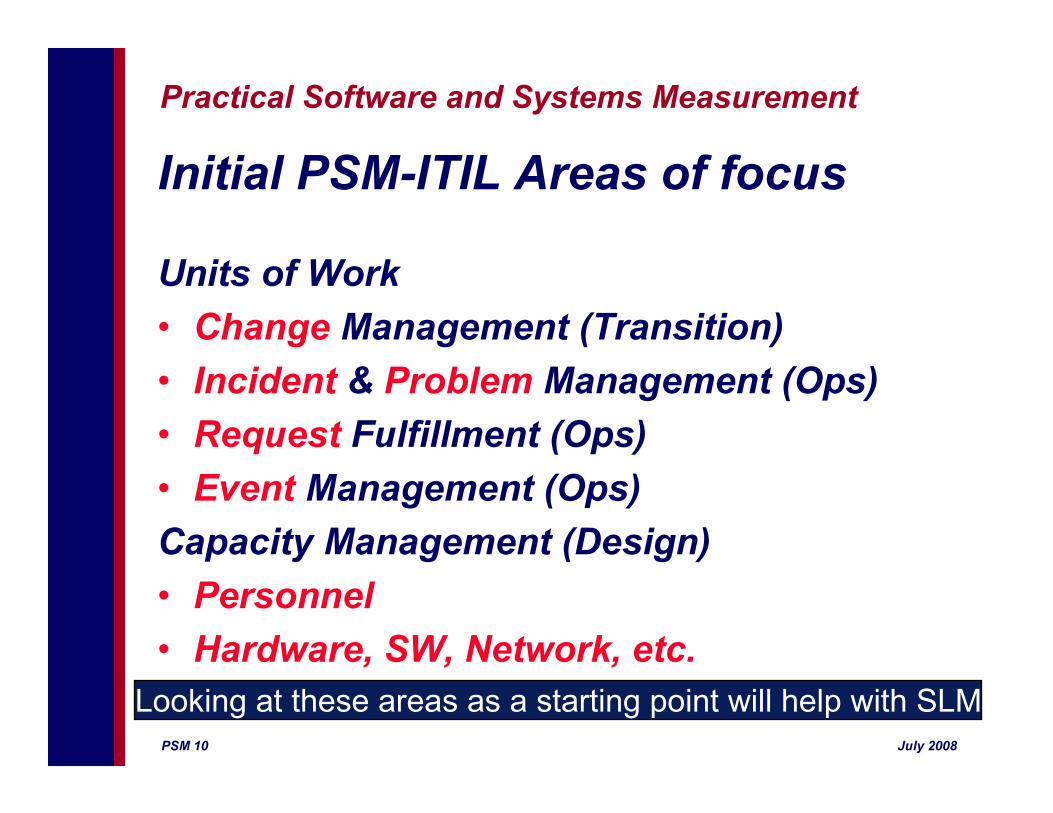
PSM 10 July 2008
Practical Software and Systems Measurement
Initial PSM-ITIL Areas of focus
Units of Work
• Change Management (Transition)
• Incident & Problem Management (Ops)
• Request Fulfillment (Ops)
• Event Management (Ops)
Capacity Management (Design)
• Personnel
• Hardware, SW, Network, etc.
Looking at these areas as a starting point will help with SLM

PSM 11 July 2008
Practical Software and Systems Measurement
Change Management
• Change Request (RFC): A formal proposal for a change to be made.
- Examples: Push application release into production, fix a production problem
• An implementation of new functionality
• Any repair to an interruption of service
• Any repair of existing functionality
• Any removal of existing functionality
- Change Advisory Board (CAB)
- Issues: Unauthorized changes, unsuccessful changes, emergency changes
- Considerations: Risk of making the change, Relationship to other activities, Return expected if change is made
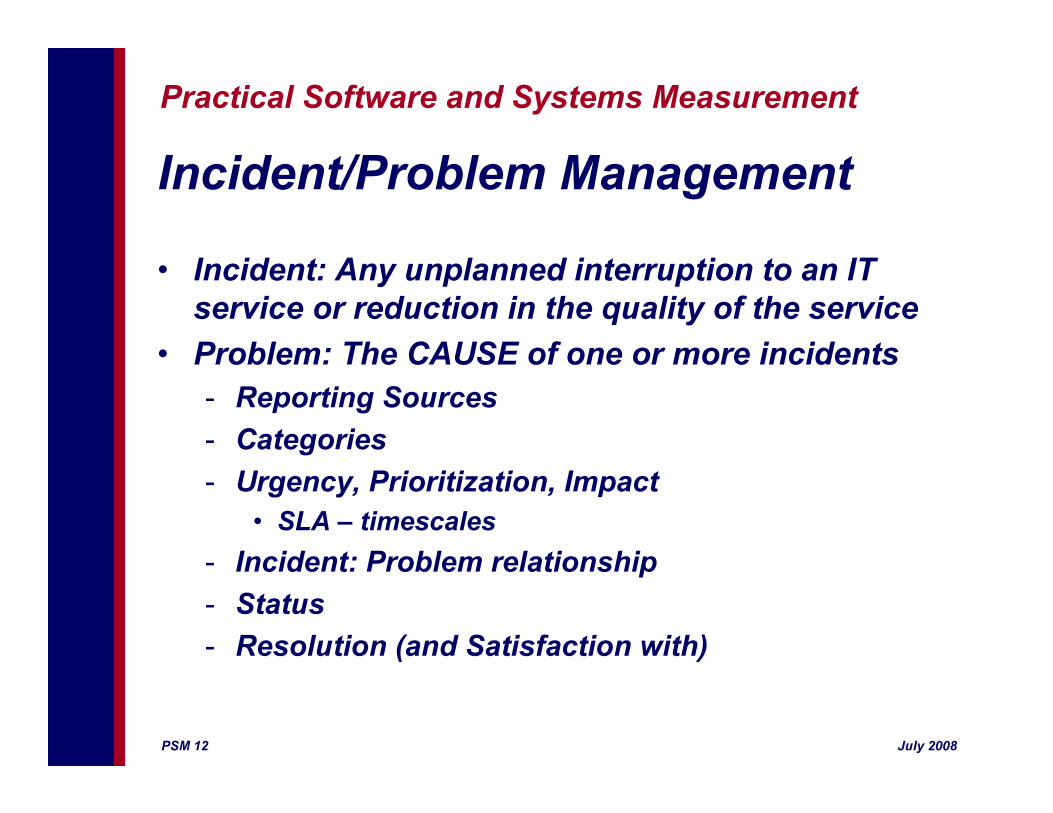
PSM 12 July 2008
Practical Software and Systems Measurement
Incident/Problem Management
• Incident: Any unplanned interruption to an IT
service or reduction in the quality of the service
• Problem: The CAUSE of one or more incidents
- Reporting Sources
- Categories
- Urgency, Prioritization, Impact
• SLA – timescales
- Incident: Problem relationship
- Status
- Resolution (and Satisfaction with)

PSM 13 July 2008
Practical Software and Systems Measurement
Request Fulfillment
• Request: Demands placed on IT by the
users (Help Desk/Service Desk)
- Give access to user, install SW, move a PC
- These things can and should be planned
(vs. incident)
• When needed

PSM 14 July 2008
Practical Software and Systems Measurement
Event Management
• Event: Any detectable occurrence that might cause a deviation to service
- Categories:
• Normal Events: Scheduled operation starts, completes; user logs into an application,
• Exception Events: Smoke, fire, license violation, security (intrusion detection), application failure, poor server performance
• Significance Categorization
- Informational, Warning, Exception
• Event Response
PSM 15 July 2008
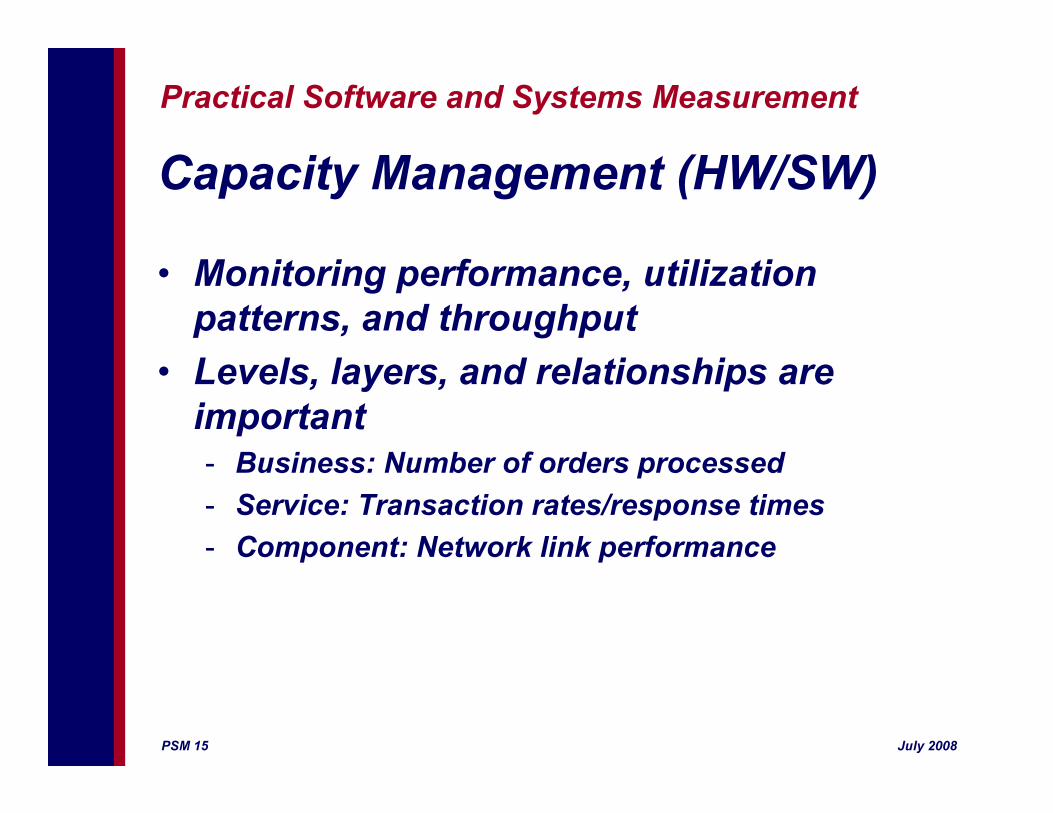
Practical Software and Systems Measurement
Capacity Management (HW/SW)
• Monitoring performance, utilization
patterns, and throughput
• Levels, layers, and relationships are
important
- Business: Number of orders processed
- Service: Transaction rates/response times
- Component: Network link performance

PSM 16 July 2008
Practical Software and Systems Measurement
Capacity Management (People)
• Workload –> Resource relationship
• Issues: Not enough personnel to meet
SLA targets, given current/projected
workloads

PSM 17 July 2008
Practical Software and Systems Measurement
Insights Needed
• Monitor and Control Operations
- (SLA) targets being met
• Stability of Operations
• Predicting Future Needs
- e.g., Volumes = Workforce
• Improvements over time

PSM 18 July 2008
Practical Software and Systems Measurement
Workshop Agenda
Drafting of ICM entries/measurement specs
break outs
4:00 – 5:00
Available examples of measures to meet needs
-Show-and-tell; best practices
3:30 – 4:00
Common issues & information needs in ops
shops
-brainstorming & discussion
2:30 – 3:00
Review of ITIL process areas of focus
-Mapping to org structures, technology
2:00 – 2:30
Introductions – Participant Analysis
-Your role in Ops, models your shop uses,
maturity of shop
1:30 – 2:00

PSM 19 July 2008
Practical Software and Systems Measurement
Thinking about an ICM Table
Project-Specific Issues
Common Areas
Issue
MeasurementCategories
Measures
X

PSM 20 July 2008
Practical Software and Systems Measurement
Issue Mapping
Project - Specific Issues Common Issue Areas
Aggressive ScheduleConcurrent ActivitiesCritical Dependencies
Changing Mission Objectives
Questionable Size EstimatesUnstable Requirements
Reliability ObjectivesMaintainability Requirements
Fixed BudgetStaff Experience Staff Availability
Schedule and Progress
Product Size and Stability
Product Quality
Resources and Cost
X

PSM 21 July 2008
Practical Software and Systems Measurement
Workshop Agenda
Drafting of ICM entries/measurement specs
-break outs
4:00 – 5:00
Available examples of measures to meet needs
-Show-and-tell; best practices
3:30 – 4:00
Common issues & information needs in ops
shops
-brainstorming & discussion
2:30 – 3:00
Review of ITIL process areas of focus
-Mapping to org structures, technology
2:00 – 2:30
Introductions – Participant Analysis
-Your role in Ops, models your shop uses,
maturity of shop
1:30 – 2:00
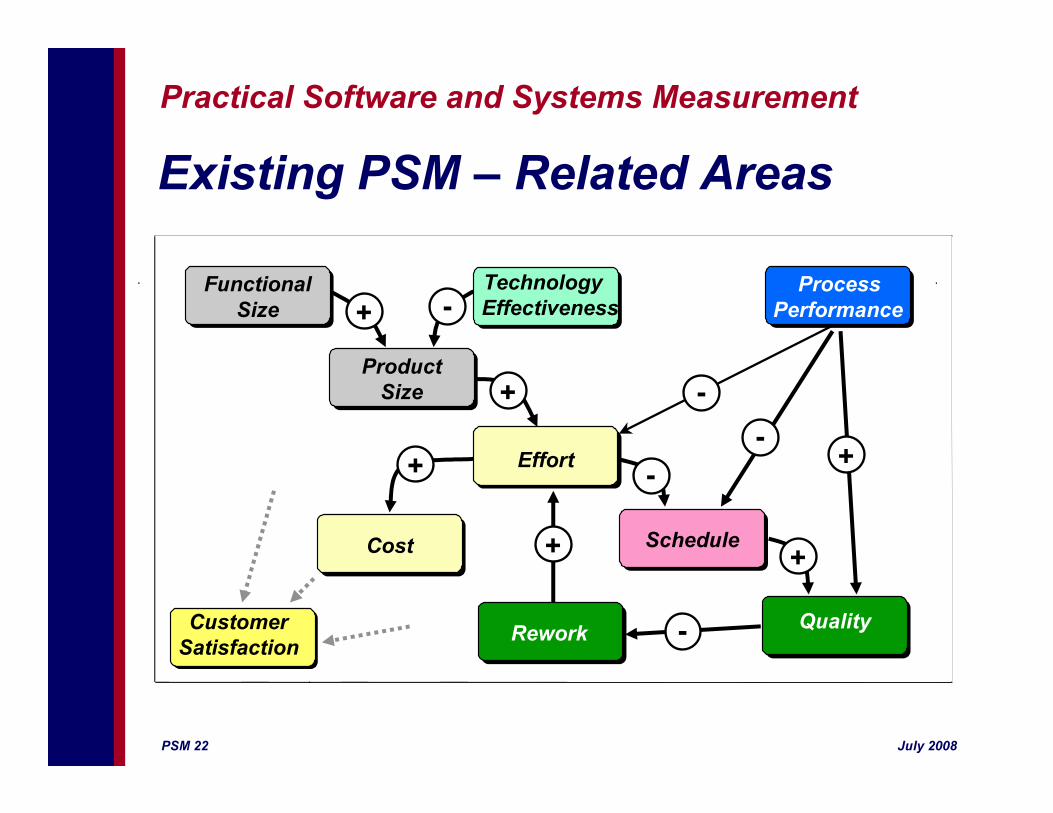
PSM 22 July 2008
Practical Software and Systems Measurement
Existing PSM – Related Areas
Quality
Functional
Size
Product
Size
Technology
Effectiveness
Rework
Cost Schedule
Effort
Process
Performance+ -
+
+
+
-
-
+
-
-+
Customer
Satisfaction

PSM 23 July 2008
Practical Software and Systems Measurement
Schedule and Milestone Performance Milestone DatesProgress Critical Path Performance
Problem Report StatusReview StatusChange Request StatusComponent StatusTest StatusAction Item Status
Incremental Capability Increment Content - Component Increment Content - Functionality
Resources and Personnel EffortCost Staff Experience
Staff TurnoverFinancial Performance Earned Value
CostEnvironment and Resource AvailabilitySupport Resources Resource Utilization
Product Size Physical Size Database Sizeand Stability and Stability Components
InterfacesLines of CodePhysical Dimensions
Functional Size Requirementsand Stability Functional Change Workload
Function Points
Work Unit Progress Requirements Status
Common IssueArea
Issue - Category - Measure Mapping
MeasurementCategory
MeasuresPSM Mappingof Issues,Categories,andMeasures

PSM 24 July 2008
Practical Software and Systems Measurement
PSM Mappingof Issues,Categories,andMeasures(cont)
Product Quality Functional Correctness DefectsTechnical Performance
Supportability Time to RestoreCyclomatic ComplexityMaintenance Actions
Efficiency UtilizationThroughputTiming
Portability Standards Compliance Usability Operator ErrorsDependability Failures
Fault Tolerance
Process Process Compliance Reference Model RatingPerformance Process Audit Findings
Process Efficiency ProductivityCycle Time
Process Effectiveness EscapesRework
Technology Technology Suitability Requirements CoverageEffectiveness Impact Technology Impact
Technology Volatility Baseline Changes
Customer Customer Feedback Survey ResultsSatisfaction Performance Rating
Customer Support Requests for SupportSupport Time
Common IssueArea
Issue - Category - Measure Mapping
MeasurementCategory
Measures

PSM 25 July 2008
Practical Software and Systems Measurement
Some examples-1 Impact
High Medium Low
High
Priority: Severity 1 Response Time: 30 min. Target Resolution Time: 2 hrs.
Priority: Severity 1 Response Time: 30 min. Target Resolution Time: 2 hrs.
Priority: Severity 2 Response Time: 60 min. Target Resolution Time: 8 hrs.
Urg
ency
Low
Priority: Severity 1 Response Time: 30 min. Target Resolution Time: 2 hrs.
Priority: Severity 2 Response Time: 60 min. Target Resolution Time: 8 hrs.
Priority: Severity 3 Response Time: 24 hours Target Resolution Time: Best Effort
Urgency Description Ask the question: Can The User Work?
High
• Critical Server Outage • Network Outage • Key Application Outage • Critical User
No
Medium
• Non-critical Server Outage • Non-essential Application Outage • Reduced performance of critical system or network.
Yes, with some issues
Low
• No Outage • Workaround Available • Support Services (installs, office moves, etc.)
Yes, with no issues or a known error
Impact Description
High
• > 5 incidents on same issue
• > 5 people affected
• Critical User
Low
• < 5 incidents on same issue
• < 5 people affected

PSM 26 July 2008
Practical Software and Systems Measurement
Some examples-2
Change Acceptance Rate
• Number of RFCs submitted/rejected• H igh > 99%
• A ccept ≥ 95% ≤ 99%
• L ow < 95%
Incidents attributed to Changes
• Number of Incidents/problems resulting from an implemented RFC
Service Desk is Single Point Of Contact for Customer Incidents (Total Volume)• H igh > 95%
• A ccept > 70% ≤ 95%
• L ow ≤ 70%
Percentage Resolved – 1st Call
Percentage Incidents Escalated
Restore Normal Service 1st Call Avg. Time (Aging)
Number of System Outages Due to Out of Space Condition
All systems maintain at least 10% free capacity at all times

PSM 27 July 2008
Practical Software and Systems Measurement
Workshop Title

PSM 28 July 2008
Practical Software and Systems Measurement
Workshop Participants

PSM 29 July 2008
Practical Software and Systems Measurement
Summary
PSM 30 July 2008
Practical Software and Systems Measurement
Conclusions, Recommendations,
and Results

PSM 31 July 2008
Practical Software and Systems Measurement
Next Steps/Action Items
Recommended