Original A r t i c l e
Pixel Value Modification Using RVG-4 Automatic
Exposure Compensation for Instant High-Contrast Images
Yoshihiko H A Y A K A W A , Ph.D., Al lan G.FARMAN, B.D.S, Ph.D., D.Sc.,
Wil l iam C.SCARFE, B.D.S, M.S. and Kinya KUROYANAGI, D.D.S, Ph.D.*
Division of Radiology and Imaging Sciences, School of Dentistry, The University of Louisville, Kentucky, USA
*Dept. of Oral and Maxillofacial Radiology, Tokyo Dental College, Chiba, Japan
(Received : Oct. 25, 1995, Revison received : Jan. 17, 1996, Accepted: Jan. 31, 1996)
Key Words : Dental Radiography, Digital image processing, CCD--based intraoral radiographic system
The RVG 4 permits automatic exposure compensation (AEC). The purpose of this investigation was
to determine the effects of AEC on image contrast. Images were made either with or without a dental
QA jaw phantom using a fixed image projection geometry. Exposures were 6.3 through 27.3/zC/kg using
an X ray generator operated at 70 kVp. Region of interest pixel value distributions were measured at
tissue thicknesses in this phantom, and the average pixei values and signal-to-noise ratios (SNR) were
calculated. The use of AEC without an object in place resulted in a disproportionate relationship
between pixel value and exposure with a marked reduction in SNR. The use of AEC on under- and over
-exposed images of the phantom simultaneously enhanced image contrast and reduced SNR. Thus, AEC
provides a convenient and quick method for achieving high contrast images with sub optimal exposures,
however, this could lead to inappropriate patient dosages if the function is used for over-exposed images.
AEC reduces the SNR and produces disproportionate pixel values relative to exposure.
Oral Radiol. Vol.12 No.1 1996 (11~17)
I n t r o d u c t i o n
Digital image data can be t rea ted using a
number of a lgori thms to enhance image quaf-
ity. While this is usual ly accomplished after
display of the original image, specific pre-
display processing may also be used. Cur-
rent ly avai lable in t raora l CCD based and
storage phosphor digital radiographic sys-
tems provide var ious facilities for digital
image processing. 1-3)
Linear cont ras t enhancement occurs
when the relat ionship between the exposure
and gray level representa t ion is altered pro-
port ionately. As an example, the "X func-
t ion" provided by the RVG-32000 (Trophy
Radiologie, Vincennes, France) performed a
11
specific window operation to increase the
visual differences between gray levels, there-
by increasing contrast? )
Non-linear or logarithmic contrast en-
hancement involves disproportionate manipu-
lation of pixel values, particularly in low
pixel value ranges to highlight small differ-
ences and achieve images with optimal den-
sity and contrast? ) The VIXA 2 (Gendex
Dental Systems srl, Milan, Italy) display pro-
vides the observer with images pre-processed
using this function. 6) Gamma correction is a
complicated non-linear enhancement affect-
ing the overall histogram of an image prefer-
entially acting on low pixel values, spreading
them evenly over the entire range of values
(usually 256) to provide optimal visual
discernment. 7) Computed Dental Radiogra-
phy (Schick Technologies Inc., Long Island
City, NY, USA) refers to this function as
"equalization". However, the effect of this
function on image contrast has not been
previously described, s)
The RVG-4 is a CCD-based intraoral
radiographic system recently developed by
Trophy Radiologie. The proprietary soft-
ware provided with the RVG-4 has an auto-
matic exposure compensation (AEC) function
algorithm which produces a high-contrast
image irrespective of exposure. This func-
tion is found in the setup program in the
WINDOWS version software, 9) and the
default may be set to "on" or "off". Features
of this function on image contrast, though
probably non linear, have not been previous-
ly described. Ideally the function should
change not only image contrast but also the
signal to noise ratio (SNR). SNR is, how-
ever, usually exposure-dependent.
The aim of this study was to investigate
the effect of AEC on image contrast and
SNR.
12
Materials and Methods
CCD-based intraoral imaging system The RVG-4, incorporating the RVG-
STV PC WINDOWS Version 1.1a software
was used. The sensor active surface is larger
than for previous RVG generations ; the sen-
sor has a 29.8 mm x 19.8 mm sensitive area
and a 768 x 512 pixel matrix. Each pixel size
is 39 • 39/zm. The image is captured by the
sensor and its distributed electrostatic inten-
sities are converted to digital data. The size
of the RVG-4 image file is 418,752 bytes
without image compression.
X-ray generator The X ray generator used was an Irix 70
(Trophy Radiologie). The tube voltage was
70 kVp and the tube current was 8 mA.
Beam filtration was 2.5 mm Al-equivalent.
The exposure time was set at intervals in the
range of 0.02 to 0.24 s. The distance from
the focal spot to the cone tip was 20 cm. The
intraoraI sensor was set at 5 cm and 30 cm
from the cone tip.
Image contrast and SNR measurement
Images at various exposures were made
either with no object present or using a dental
QA jaw phantom (Model 501 jaw phantom,
Radiation Measurements Inc., Middleton, WI,
USA).
SNR was determined by selecting the full-
image area as a region of interest with no
object present and measuring the average
pixel value. Standard deviation was deter-
mined as a measure of the noise of each
image. The SNR was calculated as the ratio
of the image forming signal (average pixel
value) to the noise (standard deviation). 1~
The phantom consisted of a portion of a
human maxilla enclosed in tissue-equivalent
plastic. The same plastic (2 cm in thickness)
was located in front of the phantom as a soft-
tissue equivalent attenuator. The total thick-
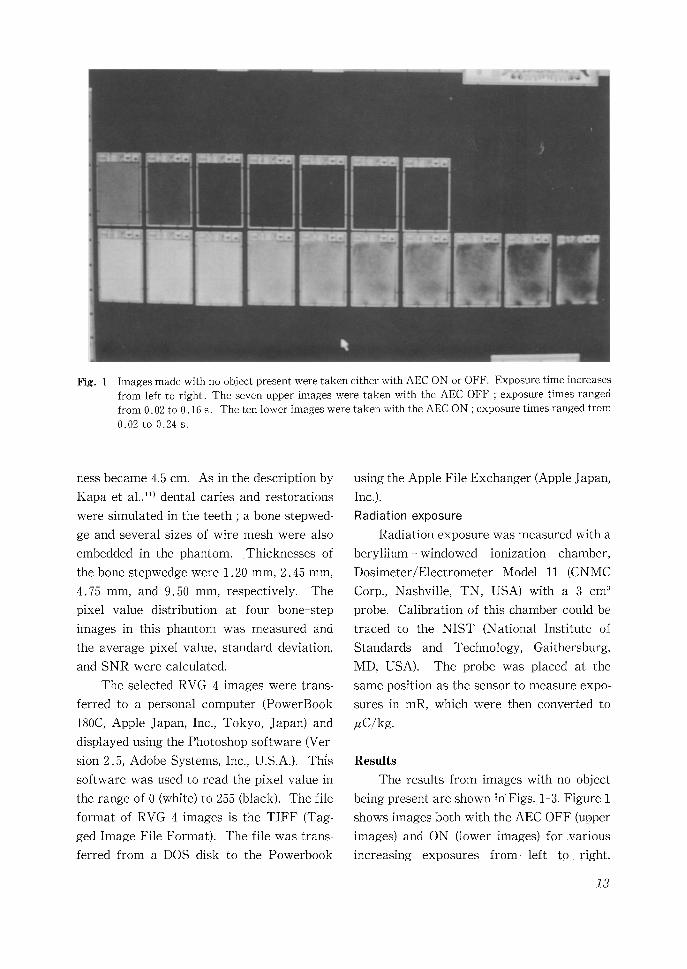
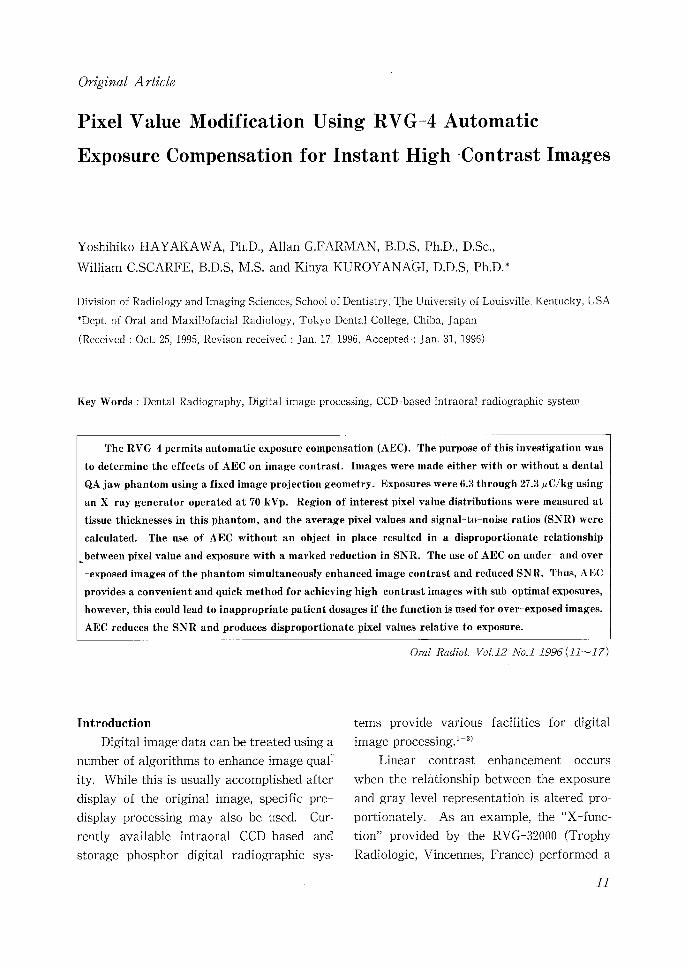
Fig. 1 Images made with no object present were taken either with AEC ON or OFF. Exposure time increases from left to right. The seven upper images were taken with the AEC OFF ; exposure times ranged from 0.02 to 0.16 s. The ten lower images were taken with the AEC ON ; exposure times ranged from 0.02 t o 0.24 s.
ness became 4.5 cm. As in the descr ip t ion by
Kapa et al., n) denta l car ies and r e s to ra t ions
were s imula t ed in the tee th ; a bone s tepwed-
ge and severa l sizes of wire mesh were also
embedded in the phantom. Th icknesses of
the bone s t epwedge were 1.20 ram, 2.45 ram,
4.75 mm, and 9.50 mm, respect ive ly . The
pixel value d is t r ibut ion at four bone step
images in this phan tom was m e a s u r e d and
the ave rage pixel value, s t a n d a r d deviat ion,
and S N R were ca lcula ted .
The se lec ted RVG 4 images were t rans-
fe r red to a personal compute r (PowerBook
]80C, Apple Japan, Inc., Tokyo , Japan) and
displayed using the Photoshop s o f t w a r e (Ver-
sion 2.5, Adobe Sys tems, Inc., U.S.A.). Th{s
so f tware was used to r ead the pixel value in
the range of 0 (white) to 255 (black). The file
f o rma t of RVG-4 images is the T I F F (Tag-
ged Image Fi le Format ) . The file was t rans-
fe r red f rom a DOS disk to the P o w e r b o o k
using the Apple Fi le Exchange r (Apple Japan,
Inc.).
Radiation exposure
Radia t ion exposu re was measured wi th a
bery l l ium - windowed ioniza t ion chamber ,
D o s i m e t e r / E l e c t r o m e t e r Model 11 (CNMC
Corp., Nashvi l le , TN, USA) with a 3 cm 3
probe. Ca l ib ra t ion of this chamber could be
t r aced to the N I S T (Nat iona l Ins t i tu te of
S t a n d a r d s and Technology, Gai thersburg ,
MD, USA). The probe was p laced at the
same posi t ion as the sensor to measure expo-
sures in mR, which were then conver ted to
~ C / k g .
Resul ts
The resul t s f rom images with no object
being present a re shown in ~ Figs. 1-3. F igure 1
shows images bo th wi th the AEC O F F (upper
images) and ON (lower i m a g e s ) f o r v a r i o u s
increas ing exposures f r o m left t o right.
13
250
200
>
100 x
50
/ r
' w ' , , /
i i I ,
0 10 30
T i I i ~ i
20
Exposure C/k 9)
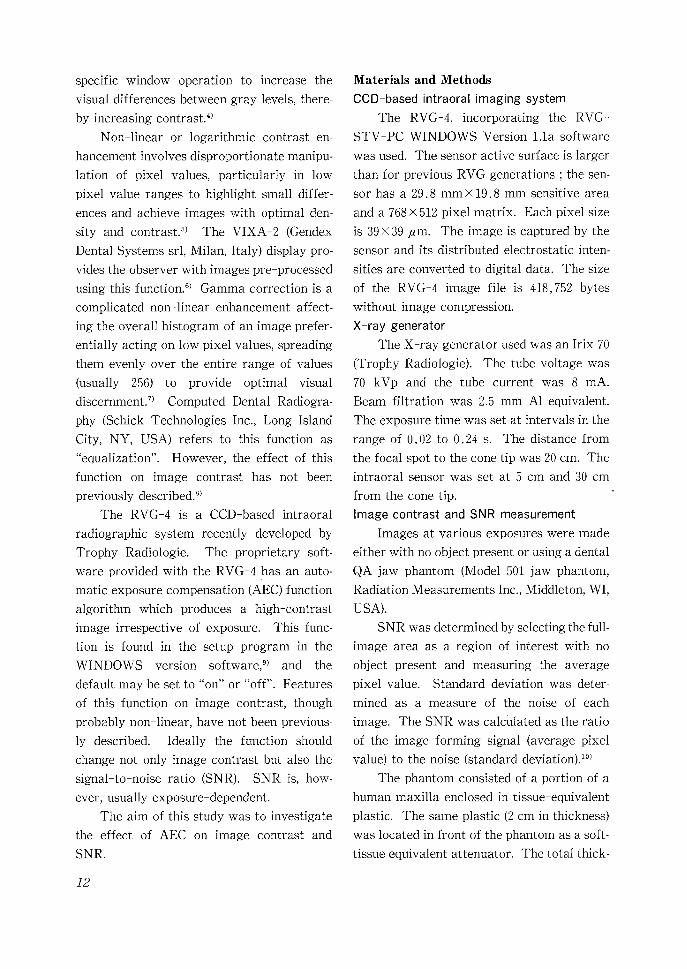
Fig. 2 The relationship between exposure and the average pixel value calculated from the full imaging area. 0 : AEC ON, �9 : AEC OFF. Curve fitting of AEC ON data was provided with a 3 polynominal formula. Fitting curve of AEC OFF data was provided with a linear formula : (Pixel value(0-255)) = 2.18• 101 x (Exposure (/~C/kg)) - 1.15 x 101, coeffi- cient of determinance = 0.99
When no object was present , the AEC over-
compensated , resu l t ing in a "ch ickenwi re -
l ike" image.
F igure 2 shows the re la t ionsh ip be tween
exposure and the ave r age pixel value calcu-
la ted f rom the full image a r ea when the
sensor was set 5 cm f rom the cone tip. Wi th
the AEC OFF, the pixel va lues were propor-
t ional to the exposure . Inc reases in pixel
values fo l lowed a curve wi th increases in
exposure wi th the AEC ON.
F igure 3 shows the S N R re la ted to the
ave rage pixel value. Da ta at the lowest
exposure was ob ta ined when the sensor was
set 30 cm f rom the cone tip. Wi th the AEC
OFF, the S N R increased wi th increas ing
pixel values. The SNR, however , was con-
s tan t and decreased s l ight ly at higher p ixel
40
O
30 I D
0 e- 20 I
0 I
r r
0
Fig. 3
A J D
7
50 100 150 200 250
Pixel value /?
The SNR related to the average pixel value calculated from the full imaging area. 0 : AEC ON, �9 : AEC OFF.
values (more than 80) with the AEC ON.
Also, the S N R was much lower wi th the AEC
ON than with it O F F even with low expo-
sures.
The resul ts f rom Q A - p h a n t o m ' s images
are shown in Figs. 4-6. F igure 4 shows
images which were t a k e n both with the AEC
O F F {upper images) and ON (lower images)
a t increas ing exposu res f rom left to right.
When this pha n tom was imaged, the AEC
c lear ly p roduced h igh -c on t r a s t images, irre-
spect ive of the level of exposure. When
under - (far left) and ove r - e xpose d (far right)
images of the p h a n t o m were obtained, the
AEC was ef fec t ive for both under and over-
exposures and c r e a t e d higher con t ras t by
changing re l a t ive p ixe l values.
F igure 5 (a,b) shows the re la t ionship
be tween the exposu re and the ave rage pixel
values ca lcu la t ed f rom four bone - s t ep thick-
nesses when the sensor was set a t a 5 cm in
d i s tance f rom cone tip. Both with the AEC
O F F {Fig. 5 a) and wi th the AEC ON (Fig. 5
14
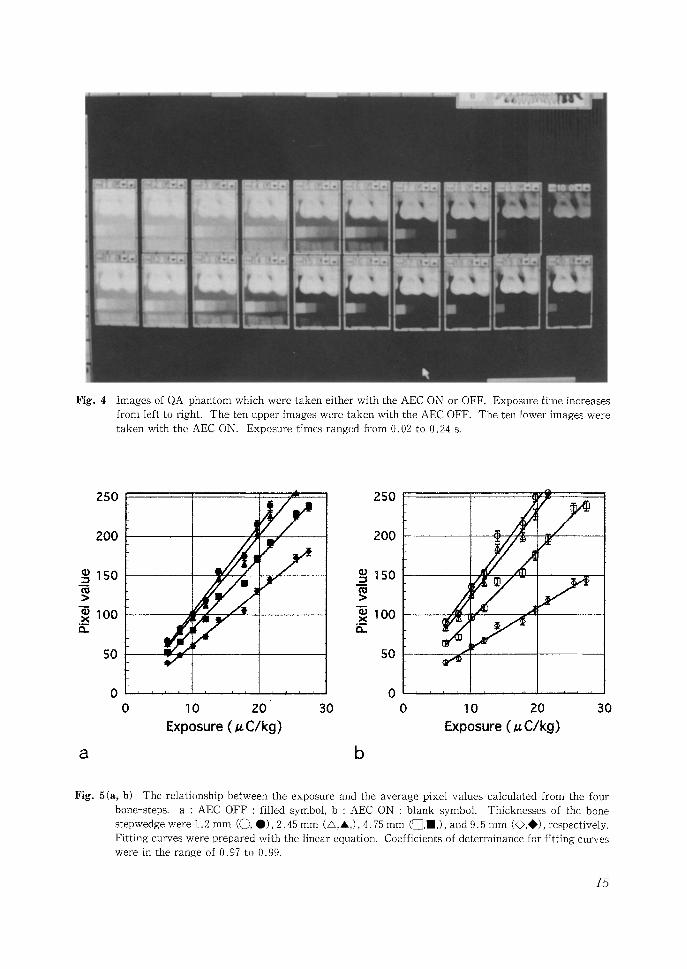
Fig. 4 Images of QA phantom which were taken either with the AEC ON or OFF. Exposure ts increases from left to right. The ten upper images were taken with the AEC OFF. The ten lower images were taken with the AEC ON, Exposure times ranged from 0.02 to 0.24 s.
250
200
150
>
'~ I00 X r~
SO
S /f2
i l l l i l l
10
250
200
150
>
o , i
50
" ' q P' O ' ' '
0 20 30 0 30 Exposure (/~ C/kg)
i i ,~ , E i
10 20
Exposure (/a. C/kg)
a b
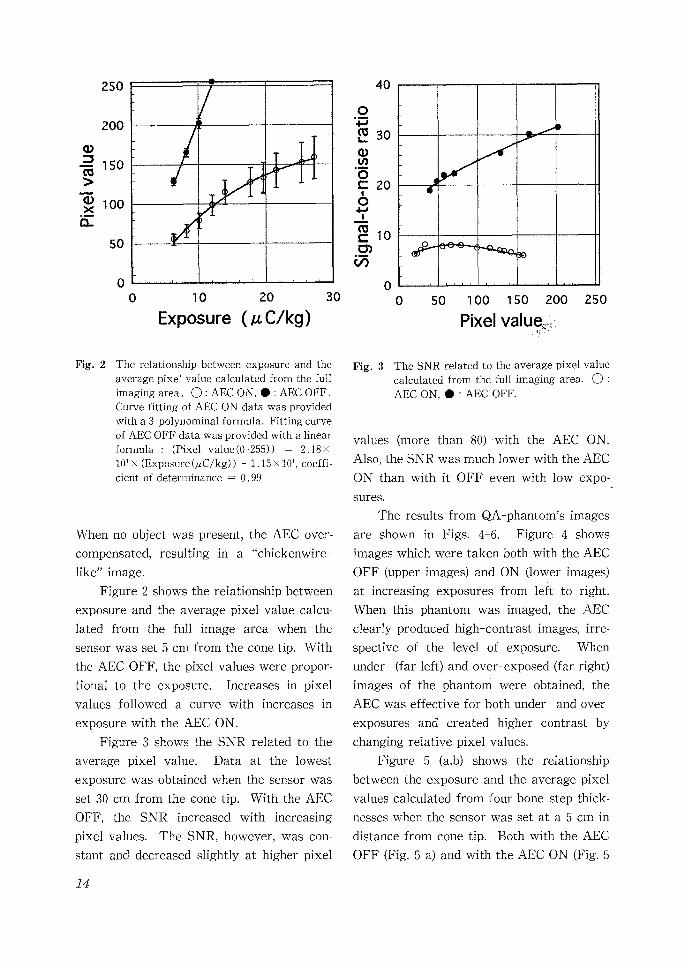
Fig'. 5(a, b) T h e re la t ionship be tween the exposure and the ave rage pixel va lues ca lcula ted f rom the four
bone-s teps , a : AEC OFF : filled symbol, b : AEC ON : b l ank symbol . Th icknesses of the bone s tepwedge were 1.2 m m (O, 0 ) , 2.45 m m ( A , A , ) , 4.75 m m ( [ ] , i , ) , and 9.5 m m (0,0), respectively. Fi t t ing curves were prepared wi th the l inear equat ion. Coeff icients of de t e rminance for f i t t ing curves were in the range of 0.97 to 0.99.
I 5
b), the pixel value increased in proportion to 50
the exposure, except for the darkest step
with the higher exposure. In particular, with .O 40
the AEC ON (Fig. 5 b), the difference in pixel
values between the four steps was increased.
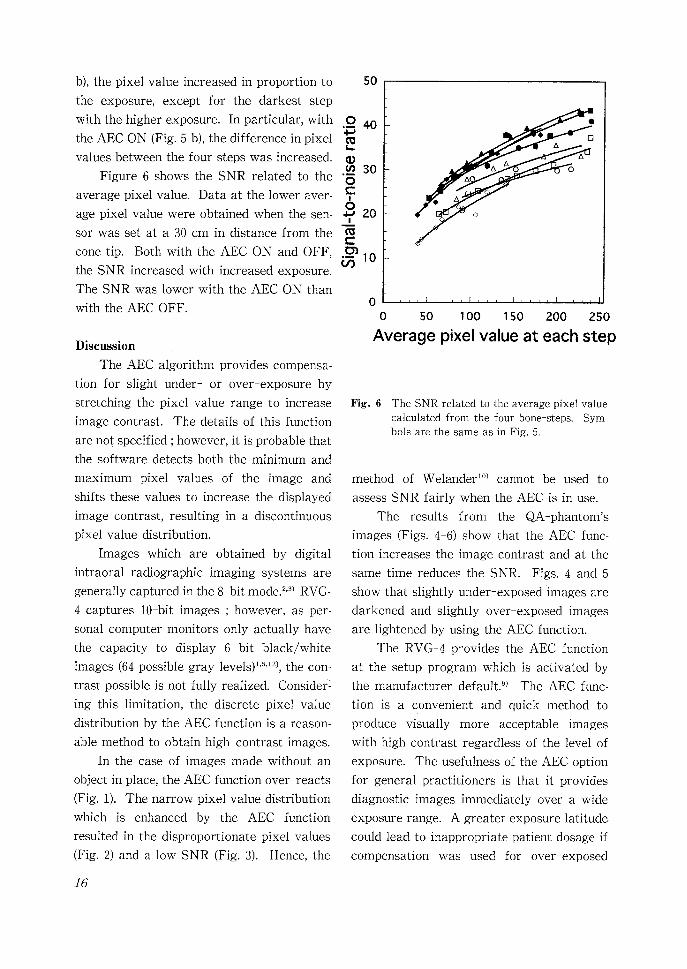
Figure 6 shows the SNR related to the "~ 30
average pixel value. Data at the lower aver- r O
age pixel value were obtained when the sen- -~ 20
sor was set at a 30 cm in distance from the o~ l- cone tip. Both with the AEC ON and OFF, I:~ ~ 1 0 the SNR increased with increased exposure.
The SNR was lower with the AEC ON than
with the AEC OFF.
Discussion
The AEC algorithm provides compensa-
tion for slight under- or over exposure by
stretching the pixel value range to increase
image contrast. The details of this function
are not specified ; however, it is probable that
the software detects both the minimum and
maximum pixel values of the image and
shifts these values to increase the displayed
image contrast, resulting in a discontinuous
pixel value distribution.
Images which are obtained by digital
intraoral radiographic imaging systems are
generally captured in the 8 bit mode. 2'3~ RVG-
4 captures 10-bit images ; however, as per-
sonal computer monitors only actually have
the capacity to display 6 bit black/white
images (64 possible gray levels) 1'~'12~, the con-
trast possible is not fully realized. Consider:
ing this limitation, the discrete pixel value
distribution by the AEC function is a reason-
able method to obtain high-contrast images.
In the case of images made without an
object in place, the AEC function over reacts
(Fig. 1). The narrow pixel value distribution
which is enhanced by the AEC function
resulted in the disproportionate pixel values
(Fig. 2) and a low SNR (Fig. 3). Hence, the
16
~!, A D
0 50 1 O0 150 200 25(
Average pixel value at each step
Fig. 6 The SNR related to the average pixel value calculated from the four bone-steps. Sym- bols are the same as in Fig. 5.
method of Welander 1~ cannot be used to
assess SNR fairly when the AEC is in use.
The results from the OA phantom's
images (Figs. 4-6) show that the AEC func-
tion increases the image contrast and at the
same time reduces the SNR. Figs. 4 and 5
show that slightly under-exposed images are
darkened and slightly over-exposed images
are lightened by using the AEC function.
The RVG-4 provides the AEC function
at the setup program which is activated by
the manufacturer default? ) The AEC func-
tion is a convenient and quick method to
produce visually more acceptable images
with high contrast regardless of the level of
exposure. The usefulness of the AEC option
for general practitioners is that it provides
diagnostic images immediately over a wide
exposure range. A greater exposure latitude
could lead to inappropriate patient dosage if
compensation was used for over exposed
images.
The biggest potential problem with this
feature is that users may "pre-set" exposure
at a higher level than necessary and rely on
the AEC function to compensate disparate
images. Consequently, the patient might
receive a higher radiation dose than other-
wise necessary.
By comparison, the equalization of the
Computed Dental Radiography system per-
mits compensation only for low exposures by
stretching the pixel value range, and this
results in increased image contrast of under-
exposed images, s) It does not, however, com-
pensate for over exposure.
Similar functions are incorporated in the
software of other digital intraoral radiogra-
phic systems. The Dental Link system
(EScan Inc., Santa Rosa, CA, USA) provides
an equalize function to increase the register
number of a pixel to produce a brighter
image, TM and this operates optimally on over-
exposed images, functioning in reverse of the
CDR's equalization. The DIGORA system
(Orion Corp. Soredex, Helsinki, Finland) pro-
vides an automatic grayscale adjustment set-
up which sets the brightness and contrast to
"ideal" values? 4) If images are consistently
too dark or too bright, they can be adjusted
by a correction factor ; namely, a positive
percentage increases the brightness, and a
negative percentage decreases it. This is a
two-way function similar to that installed as
the AEC in the RVG-4.
The purpose of the AEC function of the
RVG-4 is to provide users a means of imme-
diate compensation of the displayed image
for under- and over-exposed images rather
than to simply increase the exposure latitude
of the system. In conclusion, both under and
over-exposed images are compensated by
using the AEC function. The AEC, however,
reduces the SNR and the pixel value changes
are not proportional to exposure.
References
1 ) Wenzel, A_ and Or0ndahl, H.-G. : Direct digital radi-
ography in the dentaI office. Ink Dent. J. 45 : 27-34,
1995 2 ) Farman, A.G. and Scarfe, W.C. : Pixel perception and
voxel vision: Constructs for a new paradigm in maxil-
lofacial imaging. Dentomaxillofac. Radiol. 23 : 5 9, 1994
3) Kuroyanagi, K and Hayakawa, Y. : New digital
iifmging system for intraoral radiography. ]. ]pn.
Dent. Assoc. 47 : 129-140, 1994 (in Japanese)
4 ) MQuyen, F., Benz, C., Sonnabend, E. and Lodter, J.P. :
Presentation and physical evaluation of RadioVisio
Graphy. Oral Surg. Oral Med. Oral Pathol. 68 : 238-
242, 1989
5 ) Molteni, R. : Direct digital dental X ray imaging with
Visualix/VIXA. Oral Surg. Oral Med. Oral Pathol. 70
: 235-243, 1993
6 ) Hayakawa, Y., Farman, A.G., Scarfe, W.C., Kur-
oyanagi, K. and Molteni, R. : Beam quality and image
contrast with VIXA-2. Oral Radiol. 11 : 31 36, 1995
7) Molteni, R. : An improved mode to display images
from a digital X-ray sensor. Dentomaxillofac. Radiol.
24 : 96-97, 1995
8 ) Farman, A.G., Scarfe,W.C., Schick, D.B. and Rumack,
P.M. : Computed Dental Radiography : Evaluation of
a new CCD-based intraoral radiographic system.
Quintessence Int. 26 : 399-404, 1995
9 ) RVG 4 User's manual for W~ndows software Vet. 1.1a. 1995, Trophy Radiology, Inc., Marietta, GA,
USA.
Welander, U., Nelvig, P., Tronje, G., McDavid, W.D,
Dove, S.B., MCirner, A.-C. and Cederlund, T. : Basic
technical properties of a system for direct acquisition
of digital intraoral radiographs_ Oral Surg. Oral Med. Oral PathoI. 75 : 506-516, 1993
Kapa, S.F., Tyndall, D.A. and Ouellette, T.E. : The
application of added beam filtration to intra oral
radiography. Dentomaxillofac. Radiol. 19 : 67 74, 1990
Pass, B., Furkart, A.J., Dove, S.B, McDavid, W.D. and
Gregson, P.H. : 6-bit and 8-bit digital radiography for
detecting simulated periodontal lesions. Oral Surg. Oral Mad. Oral Pathol. 77 : 406-411, 1994
Dental Link for Windows Vet. 3.0 User's Guide. 1994,
EScan, Inc., Santa Rosa, CA, USA.
DIGORA operation instructions. 1995 Orion Corp. Sor-
edex, Helsinki, Finland.
10)
11)
12)
13)
14)
17

18
Reprint requests to :
Dr. Yoshihiko HAYAKAWA Division of Radiology and Imaging Sciences, School of Dentistry, The University of Louisvill
Louisville, Kentucky, 40292 USA
Recommended