PINAR SÜT 2009 EARNINGS PRESENTATION
April 2010
2
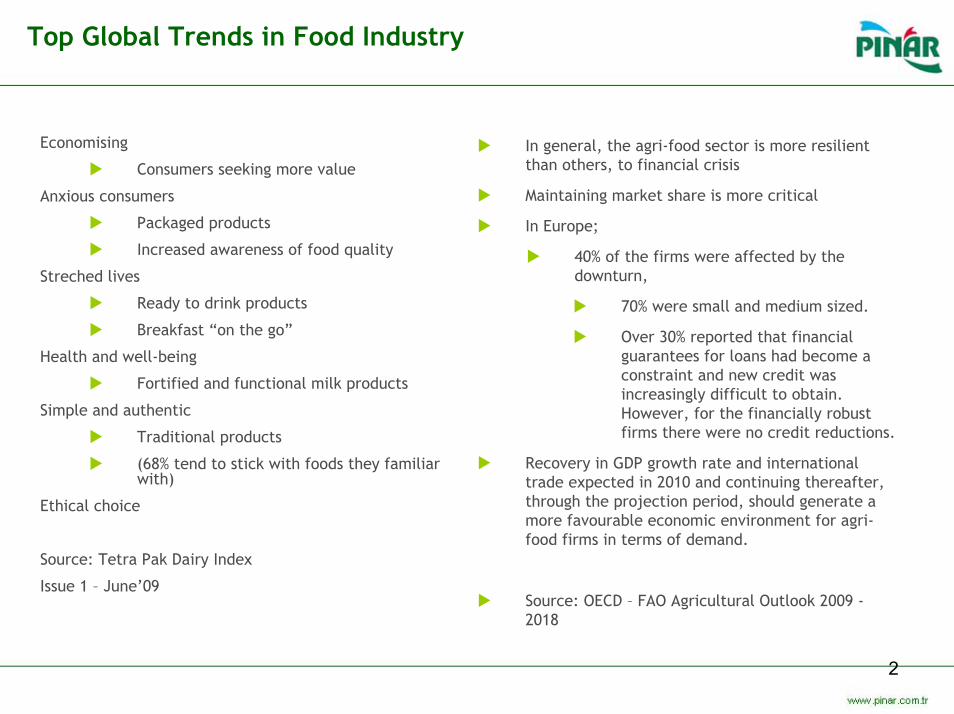
Top Global Trends in Food Industry
Economising
Consumers seeking more value
Anxious consumers
Packaged products
Increased awareness of food quality
Streched lives
Ready to drink products
Breakfast “on the go”
Health and well-being
Fortified and functional milk products
Simple and authentic
Traditional products
(68% tend to stick with foods they familiarwith)
Ethical choice
Source: Tetra Pak Dairy Index
Issue 1 – June’09
In general, the agri-food sector is more resilientthan others, to financial crisis
Maintaining market share is more critical
In Europe;
40% of the firms were affected by thedownturn,
70% were small and medium sized.
Over 30% reported that financialguarantees for loans had become a constraint and new credit wasincreasingly difficult to obtain. However, for the financially robustfirms there were no credit reductions.
Recovery in GDP growth rate and internationaltrade expected in 2010 and continuing thereafter, through the projection period, should generate a more favourable economic environment for agri-food firms in terms of demand.
Source: OECD – FAO Agricultural Outlook 2009 -2018

3
Global Economy-Customer Confidence- FMCG
Macro Indicators – GDP growth
4,2%
-1,1%
3,1%
5,2%
1,7%
4,0% 3,8%
-2,5%
2,9% 4,0%
-4,7%
3,7%
-6%
-4%
-2%
0%
2%
4%
6%
2009 Actual 2010 Forecast 2011 Exp.
World
MiddleEast
EuropeanUnion
Turkey 0
25
50
75
100
125
01.08 04.08 07.08 10.08 01.09 04.09 07.09 10.09 01.10
Real Sector Confience Index
FMCG Total Europe Market Dynamics FMCG Turkey Market Dynamics
Source: IMF, TUIK
Source: Nielsen
Source: TCMB

4
Market Overview
FMCG SEGMENTATION
Turkish FMCG industry continued to grow by 7-8% p.a. in spite of the global economic melt down.
Share of F&B in FMCG sector is increasing.
FMCG AVERAGE 8%
FMCG GROWTH Dairy, meat and water sectors are themain drivers that enlarge F&B sector.
The growth for dairy, meat and water areabove FMCG aveage.

5
Yaşar Group at a glancePioneer in dairy, processed meat and coatings
Initiation dates back to 1945
Core businesses include “Food & Beverage” and “Paint”
One of Turkey’s most important and highly respectedconsumer products groups
Consolidated revenue of approx. 2 bn TL
Six companies listed on ISE, with a market cap of 1 bn. TL
Headquarters located in İzmir
22 companies, 2 foundations, 19 facilities, more than 6.000 employees.
Mottos are ; “My Source for Healthy Living”, “My Source forGood Taste”, “My Source for Innovation”
Prominent in Turkish economy with seven companies rankingamong “Fortune 500” of Turkey
Two brands with strong brand equities: Pınar and Dyo
Widespread distribution network in FMCG market
Joined the UN Global Compact, in 2007

6
Market Leader in Food & Beverages
PINAR; one of Turkey’s “Top 5 Food and Beverages companies hit list”. (Nielsen 2004-2009; excludingalcoholic beverages)
“Pınar” brand is also in the “Top 10 FMCG companies hit list” over the same years (#6 in 2009; Nielsen)
Pınar brand is internationally recognised, especially in the Gulf countries.
Pınar selected as one of “Turkey’s 26 Superbrands” in 2008.(Nielsen)
#1 Turkish brand that comes to mind in the food category. (source: IPSOS KMG - 2009)
One of the most valuable brands in Turkey with an estimated brand value of $802 million (source: BrandFinance-2005)
According to the “Turkey Customer Satisfaction Index”, selected the best brand in milk and meat categories.(source: Kalder-2009/3Q)
One of the top five most trusted brands which consumers feel closest to.
As one of the most valuable Turkish brand, part of the project supported by the Turkish government.
Turquality® is the first and unique branding program in the world supported by Turkish Government in order to create competitive Turkish brands worldwide.
The vision of Turquality® is “Create 10 world brands in 10 years”.

7
Sectors of Pınar Categories Promise High Potential ForGrowth
Food and beverages comprise 19% of GDP in Turkey, as second biggest item.
With Turkey’s large population and the high proportion of income spent on food, approximately 23%, the food industry has attractive growth prospects.
In 2008, the total production capacity of the Turkish food industry reached 127 million mt, while that of beverage industry increased to 13.3 million liters. (invest.gov.tr)
Significant growth potential with 8-9% p.a. on average, with major drivers of this growth including
Increasing per capita food consumption (2007 3,864 TL, 2008 4,416 TL; 14% growth)
Rapid urbanization, young and growing population (1,3% p.a. Growth, 45% of population below 25)
Growing trends towards packaged products for health and hygiene reasons
Increase in the number of working women, leading to an increase in demand for ready meals
Rising education levels, affecting consumption decisions for branded and healthy products
Consumer trends towards value-added and enriched products
Turkey’s accession to the EU and proximity to the Middle East and Europe.
Branded Products: Pınar is ahead of competition on brand recognition, product quality, corporate image and reputation, customer loyalty and consistency of supply
ALO 174 Food Line - For safe food healthy living, since February 2009.
8
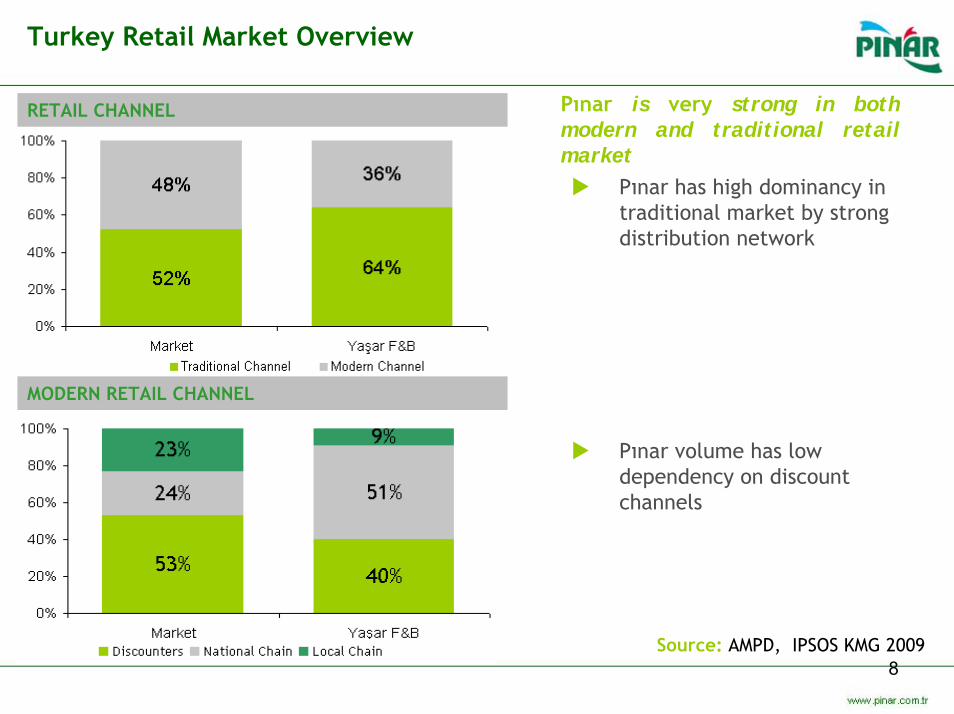
Turkey Retail Market Overview
Pınar is very strong in both modern and traditional retail market
RETAIL CHANNEL
MODERN RETAIL CHANNEL
Pınar has high dominancy in traditional market by strong distribution network
Pınar volume has low dependency on discount channels
Source: AMPD, IPSOS KMG 2009

9
Global Milk Consumption
Global dairy market (US$ 260 bn) growing at 3% p.a.Global supply and demand is not balanced
Production increase 2%; Demand increase 3%

10
2015 Milk Production Projection
USA + Canada1995: 17%2005: 17%2015: 17%
Central-South America1995: 8%
2005: 10%2015: 11%
Growth Steady Diminution
EU 251995: 31%2005: 27%2015: 25%
West-North Africa
1995: 2%2005: 3%2015: 3%
Other AfricanCountries1995: 2%2005: 2%2015: 2%
Indıa + Pakistan
1995: 17%2005: 20%2015: 21%
Other EuropeanCountries1995: 16%2005: 12%2015: 11%
Austria + NewZelland
1995: 4%2005: 4%2015: 4%
China, Japanand Other
AsianCountries1995: 4%2005: 7%2015: 9%

11
Dairy Products Sector In Turkey
MILK PRODUCTION
(Th. tons)
MILK CONSUMPTION
(kg/per capita)
2007 2016 2007 2016
EU (25) 130.167 129.643 75,5 75,7
USA 82.982 92.709 90,9 88,0
TURKEY 10.000 23.000 20,96 38,5
MILK PRODUCTION
(Th. tons)
MILK CONSUMPTION
(kg/per capita)
2007 2016 2007 2016
EU (25) 130.167 129.643 75,5 75,7
USA 82.982 92.709 90,9 88,0
TURKEY 10.000 23.000 20,96 38,5
A market of about 2,5 BTL
About 11-12 million tons of raw milk is producedannualy in our country, 670 million tons in theworld; Turkey as 15th in world league.
Of which;
27% processed by major establishments,
33% handled by SMEs and dairy farms,
20% consumed at the source by theproducers themselves,
20% is sold in unpacked form by streetsellers
(Source : Ministry of Agriculture and RuralAffairs)
Industrialised milk production in EU is 95%.
Source: TEAE, FAPRI
MARKET CONDITIONS
Increasing per capita, but still very low compared toEU (EU=78L; TR=24L),
Trend towards packed dairy goods,
Trend towards value added products,
Economic segment is the first step for thosetransferring from unpacked to packed dairy food.
Increasing share of F&B in FMCG sector
The growth for dairy, meat and water are aboveFMCG avarage

12
Market Trends Towards Packaged Products in Pınar DairyCategories
Dairy packaged market (mik-cheese-yoghurt etc) is consistenly growing by 8% p.a. on average
“Away from Home” market is growing

13
Company History: Pioneer and Leader of Modern TurkishDairy
1975...The first UHT milk andpacked dairy productsplant in Turkey wasfounded (biggest milkproduction facility in theMiddle East): PINAR SÜT
1975 ’80 ’85 ’90 ’95 ’00 ’02 ’04 ’06 ’08 ’09 2010
1997New plant founded in Eskişehir
1978Pınar Sliced Kaşar Cheese and CreamCheese wereintroduced
1980Kraft-Pınar Cooperation wasestablished
1982Milk, cheese, butter, yoghurt amdmilk with tarwberrybegan to be exported theCentral Europeanand Middle East countries and theTRNCyprus.
1983Pınar Fodderwasestablished
1984Production of Labnecheese, honey andmarmelade began. Export of manyproducts to Kuwait, Cyprus and germanybegan.
1985Labne wasintroduced in thedomestic market
1994Light mayonnaisewas introduced
1999Functional milk wasintroduced
2004Pınar Kafela, Karamela and Çikola wereintroduced
---------------
www.pinarmutfagi.comwas established
2005First organic milk in Türkiye, Pınar OrganicMilk,
First prebiotic/probioticproducts, Pınar Prebiotic/ProbioticLight Yoghurts wereintroduced
2001UHT plastic bottledmilk introduced
2007YOPİ
is introduced
2003Agreement withSodima SAS for theproduction of fruityogurt under Yoplaitbrand
2008Six Sigma has been startedto applied for the first time in the F&B sector in Turkey
2008Pınar Kid Milk
is introduced
2009Pınar Lemonade
2010BiscuitflavouredPınar Kido is introduced

14
Company Overview
RELATIVE PERFORMANCE TO ISE-100Listed on Istanbul Stock Exchange, as PNSUT
% 39 of total outstanding shares in free float
Price at April 7,2010 > TL 8,20
Market Cap > TL 369 mn
Paid in Capital > TL 44.951.000
Foreign stake in the free float > 44%
- 20 40 60 80
100 120 140 160 180
Dec-08
Jan-0
9
Feb-09
Mar-09
Apr-09
May-09
Jun-09
Jun-09
Jul-0
9
Aug-09
Sep-09Oct-
09
Nov-09
Dec-09
Dec-09
Jan-1
0
Feb-10
Mar-10
Pınar Başı/Eskişehir Site
• Total area149.976 sqms
• Closed area16.650 sqms
Yaşar Holding
61%
FreeFloat39%Pınar Başı/İzmir Site
• Total area130.118 sqms
• Closed area40.854 sqms

15
Raw Milk Collection
FARMS INDIVIDUAL PRODUCERS
COOLLING CENTERS
COOPS TRADERS
TRANSPORTATIONPROCESSOR
VILLAGES
Substainable, diversified and high quality milk collection
Sectoral know how, strong relations with farmers, high quality milk supply
Raw milk from 321 cooling centers through advanced collection systems twice a day
Implemented an extensive milk collection system from a wide array of milk producers
Continuous quality and control in each step of milk collection
The Company enters into milk supply agreements with its suppliers to ensure a steady raw milk supply

16
Market Position
PRODUCT MARKET SHARE (%)
POSITION
UHT LIGHT MILK 52,2 LEADER
UHT MILK 21,5 LEADER
SPREADABLE CHEESE*Fresh Cheese*Labaneh
36
7754
LEADERLEADERLEADER
ENRICHED MILK (CHILDREN)
39,1 LEADER
ENRICHED MILK (ADULT)
30,7 SECOND
Source: AC Nielsen
Market Share Comparison
Pınar Nearest Competitor

17
Sales and Distribution
UHT MILK YOGURT-YOGURT DRINK CHEESESAUCE-POWDER BUTTER FRUIT JUICEOTHERS
YBP OWNERSHIP STRUCTURE
Yaşar Holding22%
Pınar Süt32% Pınar ET
38%
Other8%
Yaşar Holding Pınar Süt Pınar ET Other
SALES CHANNELS
YBP89%
Export8%
Direct3%
YBP Export Direct

18
Export Success: Target Market Tastes Are Met
• PINAR SÜT realizes 40% of Turkey’s Dairy Product Exports• %45 market share, in the countries it exports to • 26 countries from Middle East to Europe, from U.S.A. To China• Leader in Saudi Arabia and Kuwait with Labaneh Cheese• Target market tastes are met through marketing and packaging• Exports sales increased at 119% from 2003 to 2009 in TL terms
Exports by Countries
45%
16%1%6%11%
5%4%4% 8%
SAUDI ARABIA KUWAIT IRAQT.R.N.C. U.A. EMIRATES BAHRAINAZERBAIJAN QATAR OTHER
21 23 2936 32 36
46
7% 7%9%
7%7%
9,50%
10%
-5
101520253035404550
2003
2004
2005
2006
2007
2008
2009
Export Revenues (TL mn) Share in Total Net Sales

19
Average Raw Milk Prices in Turkey (TL)
0,000 0,100 0,200 0,300 0,400 0,500 0,600 0,700 0,800 0,900
Janu
ary
March
May July
Septem
berNovem
ber
200820092010

20
Notable Participation Value
Yaşar Birleşik Pazarlama Dağıtım Turizm ve Ticaret A.Ş. (YBP)
Ownership %
31.95%
Carrying Value
29.7 M TL
Sales&distribution of Pınar Süt, Pınar Et & other food products
Production and distribution of water and food products in Europe
Carrying Value
2.7 M TL
Ownership %
44.94%Pınar Foods GmbH, Germany
Desa Enerji Elektrik Üretimi Otoprodüktör Grubu
Ownership %
30.52%
Carrying Value
2.6 M TLEnergy&Electric generation in İzmir
Carrying Value
1 M TL
Ownership %
20.00%
Pınar Anadolu Gıda San. ve Tic. A.Ş.
Production of dairy and meatproducts in Yozgat
Production of processed andfrozen meat products- open to public
Carrying Value
24.1M TL
Ownership %
12.58%
Pınar Entegre Et ve Un Sanayii A.Ş.
Carrying Value
7.5 M TL
Ownership %
5.59%
Agribusiness- Feed production, fish, cattle and turkey farming
Çamlı Yem, Besicilik San. ve Tic. A.Ş.
Pınar Su Sanayi ve Ticaret A.Ş. Carrying Value
5.7 M TL
Ownership %
8.81%
Bottling of drinking water andwater products- open to public
21
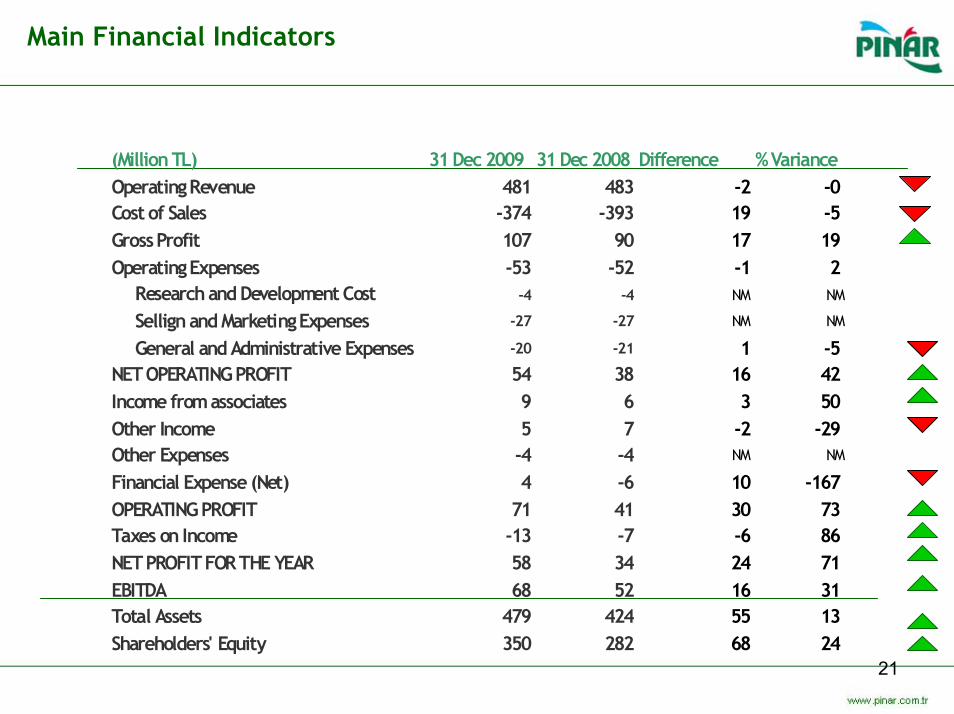
Main Financial Indicators
(Million TL) 31 Dec 2009 31 Dec 2008 Difference % Variance Operating Revenue 481 483 -2 -0 Cost of Sales -374 -393 19 -5 Gross Profit 107 90 17 19Operating Expenses -53 -52 -1 2 Research and Development Cost -4 -4 NM NM
Sellign and Marketing Expenses -27 -27 NM NM
General and Administrative Expenses -20 -21 1 -5 NET OPERATING PROFIT 54 38 16 42Income from associates 9 6 3 50Other Income 5 7 -2 -29 Other Expenses -4 -4 NM NM
Financial Expense (Net) 4 -6 10 -167 OPERATING PROFIT 71 41 30 73Taxes on Income -13 -7 -6 86NET PROFIT FOR THE YEAR 58 34 24 71EBITDA 68 52 16 31Total Assets 479 424 55 13Shareholders' Equity 350 282 68 24

22
Profit Margins
10%
8%
12%
2007 2008 2009
EBIT MARGINS*
13%
11%
15%
2007 2008 2009
EBITDA** MARGINS
20%
19%
22%
2007 2008 2009
GROSS PROFIT MARGINS
9%
7%
12%
2007 2008 2009
NET PROFIT MARGINS
•Does not include other income and expenses
•Earnings before interest, tax, depreciation and amortization

23
Performance Highlights
69.043.661 68.547.735
90.764.373 89.546.899
106.683.286
2005 2006 2007 2008 2009
GROSS PROFIT (TL)
22.189.76728.585.922
39.660.15734.185.215
57.819.468
2005 2006 2007 2008 2009
NET PROFIT (TL)
28.649.865 30.855.559
57.146.45852.154.948
70.866.839
2005 2006 2007 2008 2009
EBITDA (TL)Albeit the economic shortfallgenerated TL 71 mn TL EBITDA with36% increase compared to 2008;
-Diversified product portfolio
-Normalised transportation costs dueto oil prices; decreasing marketing unitprices and OCI-Lean Six Sigma projectsresulted in the decrease of OPEX
CAGR +%11
+%19
CAGR +%27
+%69
CAGR +%25
+%36

24
Key Ratios, Net Financial Debt & NWC
-100
-80
-60
-40
-20
0
20
40
60
80
100Q1 2
008
Q2 200
8Q3 2
008
Q4 200
8Q1 2
009
Q2 200
9Q3 2
009
Q4 200
9(Mn
TL) Trade Receivables
Trade Payables
Inventories
31 Dec 2009 31 Dec 2008Current Ratio 2,14 1,45Leverage Ratio 0,27 0,34ST Fin'al Debt/Total Fin'al Debt 0,27 0,52Net Fin'al Debt/EBITDA 0,24 0,47Total Fin'al Debt/Equity 0,06 0,11
(Mn TL) 31 Dec 2009 31 Dec 2008Cash & Cash Equivalents 3,3 5,3S/T Bank Borrowings 5,6 15,4L/T Bank Borrowings 14,8 14,5Net Financial Debt 17 24,7
Continuous focus on risk managementand efficiency measures
Effective working capital management
Strong balance sheet and liquiditymanagement

25
Investment Highlights
PINAR : Market Leader in Foodand Beverages; Robust Brand
•Best brand in milk and dairyproducts Turkey CustomesSatisfaction Index (2008)
•1st brand that comes to mindin “milk” category
•Among Turkey’s superbrands
•1st consumers feel closest to
•Turquality
Turkish Dairy Market Growth:Growing trends towardspackaged, healthy products,
Increasing # of working women. Demand for ready meals
Trend towards value addedenriched products
State of the art technology:
High quality, hygenic and EU standard production
Efficient procurement structure
%100 traceability from farm to fork
Supplier based perfor. measurement
Sound financial performance
Competitive cost structure
Contiued action on costreduction
Culture of innovation
Wide-spread distribution network
Group synergies

26
Key strategiesMarket driven profitable growth through operational excellence
• PROFITABLE GROWTH through; continuous product differentiation, innovation, improvements in product/package mix
• BRAND EQUITY; by maintaining and improving quality,innovation based on consumer needs, investing in brands and pursueing effective marketing campaigns
• OPERATIONAL EXCELLENCE; driving out costs & simplifying processes by :– Operational Cost Improvement (OCI)– Lean Six Sigma
• RESPONSIBILITY; Corporate governance and identity; corporate socialresponsibility; environment friendly technology

27
2010 Targets
321357
452483 481
590
2005 2006 2007 2008 2009 2010/P*
NET SALES (TLmn)
29 31
5752
71 75
2005 2006 2007 2008 2009 2010/P*
EBITDA (TLmn)
8
24 22
17
6
32
2005 2006 2007 2008 2009 2010/P*
CAPITAL EXPENDITURES (TLmn)
Focus on profitable and sustainablegrowth and brand equity
*Projected

28
Marketing Campaigns
Major campaigns in 2009 & 2010 :
“Pınar Beyaz”
”Pınar Kido”
“Pınar Çocuk”
All product categories are among high revenue and high margin generators, Recent Market shares in these categories*.
Continuous marketing campaigns focused on value added,profitable and strategic categories.
*Source: Nielsen-August 2009

29
Marketing - New Launches & Product Differentiation
We have launched several SKU’s and lifted our face in key categories.
Product differentiation:
Tactical packaging
New package designs
New Launches:
Pınar Lemonade
Pınar Kido with Biscuit

30
Pınar Çocuk Interactive Campaign won Mediacat FelisAward
MCI (MediaCat Communication Institute) FelisAward is a sectoral incentive to support creativeand effective media planning and execution.
Pınar Çocuk interactive campaign won the award in Women target category.
Campaign web site was designed to let individualsto download their pictures to create their ownPınar Çocuk
Commercial and share via email or sms.
Selected commercials aired on TV as well.
31
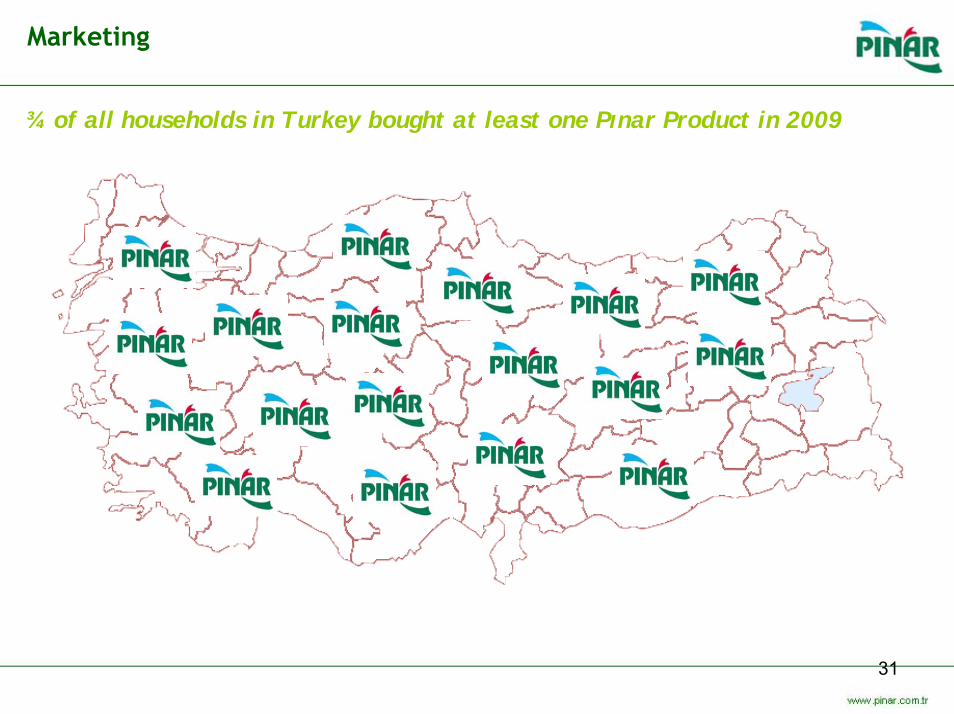
Marketing
¾ of all households in Turkey bought at least one Pınar Product in 2009

32
YBP – Yaşar Birleşik Pazarlama A.Ş.
The biggest food sales & distribution network in Turkey
Specialised in one-way, packaged, high-quality, fast moving consumer goods
Approximately TL 1.000 Mn/year turnover, 1000 employees with 7 profit centers
134 distributors with warehouses covering all over Turkey in addition to direct salesteam in major cities
Having a distribution team fleet of 650 vehicles
6 distribution centers in major cities, each with +4C, -18C and dry storage facilities
Approximately 155.000 points of sale covered
Responsible for the sales and distribution of Nutella, Kinder and Bueno products(brands of Italian chocolate giant Ferrero), since 2004.

33
Sales & Distribution
Turkey’s biggest nationwide cold & frozen distribution chain
Strategically located distribution network throughout Turkey, by latest technology and flexible organisation; over 155.000 sales points, 1.200 salespeople, 350 distributors.
District OfficesDirectorate HQ Dealers

34
Disclaimer
This presentation does not constitute an offer or invitation to purchase orsubscription for any securities and no part of it shall form the basis of or be relied upon in connection with any contract or commitment whatsoever.This presentation contains forward-looking statements that reflect thecompany management’s current views with respect to certain future events. Although it is believed that the expectations reflected in these statementsare reasonable, they may be affected by a variety of variables and changesin underlying assumptions that could cause actual results to differmaterially. Neither Pınar Et nor any of its affiliates, advisors, representatives, directors, managers or employees nor any other personshall have any liability whatsoever for any loss arising from any use of thispresentation or its contents or otherwise arising in connection with it.
Company’s financial statements are available on www.imkb.gov.tr andwww.pinar.com.tr/investorrelations websites.
Recommended