Embed Size (px)
Citation preview
0
«Engineering Retail»
MAY 2015 – LONDON VISIT
1
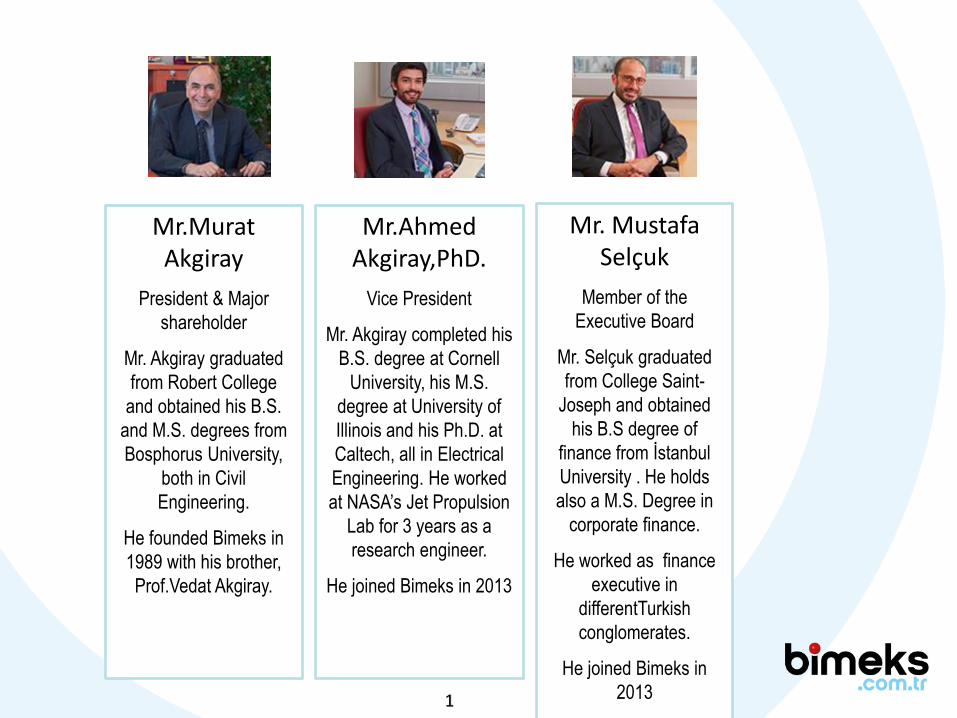
Mr.Murat Akgiray
President & Major
shareholder
Mr. Akgiray graduated
from Robert College
and obtained his B.S.
and M.S. degrees from
Bosphorus University,
both in Civil
Engineering.
He founded Bimeks in
1989 with his brother,
Prof.Vedat Akgiray.
Mr. Mustafa Selçuk
Member of the
Executive Board
Mr. Selçuk graduated
from College Saint-
Joseph and obtained
his B.S degree of
finance from İstanbul
University . He holds
also a M.S. Degree in
corporate finance.
He worked as finance
executive in
differentTurkish
conglomerates.
He joined Bimeks in
2013
Mr.Ahmed Akgiray,PhD.
Vice President
Mr. Akgiray completed his
B.S. degree at Cornell
University, his M.S.
degree at University of
Illinois and his Ph.D. at
Caltech, all in Electrical
Engineering. He worked
at NASA’s Jet Propulsion
Lab for 3 years as a
research engineer.
He joined Bimeks in 2013
2
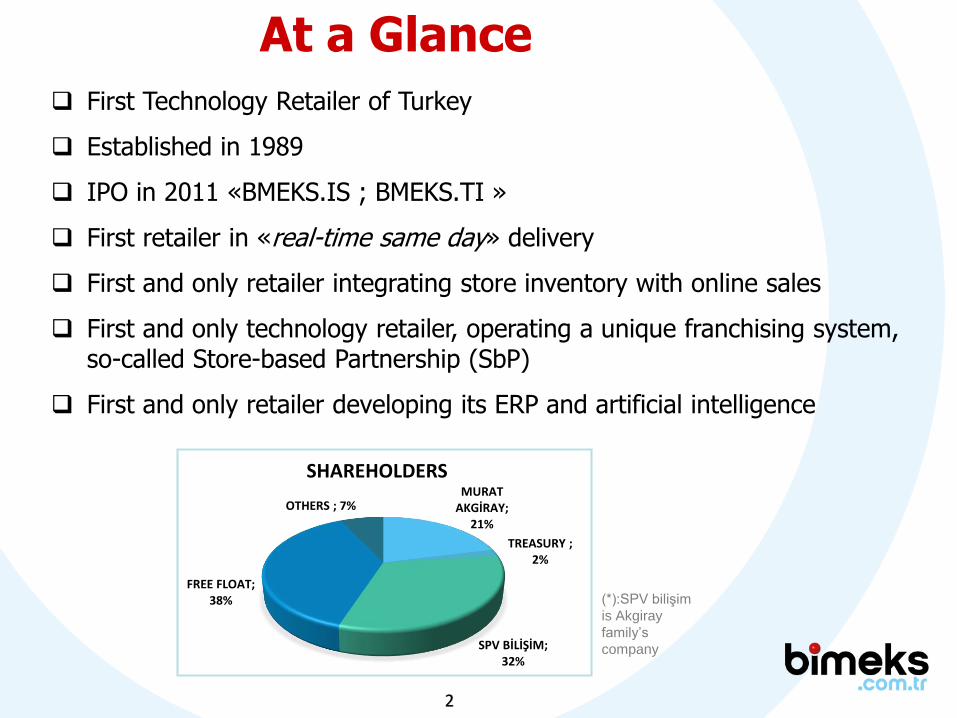
At a Glance
First Technology Retailer of Turkey
Established in 1989
IPO in 2011 «BMEKS.IS ; BMEKS.TI »
First retailer in «real-time same day» delivery
First and only retailer integrating store inventory with online sales
First and only technology retailer, operating a unique franchising system, so-called Store-based Partnership (SbP)
First and only retailer developing its ERP and artificial intelligence
MURAT AKGİRAY;
21%
TREASURY ; 2%
SPV BİLİŞİM; 32%
FREE FLOAT; 38%
OTHERS ; 7%
SHAREHOLDERS
(*):SPV bilişim
is Akgiray
family’s
company
3
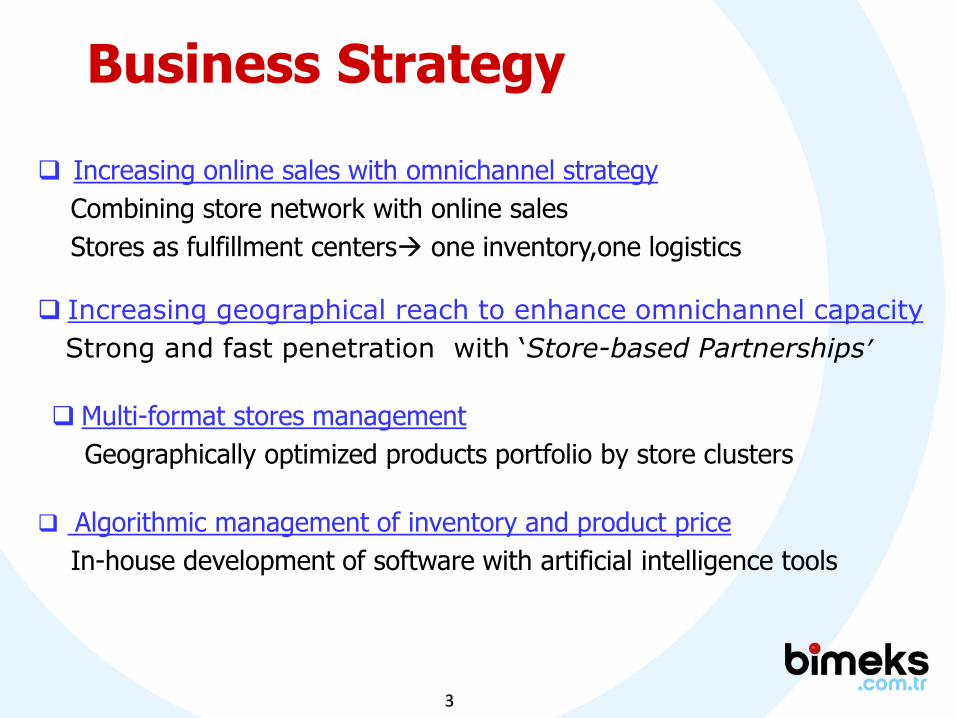
Increasing online sales with omnichannel strategy
Combining store network with online sales
Stores as fulfillment centers one inventory,one logistics
Increasing geographical reach to enhance omnichannel capacity
Strong and fast penetration with ‘Store-based Partnerships’
Multi-format stores management
Geographically optimized products portfolio by store clusters
Business Strategy
Algorithmic management of inventory and product price
In-house development of software with artificial intelligence tools
4
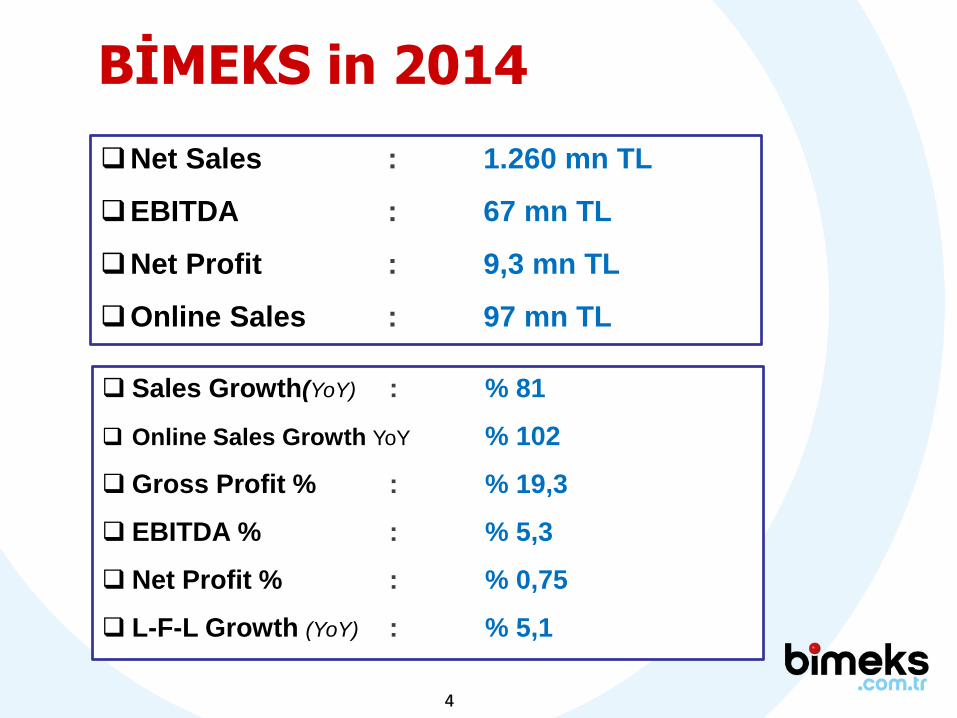
Net Sales : 1.260 mn TL
EBITDA : 67 mn TL
Net Profit : 9,3 mn TL
Online Sales : 97 mn TL
Sales Growth(YoY) : % 81
Online Sales Growth YoY % 102
Gross Profit % : % 19,3
EBITDA % : % 5,3
Net Profit % : % 0,75
L-F-L Growth (YoY) : % 5,1
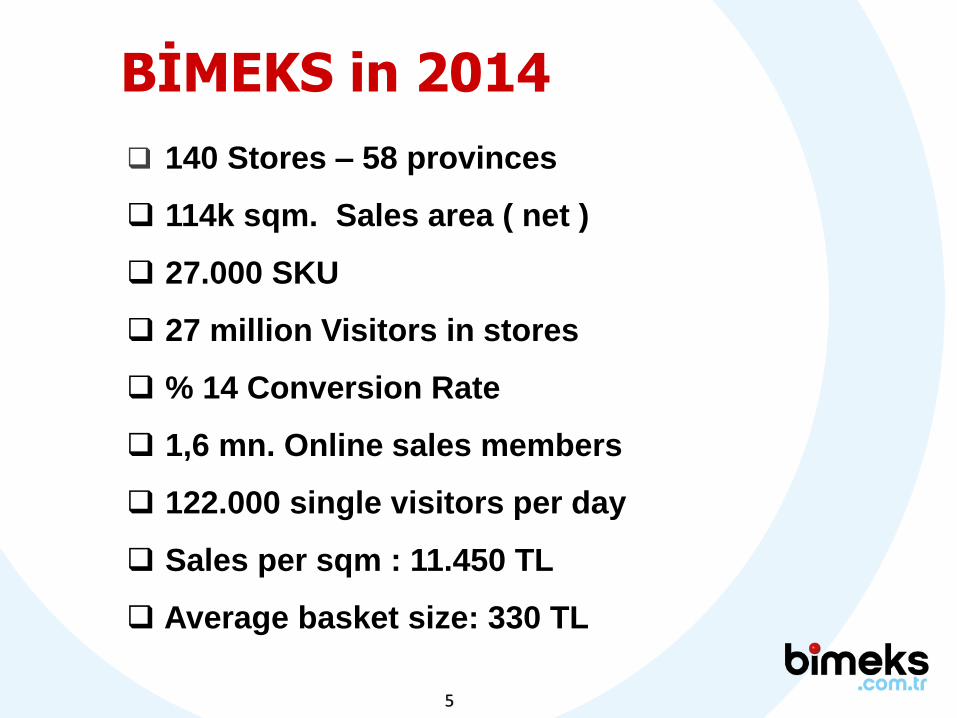
BİMEKS in 2014
5
140 Stores – 58 provinces
114k sqm. Sales area ( net )
27.000 SKU
27 million Visitors in stores
% 14 Conversion Rate
1,6 mn. Online sales members
122.000 single visitors per day
Sales per sqm : 11.450 TL
Average basket size: 330 TL
BİMEKS in 2014
6
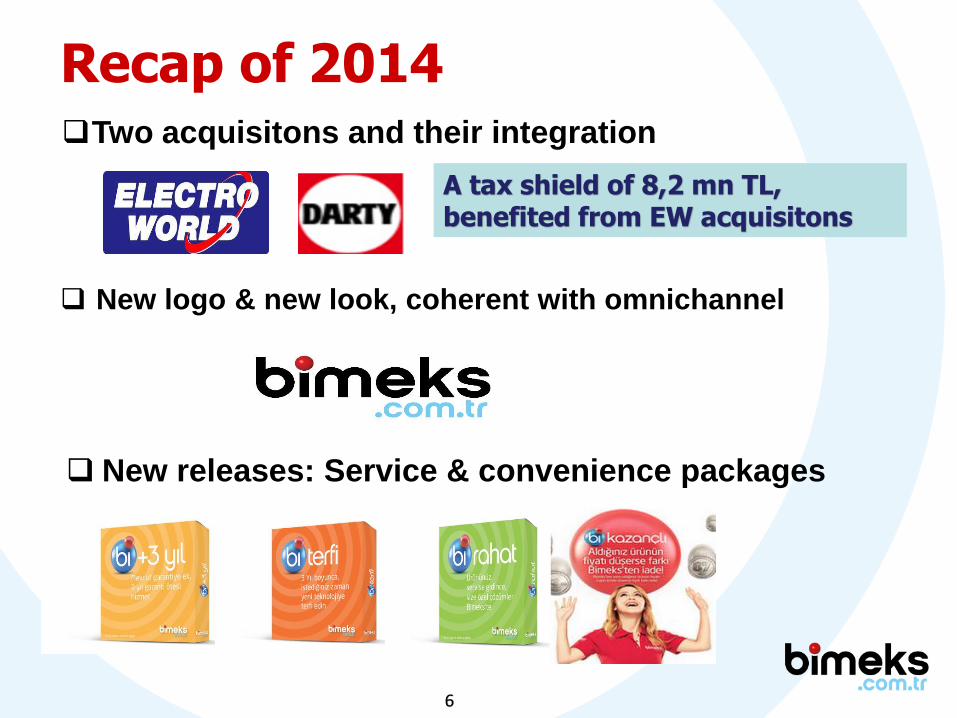
Two acquisitons and their integration
New logo & new look, coherent with omnichannel
New releases: Service & convenience packages
A tax shield of 8,2 mn TL, benefited from EW acquisitons
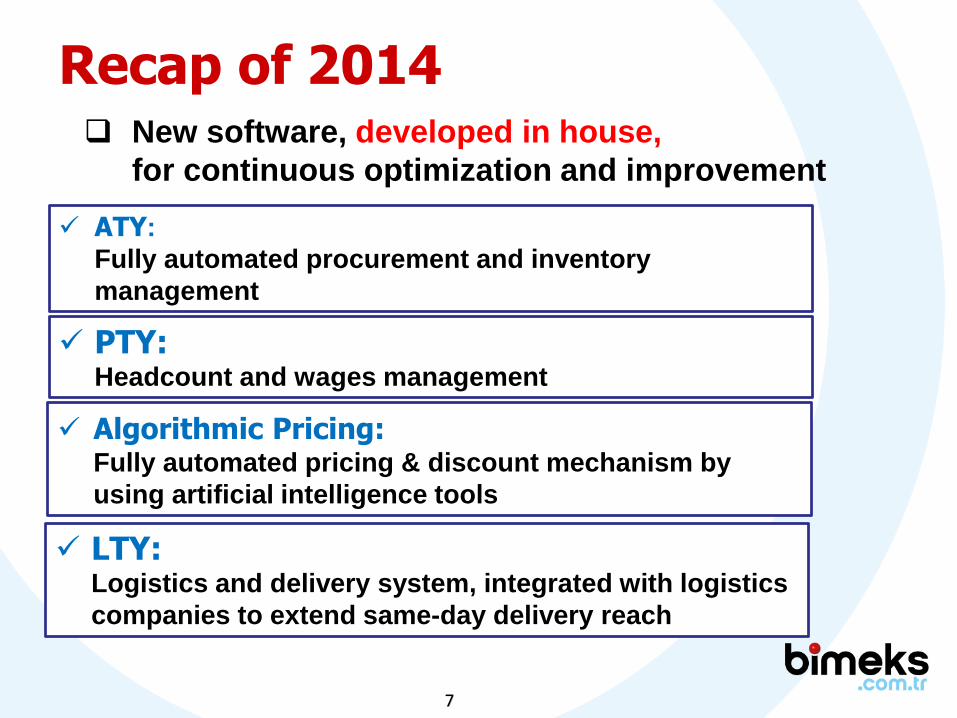
Recap of 2014
7
New software, developed in house,
for continuous optimization and improvement
ATY:
Fully automated procurement and inventory
management
PTY: Headcount and wages management
Algorithmic Pricing:Fully automated pricing & discount mechanism by
using artificial intelligence tools
LTY:Logistics and delivery system, integrated with logistics
companies to extend same-day delivery reach
Recap of 2014
8
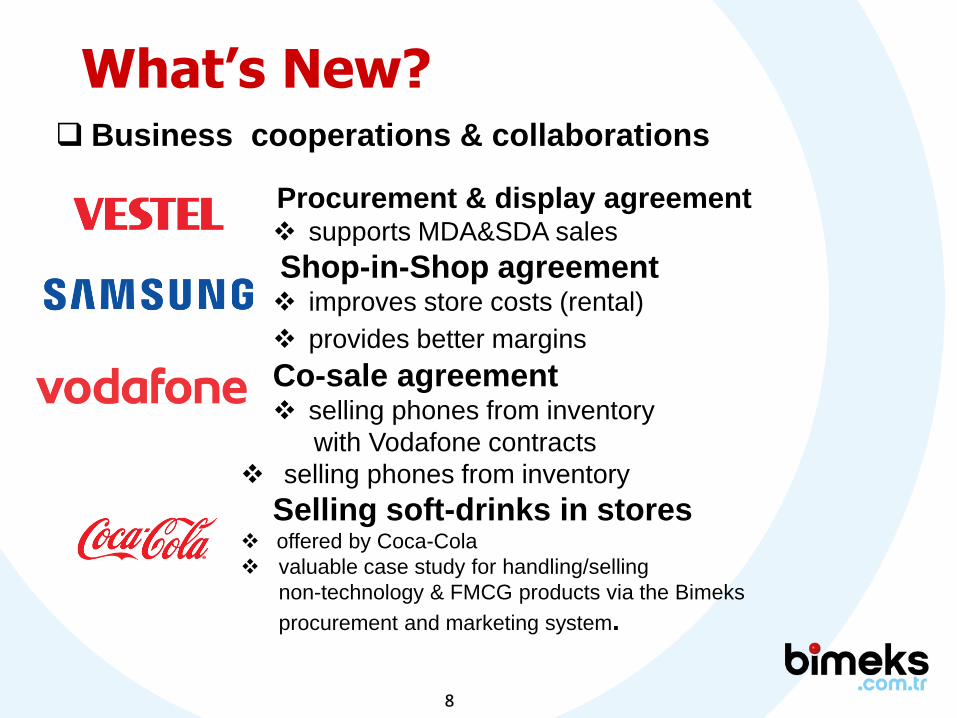
What’s New?
Procurement & display agreement supports MDA&SDA sales
Shop-in-Shop agreement improves store costs (rental)
provides better margins
Co-sale agreement selling phones from inventory
with Vodafone contracts
selling phones from inventory
Selling soft-drinks in stores offered by Coca-Cola
valuable case study for handling/selling
non-technology & FMCG products via the Bimeks
procurement and marketing system.
Business cooperations & collaborations
9
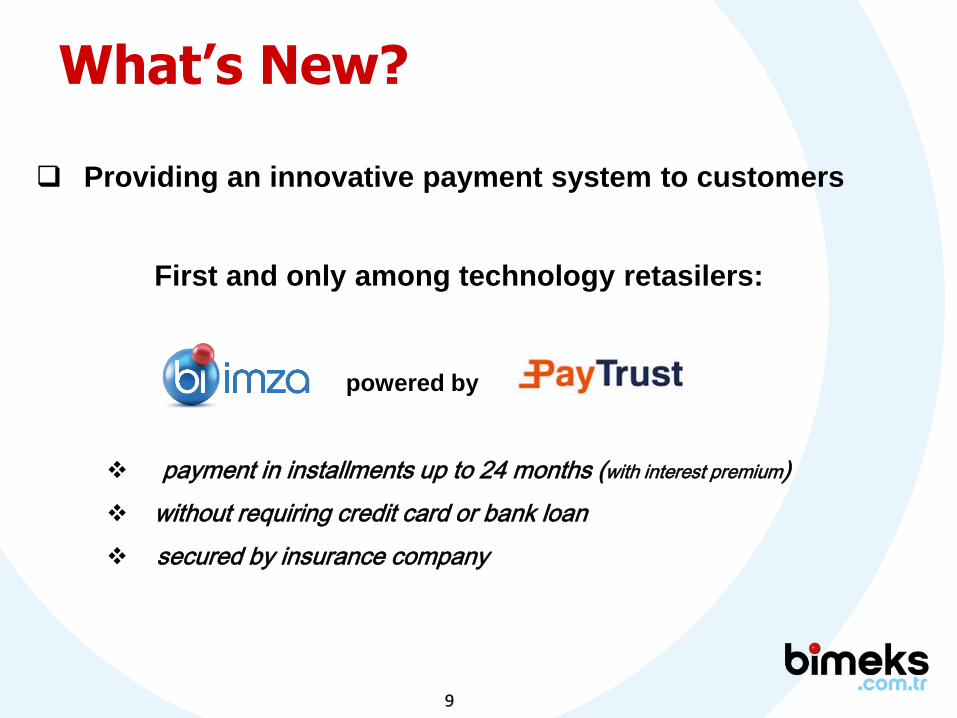
Providing an innovative payment system to customers
First and only among technology retasilers:
powered by
payment in installments up to 24 months (with interest premium)
without requiring credit card or bank loan
secured by insurance company
What’s New?
10
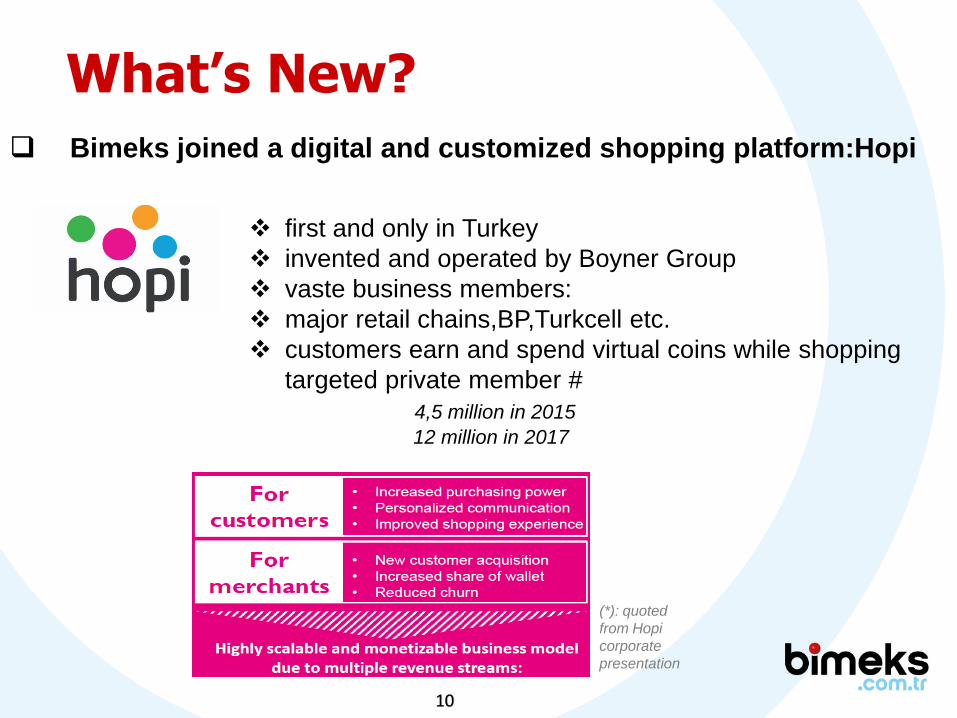
What’s New?
Bimeks joined a digital and customized shopping platform:Hopi
first and only in Turkey
invented and operated by Boyner Group
vaste business members:
major retail chains,BP,Turkcell etc.
customers earn and spend virtual coins while shopping
targeted private member #
4,5 million in 2015
12 million in 2017
(*): quoted
from Hopi
corporate
presentation

11
M A R K E T
12
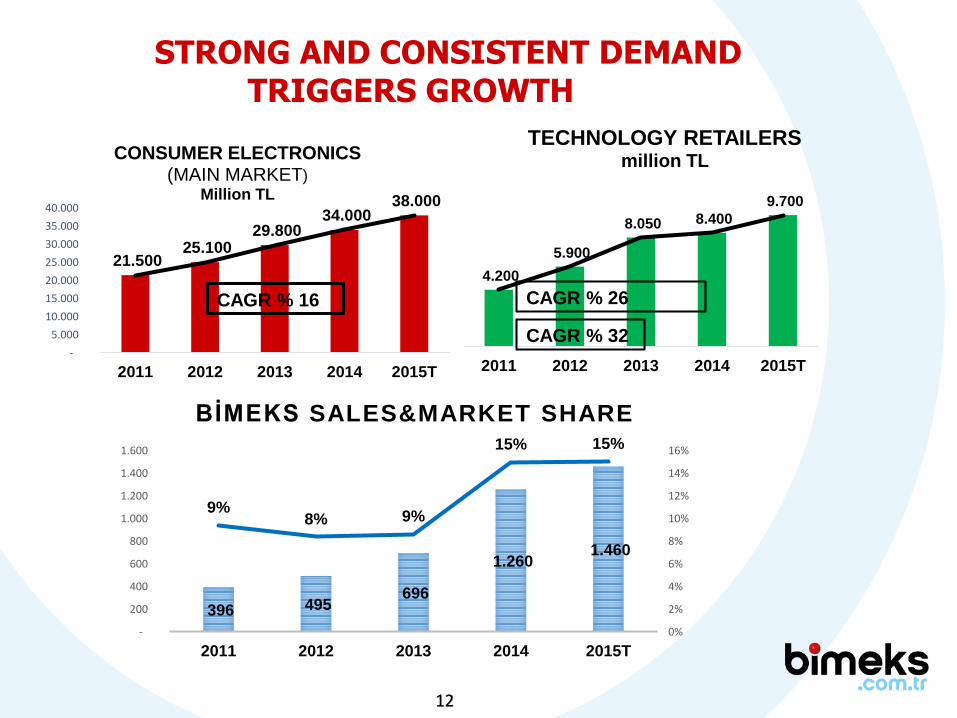
STRONG AND CONSISTENT DEMAND TRIGGERS GROWTH
396 495 696
1.260 1.460
9%8% 9%
15% 15%
0%
2%
4%
6%
8%
10%
12%
14%
16%
-
200
400
600
800
1.000
1.200
1.400
1.600
2011 2012 2013 2014 2015T
BİMEKS SALES&MARKET SHARE
21.500 25.100
29.800 34.000
38.000
-
5.000
10.000
15.000
20.000
25.000
30.000
35.000
40.000
2011 2012 2013 2014 2015T
CONSUMER ELECTRONICS(MAIN MARKET)
Million TL
CAGR % 16
4.200
5.900
8.050 8.400
9.700
2011 2012 2013 2014 2015T
TECHNOLOGY RETAILERSmillion TL
CAGR % 26
CAGR % 32
13
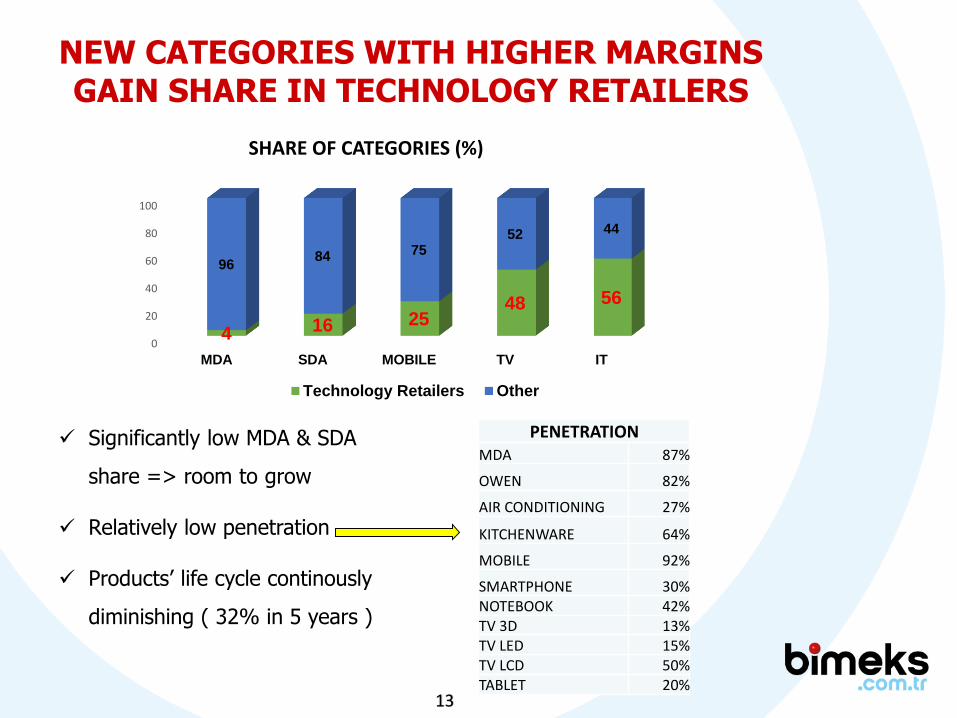
NEW CATEGORIES WITH HIGHER MARGINS GAIN SHARE IN TECHNOLOGY RETAILERS
Significantly low MDA & SDA
share => room to grow
Relatively low penetration
Products’ life cycle continously
diminishing ( 32% in 5 years )
0
20
40
60
80
100
MDA SDA MOBILE TV IT
4 16 2548 56
9684 75
52 44
SHARE OF CATEGORIES (%)
Technology Retailers Other
PENETRATIONMDA 87%
OWEN 82%
AIR CONDITIONING 27%
KITCHENWARE 64%
MOBILE 92%
SMARTPHONE 30%NOTEBOOK 42%TV 3D 13%TV LED 15%TV LCD 50%TABLET 20%
14
FINANCIALS
15
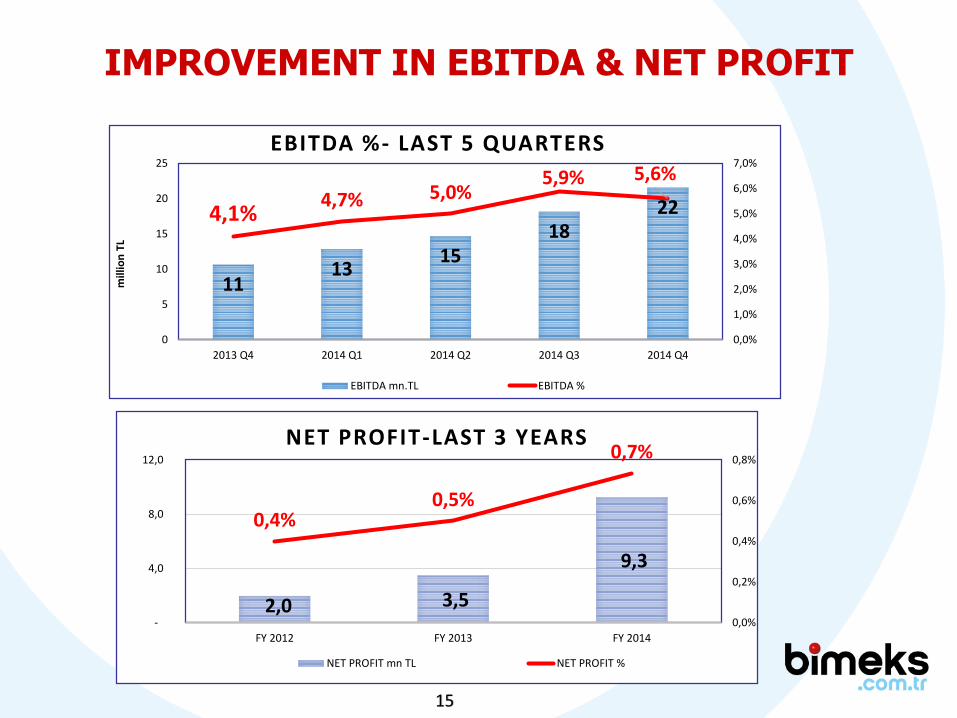
2,0 3,5
9,3
0,4%0,5%
0,7%
0,0%
0,2%
0,4%
0,6%
0,8%
-
4,0
8,0
12,0
FY 2012 FY 2013 FY 2014
NET PROFIT-LAST 3 YEARS
NET PROFIT mn TL NET PROFIT %
IMPROVEMENT IN EBITDA & NET PROFIT
1113
1518
224,1%4,7% 5,0%
5,9% 5,6%
0,0%
1,0%
2,0%
3,0%
4,0%
5,0%
6,0%
7,0%
0
5
10
15
20
25
2013 Q4 2014 Q1 2014 Q2 2014 Q3 2014 Q4
mill
ion
TL
EBITDA %- LAST 5 QUARTERS
EBITDA mn.TL EBITDA %
16
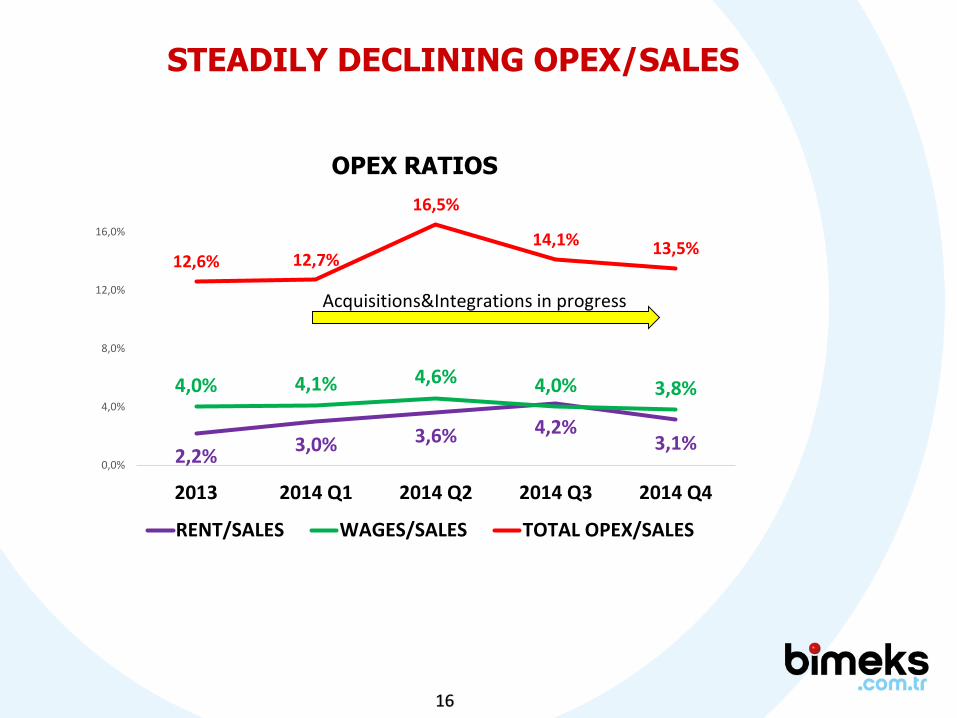
STEADILY DECLINING OPEX/SALES
2,2%3,0% 3,6% 4,2%
3,1%
4,0% 4,1% 4,6% 4,0% 3,8%
12,6% 12,7%
16,5%
14,1% 13,5%
0,0%
4,0%
8,0%
12,0%
16,0%
2013 2014 Q1 2014 Q2 2014 Q3 2014 Q4
OPEX RATIOS
RENT/SALES WAGES/SALES TOTAL OPEX/SALES
Acquisitions&Integrations in progress
17
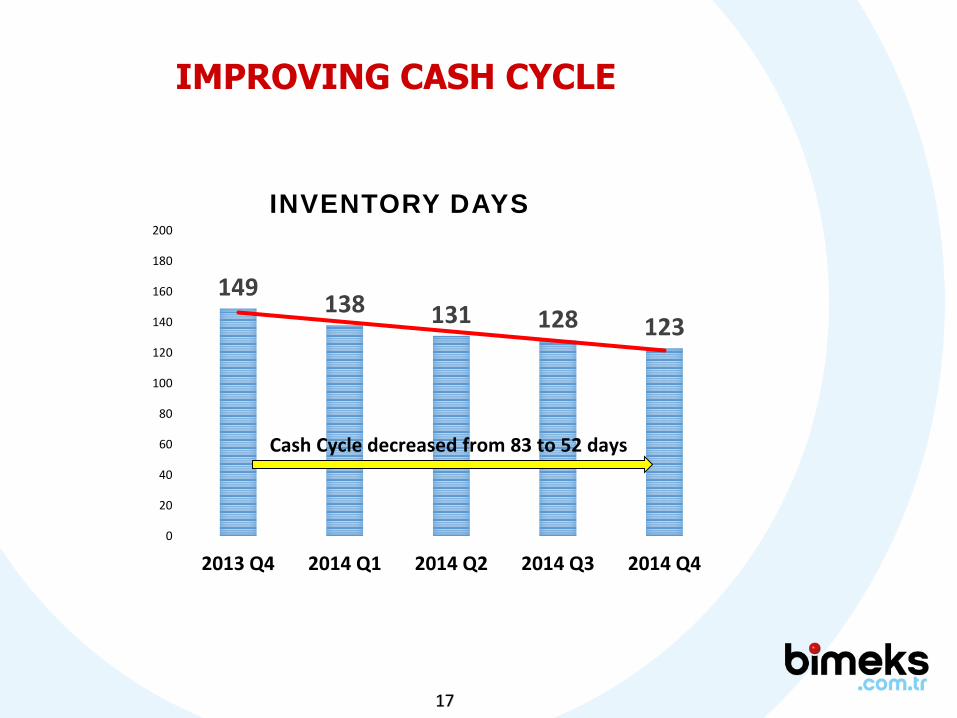
149138 131 128 123
0
20
40
60
80
100
120
140
160
180
200
2013 Q4 2014 Q1 2014 Q2 2014 Q3 2014 Q4
INVENTORY DAYS
Cash Cycle decreased from 83 to 52 days
IMPROVING CASH CYCLE
18
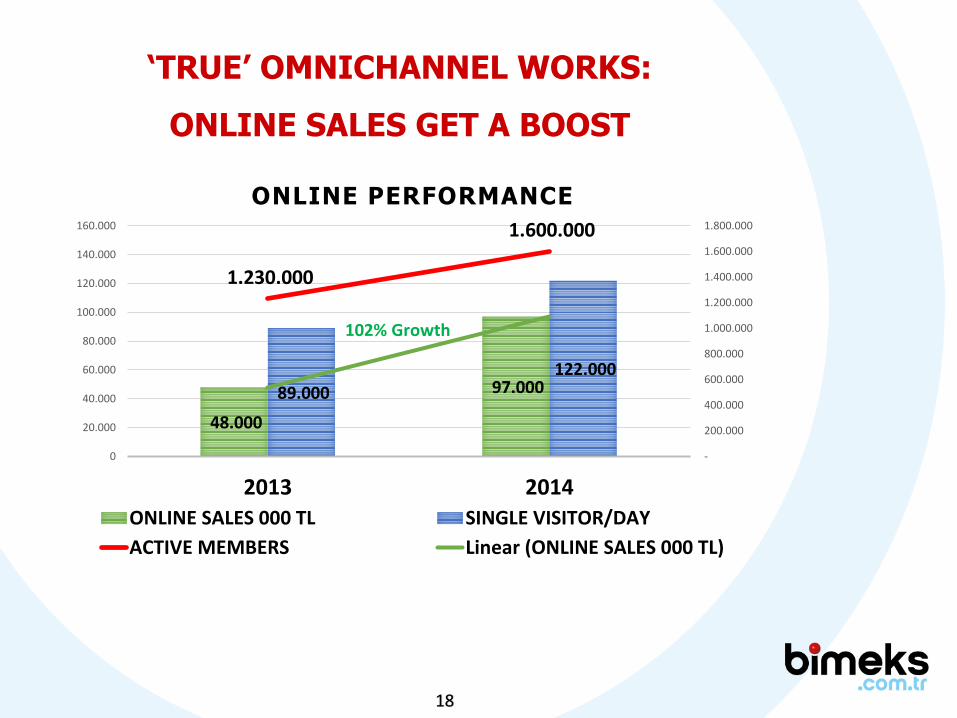
‘TRUE’ OMNICHANNEL WORKS:
ONLINE SALES GET A BOOST
48.000
97.000 89.000
122.000
1.230.000
1.600.000
-
200.000
400.000
600.000
800.000
1.000.000
1.200.000
1.400.000
1.600.000
1.800.000
0
20.000
40.000
60.000
80.000
100.000
120.000
140.000
160.000
2013 2014
ONLINE PERFORMANCE
ONLINE SALES 000 TL SINGLE VISITOR/DAY
ACTIVE MEMBERS Linear (ONLINE SALES 000 TL)
102% Growth
19
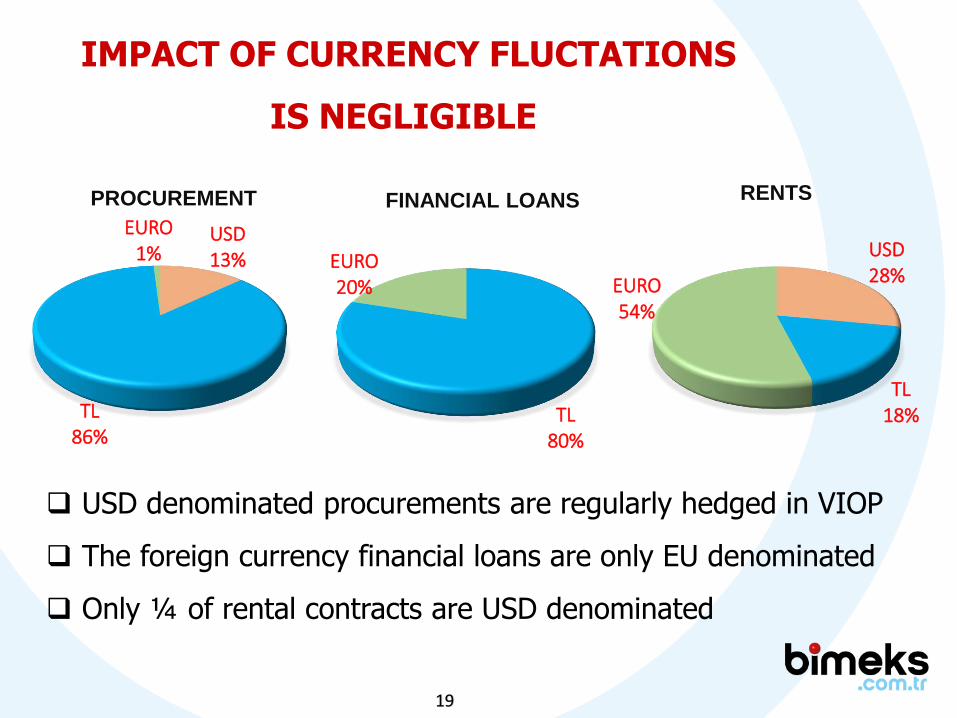
IMPACT OF CURRENCY FLUCTATIONS
IS NEGLIGIBLE
USD denominated procurements are regularly hedged in VIOP
The foreign currency financial loans are only EU denominated
Only ¼ of rental contracts are USD denominated
TL80%
EURO20%
FINANCIAL LOANS
USD13%
TL86%
EURO1%
PROCUREMENT
USD28%
TL18%
EURO54%
RENTS
20
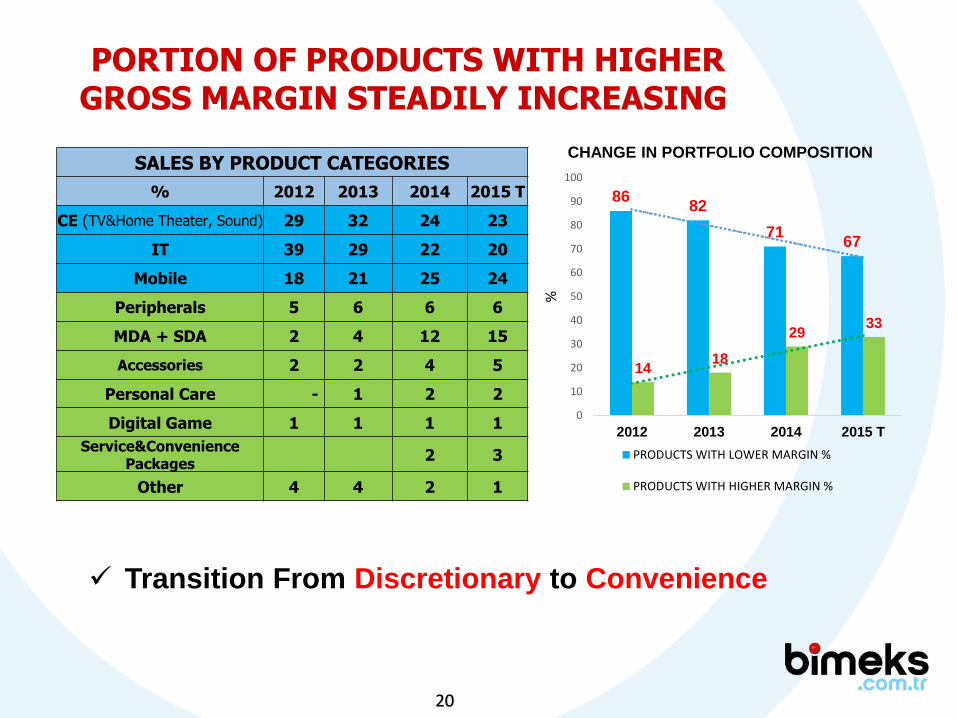
PORTION OF PRODUCTS WITH HIGHER GROSS MARGIN STEADILY INCREASING
Transition From Discretionary to Convenience
SALES BY PRODUCT CATEGORIES
% 2012 2013 2014 2015 T
CE (TV&Home Theater, Sound) 29 32 24 23
IT 39 29 22 20
Mobile 18 21 25 24
Peripherals 5 6 6 6
MDA + SDA 2 4 12 15
Accessories 2 2 4 5
Personal Care - 1 2 2
Digital Game 1 1 1 1
Service&Convenience Packages
2 3
Other 4 4 2 1
8682
7167
1418
2933
0
10
20
30
40
50
60
70
80
90
100
2012 2013 2014 2015 T
%
CHANGE IN PORTFOLIO COMPOSITION
PRODUCTS WITH LOWER MARGIN %
PRODUCTS WITH HIGHER MARGIN %
21
1Q 2015
FINANCIAL RESULTS
22
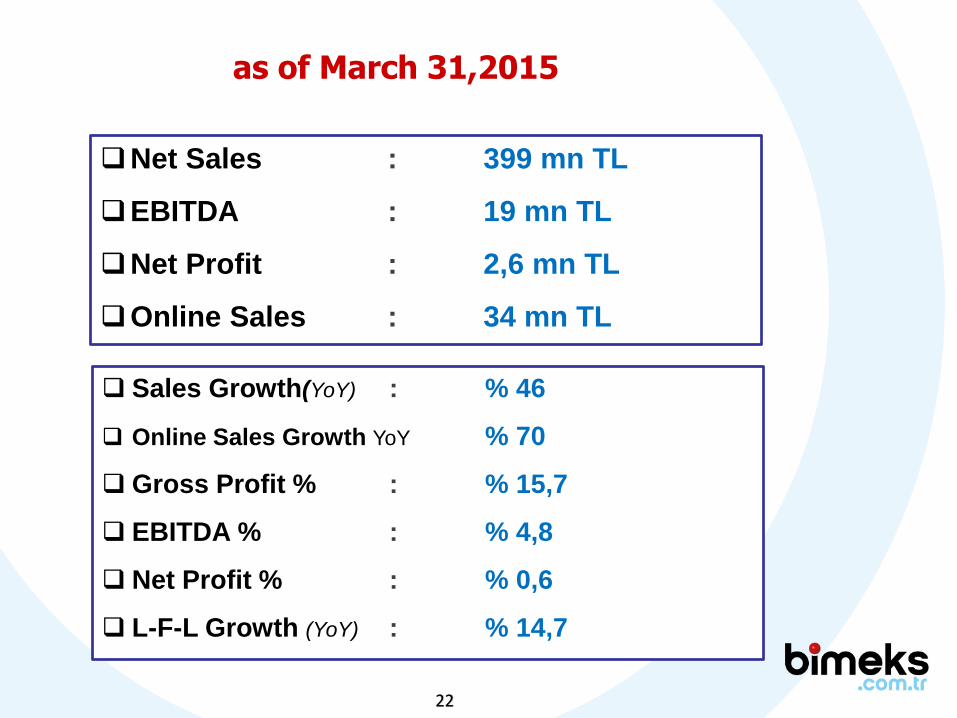
Net Sales : 399 mn TL
EBITDA : 19 mn TL
Net Profit : 2,6 mn TL
Online Sales : 34 mn TL
Sales Growth(YoY) : % 46
Online Sales Growth YoY % 70
Gross Profit % : % 15,7
EBITDA % : % 4,8
Net Profit % : % 0,6
L-F-L Growth (YoY) : % 14,7
as of March 31,2015
23
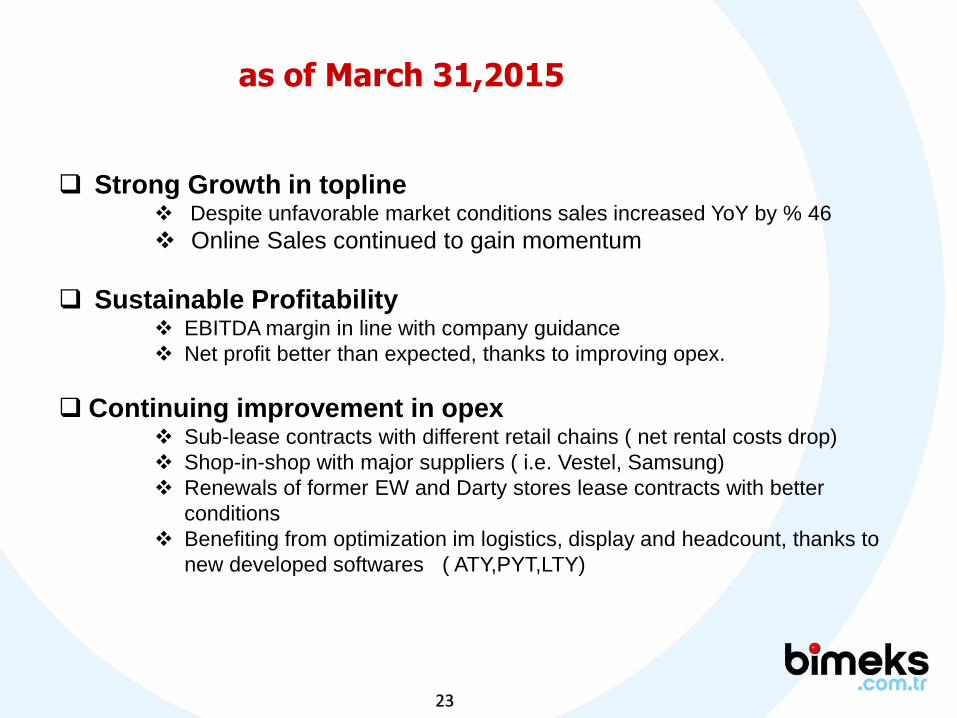
as of March 31,2015
Strong Growth in topline Despite unfavorable market conditions sales increased YoY by % 46
Online Sales continued to gain momentum
Sustainable Profitability EBITDA margin in line with company guidance
Net profit better than expected, thanks to improving opex.
Continuing improvement in opex Sub-lease contracts with different retail chains ( net rental costs drop)
Shop-in-shop with major suppliers ( i.e. Vestel, Samsung)
Renewals of former EW and Darty stores lease contracts with better
conditions
Benefiting from optimization im logistics, display and headcount, thanks to
new developed softwares ( ATY,PYT,LTY)

24
2015-2017 GUIDANCE
25
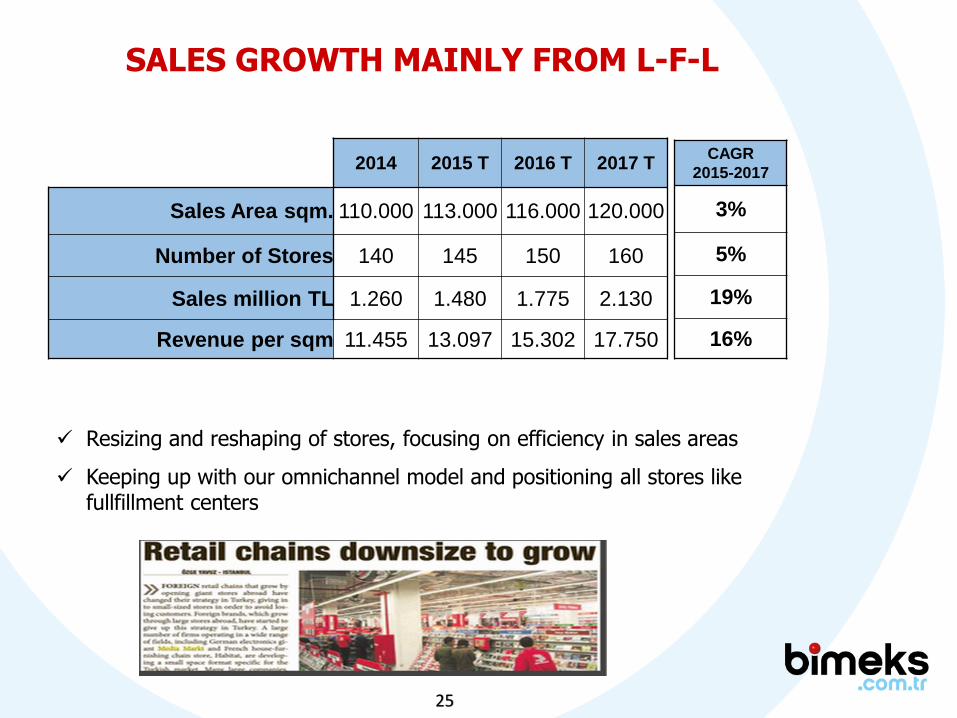
2014 2015 T 2016 T 2017 T
Sales Area sqm. 110.000 113.000 116.000 120.000
Number of Stores 140 145 150 160
Sales million TL 1.260 1.480 1.775 2.130
Revenue per sqm 11.455 13.097 15.302 17.750
CAGR
2015-2017
3%
5%
19%
16%
SALES GROWTH MAINLY FROM L-F-L
Resizing and reshaping of stores, focusing on efficiency in sales areas
Keeping up with our omnichannel model and positioning all stores like fullfillment centers
26
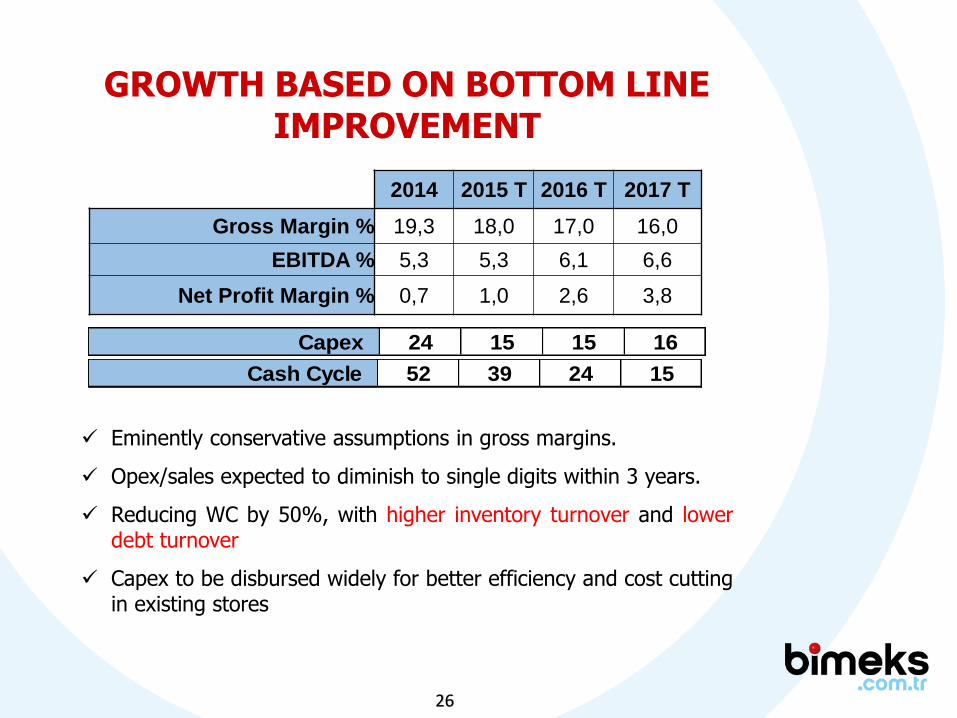
GROWTH BASED ON BOTTOM LINE IMPROVEMENT
Eminently conservative assumptions in gross margins.
Opex/sales expected to diminish to single digits within 3 years.
Reducing WC by 50%, with higher inventory turnover and lowerdebt turnover
Capex to be disbursed widely for better efficiency and cost cuttingin existing stores
2014 2015 T 2016 T 2017 T
Gross Margin % 19,3 18,0 17,0 16,0
EBITDA % 5,3 5,3 6,1 6,6
Net Profit Margin % 0,7 1,0 2,6 3,8
Capex 24 15 15 16
Cash Cycle 52 39 24 15
27
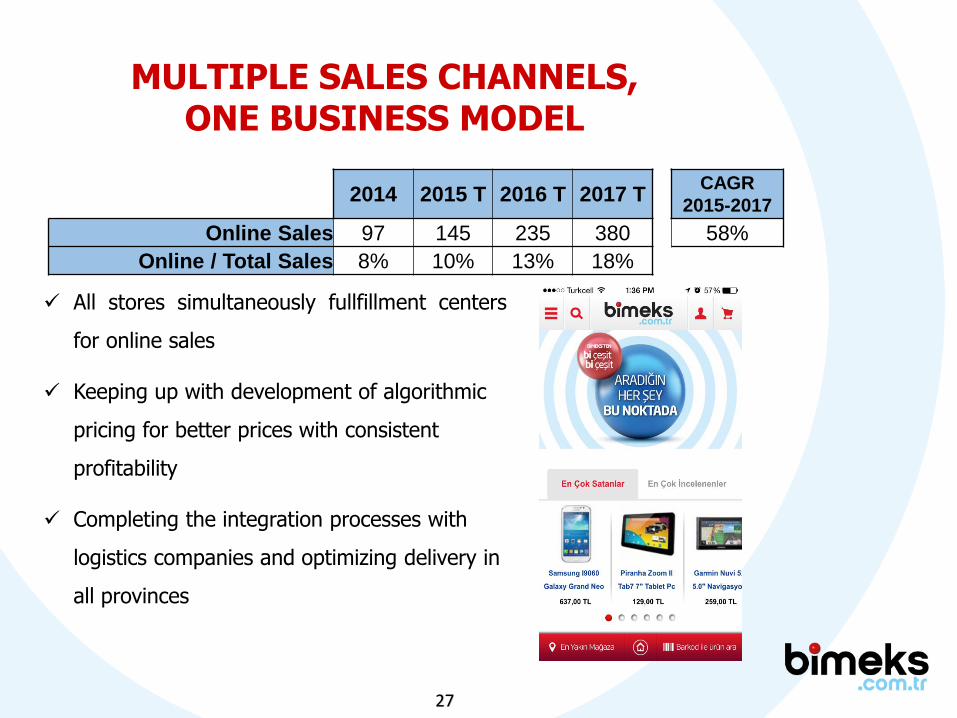
MULTIPLE SALES CHANNELS, ONE BUSINESS MODEL
All stores simultaneously fullfillment centers
for online sales
Keeping up with development of algorithmic
pricing for better prices with consistent
profitability
Completing the integration processes with
logistics companies and optimizing delivery in
all provinces
2014 2015 T 2016 T 2017 TCAGR
2015-2017
Online Sales 97 145 235 380 58%
Online / Total Sales 8% 10% 13% 18%
28
Improving margins with algorithmic pricing
Reducing the procurement and display costs by using artificial imtelligence tools
Building up «the artificial intelligence» of Bimeks and dominating big data of the
company
PERPETUAL GOAL #1: SOFTWARE DEVELOPMENT
PERPETUAL GOAL #2: PROCESS ENGINEERING
First and only in the industry: Empowering the sales with portfolio
management
Grouping stores by proximity and clustering them by using product portfolios
BUSINESS PHILOSOPHY: ENGINEERING RETAIL
29
IN SUMMARY
Consistent growth requires profitability
Sustainable profitability requires continous optimization and cost cutting
Continous optimization is only feasable with fully automated processes
Automated and integrated business processes are onlypossible with in-house designed and developed algorithmsand software
30
For a complete listing of presentations and coverage reports of the company:
investor.bimeks.com.tr