Pin Tutorial
Pin Tutorial 2007 1
What is Instrumentation?
A technique that inserts extra code into a program to collect runtime information
Instrumentation approaches:
• Source instrumentation:
– Instrument source programs
• Binary instrumentation: – Instrument executables directly
Pin Tutorial 2007 2
No need to recompile or relink Discover code at runtime Handle dynamically-generated code Attach to running processes
Why use Dynamic Instrumentation?
Pin Tutorial 2007 3
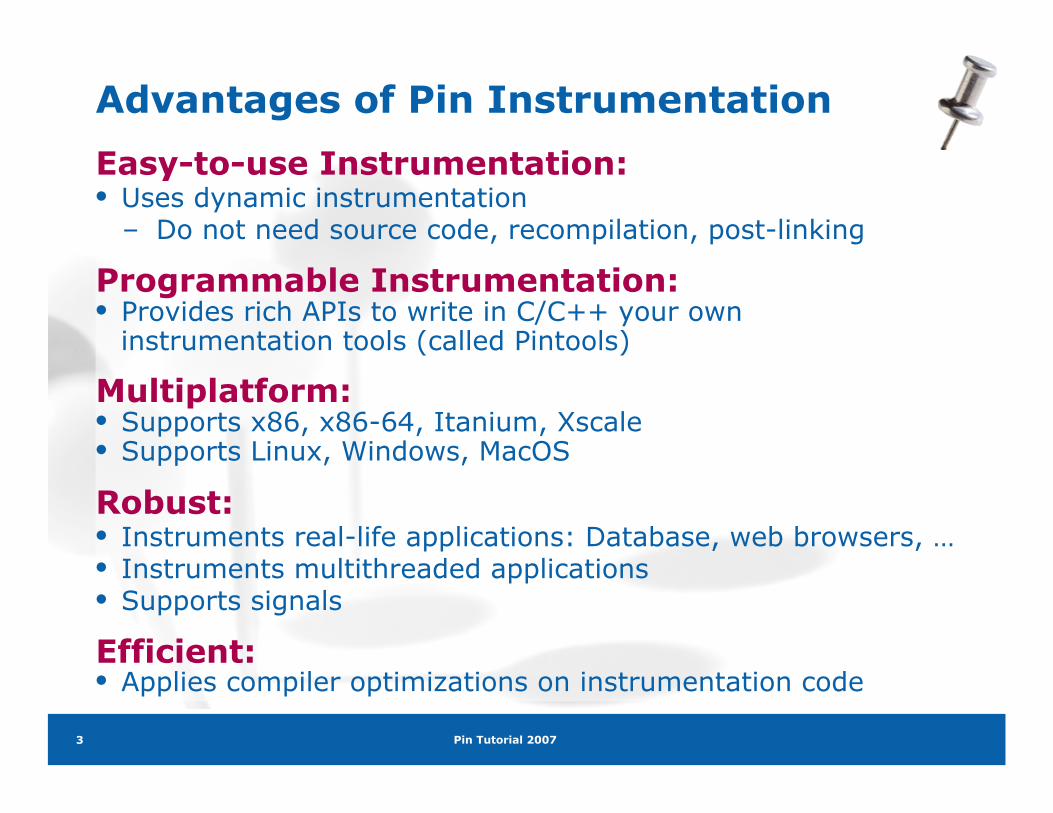
Advantages of Pin Instrumentation
Easy-to-use Instrumentation: • Uses dynamic instrumentation
– Do not need source code, recompilation, post-linking
Programmable Instrumentation: • Provides rich APIs to write in C/C++ your own
instrumentation tools (called Pintools)
Multiplatform: • Supports x86, x86-64, Itanium, Xscale • Supports Linux, Windows, MacOS
Robust: • Instruments real-life applications: Database, web browsers, … • Instruments multithreaded applications • Supports signals
Efficient: • Applies compiler optimizations on instrumentation code
Pin Tutorial 2007 4
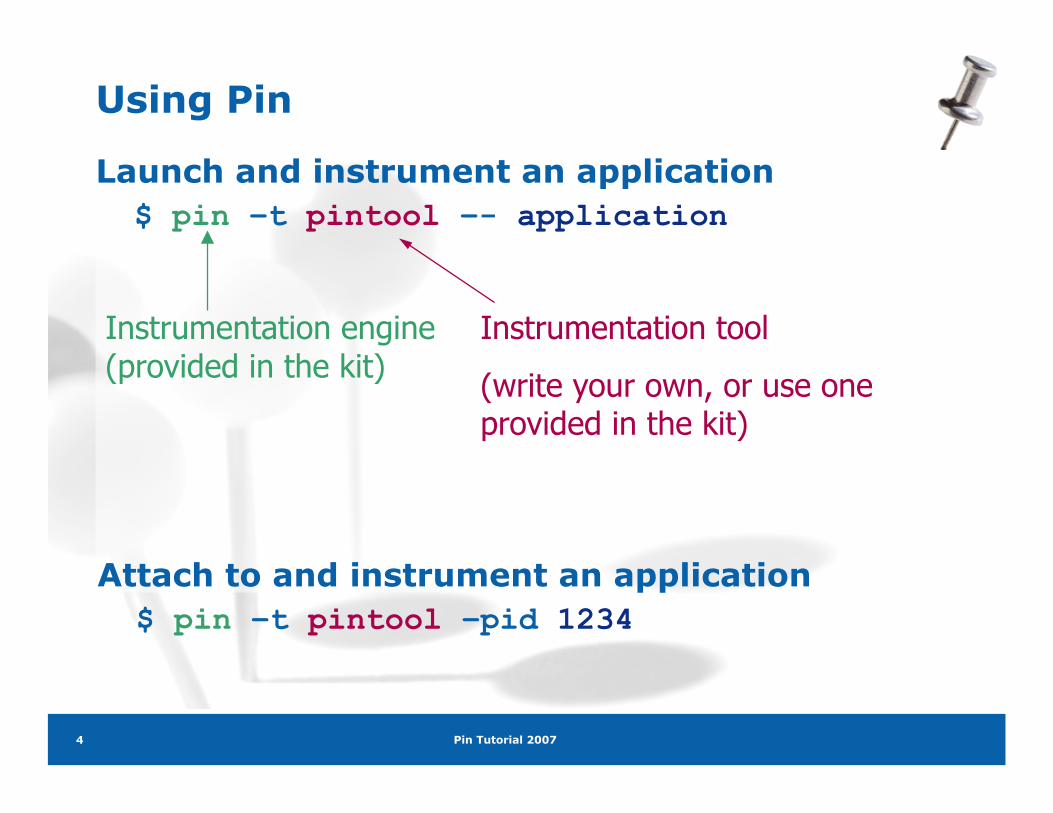
Using Pin
Launch and instrument an application $ pin –t pintool –- application
Instrumentation engine (provided in the kit)
Instrumentation tool
(write your own, or use one provided in the kit)
Attach to and instrument an application $ pin –t pintool –pid 1234
Pin Tutorial 2007 5
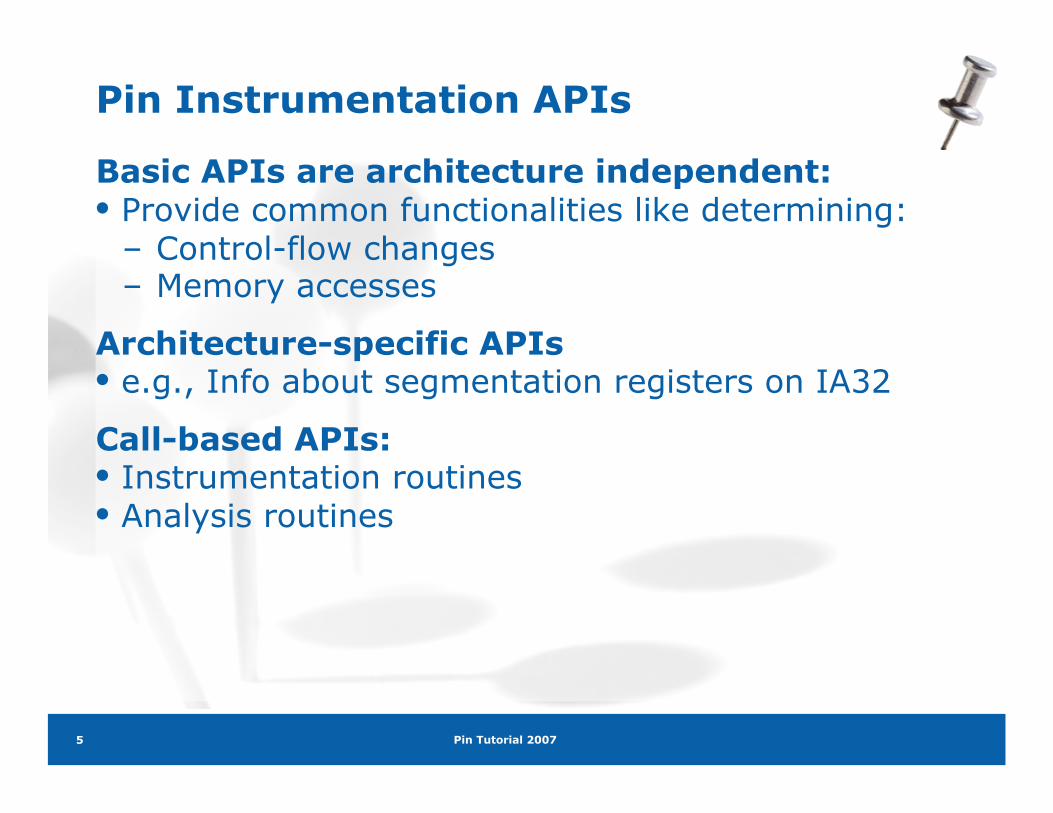
Pin Instrumentation APIs
Basic APIs are architecture independent: • Provide common functionalities like determining:
– Control-flow changes – Memory accesses
Architecture-specific APIs • e.g., Info about segmentation registers on IA32
Call-based APIs: • Instrumentation routines • Analysis routines
Pin Tutorial 2007 6
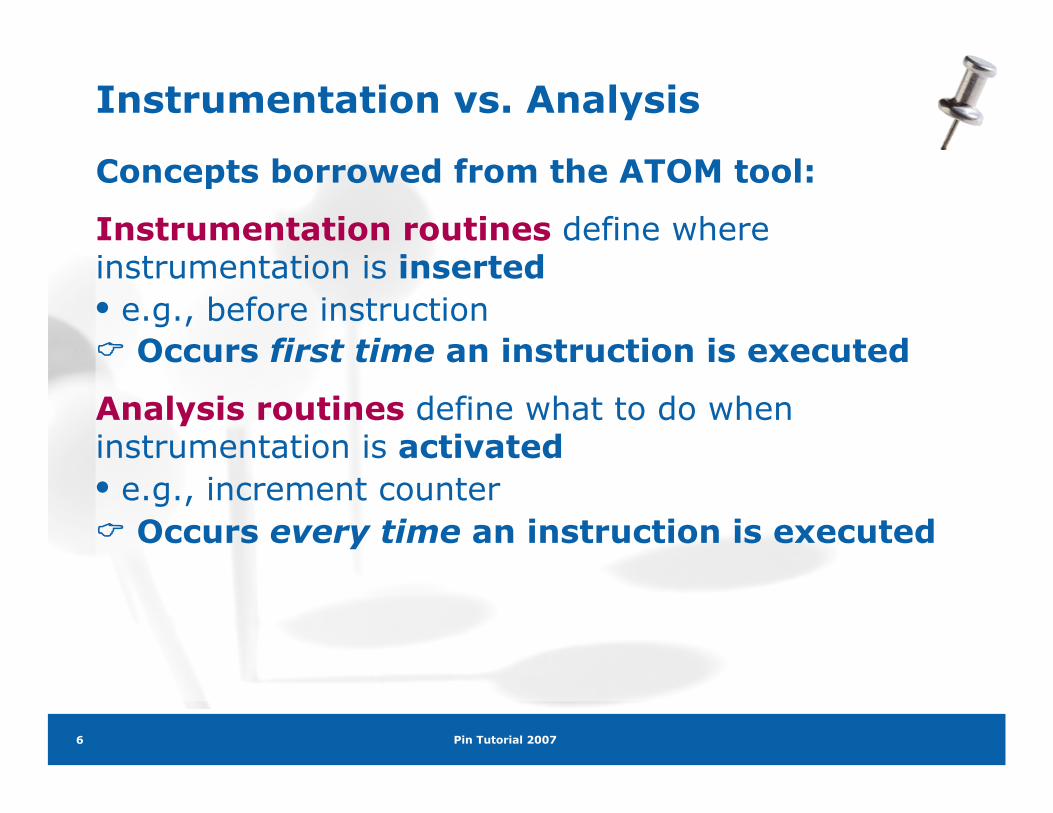
Instrumentation vs. Analysis
Concepts borrowed from the ATOM tool:
Instrumentation routines define where instrumentation is inserted • e.g., before instruction Occurs first time an instruction is executed
Analysis routines define what to do when instrumentation is activated • e.g., increment counter Occurs every time an instruction is executed
Pin Tutorial 2007 7
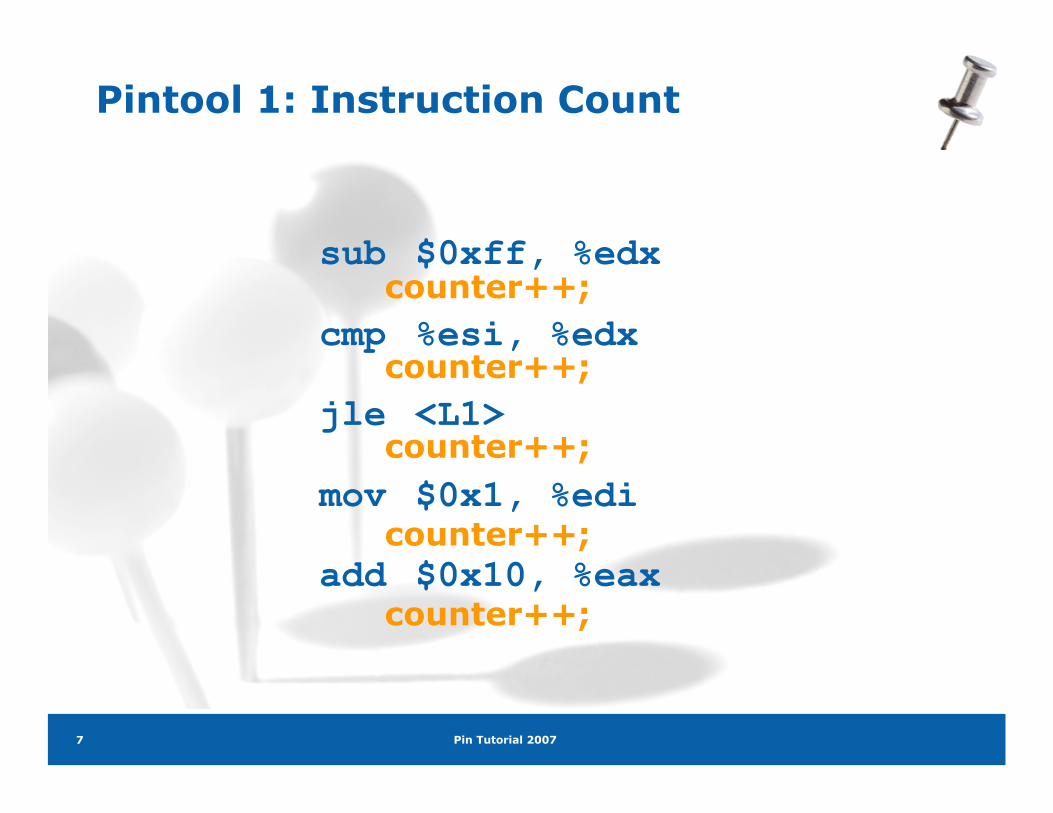
Pintool 1: Instruction Count
sub $0xff, %edx
cmp %esi, %edx
jle <L1>
mov $0x1, %edi
add $0x10, %eax
counter++;
counter++;
counter++;
counter++;
counter++;
Pin Tutorial 2007 8
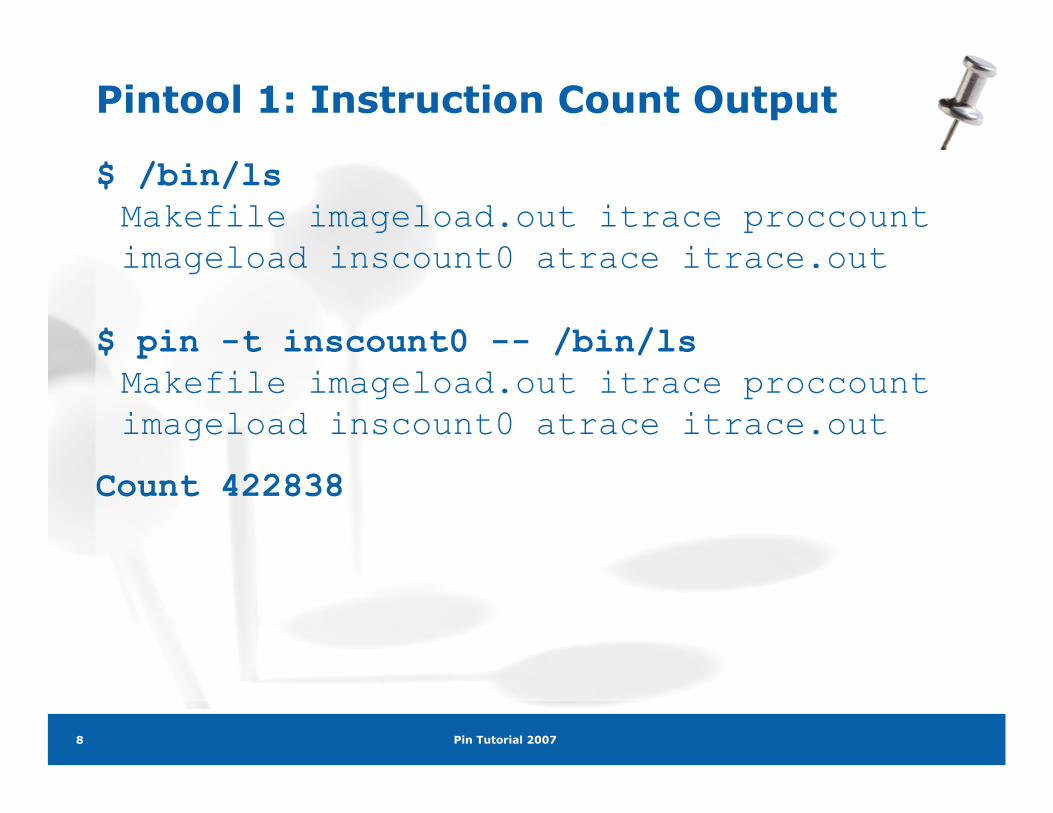
Pintool 1: Instruction Count Output
$ /bin/ls Makefile imageload.out itrace proccount imageload inscount0 atrace itrace.out
$ pin -t inscount0 -- /bin/ls Makefile imageload.out itrace proccount imageload inscount0 atrace itrace.out
Count 422838
Pin Tutorial 2007 9
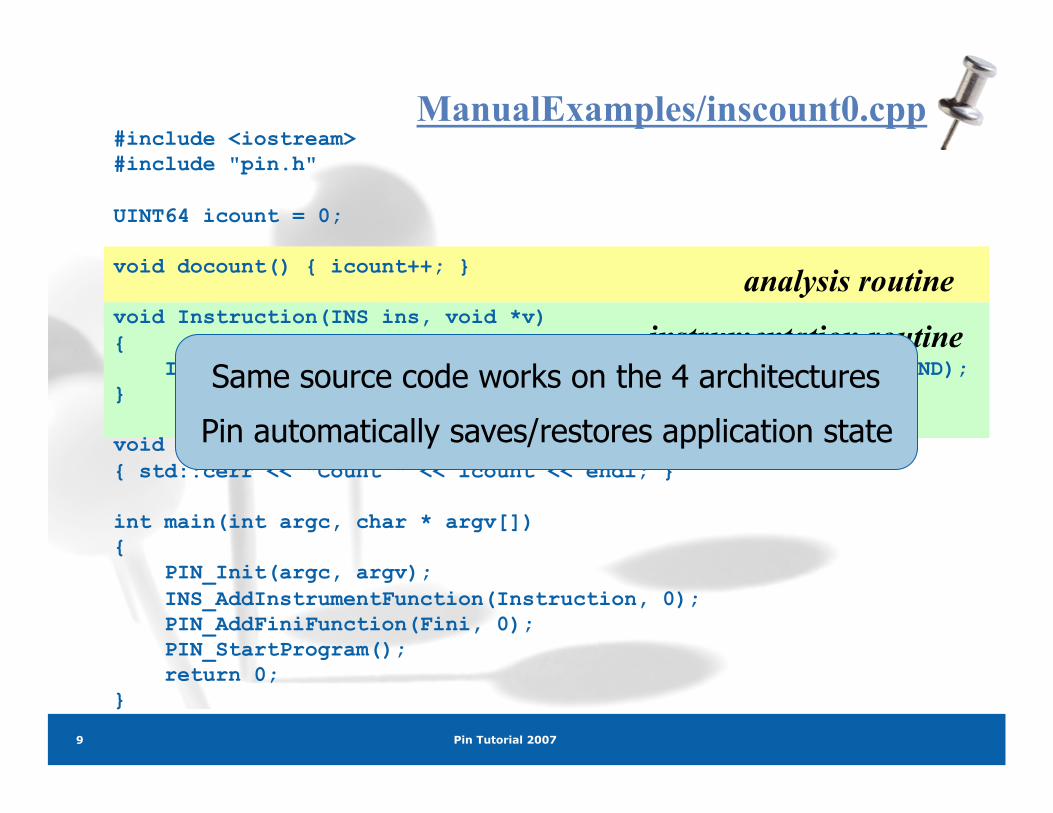
ManualExamples/inscount0.cpp
instrumentation routine
analysis routine
#include <iostream> #include "pin.h"
UINT64 icount = 0;
void docount() { icount++; }
void Instruction(INS ins, void *v) { INS_InsertCall(ins, IPOINT_BEFORE, (AFUNPTR)docount, IARG_END); }
void Fini(INT32 code, void *v) { std::cerr << "Count " << icount << endl; }
int main(int argc, char * argv[]) { PIN_Init(argc, argv); INS_AddInstrumentFunction(Instruction, 0); PIN_AddFiniFunction(Fini, 0); PIN_StartProgram(); return 0; }
Same source code works on the 4 architectures
Pin automatically saves/restores application state
Pin Tutorial 2007 10
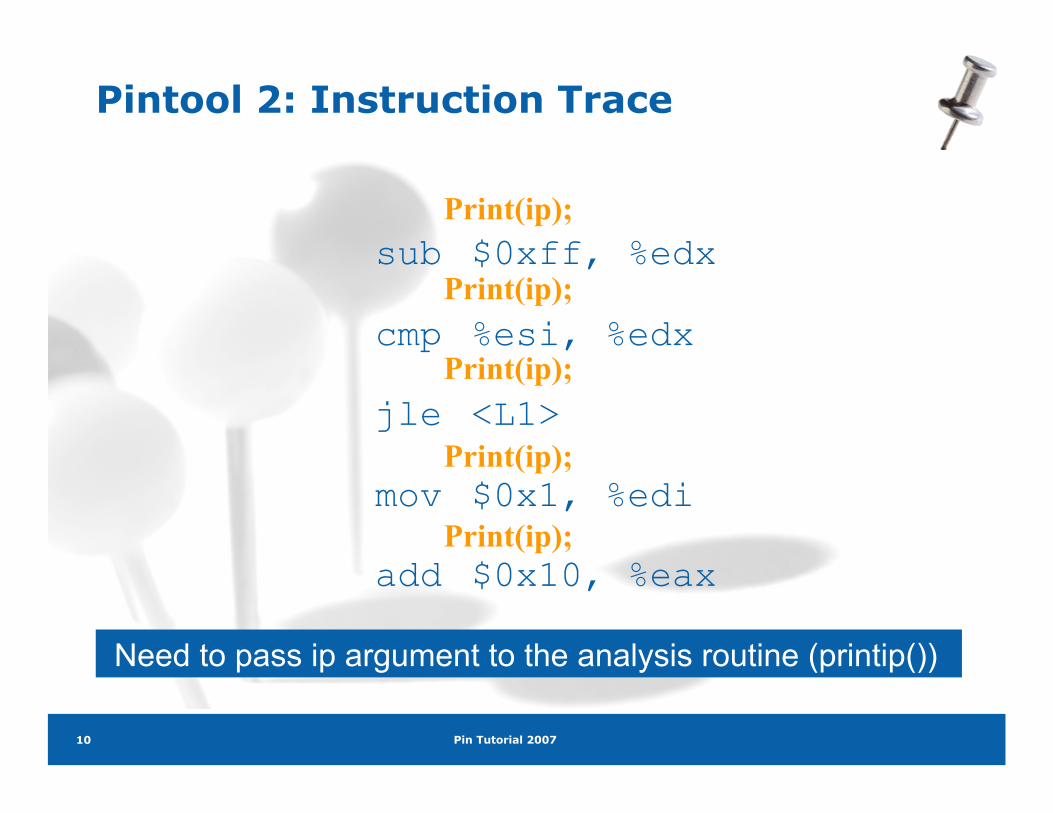
Pintool 2: Instruction Trace
sub $0xff, %edx
cmp %esi, %edx
jle <L1>
mov $0x1, %edi
add $0x10, %eax
Print(ip);
Print(ip);
Print(ip);
Print(ip);
Print(ip);
Need to pass ip argument to the analysis routine (printip())

Pin Tutorial 2007 11
Pintool 2: Instruction Trace Output
$ pin -t itrace -- /bin/ls Makefile imageload.out itrace proccount imageload inscount0 atrace itrace.out
$ head -4 itrace.out 0x40001e90 0x40001e91 0x40001ee4 0x40001ee5
Pin Tutorial 2007 12
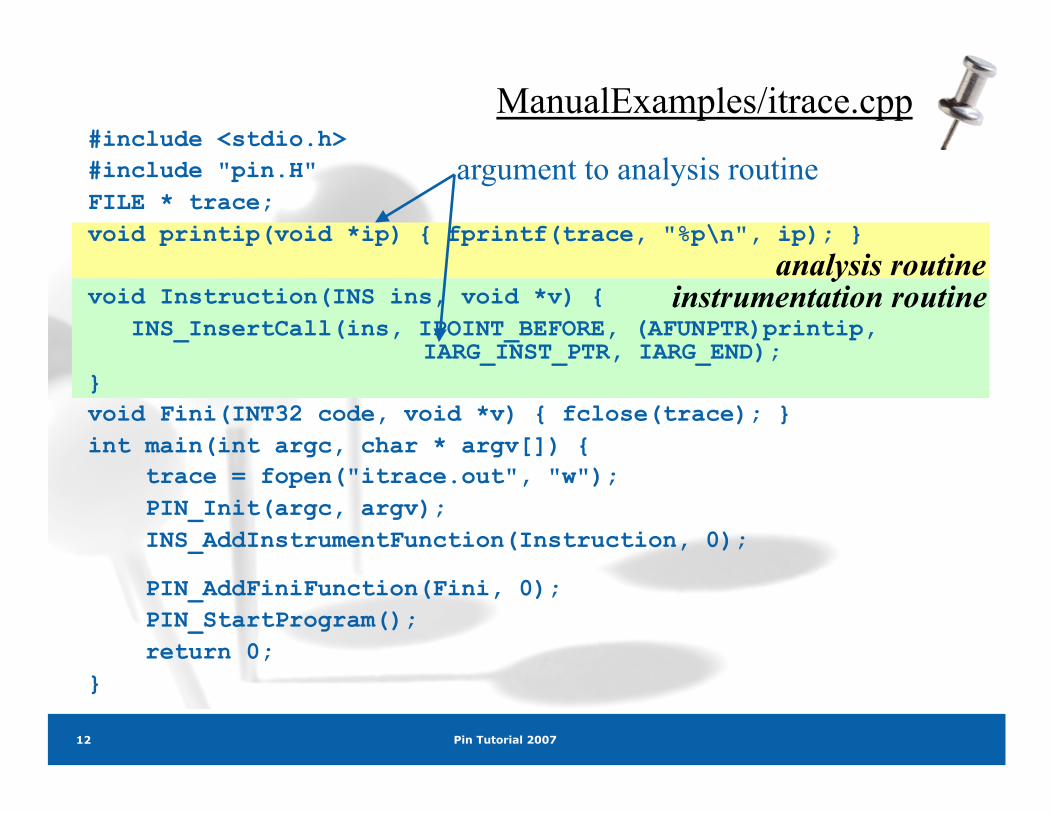
ManualExamples/itrace.cpp
argument to analysis routine
analysis routine instrumentation routine
#include <stdio.h> #include "pin.H" FILE * trace; void printip(void *ip) { fprintf(trace, "%p\n", ip); }
void Instruction(INS ins, void *v) { INS_InsertCall(ins, IPOINT_BEFORE, (AFUNPTR)printip,
IARG_INST_PTR, IARG_END); } void Fini(INT32 code, void *v) { fclose(trace); } int main(int argc, char * argv[]) { trace = fopen("itrace.out", "w"); PIN_Init(argc, argv); INS_AddInstrumentFunction(Instruction, 0);
PIN_AddFiniFunction(Fini, 0); PIN_StartProgram(); return 0; }
Pin Tutorial 2007 13
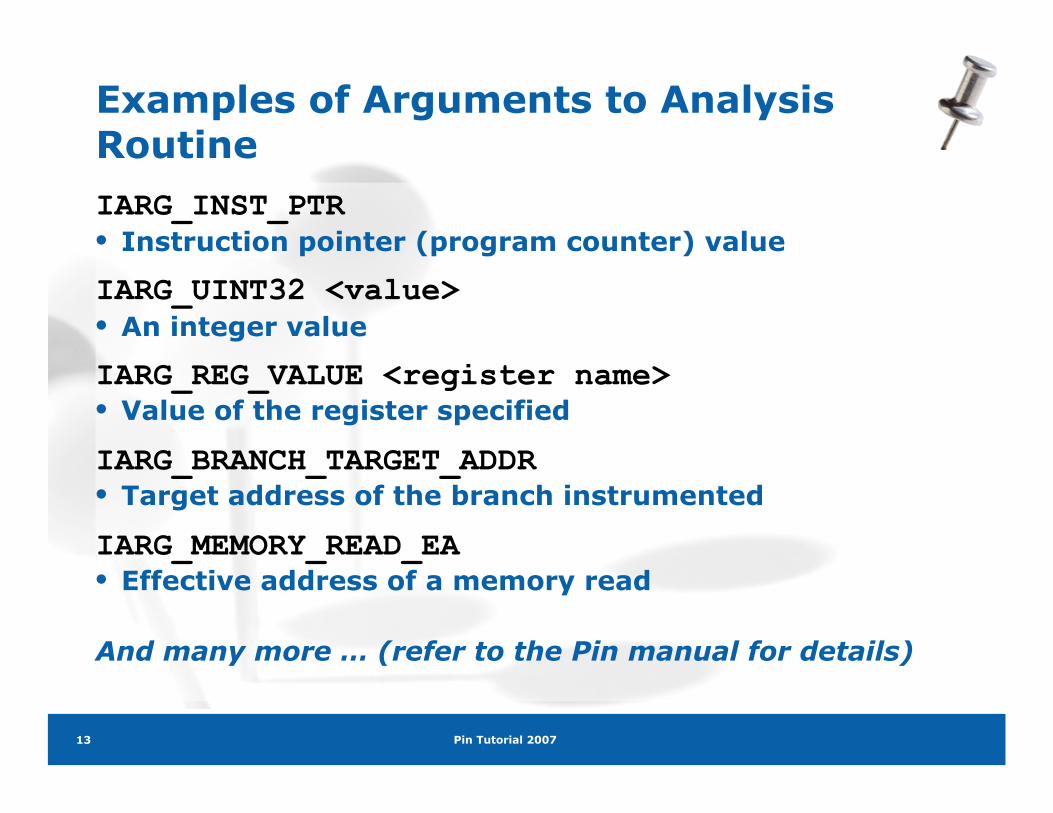
Examples of Arguments to Analysis Routine IARG_INST_PTR • Instruction pointer (program counter) value
IARG_UINT32 <value> • An integer value
IARG_REG_VALUE <register name> • Value of the register specified
IARG_BRANCH_TARGET_ADDR • Target address of the branch instrumented
IARG_MEMORY_READ_EA • Effective address of a memory read
And many more … (refer to the Pin manual for details)
Pin Tutorial 2007 14
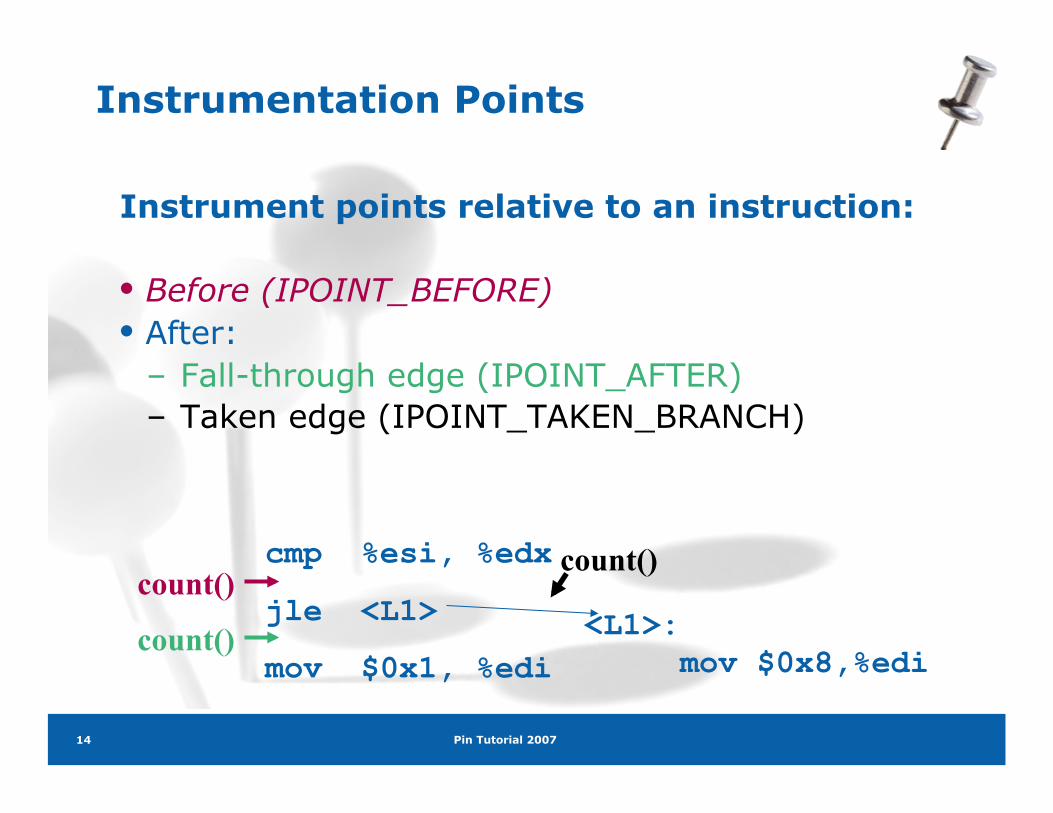
Instrumentation Points
Instrument points relative to an instruction:
• Before (IPOINT_BEFORE) • After:
– Fall-through edge (IPOINT_AFTER) – Taken edge (IPOINT_TAKEN_BRANCH)
cmp %esi, %edx
jle <L1>
mov $0x1, %edi
<L1>: mov $0x8,%edi
count()
count()
count()
Pin Tutorial 2007 15
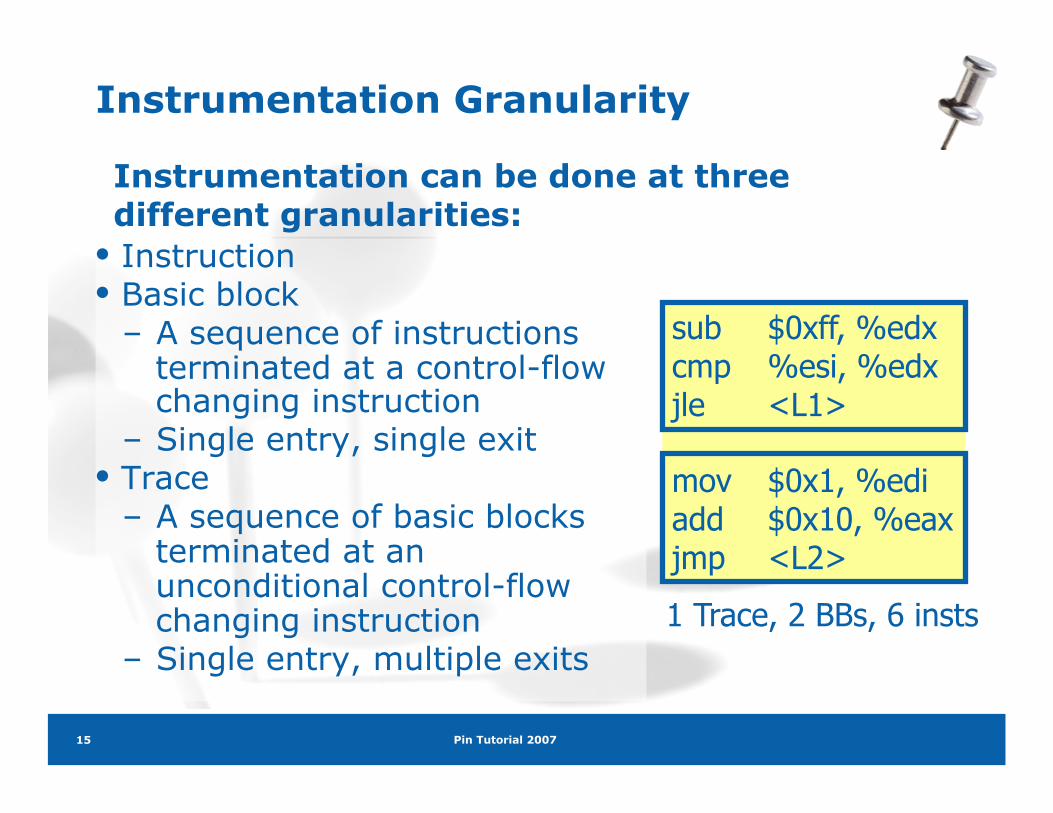
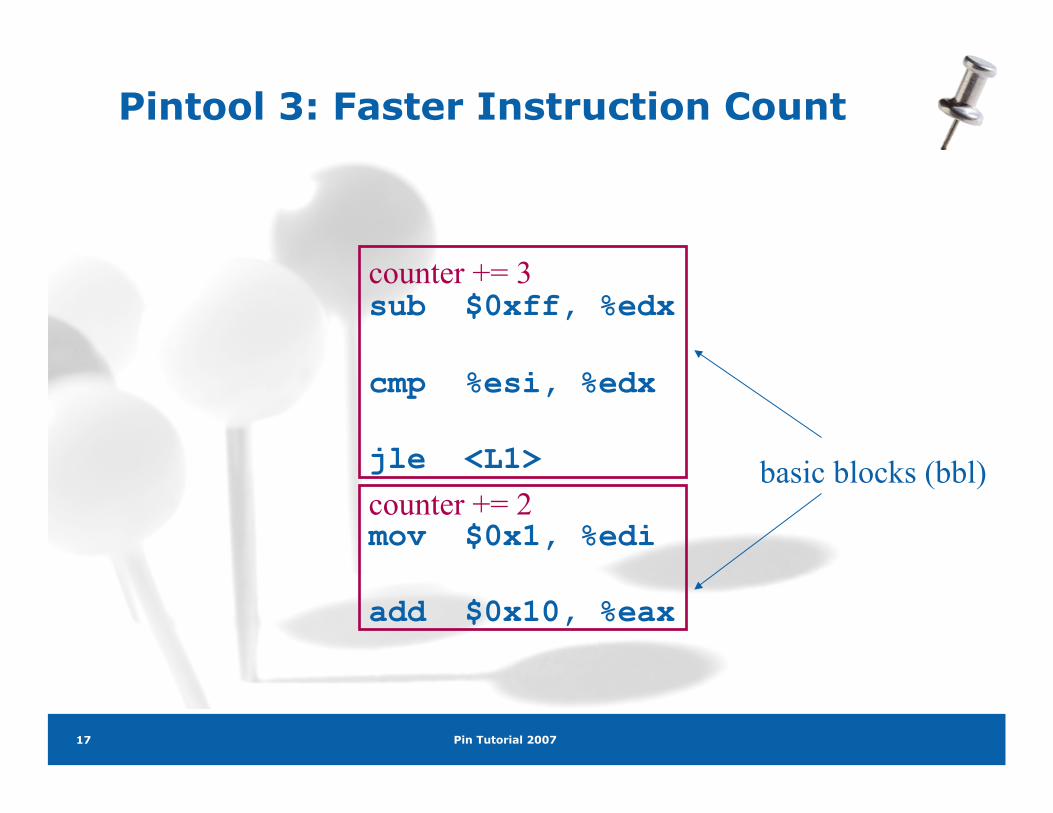
• Instruction • Basic block
– A sequence of instructions terminated at a control-flow changing instruction
– Single entry, single exit • Trace
– A sequence of basic blocks terminated at an unconditional control-flow changing instruction
– Single entry, multiple exits
Instrumentation Granularity
sub $0xff, %edx cmp %esi, %edx jle <L1>
mov $0x1, %edi add $0x10, %eax jmp <L2>
1 Trace, 2 BBs, 6 insts
Instrumentation can be done at three different granularities:

Pin Tutorial 2007 16
Recap of Pintool 1: Instruction Count
sub $0xff, %edx
cmp %esi, %edx
jle <L1>
mov $0x1, %edi
add $0x10, %eax
counter++;
counter++;
counter++;
counter++;
counter++;
Straightforward, but the counting can be more efficient
Pin Tutorial 2007 17
Pintool 3: Faster Instruction Count
sub $0xff, %edx
cmp %esi, %edx
jle <L1>
mov $0x1, %edi
add $0x10, %eax
counter += 3
counter += 2 basic blocks (bbl)
Pin Tutorial 2007 18
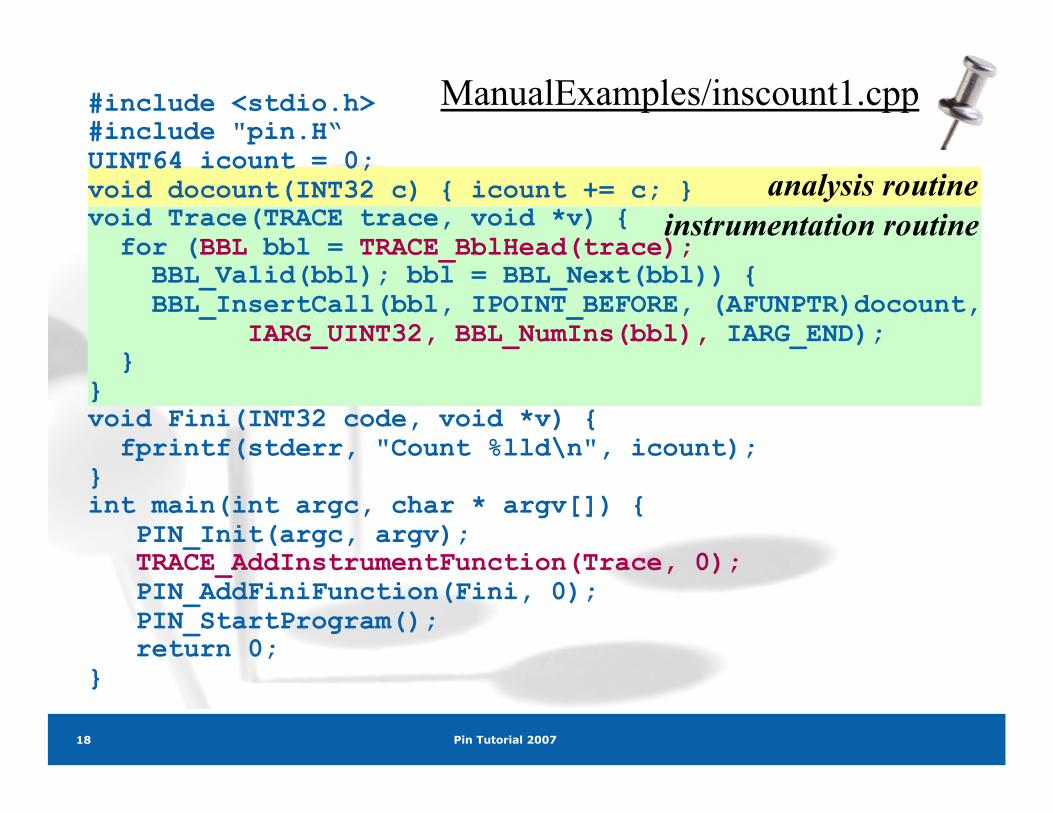
ManualExamples/inscount1.cpp #include <stdio.h> #include "pin.H“ UINT64 icount = 0; void docount(INT32 c) { icount += c; } void Trace(TRACE trace, void *v) { for (BBL bbl = TRACE_BblHead(trace); BBL_Valid(bbl); bbl = BBL_Next(bbl)) { BBL_InsertCall(bbl, IPOINT_BEFORE, (AFUNPTR)docount, IARG_UINT32, BBL_NumIns(bbl), IARG_END); } } void Fini(INT32 code, void *v) { fprintf(stderr, "Count %lld\n", icount); } int main(int argc, char * argv[]) { PIN_Init(argc, argv); TRACE_AddInstrumentFunction(Trace, 0); PIN_AddFiniFunction(Fini, 0); PIN_StartProgram(); return 0; }
analysis routine instrumentation routine
Pin Tutorial 2007 19
Modifying Program Behavior
Pin allows you not only to observe but also change program behavior Ways to change program behavior: • Add/delete instructions • Change register values • Change memory values • Change control flow

Pin Tutorial 2007 20
Instrumentation Library
#include <iostream> #include "pin.H"
UINT64 icount = 0;
VOID Fini(INT32 code, VOID *v) { std::cerr << "Count " << icount << endl; }
VOID docount() { icount++; }
VOID Instruction(INS ins, VOID *v) { INS_InsertCall(ins, IPOINT_BEFORE,(AFUNPTR)docount, IARG_END); }
int main(int argc, char * argv[]) { PIN_Init(argc, argv); INS_AddInstrumentFunction(Instruction, 0); PIN_AddFiniFunction(Fini, 0); PIN_StartProgram(); return 0; }
#include <iostream> #include "pin.H" #include "instlib.H"
INSTLIB::ICOUNT icount;
VOID Fini(INT32 code, VOID *v) { cout << "Count" << icount.Count() << endl; }
int main(int argc, char * argv[]) { PIN_Init(argc, argv); PIN_AddFiniFunction(Fini, 0); icount.Activate(); PIN_StartProgram(); return 0; }
Instruction counting Pin Tool
Pin Tutorial 2007 21
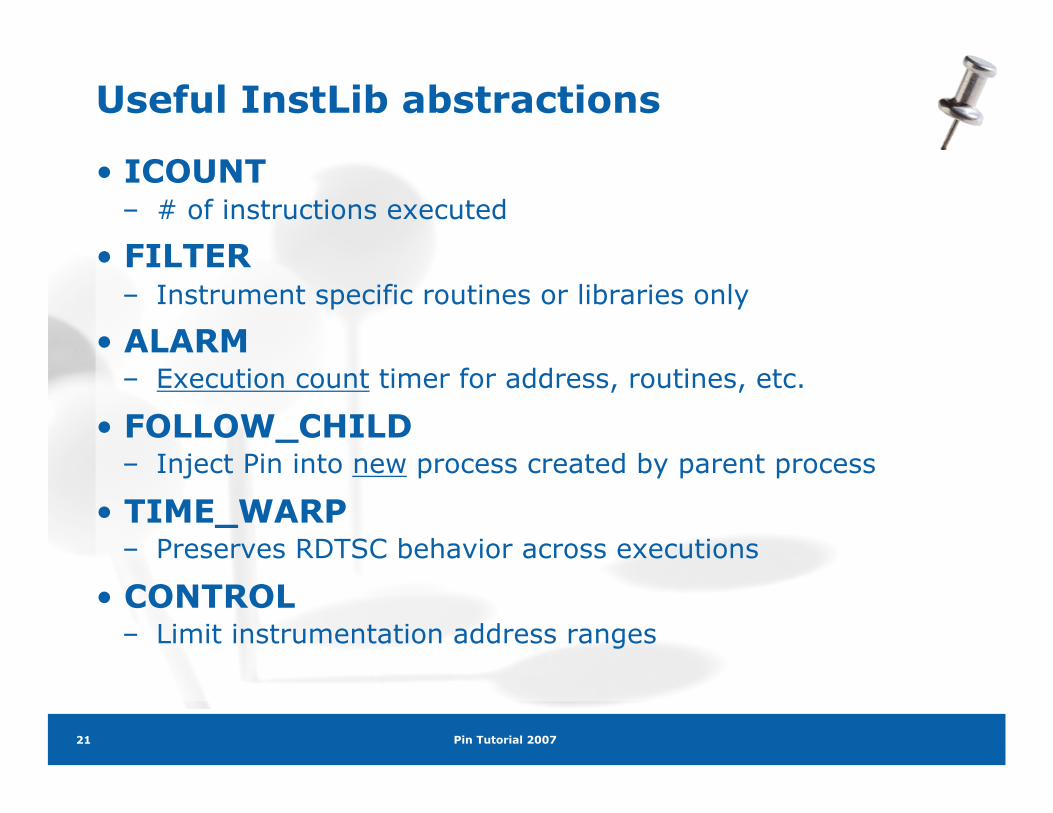
Useful InstLib abstractions
• ICOUNT – # of instructions executed
• FILTER – Instrument specific routines or libraries only
• ALARM – Execution count timer for address, routines, etc.
• FOLLOW_CHILD – Inject Pin into new process created by parent process
• TIME_WARP – Preserves RDTSC behavior across executions
• CONTROL – Limit instrumentation address ranges
Pin Tutorial 2007 22
Useful InstLib ALARM Example
Pin Tutorial 2007 23
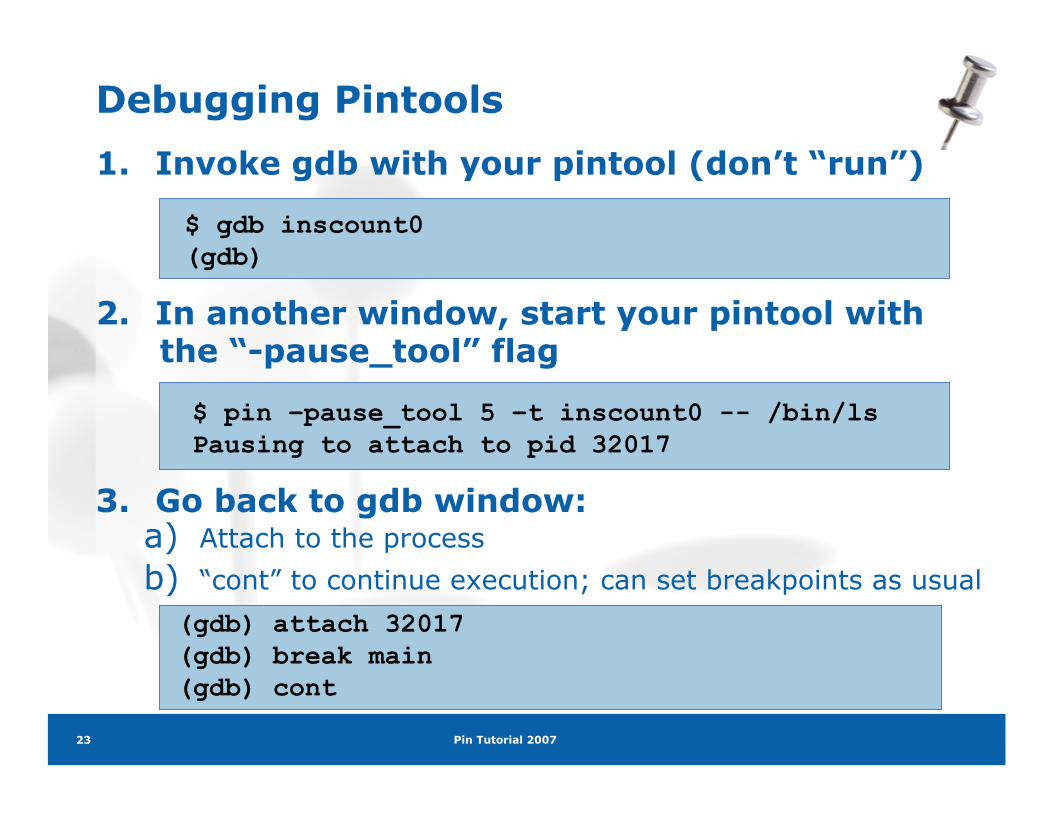
1. Invoke gdb with your pintool (don’t “run”)
2. In another window, start your pintool with the “-pause_tool” flag
3. Go back to gdb window: a) Attach to the process b) “cont” to continue execution; can set breakpoints as usual
(gdb) attach 32017 (gdb) break main (gdb) cont
$ pin –pause_tool 5 –t inscount0 -- /bin/ls Pausing to attach to pid 32017
$ gdb inscount0 (gdb)
Debugging Pintools

Pin Tutorial 2007 24
Pin Overhead
SPEC Integer 2006
100%
120%
140%
160%
180%
200%perlbench
sjeng
xalancbmk
gobmk
gcc
h264ref
omnetpp
bzip2
libquantum
mcf
astar
hmmer
Rel
ativ
e to
Nat
ive
Pin Tutorial 2007 25
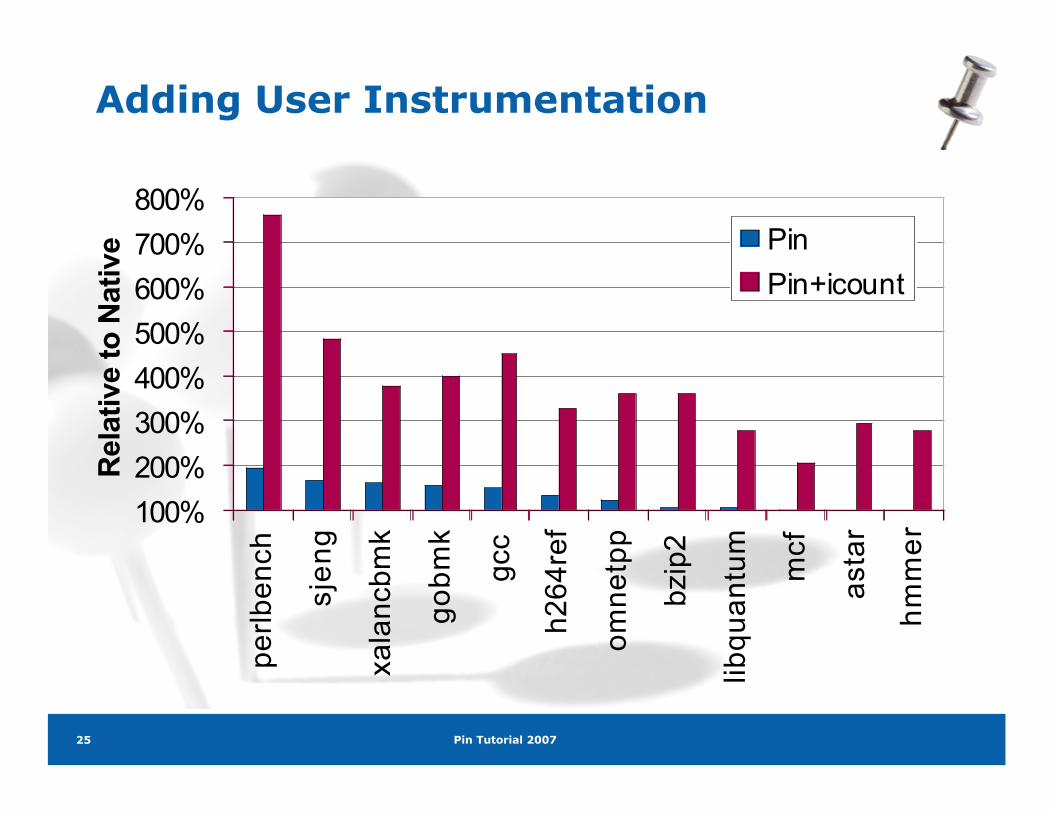
Adding User Instrumentation
100%200%300%400%500%600%700%800%
perlbench
sjeng
xalancbmk
gobmk
gcc
h264ref
omnetpp
bzip2
libquantum
mcf
astar
hmmer
Rel
ativ
e to
Nat
ive Pin
Pin+icount
Pin Tutorial 2007 26
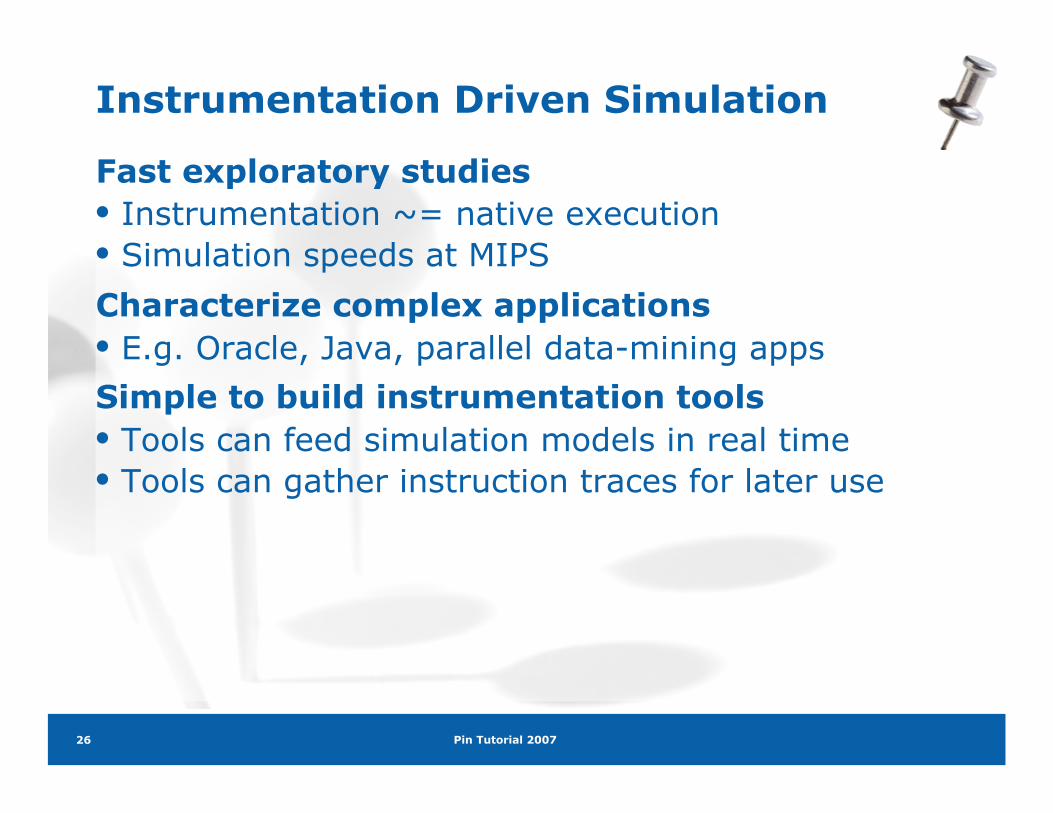
Fast exploratory studies • Instrumentation ~= native execution • Simulation speeds at MIPS Characterize complex applications • E.g. Oracle, Java, parallel data-mining apps Simple to build instrumentation tools • Tools can feed simulation models in real time • Tools can gather instruction traces for later use
Instrumentation Driven Simulation

Pin Tutorial 2007 27
Performance Models
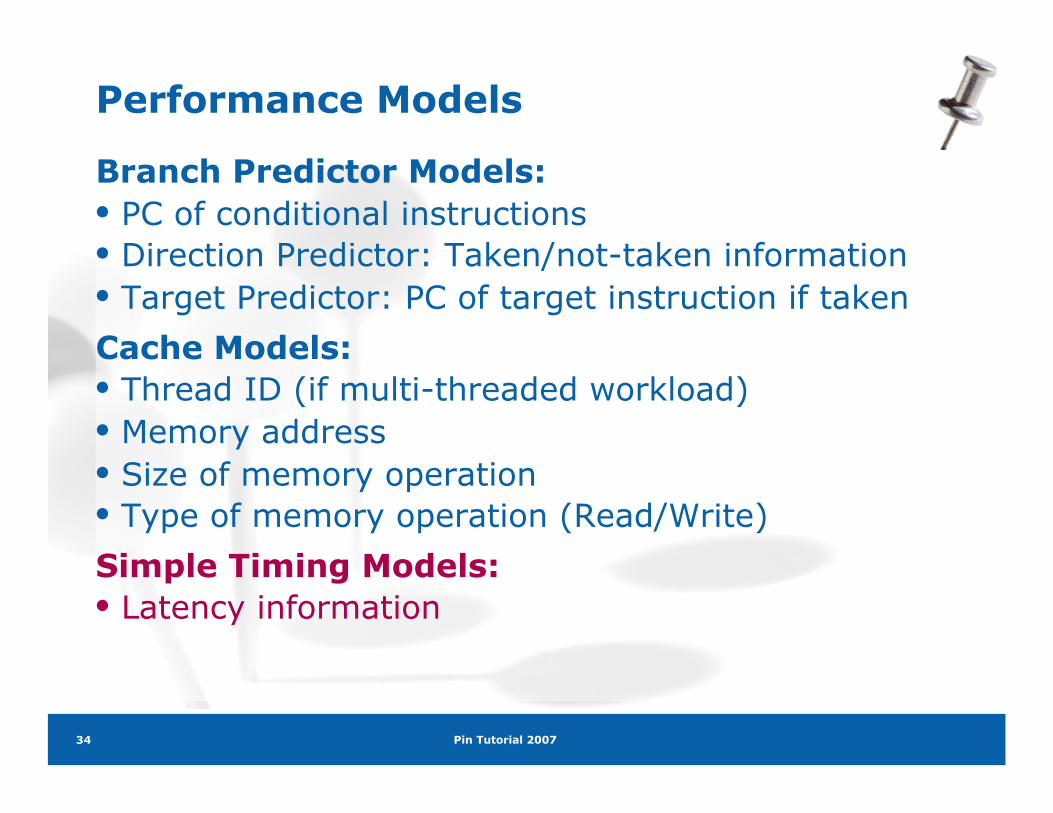
Branch Predictor Models: • PC of conditional instructions • Direction Predictor: Taken/not-taken information • Target Predictor: PC of target instruction if taken Cache Models: • Thread ID (if multi-threaded workload) • Memory address • Size of memory operation • Type of memory operation (Read/Write) Simple Timing Models: • Latency information
Pin Tutorial 2007 28
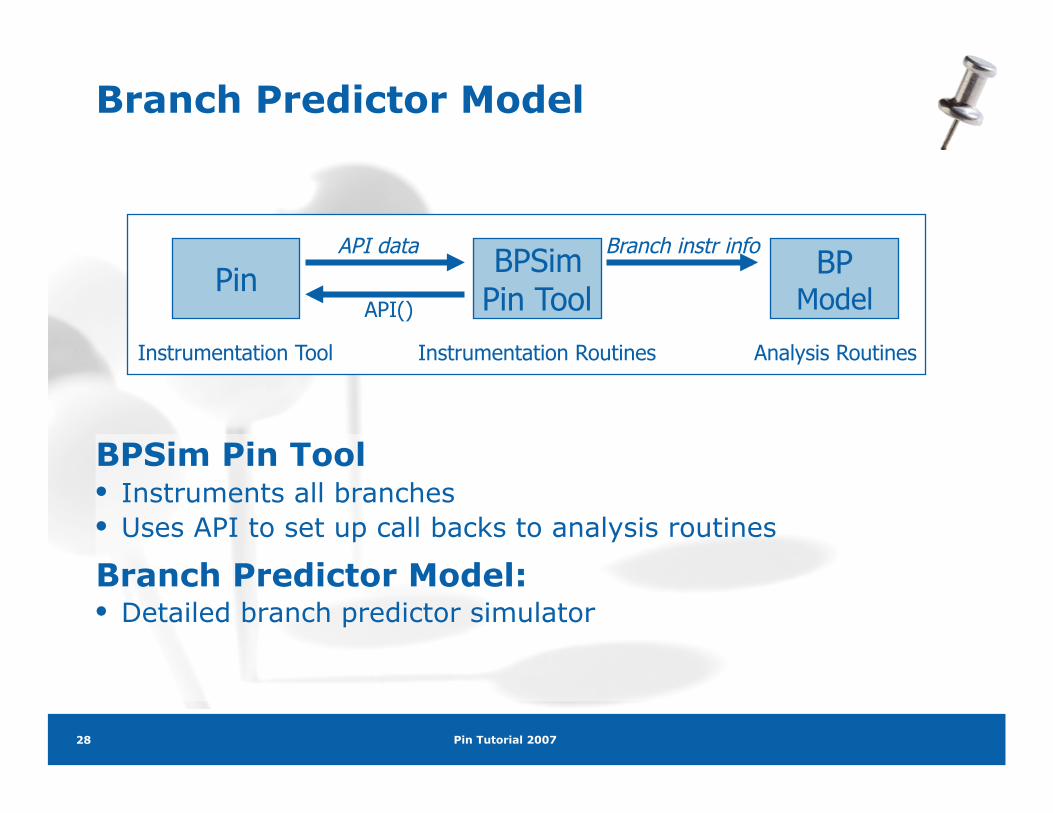
Branch Predictor Model
BP Model
BPSim Pin Tool
Pin
Instrumentation Routines Analysis Routines Instrumentation Tool
API()
Branch instr info API data
BPSim Pin Tool • Instruments all branches • Uses API to set up call backs to analysis routines
Branch Predictor Model: • Detailed branch predictor simulator
Pin Tutorial 2007 29
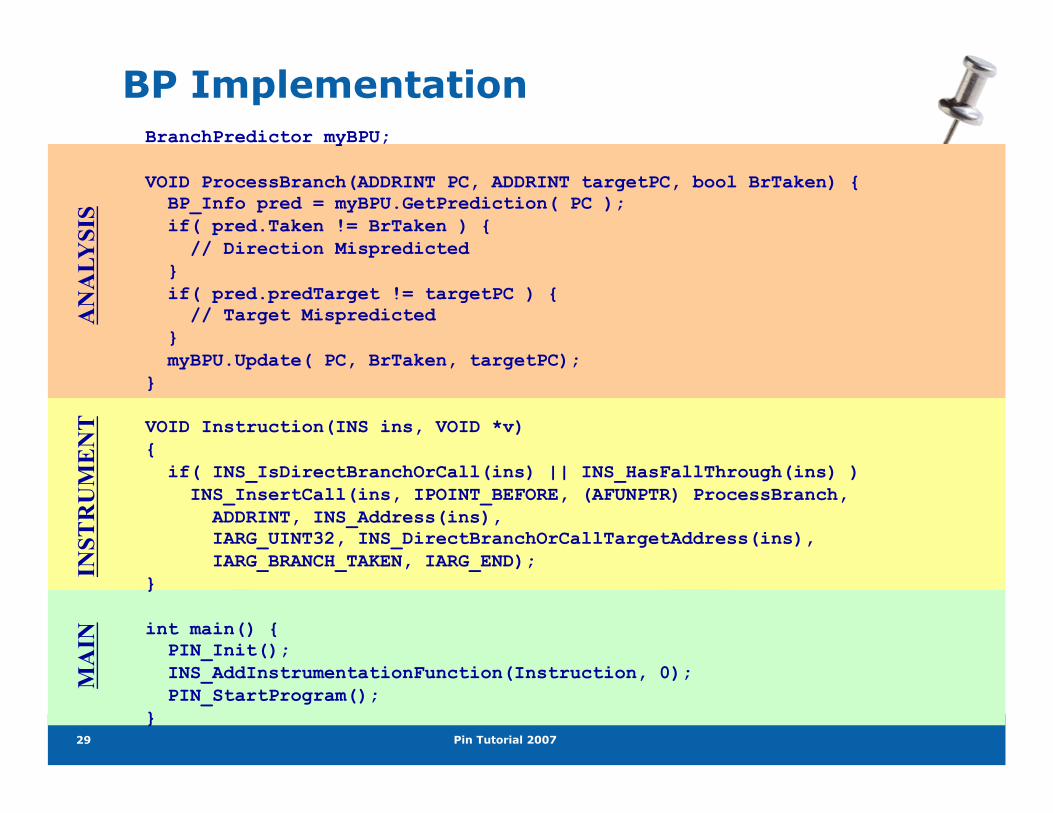
BranchPredictor myBPU;
VOID ProcessBranch(ADDRINT PC, ADDRINT targetPC, bool BrTaken) { BP_Info pred = myBPU.GetPrediction( PC ); if( pred.Taken != BrTaken ) { // Direction Mispredicted } if( pred.predTarget != targetPC ) { // Target Mispredicted } myBPU.Update( PC, BrTaken, targetPC); }
VOID Instruction(INS ins, VOID *v) { if( INS_IsDirectBranchOrCall(ins) || INS_HasFallThrough(ins) ) INS_InsertCall(ins, IPOINT_BEFORE, (AFUNPTR) ProcessBranch, ADDRINT, INS_Address(ins), IARG_UINT32, INS_DirectBranchOrCallTargetAddress(ins), IARG_BRANCH_TAKEN, IARG_END); }
int main() { PIN_Init(); INS_AddInstrumentationFunction(Instruction, 0); PIN_StartProgram(); }
INST
RU
ME
NT
BP Implementation A
NA
LYSI
S M
AIN
Pin Tutorial 2007 30
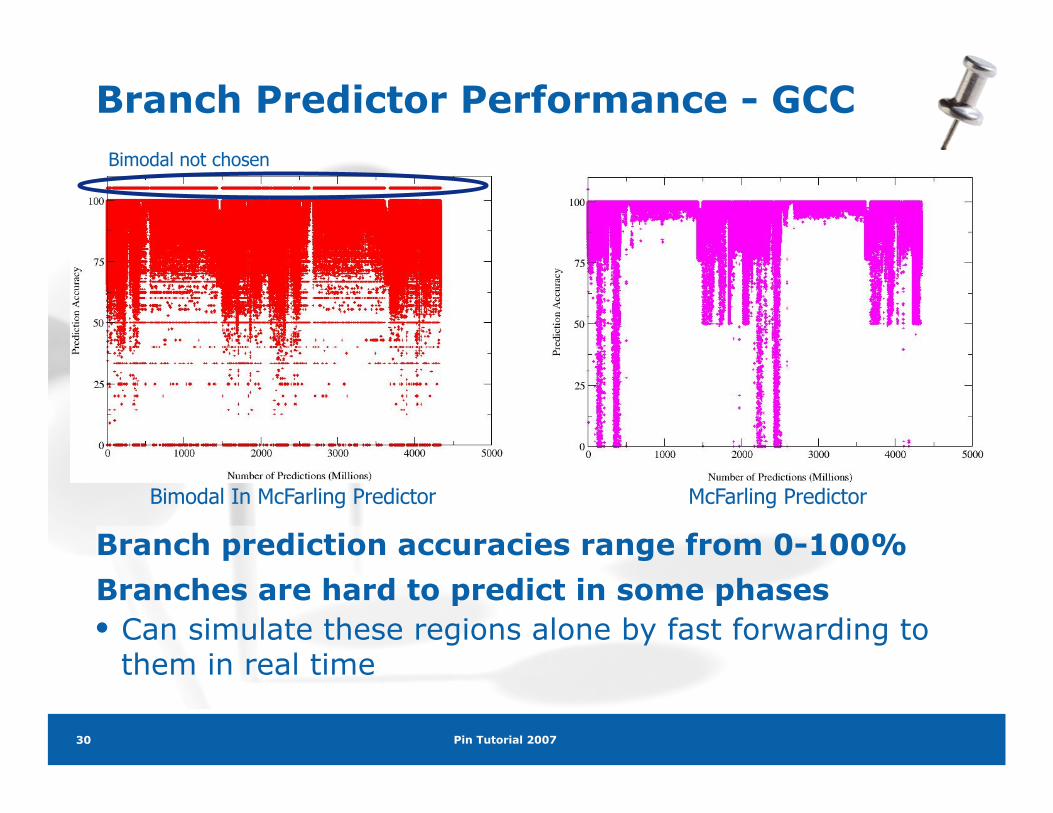
Branch prediction accuracies range from 0-100% Branches are hard to predict in some phases • Can simulate these regions alone by fast forwarding to
them in real time
Bimodal In McFarling Predictor McFarling Predictor
Bimodal not chosen
Branch Predictor Performance - GCC

Pin Tutorial 2007 31
Performance Model Inputs
Branch Predictor Models: • PC of conditional instructions • Direction Predictor: Taken/not-taken information • Target Predictor: PC of target instruction if taken Cache Models: • Thread ID (if multi-threaded workload) • Memory address • Size of memory operation • Type of memory operation (Read/Write) Simple Timing Models: • Latency information
Pin Tutorial 2007 32
Cache Model
Cache Pin Tool
Pin
Instrumentation Routines Analysis Routines Instrumentation Tool
API()
Mem Addr info API data
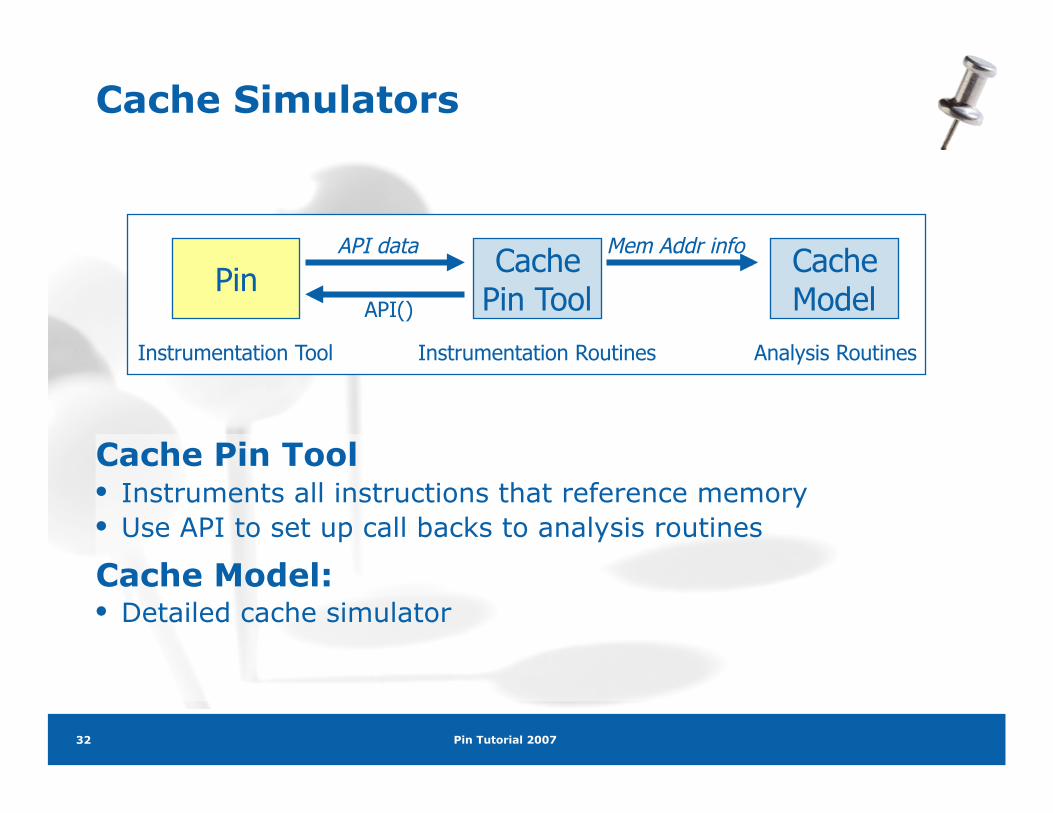
Cache Pin Tool • Instruments all instructions that reference memory • Use API to set up call backs to analysis routines
Cache Model: • Detailed cache simulator
Cache Simulators
Pin Tutorial 2007 33
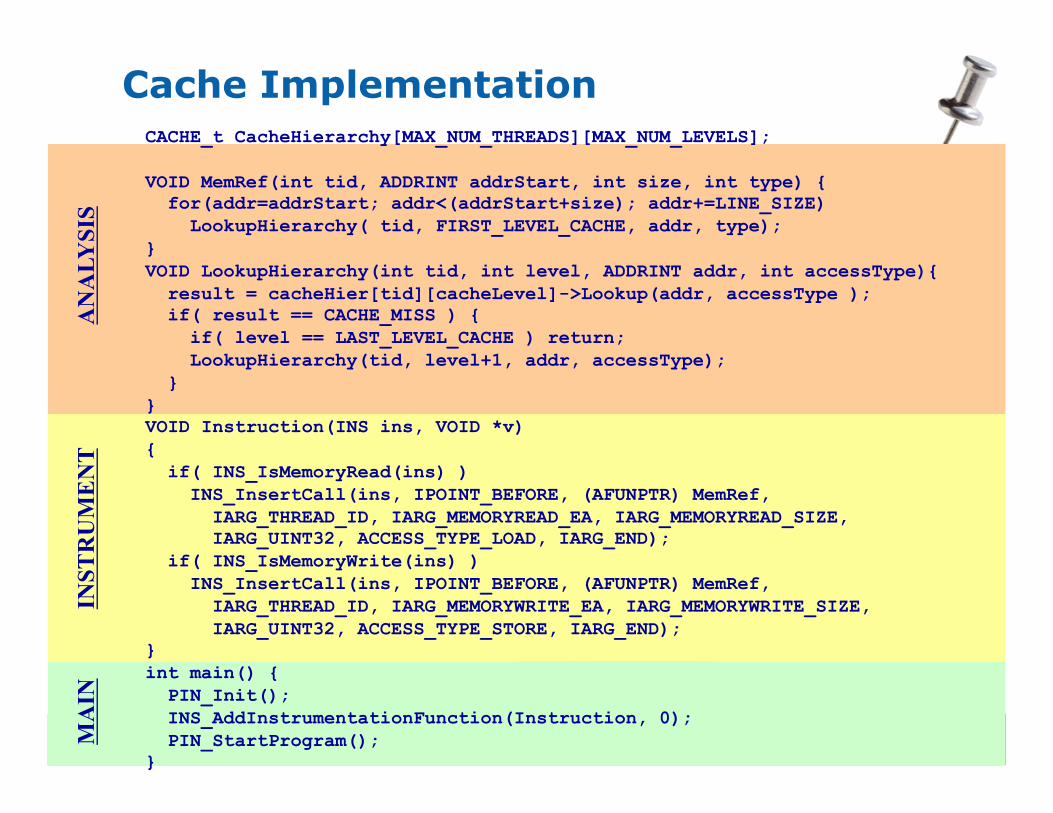
CACHE_t CacheHierarchy[MAX_NUM_THREADS][MAX_NUM_LEVELS];
VOID MemRef(int tid, ADDRINT addrStart, int size, int type) { for(addr=addrStart; addr<(addrStart+size); addr+=LINE_SIZE) LookupHierarchy( tid, FIRST_LEVEL_CACHE, addr, type); } VOID LookupHierarchy(int tid, int level, ADDRINT addr, int accessType){ result = cacheHier[tid][cacheLevel]->Lookup(addr, accessType ); if( result == CACHE_MISS ) { if( level == LAST_LEVEL_CACHE ) return; LookupHierarchy(tid, level+1, addr, accessType); } } VOID Instruction(INS ins, VOID *v) { if( INS_IsMemoryRead(ins) ) INS_InsertCall(ins, IPOINT_BEFORE, (AFUNPTR) MemRef, IARG_THREAD_ID, IARG_MEMORYREAD_EA, IARG_MEMORYREAD_SIZE, IARG_UINT32, ACCESS_TYPE_LOAD, IARG_END); if( INS_IsMemoryWrite(ins) ) INS_InsertCall(ins, IPOINT_BEFORE, (AFUNPTR) MemRef, IARG_THREAD_ID, IARG_MEMORYWRITE_EA, IARG_MEMORYWRITE_SIZE, IARG_UINT32, ACCESS_TYPE_STORE, IARG_END); } int main() { PIN_Init(); INS_AddInstrumentationFunction(Instruction, 0); PIN_StartProgram(); }
INST
RU
ME
NT
Cache Implementation A
NA
LYSI
S M
AIN
Pin Tutorial 2007 34
Performance Models
Branch Predictor Models: • PC of conditional instructions • Direction Predictor: Taken/not-taken information • Target Predictor: PC of target instruction if taken Cache Models: • Thread ID (if multi-threaded workload) • Memory address • Size of memory operation • Type of memory operation (Read/Write) Simple Timing Models: • Latency information
Pin Tutorial 2007 35
Simple Timing Model
α = instruction count; β = # branch mispredicts ; Al = # accesses to cache level l ; η = # last level cache (LLC) misses
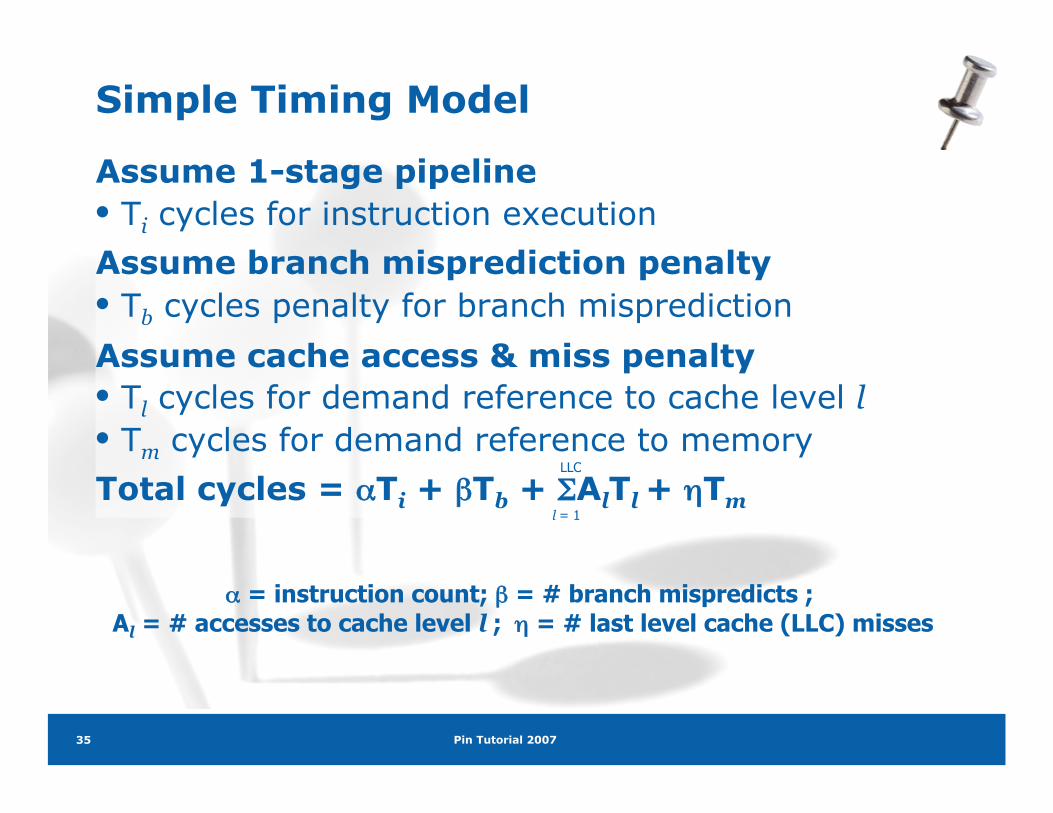
Assume 1-stage pipeline • Ti cycles for instruction execution Assume branch misprediction penalty • Tb cycles penalty for branch misprediction Assume cache access & miss penalty • Tl cycles for demand reference to cache level l • Tm cycles for demand reference to memory Total cycles = αTi + βTb + ΣAlTl + ηTm
LLC
l = 1
Pin Tutorial 2007 36
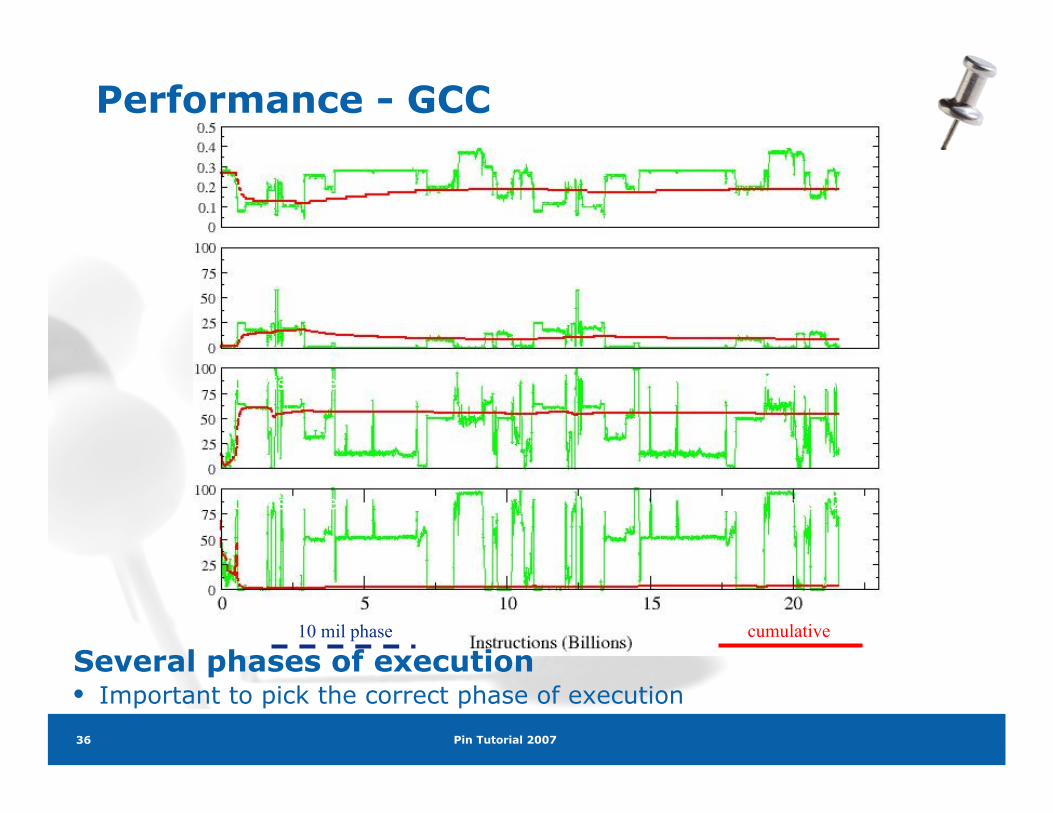
cumulative 10 mil phase
IPC
L1 Miss Rate
L2 Miss Rate
L3 Miss Rate
2-way 32KB
4-way 256KB
8-way 2MB
Several phases of execution • Important to pick the correct phase of execution
Performance - GCC
Pin Tutorial 2007 37
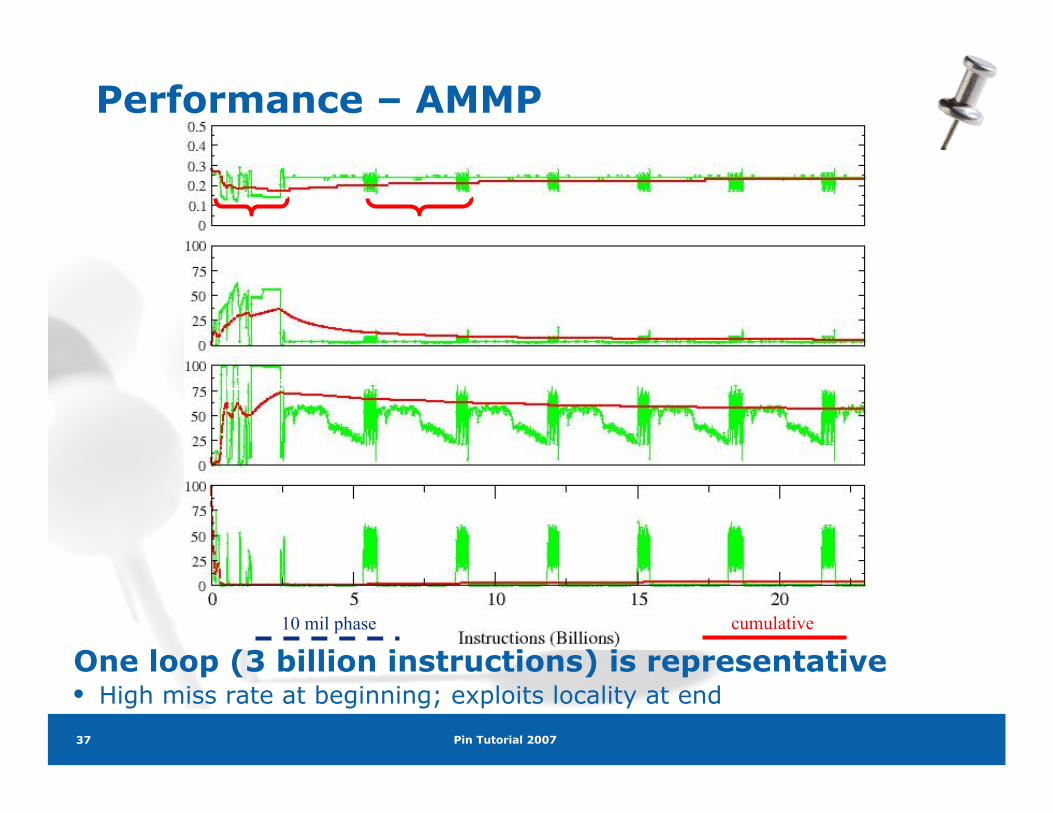
IPC
L1 Miss Rate
L2 Miss Rate
L3 Miss Rate
cumulative 10 mil phase
2-way 32KB
4-way 256KB
8-way 2MB
init repetitive
One loop (3 billion instructions) is representative • High miss rate at beginning; exploits locality at end
Performance – AMMP
Pin Tutorial 2007 38
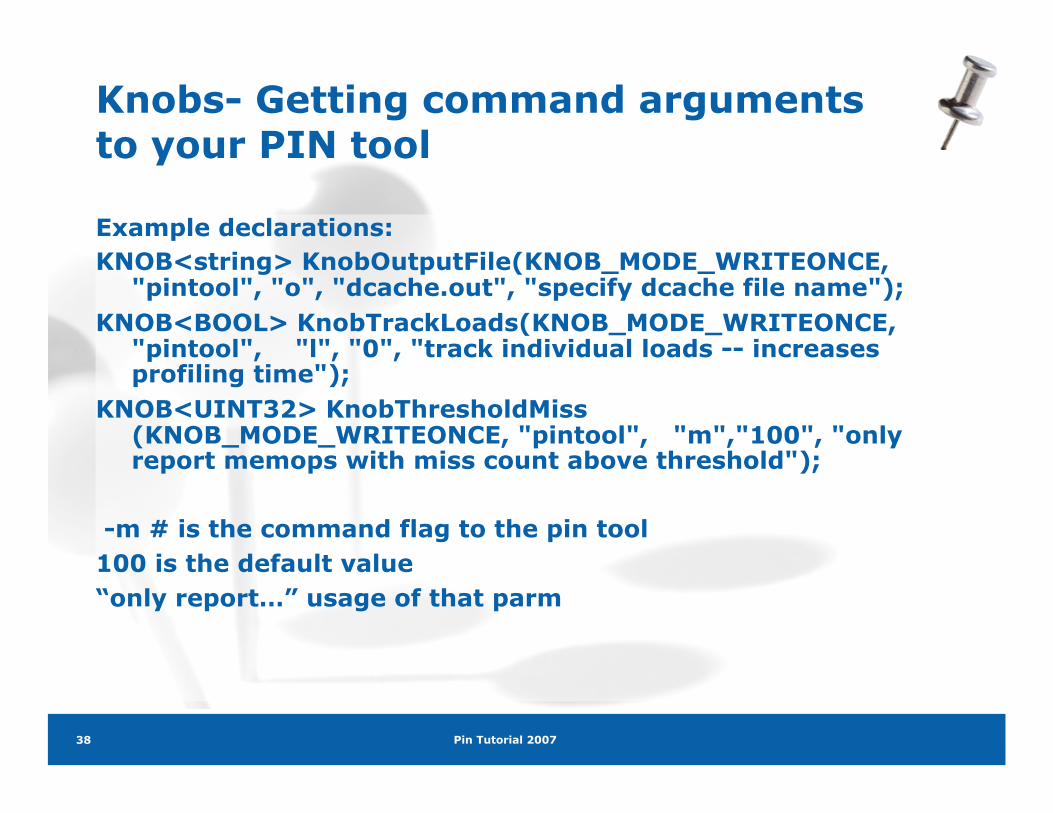
Knobs- Getting command arguments to your PIN tool
Example declarations: KNOB<string> KnobOutputFile(KNOB_MODE_WRITEONCE,
"pintool", "o", "dcache.out", "specify dcache file name"); KNOB<BOOL> KnobTrackLoads(KNOB_MODE_WRITEONCE,
"pintool", "l", "0", "track individual loads -- increases profiling time");
KNOB<UINT32> KnobThresholdMiss(KNOB_MODE_WRITEONCE, "pintool", "m","100", "only report memops with miss count above threshold");
-m # is the command flag to the pin tool 100 is the default value “only report…” usage of that parm
Pin Tutorial 2007 39
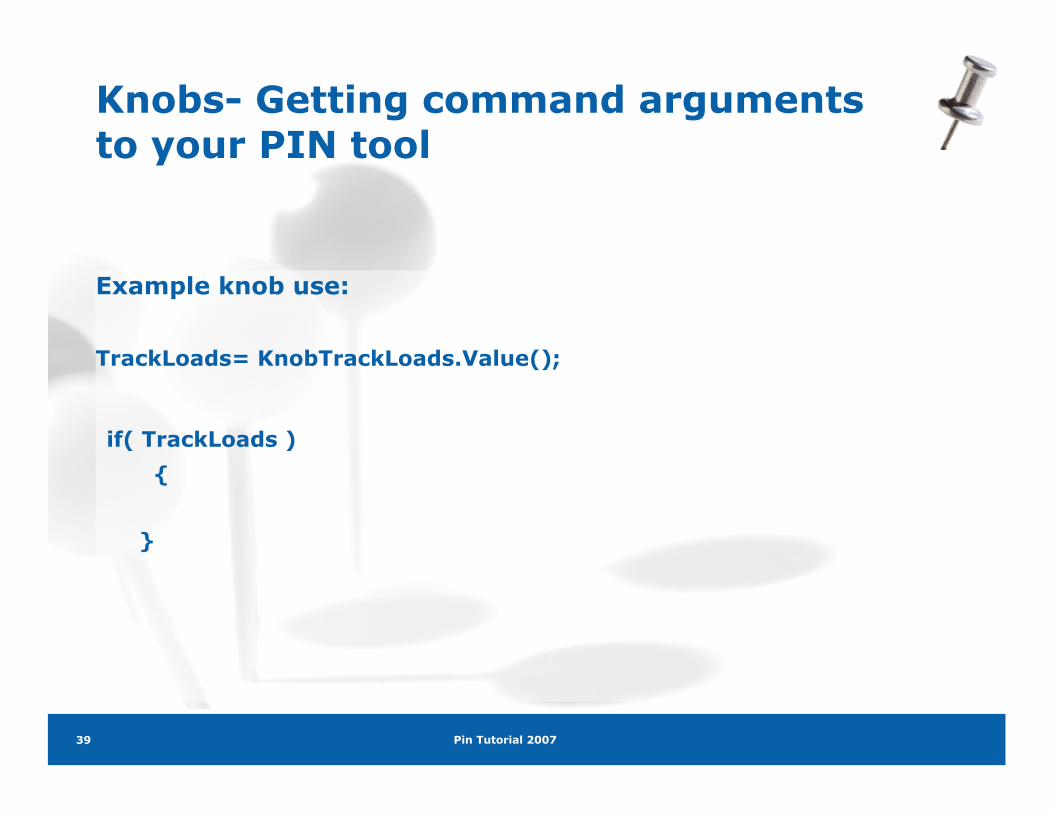
Knobs- Getting command arguments to your PIN tool
Example knob use:
TrackLoads= KnobTrackLoads.Value();
if( TrackLoads ) {
}
Recommended