Embed Size (px)
Citation preview

Instrumentation of Linux Programs with Pin
Robert Cohn & C-K Luk
Platform Technology & Architecture DevelopmentEnterprise Platform Group
Intel Corporation
http://rogue.colorado.edu/Pin
ASPLOS’04 2Pin Tutorial
PeopleKim Hazelwood CetteiRobert CohnArtur KlauserGeoff LowneyCK LukRobert MuthHarish PatilVijay Janapa ReddiSteven Wallace

ASPLOS’04 3Pin Tutorial
What is Instrumentation?Max = 0;for (p = head; p; p = p->next){
if (p->value > max){
max = p->value;}
}
count[0]++;
count[1]++;printf(“In Loop\n”);
printf(“In max\n”);
User defined

ASPLOS’04 4Pin Tutorial
What can Instrumentation do?• Profiler for compiler optimization:
– Basic-block count– Value profile
• Micro architectural study:– Instrument branches to simulate branch predictors– Generate traces
• Bug checking:– Find references to uninitialized, unallocated data
• Software tools that use instrumentation:– Purify, Valgrind, Vtune

ASPLOS’04 5Pin Tutorial
Dynamic Instrumentation• Pin uses dynamic instrumentation
– Instrument code when it is executed the first time
• Many advantages over static instrumentation:– No need of a separate instrumentation pass– Can instrument all user-level codes executed
• Shared libraries• Dynamically generated code
– Easy to distinguish code and data– Instrumentation can be turned on/off– Can attach and instrument an already running process

ASPLOS’04 6Pin Tutorial
Execution-driven Instrumentation
2 3
1
7
4 5
67’
2’
1’
Compiler
Originalcode
Codecache

ASPLOS’04 7Pin Tutorial
Execution-driven Instrumentation
2 3
1
7
4 5
67’
2’
1’
Compiler
Originalcode
Codecache
3’
5’
6’

ASPLOS’04 8Pin Tutorial
Transparent Instrumentation• Pin’s instrumentation is transparent:
– Application itself sees the same:• Code addresses
• Data addresses
• Memory content
– Instrumentation sees the original application:• Code addresses
• Data address
• Memory content Observe original app. behavior, won’t expose latent bugs

ASPLOS’04 9Pin Tutorial
Instruction-level Instrumentation• Instrument relative to an instruction:
– Before– After:
• Fall-through edge• Taken edge (if it is a branch)
cmp %esi, %edx
jle <L1>
mov $0x1, %edi
<L1>: mov $0x8,%edi
count(10)
count(30)
count(20)
ASPLOS’04 10Pin Tutorial
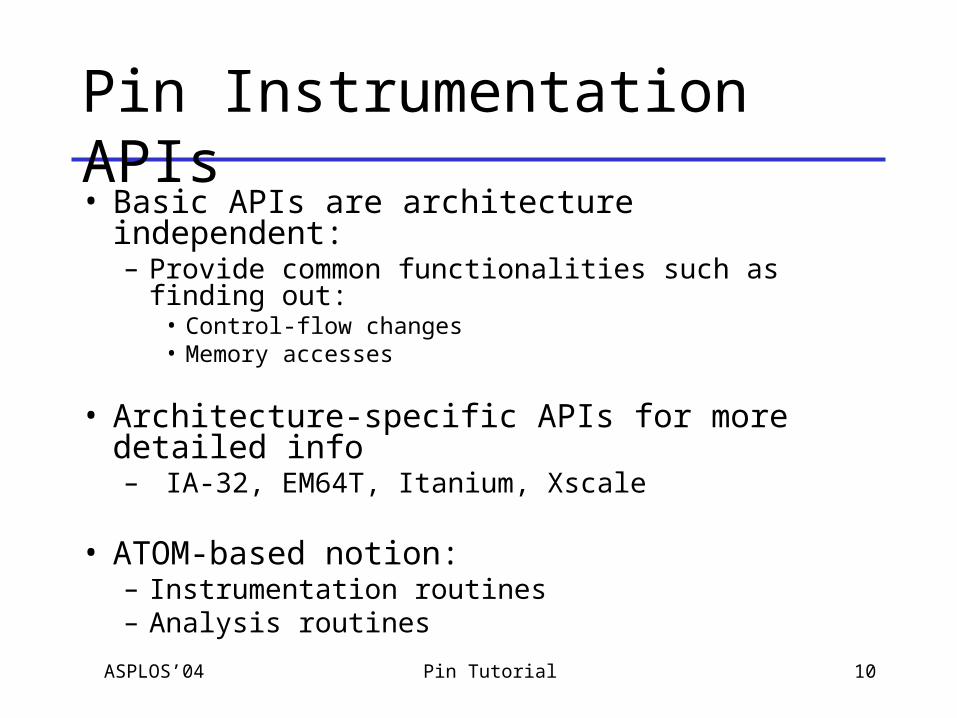
Pin Instrumentation APIs• Basic APIs are architecture independent:
– Provide common functionalities such as finding out:• Control-flow changes• Memory accesses
• Architecture-specific APIs for more detailed info– IA-32, EM64T, Itanium, Xscale
• ATOM-based notion:– Instrumentation routines– Analysis routines

ASPLOS’04 11Pin Tutorial
Instrumentation Routines• User writes instrumentation routines:
– Walk list of instructions, and – Insert calls to analysis routines
• Pin invokes instrumentation routines when placing new instructions in code cache
• Repeated execution uses already instrumented code in code cache

ASPLOS’04 12Pin Tutorial
Analysis Routines
• User inserts calls to analysis routine:– User-specified arguments– E.g., increment counter, record data address, …
• User writes in C, C++, ASM
• Pin provides isolation so analysis does not affect application
• Optimizations like inlining, register allocation, and scheduling make it efficient
ASPLOS’04 13Pin Tutorial
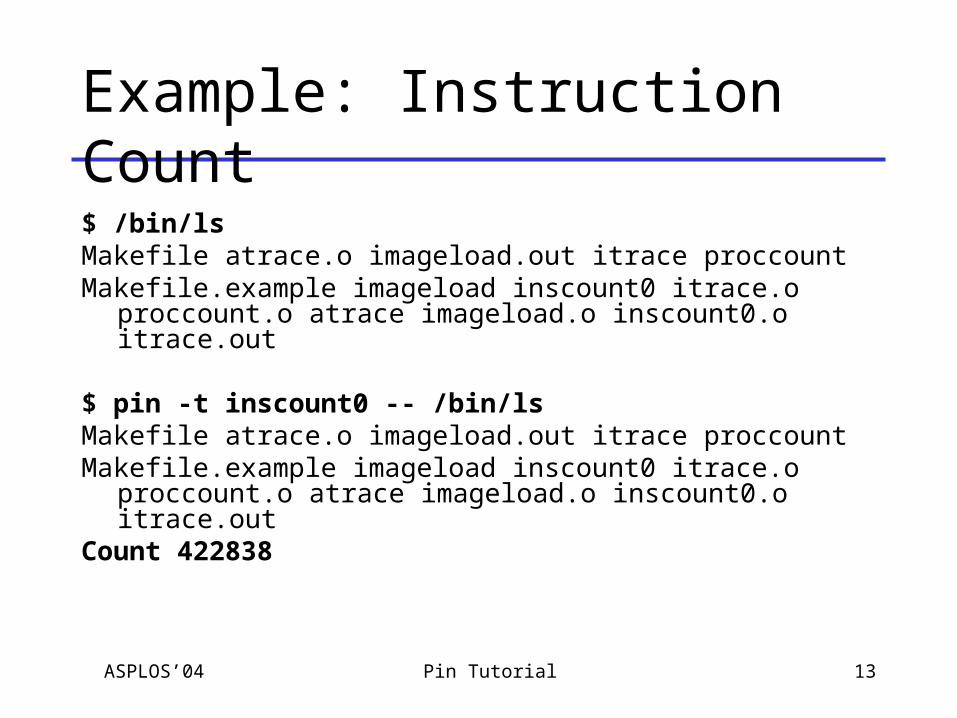
Example: Instruction Count
$ /bin/ls Makefile atrace.o imageload.out itrace proccount Makefile.example imageload inscount0 itrace.o
proccount.o atrace imageload.o inscount0.o itrace.out
$ pin -t inscount0 -- /bin/ls Makefile atrace.o imageload.out itrace proccount Makefile.example imageload inscount0 itrace.o
proccount.o atrace imageload.o inscount0.o itrace.out
Count 422838

ASPLOS’04 14Pin Tutorial
Example: Instruction Count
sub $0xff, %edx
cmp %esi, %edx
jle <L1>
mov $0x1, %edi
add $0x10, %eax
counter++;
counter++;
counter++;
counter++;
counter++;

ASPLOS’04 15Pin Tutorial
#include <iostream>#include "pin.H"
UINT64 icount = 0;
VOID docount() { icount++; } VOID Instruction(INS ins, VOID *v) { INS_InsertCall(ins, IPOINT_BEFORE, (AFUNPTR)docount, IARG_END);}
VOID Fini(INT32 code, VOID *v) { std::cerr << "Count " << icount << endl; }
int main(int argc, char * argv[]){ PIN_Init(argc, argv);
INS_AddInstrumentFunction(Instruction, 0);
PIN_AddFiniFunction(Fini, 0); PIN_StartProgram(); return 0;}
ManualExamples/inscount0.C
instrumentation routine
analysis routine

ASPLOS’04 16Pin Tutorial
Example: Instruction Trace
$ pin -t itrace -- /bin/ls Makefile atrace.o imageload.out itrace proccount Makefile.example imageload inscount0 itrace.o proccount.o atrace imageload.o inscount0.o itrace.out
$ head itrace.out 0x40001e90 0x40001e91 0x40001ee4 0x40001ee5 0x40001ee7 0x40001ee8 0x40001ee9 0x40001eea 0x40001ef0 0x40001ee0
ASPLOS’04 17Pin Tutorial
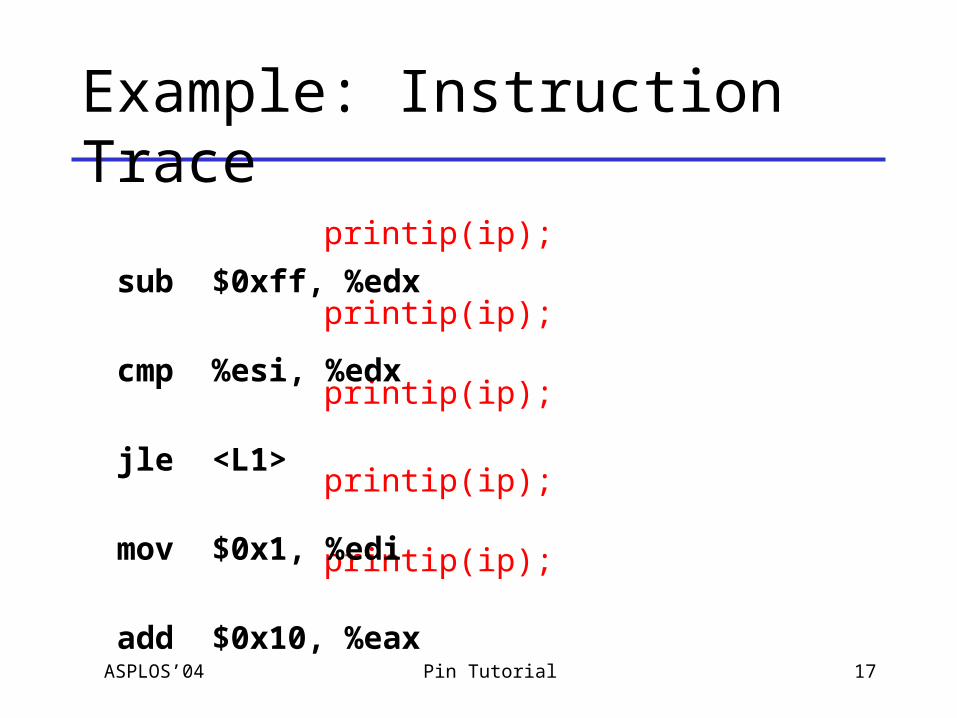
Example: Instruction Trace
printip(ip);
printip(ip);
printip(ip);
printip(ip);
printip(ip);
sub $0xff, %edx
cmp %esi, %edx
jle <L1>
mov $0x1, %edi
add $0x10, %eax

ASPLOS’04 18Pin Tutorial
#include <stdio.h>#include "pin.H"
FILE * trace;VOID printip(VOID *ip) { fprintf(trace, "%p\n", ip); }
VOID Instruction(INS ins, VOID *v) { INS_InsertCall(ins, IPOINT_BEFORE, (AFUNPTR)printip,
IARG_INST_PTR, IARG_END);}
int main(int argc, char * argv[]) { trace = fopen("itrace.out", "w"); PIN_Init(argc, argv);
INS_AddInstrumentFunction(Instruction, 0); PIN_StartProgram();
return 0;}
ManualExamples/itrace.C
analysis routine argument

ASPLOS’04 19Pin Tutorial
Arguments to Analysis RoutineSome examples:
• IARG_UINT32 <value>– An integer value
• IARG_REG_VALUE <register name>– Value of the register specified
• IARG_INST_PTR– Instruction pointer (program counter) value
• IARG_BRANCH_TAKEN– A non-zero value if the branch instrumented is taken
• IARG_BRANCH_TARGET_ADDR– Target address of the branch instrumented
• IARG_G_ARG0_CALLER– 1st general-purpose function argument, as seen by the caller
• IARG_MEMORY_READ_EA– Effective address of a memory read
• IARG_END– Must be the last in IARG list
ASPLOS’04 20Pin Tutorial
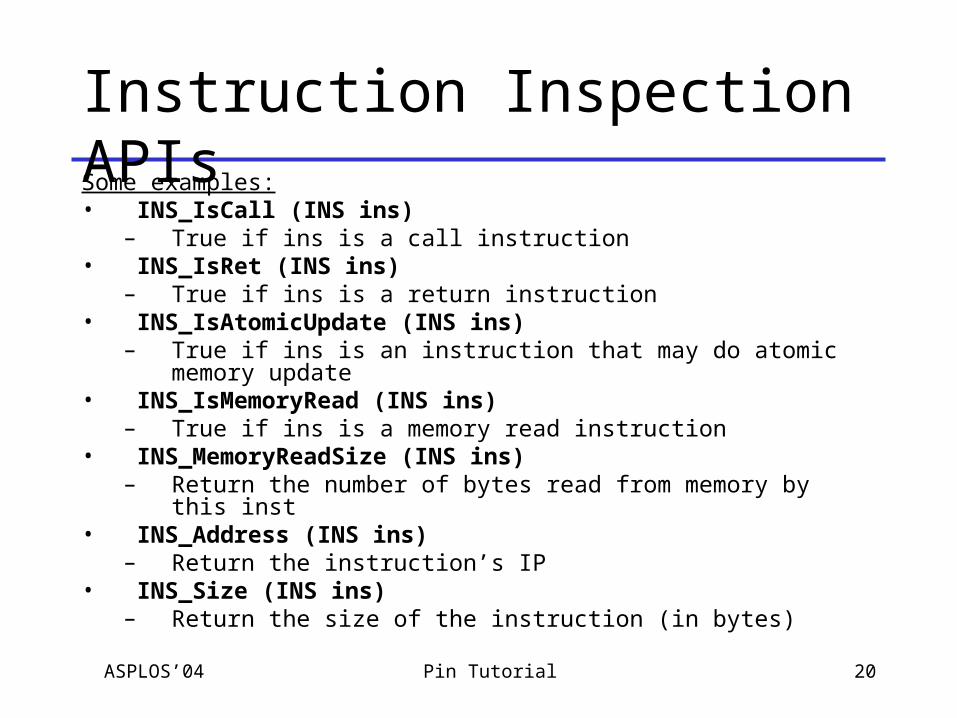
Instruction Inspection APIs Some examples:• INS_IsCall (INS ins)
– True if ins is a call instruction• INS_IsRet (INS ins)
– True if ins is a return instruction• INS_IsAtomicUpdate (INS ins)
– True if ins is an instruction that may do atomic memory update• INS_IsMemoryRead (INS ins)
– True if ins is a memory read instruction• INS_MemoryReadSize (INS ins)
– Return the number of bytes read from memory by this inst• INS_Address (INS ins)
– Return the instruction’s IP• INS_Size (INS ins)
– Return the size of the instruction (in bytes)

ASPLOS’04 21Pin Tutorial
Example: Faster Instruction Count
sub $0xff, %edx
cmp %esi, %edx
jle <L1>
mov $0x1, %edi
add $0x10, %eax
counter++;counter++;
counter++;
counter++;
counter++;
counter += 3
counter += 2

ASPLOS’04 22Pin Tutorial
#include <stdio.h>#include "pin.H“
UINT64 icount = 0;
VOID docount(INT32 c) { icount += c; }
VOID Trace(TRACE trace, VOID *v) {for (BBL bbl = TRACE_BblHead(trace);
BBL_Valid(bbl); bbl = BBL_Next(bbl)) {
BBL_InsertCall(bbl, IPOINT_BEFORE, (AFUNPTR)docount,
IARG_UINT32, BBL_NumIns(bbl), IARG_END); }}
VOID Fini(INT32 code, VOID *v) { fprintf(stderr, "Count %lld\n", icount);
}
int main(int argc, char * argv[]) { PIN_Init(argc, argv); TRACE_AddInstrumentFunction(Trace, 0); PIN_AddFiniFunction(Fini, 0); PIN_StartProgram(); return 0;}
ManualExamples/inscount1.C

ASPLOS’04 23Pin Tutorial
Trace• Single-entry, multiple-exit instruction sequence• Create a new trace when a new entry is seen
Programsub $0x5,
%esi
<L2>: add $0x3, %ebx
cmp %esi, %ebx
jnz <L2>
…
Trace 1sub $0x5, %esi
add $0x3, %ebx
cmp %esi, %ebx
jnz <L2>
…
Trace 2
add $0x3, %ebx
cmp %esi, %ebx
jnz <L2>
…
ASPLOS’04 24Pin Tutorial
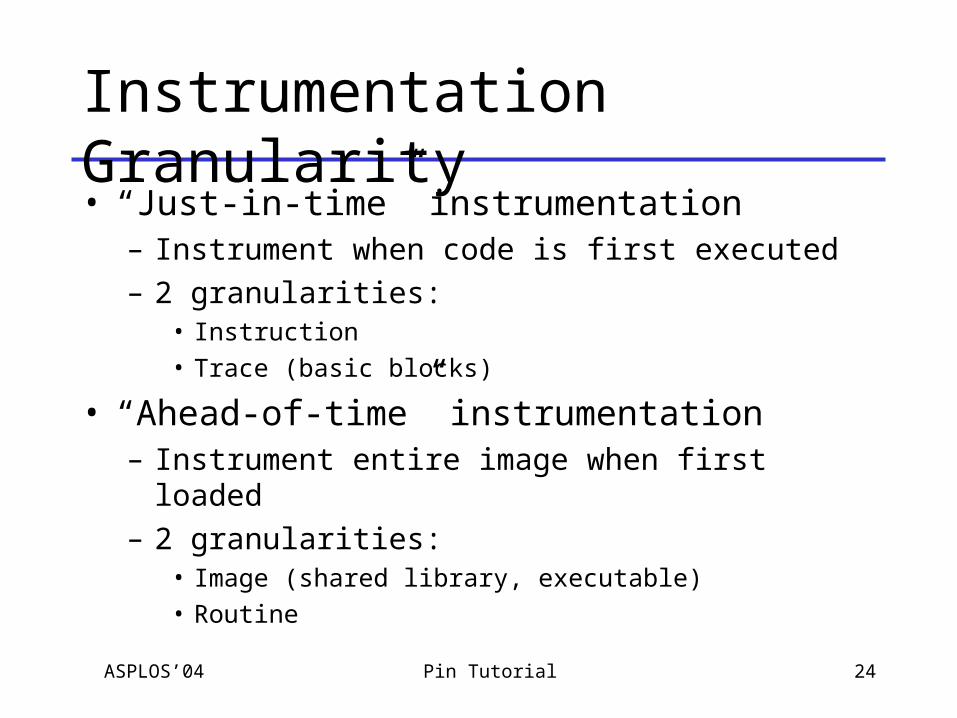
Instrumentation Granularity• “Just-in-time” instrumentation
– Instrument when code is first executed
– 2 granularities:• Instruction
• Trace (basic blocks)
• “Ahead-of-time” instrumentation– Instrument entire image when first loaded
– 2 granularities:• Image (shared library, executable)
• Routine
ASPLOS’04 25Pin Tutorial
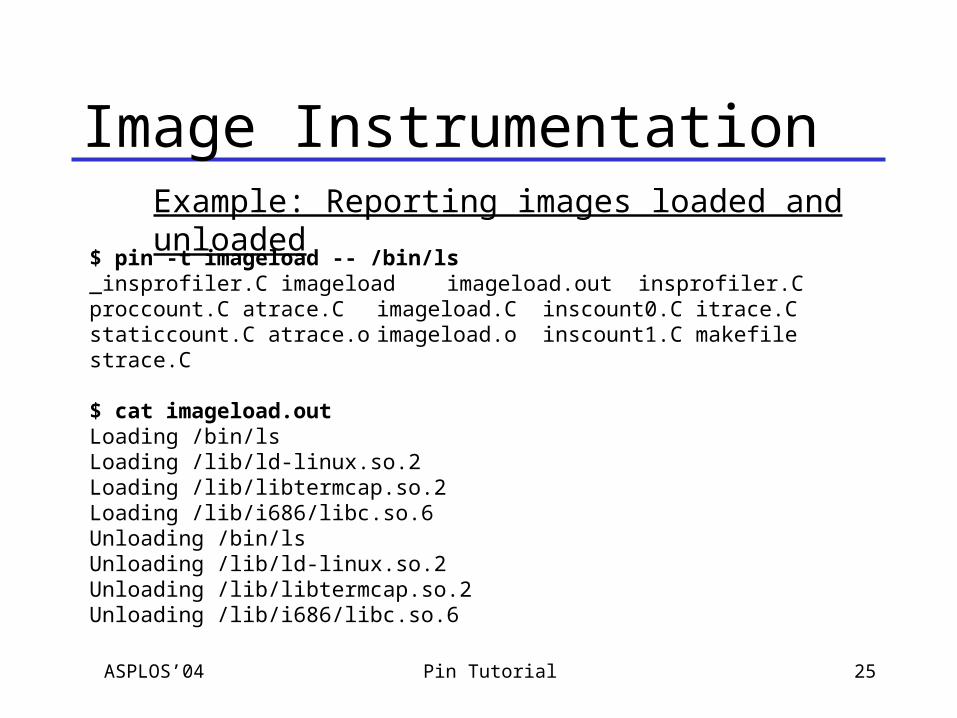
Image Instrumentation
$ pin -t imageload -- /bin/ls_insprofiler.C imageload imageload.out insprofiler.C proccount.C atrace.C imageload.C inscount0.C itrace.C staticcount.C atrace.o imageload.o inscount1.C makefile strace.C
$ cat imageload.out Loading /bin/lsLoading /lib/ld-linux.so.2Loading /lib/libtermcap.so.2Loading /lib/i686/libc.so.6Unloading /bin/lsUnloading /lib/ld-linux.so.2Unloading /lib/libtermcap.so.2Unloading /lib/i686/libc.so.6
Example: Reporting images loaded and unloaded
ASPLOS’04 26Pin Tutorial
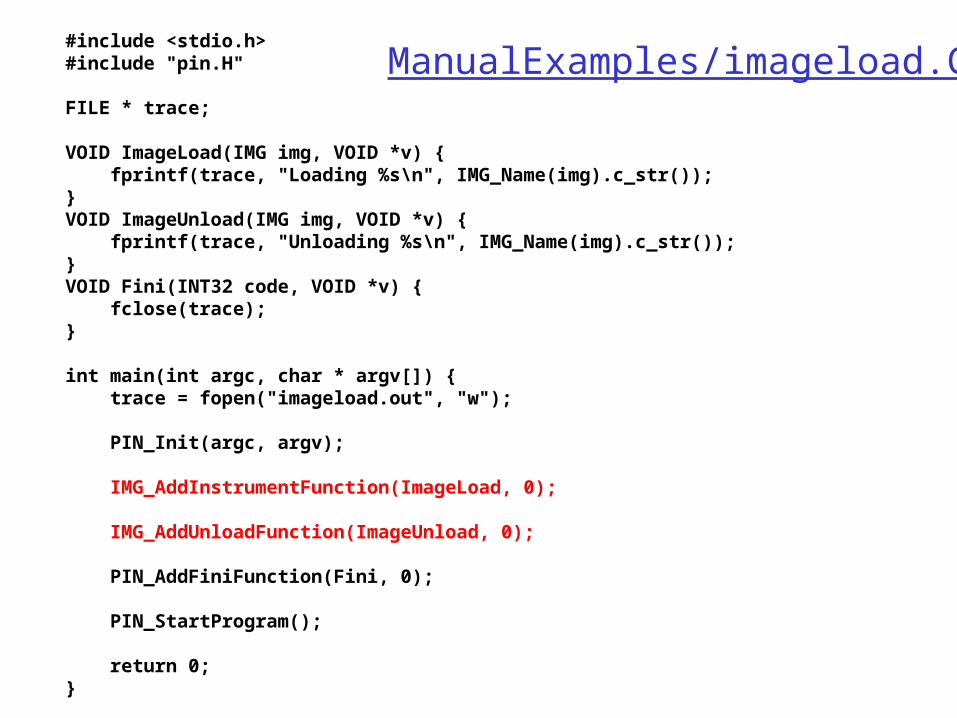
#include <stdio.h>#include "pin.H"
FILE * trace;
VOID ImageLoad(IMG img, VOID *v) { fprintf(trace, "Loading %s\n", IMG_Name(img).c_str());}VOID ImageUnload(IMG img, VOID *v) { fprintf(trace, "Unloading %s\n", IMG_Name(img).c_str());}VOID Fini(INT32 code, VOID *v) { fclose(trace);}
int main(int argc, char * argv[]) { trace = fopen("imageload.out", "w");
PIN_Init(argc, argv);
IMG_AddInstrumentFunction(ImageLoad, 0);
IMG_AddUnloadFunction(ImageUnload, 0);
PIN_AddFiniFunction(Fini, 0); PIN_StartProgram(); return 0;}
ManualExamples/imageload.C

ASPLOS’04 27Pin Tutorial
Routine Instrumentation
VOID Image(IMG img, VOID *v) { RTN mallocRtn = RTN_FindByName(img, "malloc");
if (RTN_Valid(mallocRtn)) { RTN_Open(mallocRtn); // fetch insts in mallocRtn
RTN_InsertCall(mallocRtn, IPOINT_BEFORE, (AFUNPTR)Arg1Before,
IARG_G_ARG0_CALLEE, IARG_END);
RTN_InsertCall(mallocRtn, IPOINT_AFTER, (AFUNPTR)MallocAfter,
IARG_G_RESULT0, IARG_END);
RTN_Close(mallocRtn); }}
SimpleExamples/malloctrace.C
before malloc’s entry
before malloc’s return
1st argument to malloc (#bytes wanted)
1st return value (address allocated)

ASPLOS’04 28Pin Tutorial
Example Pintools• Instruction cache simulation
– Replace itrace’s analysis function
• Data cache simulation– Like I-cache, but instrument loads/stores and pass effective address
• Malloc/Free trace– instrument entry/exit points
• Detect out-of-bound stack references– Instrument instructions that move stack pointer– Instrument loads/stores to check in bound

ASPLOS’04 29Pin Tutorial
Instrumentation Library• Pre-defined C++ classes• Implement common instrumentation tasks:
– Icount• Instruction counting
– Alarm• Trigger on an event (instruction count or IP)
– Controller• Detect start and stop of an interval
– Filter• Skip instrumentation in parts of the program (e.g., ignoring
shared libraries)

ASPLOS’04 30Pin Tutorial
Instrumentation PerformancePerformance of Pin/IA32
112 2
11
184
220
358
120
103
145
390
113 2
11
116
172
156
330
243 332
505
196
115 2
23
598
150
327
139 2
43
0
100
200
300
400
500
600
700
Percen
tag
e (
%)
of
the n
ati
ve r
un
tim
e
Pin without instrumentation Pin with basic-block counting
Performance of Pin/EM64T
107 2
01
187 259 329
118
96 141
519
104
235
111 174
145
295
247 3
47 4
36
164
102 2
04
652
148
365
143 2
34
0
100
200
300
400
500
600
700
Perc
en
tag
e (
%)
of
the n
ati
ve r
un
tim
e
Pin without instrumentation Pin with basic-block counting
Pin’s instrumentation is efficient
ASPLOS’04 31Pin Tutorial
Advanced Topics
• Symbol and debug information
• Hooks
• Detach/Attach
• Modifying program behavior
• Debugging Pintools

ASPLOS’04 32Pin Tutorial
Symbol/Debug Information
• Procedure names: – RTN_Name()
• Shared library names: – IMG_Name()
• File and line number information– PIN_FindLineFileByAddress()

ASPLOS’04 33Pin Tutorial
Hooks• Pintools can catch:
– Shared library load/unload• IMG_AddInstrumentFunction()• IMG_AddUnloadFunction()
– Program end• PIN_AddFiniFunction()
– System calls• INS_IsSyscall()
– Thread create/end• Pin 0 provides call backs for thread create and destroy
• Yet to be done for Pin 2

ASPLOS’04 34Pin Tutorial
Detach/Attach
• Detach from Pin and execute original code– PIN_Detach()
– Restore to full speed after sufficient profiling
• Attach Pin to an already running process– Similar to debugger’s attach
– Command line: “pin –pid 12345 –t inscount0”
– Fast forward to where you want to start profiling

ASPLOS’04 35Pin Tutorial
Modify Program Behavior with Instrumentation
• Analysis routines modify register values– IARG_RETURN_REGS <Reg>
• Instrumentation modifies register operands– add %eax, %ebx => add %eax, %edx
• Use virtual registers– add %eax, %ebx => add %eax, REG_INST_G0
• Modify memory– Pintool in the same address space as the program

ASPLOS’04 36Pin Tutorial
Debugging Pintools1. Invoke gdb with your pintool (but don’t use “run”)
2. On another window, start your pintool with “-pause_tool”
3. Go back to gdb:a) Attach to the process
b) Use “cont” to continue execution; can set breakpoints as usual
(gdb) attach 32017(gdb) break main(gdb) cont
$ pin –pause_tool –t inscount0 -- /bin/lsPausing to attach to pid 32017
$ gdb inscount0(gdb)
ASPLOS’04 37Pin Tutorial
Status
• Pin 0: Itanium-only release 10/2003– Used by Intel, HP, Oracle, many universities
• Pin 2: released 7/15/2004– IA-32, EM64T, Xscale– Debian, Suse, Red Hat 7.2, 8.0, 9.0, EL3– gcc, icc– Over 1000 downloads!

ASPLOS’04 38Pin Tutorial
Future Features
• Instrumentation of multithreaded programs
• Windows port?

ASPLOS’04 39Pin Tutorial
Summary• Pin: dynamic instrumentation framework for Linux
– IA32, EM64T, Itanium, and Xscale– Easy to use, transparent, and efficient
• Lots of sample tools
• Write your own tool!
http://rogue.colorado.edu/Pin

ASPLOS’04 40Pin Tutorial
Acknowledgments
• Prof Dan Connors for providing the website at University of Colorado

ASPLOS’04 41Pin Tutorial
Project Engineering
• Automatic nightly testing– 4 architectures– 6 Linux versions– 8 compilers– 9000 binaries
• Automatically generated user manual, internal documentation using Doxygen