Photocatalytic activity of nanostructured
TiO2/carbon-nanotube composites
for near-UV to visible water treatment
Rita Ruivo Neves Marques
Dissertation presented for the Ph.D. degree in the
Doctoral Program in Chemical and Biological Engineering at the
Faculty of Engineering, University of Porto, Portugal
Supervisors: Joaquim Luís Bernardes Martins de Faria
Adrián Manuel Tavares da Silva
Cláudia Sofia Castro Gomes da Silva
LCM – Laboratory of Catalysis and Materials
Laboratório Associado LSRE/LCM
Departamento de Engenharia Química
Faculdade de Engenharia
Universidade do Porto
Portugal
May 2014


Sempre chegamos ao sítio aonde nos esperam.
[José Saramago]

i
Abstract
Scientific research is deeply committed to water remediation all over the world, with
actual applications even at underdeveloped countries providing primary solutions
with practical results. Heterogeneous photocatalysis has proven effective especially
under real sunlight exposure conditions. Pure TiO2 is the most commonly used
photocatalyst although it does not absorb efficiently visible light, thus affording only
scarce and partial UV usage of the sunlight radiation reaching earth surface.
The original contribution of this work to knowledge in the domain of heterogeneous
photocatalysis technology consists on the development of TiO2 based photocatalysts
with enhanced response towards near-UV to visible radiation, using carbon
nanotubes (CNTs), both single (SWCNTs) and multi-walled (MWCNTs), with their
surfaces chemically modified by the inclusion of oxygen functionalities.
The resulting oxygen moieties promote the interaction of the carbon phase with the
semiconductor TiO2 phase, in particular by means of carboxylic acids and phenols,
shifting the absorption edge of the metal oxide to the visible region of the spectrum.
Controlled creation of oxygen groups in the surface of the CNTs was performed
through hydrothermal oxidation with nitric acid and compared with the most
commonly used boiling acid methods.
The degree of oxygen functionalization was analyzed by Temperature Programmed
Desorption (TPD) and correlated through exponential functions with HNO3
concentration. Along with the reaction temperature these two features are key to
control the process. When the modification on the graphitic nanostructure of CNTs
was analyzed by Raman spectroscopy a correlation with HNO3 concentration was
found, which was in a good agreement with TPD characterization. Comparison with
the traditional boiling acid method shows that the hydrothermal approach is a
competitive solution with equivalent level of surface functionalization using much
lower amounts of oxidizing agent and reducing amorphous carbon deposits on the
CNTs surface. However, boiling oxidation provided higher amounts of carboxylic acid
functionalities, namely on MWCNTs surface, which are of particular interest for the
synthesis of TiO2 based composite materials for photocatalytic applications.

ii
Photocatalytic oxidative degradation of aqueous caffeine, chosen as model
compound for the assessment of catalytic activity, was studied by testing composites
prepared with different loads of MWCNTs and different TiO2 powders. The activity of
the semiconductors could be enhanced in combination with the carbon phase, in
particular with CNTs previously functionalized by nitric acid boiling oxidation bonded
to the commercial TiO2 purchased from Sigma-Aldrich (SA). Films prepared with
these composites and deposited in thin glass slides were tested for the degradation
of caffeine reaching higher photocatalytic activity than those prepared with the
benchmark P25, representing a good promise for industrial applications.
A photocatalytic setup for pollutant abatement was built. The apparatus was
developed, assembled and validated through optical characterization and
photodegradation studies. Optical accessories like an optical window, a biconvex
lens and optical filters were applied to provide optimum irradiation usage by focusing
the light beam over the photocatalytic reactor in the desired range of wavelengths.
An optimum configuration was defined based on caffeine photodegradation using
suspensions of benchmark P25 (Evonik/Degussa). The current setup is set to study
photocatalytic oxidation reactions in aqueous systems, either with suspensions or
supported catalysts under different irradiating conditions with optimized usage of the
emitted electromagnetic radiation in the near-UV to visible range.

iii
Resumo
A pesquisa científica está profundamente comprometida com a questão do
tratamento da água em todo o mundo, com aplicações reais que fornecem resultados
práticos usando métodos muito rudimentares, sobretudo em países
subdesenvolvidos. A fotocatálise heterogénea tem-se mostrado eficaz,
nomeadamente em situações de forte exposição à luz solar. O dióxido de titânio
(TiO2) é o catalisador mais frequentemente utilizado neste processo apesar da sua
baixa eficiência na absorção de radiação visível, conduzindo a um aproveitamento
apenas parcial de uma pequena quantidade da radiação Ultra-Violeta (UV) que
chega à superfície da terra, proveniente do Sol.
A contribuição original deste trabalho para o conhecimento no domínio da tecnologia
associada à fotocatálise heterogénea consiste no desenvolvimento de
fotocatalisadores à base de TiO2 com elevada fotoeficiência sob ação da radiação
electromagnética na gama do UV-próximo ao visível, usando para o efeito nanotubos
de carbono (CNTs), quer de parede simples (SWCNT), quer de parede múltipla
(MWCNT), sendo a sua superfície previamente modificada pela inclusão de grupos
funcionais contendo oxigénio.
Estes grupos oxigenados promovem a interacção entre a fase de carbono e a fase
do semicondutor TiO2, em particular através dos grupos ácido carboxílico e fenólico,
deslocando a banda de absorção do óxido metálico para a região do visível do
espectro electromagnético. A geração controlada de grupos oxigenados na
superfície dos CNTs foi realizada através de um método hidrotérmico usando ácido
nítrico (HNO3) e comparada com os métodos mais frequentemente utilizados que
consistem na oxidação com ácido nítrico fervente.
O grau de funcionalização nos CNT foi analisado por desorção a temperatura
programada (TPD) e correlacionado através de funções matemáticas exponenciais
com a concentração de ácido nítrico. Juntamente com a temperatura de reacção,
estes dois são parâmetros chave no controlo do processo. Foram também
estabelecidas correlações matemáticas para a dependência do grau de modificação
observado na estrutura grafítica dos CNT (analisada à escala nanométrica por

iv
espectroscopia de Raman) em função da concentração de HNO3. Os resultados
obtidos mostraram ser concordantes com a caracterização obtida por TPD. Ao
comparar com o método tradicional de oxidação com HNO3 fervente, foi possível
concluir que o tratamento hidrotérmico representa uma solução competitiva
proporcionando um grau de funcionalização equivalente, mas faz uso de
quantidades muito inferiores de agente oxidante, e reduz os depósitos de carbono
amorfo na superfície dos CNTs. No entanto, a oxidação pelo método de HNO3
fervente resulta numa maior densidade de grupos ácido carboxílico, nomeadamente
na superfície de MWCNT, que são de particular interesse para a síntese de
compósitos com TiO2 para aplicações fotocatalíticas.
A cafeína foi escolhida como composto modelo para o estudo da actividade dos
fotocatalisadores preparados. A sua degradação por oxidação fotocatalítica foi
estudada com compósitos preparados com diferentes quantidades de MWCNT e
TiO2 de diferentes naturezas. A actividade dos semicondutores aumentou quando
combinada com a fase de carbono, em particular quando foram usados CNTs
previamente funcionalizados pelo método de HNO3 fervente e um TiO2 comercial
(Sigma-Aldrich). Filmes destes compósitos foram preparados, depositados em
lamelas de vidro, e testados na degradação da cafeína tendo-se observado uma
eficiência fotocataítica superior àquela obtida com filmes do TiO2 comercial de
referência P25 (Evonik/Degussa), o que representa uma solução promissora para
aplicações industriais.
Na fase final do trabalho foi construído um sistema fotocatalítico para a degradação
de poluentes em fase líquida. O sistema foi desenvolvido, montado e validado
através de caracterização óptica e de estudos de fotodegradação. Com o objectivo
de fazer uma utilização optimizada da fonte luminosa na gama de radiação desejada,
foram usados acessórios ópticos para minimizar os efeitos de dispersão e melhor
dirigir o feixe de luz sobre o reactor fotocatalítico. A melhor configuração foi definida
com base nos estudos de degradação da cafeína com suspensões do fotocatalisador
comercial de referência P25. O sistema que foi desenvolvido está preparado para a
realização de estudos de degradação fotocatalítica em sistemas aquosos, seja em
suspensões ou com catalisadores suportados, sob diferentes condições de
irradiação, com o uso optimizado da radiação electromagnética emitida na região do
UV-visível.

v
Agradecimentos
A realização deste trabalho foi possível com a contribuição de várias pessoas a quem
gostaria de agradecer.
Em especial ao meu orientador, o Professor Doutor Joaquim Faria, pela supervisão deste
trabalho, pela ajuda na discussão científica e, algumas vezes, filosófica dos meus
resultados. Também pelo exemplo de espírito de equipa e pela honesta amizade.
Aos meus co-orientadores, o Doutor Adrián Silva e a Doutora Cláudia Silva, pelo
empenho incondicional no meu trabalho e por todos os ensinamentos humanos que
vão muito para além da investigação científica e que tanto para ela contribuem.
Ao Professor Doutor José Luís Figueiredo por ter disponibilizado todos os recursos
técnicos do Laboratório de Catálise e Materiais, do qual é director.
A todos os meus colegas de laboratório, em especial à Maria José Sampaio e ao
Ricardo Segundo, com quem partilhei muito mais do que ciência nestes últimos anos.
Também à Luísa Pastrana-Martínez, à Maria José Sampaio e à Raquel Rocha pela
partilha de resultados complementares que ajudaram à discussão deste trabalho.
Ao Doutor Polycarpos Falaras do Institute of Advanced Materials em Atenas
(NCSR Demokritos), pela colaboração na caracterização dos meus materiais e
respectiva discussão científica.
Ao Doutor Goran Dražić, do Jožef Stefan Institute em Ljubljana, pela ajuda na
realização das análises de HRTEM. Ao Professor Pedro Tavares do Departamento
de Química da UTAD pela realização e ajuda na discussão de resultados das
análises de XRD.
À Fundação para a Ciência e a Tecnologia pelo financiamento através da bolsa
SFRH/BD/65425/2009.
Aos meus amigos, em especial à Ana Marques pela constância inabalável.
Finalmente, à minha mãe e ao meu pai, Judite e Fernando, ao meu irmão João e à
minha avó Lucília. Por tudo, sempre!

vii
Table of Contents
Abstract........................................................................................................................ i
Resumo ..................................................................................................................... iii
Agradecimentos .......................................................................................................... v
Table of Contents ..................................................................................................... vii
List of Figures .......................................................................................................... xiii
List of Tables ........................................................................................................... xix
Glossary................................................................................................................... xxi
Part I - Thesis Motivation ......................................................................................... 3
1 State of the art ..................................................................................................... 5
1.1 Environmental concerns in Europe: Water pollution .................................. 5
1.2 Semiconductor photocatalysis: an Advanced Oxidation Process for
wastewater treatment .............................................................................................. 7
1.2.1 Reaction mechanism in heterogeneous photocatalysis ......................... 7
1.2.2 Titanium dioxide photocatalyst ............................................................... 8
1.3 Improving the photo-efficiency of the semiconductor TiO2 .......................10
1.3.1 TiO2/CNT composites and photo-activation mechanism ......................10
1.3.2 Carbon nanotubes and surface chemistry modification .......................14
1.4 Objectives and thesis outline ....................................................................17
1.5 References ...............................................................................................19
Part II - Experimental Setups and Analytical Techniques ..................................39
2 Experimental Setups .........................................................................................41
2.1 Experimental Setups used for CNTs functionalization .............................43
2.1.1 CNTs hydrothermal functionalization with HNO3 ..................................43
2.1.2 CNTs boiling oxidation with HNO3 ........................................................44
2.2 Experimental Setups used for photocatalytic studies ...............................44
2.2.1 Immersion reactor .................................................................................44
2.2.2 Reactor with external light source ........................................................45

viii
2.3 References............................................................................................... 46
3 Analytical Techniques ...................................................................................... 49
3.1 Materials characterization ........................................................................ 51
3.1.1 Temperature Programmed Desorption (TPD) ..................................... 51
3.1.2 Thermogravimetric Analysis (TGA)...................................................... 51
3.1.3 Water vapor adsorption/desorption...................................................... 52
3.1.4 Nitrogen adsorption isotherms (N2 isotherms) ..................................... 52
3.1.5 Raman spectroscopy ........................................................................... 52
3.1.6 Diffuse reflectance UV-Vis (DRUV) spectroscopy ............................... 53
3.1.7 Diffuse reflectance infrared Fourier transformed (DRIFT) spectroscopy
53
3.1.8 Electron microscopy ............................................................................ 53
3.1.9 X-ray diffraction (XRD) ......................................................................... 53
3.2 Product analysis ...................................................................................... 54
3.2.1 High Performance Liquid Chromatography (HPLC) ............................ 54
3.2.2 UV-Vis spectroscopy ........................................................................... 54
Part III - Modification of CNTs surface chemistry .............................................. 57
4 SWCNTs functionalization by hydrothermal oxidation ..................................... 59
4.1 Results and discussion ............................................................................ 61
4.1.1 Identification of the nature of surface functionalities by water
adsorption/desorption ....................................................................................... 61
4.1.2 Identification and quantification of surface functionalities by Temperature
Programmed Desorption .................................................................................. 62
4.1.3 Structural modifications on hydrothermally treated SWCNTs: surface
area and pore size distribution ......................................................................... 75
4.1.4 Identification of charge transfer effects by resonance Raman
spectroscopy .................................................................................................... 80
4.2 Conclusions ............................................................................................. 86
4.3 Experimental section ............................................................................... 88

ix
4.3.1 Single-Walled Carbon Nanotubes functionalization .............................88
4.3.2 Single-Walled Carbon Nanotubes characterization..............................88
4.4 References ...............................................................................................89
5 MWCNTs functionalization by hydrothermal oxidation .....................................95
5.1 Results and discussion .............................................................................97
5.1.1 Identification and quantification of oxygen groups ...............................97
5.1.2 Thermal analysis.................................................................................107
5.1.3 Raman spectroscopy ..........................................................................109
5.1.4 Pore structure analysis .......................................................................116
5.2 Conclusions ............................................................................................119
5.3 Experimental section ..............................................................................121
5.3.1 Multi-Walled Carbon Nanotubes functionalization ..............................121
5.3.2 Multi-Walled Carbon Nanotubes characterization ..............................122
5.4 References .............................................................................................122
Part IV - TiO2/CNT composites ............................................................................129
6 TiO2/CNT composites for photocatalytic degradation of caffeine aqueous
solutions..................................................................................................................131
6.1 Results and discussion ...........................................................................133
6.1.1 Materials characterization ...................................................................133
6.1.1.1 Diffuse reflection infrared Fourier transformed (DRIFT) .............133
6.1.1.2 X-ray diffraction (XRD) ...............................................................135
6.1.1.3 Nitrogen adsorption-desorption isotherms .................................136
6.1.1.4 Electron microscopy ...................................................................137
6.1.2 Photocatalytic experiments .................................................................139
6.1.2.1 Photocatalytic activity of bare TiO2 materials in powder form ....139
6.1.2.2 Photocatalytic activity of TiO2/CNT composites in powder form 141
6.1.2.3 Photocatalytic degradation pathway ...........................................144
6.1.2.4 Photocatalytic activity of TiO2/CNT composites in film form .......146
x
6.2 Conclusions ........................................................................................... 150
6.3 Experimental section ............................................................................. 152
6.3.1 Functionalization of CNTs .................................................................. 152
6.3.2 Sol-gel synthesis of TiO2 and preparation of TiO2/CNT composites . 153
6.3.3 Preparation of photocatalytic films ..................................................... 153
6.3.4 Materials characterization .................................................................. 154
6.3.5 Photocatalytic experiments ................................................................ 154
6.4 References............................................................................................. 155
Part V - A photocatalytic system to study the activity of powdered or
immobilized catalysts .......................................................................................... 161
7 Assembling and validation of a customized photocatalytic system for water
remediation studies using caffeine as model compound ....................................... 163
7.1 Results and discussion .......................................................................... 165
7.1.1 Assembling of the customized photocatalytic reaction system ......... 165
7.1.2 Optical characterization ..................................................................... 167
7.1.2.1 Variation on the light spectrum with the distance to the lamp ... 167
7.1.2.2 Effect of the optical elements on the emitted spectrum ............. 169
7.1.3 Photocatalytic experiments ................................................................ 171
7.1.3.1 Effect of the optical elements on the photocatalytic activity of P25
over caffeine solutions ................................................................................ 172
7.1.3.2 Optimization of the P25 powder catalyst load on the degradation of
aqueous caffeine......................................................................................... 173
7.1.3.3 Optimization of the reactor position relative to the biconvex lens
175
7.2 Conclusions ........................................................................................... 178
7.3 Experimental section ............................................................................. 179
7.3.1 Assessment of the irradiated spectra ................................................ 180
7.3.2 Photocatalytic experiments ................................................................ 180
7.4 References............................................................................................. 181

xi
Part VI - Final conclusions and future work ......................................................185
8 Final conclusions .............................................................................................187
8.1 SWCNTs functionalization by hydrothermal oxidation ...........................189
8.2 MWCNTs functionalization by hydrothermal oxidation ...........................190
8.3 TiO2/CNT composites for photocatalytic degradation of caffeine aqueous
solutions ..............................................................................................................191
8.4 Assembling and validation of a customized photocatalytic system for water
remediation studies using caffeine as model compound ....................................192
9 Future Work .....................................................................................................195
9.1 Surface modification of CNTs .................................................................197
9.2 TiO2/CNT composites with visible response on photocatalytic water
treatment studies ................................................................................................197
9.3 Customized photocatalytic setup ............................................................198
Appendix ...............................................................................................................201
Appendix A. MWCNTs functionalization by hydrothermal oxidation ......................203
Appendix A.1 Identification and quantification of oxygen groups for NC3100
MWCNTs 203
Appendix A.2 Raman spectroscopy analysis of the oxidizing effects on
MWCNTs microstructure .....................................................................................204
Appendix B. Assembling and validation of a customized photocatalytic system for
water remediation studies using caffeine as model compound..............................206
Appendix B.1 User manual for the customized photocatalytic setup ............206
Appendix B.2 Comparison of photocatalytic results at similar irradiance
conditions obtained with TQ and HPK lamps .....................................................209
List of Publications ..............................................................................................213


xiii
List of Figures
Figure 1.1 – Forecast of global water demand in Europe for the year 2030 [3]. ....... 5
Figure 1.2 – Crystal structures of anatase (a) rutile (b) and brookite (c). (images
available in Crystal Structure Gallery, National Institute of Advanced Industrial
Science and Technology (AIST) [50]). ....................................................................... 9
Figure 1.3 – TiO2 light absorption enhancement when in composite form with CNTs.
..................................................................................................................................11
Figure 1.4 – CNTs acting as photosensitizers in the composite catalyst: (a) following
photon absorption, an electron is injected into the CB of TiO2 semiconductor; (b) the
electron is back-transferred to CNTs with the formation of a hole in the VB of TiO2
semiconductor and reduction of the so formed hole by adsorbed OH— (adapted from
[42]). ..........................................................................................................................12
Figure 1.5 – Simplified representation of the interaction between TiO2 and the CNTs
and the way HO• may be formed following e−/h+ pair generation (adapted from [77]).
..................................................................................................................................13
Figure 2.1 – Autoclave and temperature controller used in the functionalization of
CNTs. ........................................................................................................................43
Figure 2.2 – Photocatalytic immersion reactor setup picture (a) and scheme (b). ..44
Figure 2.3 – Spectral irradiance of the TQ 150 lamp: (a) data provided by the
manufacturer and cut off effect of DURAN® filter (b) emission lines recorded in the
laboratory at a distance of 7 cm from the irradiation source through a borosilicate
glass filter..................................................................................................................45
Figure 2.4 – Photocatalytic cylindrical reactor (a) and setup scheme (b). ..............46
Figure 4.1 – Water vapor adsorption/desorption isotherms for the (a) SWCNTs
treated with 0.3 mol L-1 of HNO3 and (b) pristine SWCNTs samples. Full symbols:
adsorption; open symbols: desorption. .....................................................................62
Figure 4.2 – Oxygen-containing functional groups: schematic representation. ......63
Figure 4.3 – TPD spectra for the pristine SWCNTs and treated under different HNO3
concentrations at 473 K: (a) CO and (b) CO2 release. .............................................64
Figure 4.4 – Evolution of the amount of CO and CO2 with HNO3 concentration: open
symbols – 393 K; solid symbols – 473 K (for mathematical correlations [HNO3] must
be inserted in mol L-1 for a [COx] in mol g-1). ..........................................................66

xiv
Figure 4.5 – Oxygen-containing functional groups: deconvolution of TPD-MS spectra
for the SWCNTs treated with 0.3 mol L-1 of HNO3 at 473 K (a) CO and (b) CO2 spectra.
................................................................................................................................. 67
Figure 4.6 – Evolution of specific oxygen groups concentration created at the
SWCNTs surface under HNO3 treatment at 473 K, released as (a) CO and (b) CO2.
................................................................................................................................. 69
Figure 4.7 – Amount of volatiles (determined by TGA) and molecular O2 (determined
based on TPD spectra) present at the surface of SWCNT treated with different HNO3
concentrations at 473 K (for mathematical correlations [HNO3] must be inserted in
mol L-1). .................................................................................................................... 71
Figure 4.8 – Weight Loss observed after the HNO3 treatment at different
concentrations: open symbols – 398 K; solid symbols – 473 K (for mathematical
correlations [HNO3] must be inserted in mol L-1). .................................................... 73
Figure 4.9 – Amount of molecular oxygen present as oxygen groups on the surface
of SWCNTs treated at 473 K as a function of [HNO3]/mSWCNT. ............................... 74
Figure 4.10 – Nitrogen adsorption isotherms for the original and treated SWCNT with
different HNO3 concentrations at 473 K. ................................................................. 76
Figure 4.11 – Volume (a) and surface area (b) QSDFT PSDs of the hydrothermally
treated SWCNTs samples as a function of the HNO3 concentration. ..................... 79
Figure 4.12 – Volume QSDFT PSDs of the pristine SWCNTs in comparison with the
air- (300 ºC) and Ar-treated (500 ºC) analogues. .................................................... 80
Figure 4.13 – Raman spectra of the hydrothermally treated SWCNTs samples at (a)
514.5 and (b) 785 nm. Variation of the ID/IG intensity ratio as a function of (c) [HNO3]
and (d) [COx] concentrations. Lines designate the corresponding exponential and
linear best fit curves to the ID/IG vs [HNO3] and [COx], respectively. ....................... 81
Figure 4.14 – (a) Raman spectra of the pristine and SWCNT 0.30 M samples in the
high frequency region at 514 nm. The inset shows the spectral analysis (green-red
lines) of the G', D + D' and 2G modes (black lines). (b) Variation of the ID+D'/IG intensity
ratio with [COx] at 514.5 and 785 nm. ...................................................................... 83
Figure 4.15 – Raman spectra of the Pristine and SWCNT 0.30 M samples thermally
treated in air and Ar atmosphere at 300 and 500 ºC, respectively, in comparison with
the corresponding spectra of the pristine samples at 785 nm. The left inset depicts

xv
the variation of the radial breathing modes for the SWCNT 0.30 M sample, while the
right inset shows the corresponding Raman spectra at 514.5 nm. ..........................85
Figure 5.1 – TPD spectra for the pristine and hydrothermally treated NTX3 MWCNTs
at different HNO3 concentrations and 473 K: (a) CO and (b) CO2 release. .............98
Figure 5.2 - Evolution of the amount of CO and CO2 released from the surface of the
hydrothermally treated NTX3 and NC3100 MWCNTs vs. the HNO3 concentration. 99
Figure 5.3 - Amount of molecular oxygen present as oxygen groups in the surface of
SWCNT, NC3100 and NTX3 as a function of the [HNO3]/mCNT ratio. ....................101
Figure 5.4 - Evolution of the amount of specific oxygen groups created at the surface
of the hydrothermally treated NTX3 with the HNO3 concentration released as CO (a)
and CO2 (b). ............................................................................................................103
Figure 5.5 - Deconvolution of TPD spectra for NTX3 treated with [HNO3] = 7.0 mol L-1
at boiling temperature: groups released as (a) CO and (b) CO2 (PH – phenols; CAn
– carboxylic anhydrides; CQ – carbonyl quinones; LC – lactones; CAc – carboxylic
acids; SA – strong acidic CAc; WA – weakly acidic CAc). .....................................105
Figure 5.6 - Weight loss observed after hydrothermal treatment of NTX3, NC3100
and SWCNTs as a function of the [HNO3]/mCNT ratio. ............................................107
Figure 5.7 – TGA-DSC curves on the pristine and hydrothermally treated NTX3
MWCNTs at different HNO3 concentrations. ..........................................................108
Figure 5.8 - Raman spectra on the pristine and hydrothermally treated NTX3
MWCNTs at (a) 785 nm and (b) 514.5 nm. The Raman intensity was normalized to
that of the G band. The inset in (a) depicts representative results of the five-peak
spectral fitting for the pristine MWCNTs at 785 nm. ...............................................110
Figure 5.9 - The HNO3 concentration dependence of the ID/IG, ID'/IG, ID+D'/IG, ID3/IG and
ID4/IG integrated intensity ratios for the hydrothermally functionalized NTX3 MWCNTs
at (a) 514.5 and (b) 785 nm. Variation of the FWHM of the defect activated (D, D',
D+D') Raman bands (c) and the intensity ratio IG'/IG and FWHM of the G' band (d) as
a function of [HNO3]. ...............................................................................................112
Figure 5.10 - Raman spectra of the boiling (7.0 mol L-1) and hydrothermally
(0.3 mol L-1) acid treated NTX3 MWCNTs under isothermal oxidation at 623 and
673 K. .....................................................................................................................114

xvi
Figure 5.11 – Adsorption-desorption N2 isotherms at 77 K of the pristine and
hydrothermally functionalized NTX3 MWCNTs at different HNO3 concentrations (left
to right: 0, 0.05, 0.10, 0.20 and 0.30 mol L-1 HNO3). ............................................. 116
Figure 5.12 - Normalized (with respect to pristine samples) BET surface areas of the
pristine and hydrothermally functionalized MWCNTs at different HNO3
concentrations. ...................................................................................................... 117
Figure 5.13 - QSDFT pore size distributions of pristine and hydrothermally
functionalized NTX3 MWCNTs at different HNO3 concentrations. ........................ 119
Figure 6.1 - DRIFT spectra for bare TiO2 materials. ............................................. 133
Figure 6.2 - XRD spectra for bare and respective TiO2/CNT (XX/CNTf-20)
composites. ............................................................................................................ 135
Figure 6.3 - N2 adsorption-desorption isotherms for bare and respective TiO2/CNT
(XX/CNTf-20) composites. ..................................................................................... 137
Figure 6.4 - (a-f) SEM and (g-i) TEM micrographs of bare TiO2 materials and
TiO2/CNT composites. ........................................................................................... 138
Figure 6.5 – Radiation flux of TQ 150 immersion lamp and transmission spectrum of
the cut-off filter together with the absorption spectrum of aqueous caffeine. ........ 140
Figure 6.6 – Photolytic (blank) and photocatalytic degradation of caffeine over bare
TiO2 materials. ....................................................................................................... 141
Figure 6.7 – Photolytic (blank) and photocatalytic degradation of caffeine over (a)
XX/CNTf-5, (b) XX/CNTf-10, (c) XX/CNTf-20 and (d) XX/CNT-10 composites in
powder form. .......................................................................................................... 142
Figure 6.8 – Caffeine conversion after 30 min of irradiation, X caff, 30 min (%), for bare
TiO2 materials (XX = P25, SA, SG) and for the respective TiO2/CNT composites.
............................................................................................................................... 143
Figure 6.9 – Effect of CNT content on the pseudo-first order kinetic constant when
using SA/CNTf-Y composites and comparison with SA and SA/CNT-10 materials.
Curves represent the fitting of the pseudo-first order equation to the experimental
data. ....................................................................................................................... 144
Figure 6.10 – Effect of holes/radicals scavengers (EDTA/t-BuOH) on the
photocatalytic degradation of caffeine when using (a) P25, (b) SA, (c) P25/CNTf-20
and (d) SA/CNTf-20 as catalysts in powder form. ................................................. 145

xvii
Figure 6.11 – Photocatalytic degradation of (a) caffeine and (b) diphenhydramine
over P25 and SA/CNTf-20 catalysts in the form of films. Curves represent the fitting
of the pseudo-first order equation to the experimental data. ..................................147
Figure 6.12 – SEM image of SA/CNT-20 sectional cut of the film (a); diffuse
reflectance UV-Vis spectra of SA based films (b) and of the corresponding powder
substrate (SA*) [19]. ...............................................................................................147
Figure 7.1 – HPK125W emission lines (a) and lamp dimensions in mm (b). ........166
Figure 7.2 – Cylindrical reactor with HPK125W lamp setup scheme (a) and picture
(b). ..........................................................................................................................167
Figure 7.3 – Evolution on the light spectrum reaching the inside of the photo-reactor
with the distance to the irradiation source. .............................................................168
Figure 7.4 – Decay of the absolute irradiance as a function of the distance to the
lamp. .......................................................................................................................168
Figure 7.5 – Contribution of the intensity of each particular emission line on the
absolute irradiance for different distances. .............................................................169
Figure 7.6 – UV-Vis transmittance of long pass filters. .........................................170
Figure 7.7 – Effect of the different optical elements on the light spectra reaching the
inside of the photoreactor (OW – optical window, BL – biconvex lens, LP – long pass
filters, R – photo-reactor). ........................................................................................171
Figure 7.8 – Effect of the optical accessories on the photocatalytic activity of P25
suspensions for caffeine degradation. ....................................................................172
Figure 7.9 – Pseudo-first order kinetic constant of caffeine photo-degradation for
different catalyst loads of P25 suspensions. ..........................................................174
Figure 7.10 – Schematic representation of the incidence of the light beam on the
photocatalytic reactor at different distances from the biconvex lens. .....................175
Figure 7.11 – Decay of the kinetic constant on caffeine degradation with the distance
from the photo-reactor to the biconvex lens (black squares: pseudo-first order kinetic
constants – left axis; open circles: absolute irradiance – right axis). .....................176


xix
List of Tables
Table 4.1 – Total amount of CO and CO2 calculated from the TPD spectra obtained
for different HNO3 concentrations (393 and 473 K). .................................................65
Table 4.2 – Quantification of oxygen functional groups by TPD-MS analysis as a
function of the nitric acid concentration. ...................................................................68
Table 4.3 – Volatiles, ash content (determined by TGA) and % O2 (determined by
TPD) quantified for the pristine and treated SWCNT with different HNO3
concentrations (393 and 473 K). ..............................................................................70
Table 4.4 – Total amount of CO and CO2 calculated from the TPD spectra and
respective % O2 as function of [HNO3]/mSWCNT and HNO3 concentration at 473 K. .74
Table 5.1 - Total amount of CO, CO2 and wt.% O2 calculated from the TPD spectra
obtained for the hydrothermally functionalized NTX3 different HNO3 concentrations
and 473 K. ................................................................................................................98
Table 5.2 - BET surface areas, SBET, DFT micropore volume, Vmicro and pore volume
at p/p0 = 0.99, designated as V *, for the pristine and hydrothermally treated NTX3
samples [38]. ..........................................................................................................118
Table 6.1 – Pseudo-first order kinetic constants (k) and respective standard errors
for the photolytic and photocatalytic degradation of caffeine using different catalysts.
The regression coefficients (r2) are also presented. ...............................................134
Table 6.2 – SBET ( 5 m2 g-1) of the different TiO2 powders (XX = P25, SA or SG) and
for the respective TiO2/CNT composites. ...............................................................136
Table 7.1 – Pseudo-first order kinetic constants (k) and respective standard errors
for the photolytic and photocatalytic degradation of caffeine using different catalyst
loads of P25. The regression coefficients (r2) are also presented. ........................174
Table 7.2 – Pseudo-first order kinetic constants (k) and respective standard errors
for the photocatalytic degradation of caffeine using P25 suspensions with the reactor
positioned at different distances from the biconvex lens. Regression coefficients (r2)
and the absolute irradiance for each configuration is also presented. ...................177


xxi
Glossary
Most Used Acronyms
AOP Advanced Oxidation Process
BL Biconvex lens
CB Conduction Band
CCFs Carboxylated Carbonaceous Fragments
CCVD Catalytic Chemical Vapor Deposition
CNT Carbon Nanotubes
DRIFT Diffuse Reflectance Infra-Red Fourier Transformed
DRUV Diffuse Reflectance UV-Vis
DSC Differential Scanning calorimetry
FWCNT Few-Walled Carbon Nanotubes
FWHM Full With at Half Maximum
HOMO Highest Occupied Molecular Orbit
HPLC High Performance Liquid Chromatography
KM Kubelka-Munk units
LP Long pass optical filter
LUMO Lowest Unoccupied Molecular Orbit
MWCNT Multi-Walled Carbon Nanotubes
MS Mass spectrometry
NIR Near-Infrared
OM Organic Molecule
OW Optical window
PSD Pore Size Distributions
QSDFT Quenched Solid Density Functional Theory
R Photo-reactor
SA Sigma-Aldrich
SC Semiconductor Catalyst

xxii
SEM Scanning Electron Microscopy
SG TiO2 prepared by a Sol-Gel method
SWCNT Single-Walled Carbon Nanotubes
TEM Transmission Electron Microscopy
TGA Thermogravimetric Analysis
TPD Temperature Programmed Desorption
UV Ultra Violet
UV-Vis Ultra Violet Visible
VB Valence Band
WL Weight Loss
XRD X-Ray Diffraction


Part I
Thesis Motivation


1 State of the art
Water treatment is an environmental issue well documented and vastly discussed
throughout the scientific community in the European Union with very well defined
objectives and targets to the next fifteen years. Semiconductor photocatalysis is a
highly competitive Advance Oxidation Process for water remediation in spite of a
limited industrial implementation. Titanium dioxide (TiO2) has been widely used as
photocatalyst, with Ultra-Violet photons with energy above 3.2 eV generating highly
reactive surface excited electrons and holes which are responsible for the
subsequent redox conversion of the organic pollutants through the photocatalytic
process. However, considering that the solar spectrum at earth’s surface (air
mass 1.0) consists only of 3-6% of UV radiation, the natural band gap of neat TiO2
represents a drawback when the sunlight is used in photocatalytic applications.
Advances in the development of visible active photocatalysts by modifying TiO2,
namely with carbon nanotubes (CNTs), are significant. Modifications on the surface
of CNTs, to improve the contact with the semiconductor phase, are achieved by the
introduction of oxygen species and different methods have been tested at different
conditions. Deep knowledge on the consequences of CNTs modification at molecular
level is missing to better understand and develop a good TiO2 photocatalyst based
interphase interaction between the two components. Synergistic cooperation with the
semiconductor phase by enhancing its absorption of light towards longer
wavelengths has been reported for TiO2/CNT photocatalysts. However, industrial
implementation requires operation in continuous mode, which implies the usage of
immobilized catalysts instead of the aqueous suspensions normally reported. The
latter require further separation steps with increasing economic costs. The
development of thin photocatalytic films with an optimized usage of sunlight for water
treatment in a well-designed photocatalytic system operating in continuous mode is
the final goal of the current research. To understand the motivation of this work, the
goals will be framed in basis of an updated bibliography revision and the more
important accounts outlined here.


Part I – Thesis Motivation
5
1.1 Environmental concerns in Europe: Water pollution
Water pollution is one of the five main issues of European environmental concerns
[1, 2]. Over the past 50 years, Europe has been affected by increasing conflicts due
to ecological issues and human water requirements inherent to modern standards of
living. In terms of water abstraction, the highest demands go for urban consumption
(households and industry connected to the public water supply system), industry,
agriculture and energy. Recently, the European Environment Agency (EEA)
published The European environment - state and outlook 2010 (SOER 2010) in which
is reported the forecast of water demand to the year 2030 [3]. Concerning global
water abstraction, agriculture currently accounts for about 3100 billion m3 per year
and, with no efficiency gains, will increase to 4500 billion m3 by 2030. During this
period, industrial abstraction is forecasted to nearly double and domestic abstraction
to increase by 50%, as shown in Figure 1.1. Given the available supplies, the current
water abstractions and those projected for 2030, accounting with the low historic rate
of efficiency improvement in agricultural and industrial water use of ca. 1% per year,
a huge deficit of 60% is estimated for the year 2030 in Europe.
Figure 1.1 – Forecast of global water demand in Europe for the year 2030 [3].
Within the thematic ‘freshwater quality’ boarded in SOER 2010, one of the key
messages goes for the expensiveness of removing pollution. In fact, remediation
actions, in the context of urban environment, air pollution, land usage or water
resources, requires large amounts of energy and chemicals resulting in further
unavoidable generation of wastes. Controlling pollutants at source verily reduces the
need for treatment by decreasing discharge to fresh waters. However, in a pragmatic

6
view, given the low improvement on efficient water use observed through the last
years, the practical and imperative answer relies on efficient water remediation
solutions minimizing energy and chemicals demands to make up for the disquieting
abovementioned deficit, meanwhile aspiring for a progressively and more conscious
usage and maintenance of water resources.
Large amount of water is consumed for industrial purposes and consequently high
volumes of industrial wastewaters are produced containing a wide variety of harmful
contaminants thus requiring complex wastewater treatments in sequential stages.
From agriculture activities the key pollutants are nutrients, pesticides, sediment and
fecal microbes whereas a high amount of pharmaceuticals and personal care
products are detected in urban wastewaters. European water legislation started in
1975 by defining standards for rivers and lakes used for drinking water abstraction,
and strict targets are nowadays defined on the discharge of harmful substances to
water courses [1]. The EU Commission Services have recently launched a directive
defining new Environmental Quality Standards (EQS) [4] which complemented with
the 2012 Commission proposal on priority substances (COM(2011)876) and the First
list of Priority substances Decision 2455/2001/EC support relevant information to
develop legislation on the hazardous priority substances [5].
Biological routes in wastewater treatment are easily implemented with a low cost
investment. However some drawbacks are inherent to these processes such as large
production of sludge where certain contaminants are still present. It is also known
that biological treatments are not suitable for wastewaters with a high organic load
and that there are organic molecules, which are refractory to microorganisms activity.
At variance, chemical treatments are able to solve many environmental scenarios by
converting the primary pollutants into biodegradable organic compounds or by
achieving complete mineralization depending of the desired level of depuration.
Integration of biological and chemical treatments strongly depends on the wastewater
characteristics, concentrations and desired outputs, representing an optimized
solution for water remediation. Practical results achieved by combining Advanced
Oxidation Processes (AOPs) with bioreactors are widely reported and recently
reviewed [6-10]. Namely, within the most studied AOPs, semiconductor
photocatalysis is a strong competitive technology operating at ambient temperature
and pressure with the possibility of using natural sunlight as irradiation source which
resumes a fairly clean technology giving answer to the abovementioned requirements
to face EU difficulties in water remediation [11-14].

Part I – Thesis Motivation
7
1.2 Semiconductor photocatalysis: an Advanced Oxidation Process for
wastewater treatment
Advanced oxidation processes (AOPs) are chemical routes to oxidize organic or
inorganic oxidizable species through a reaction mechanism involving the production
of hydroxyl radicals (HO•). These oxidizing agents are characterized by their high
reactivity and low selectivity, which are very competitive attributes to solve a wide
range of pollution scenarios. AOPs comprise different possibilities like chemical
oxidation (O3, O3/H2O2, Fenton), photochemical oxidation (UV/O3, UV/H2O2) and
photocatalytic oxidation processes (UV/TiO2, photo-Fenton) [11, 15-18].
Heterogeneous photocatalysis is earning a growing relevance amongst several
oxidation techniques, due to the last advances in light related technologies [19-21].
One of the main reasons is the ability of achieving complete mineralization of many
organic pollutants at mild conditions of temperature and pressure with resource to a
low energy-consuming water treatment technology. It has been successfully used on
environmental applications with simulated and real effluents [22-28]. It is based on
the photo-induced generation of electrical charges when a semiconductor material is
illuminated with photons of energy equal to or greater than its characteristic band
gap.
1.2.1 Reaction mechanism in heterogeneous photocatalysis
Since the semiconductor catalyst (SC) is irradiated (h) with higher energy than that
of the band gap, the electrons are excited from the valence band (VB, Highest
Occupied Molecular Orbital - HOMO) to the conduction band (CB, Lowest
Unoccupied Molecular Orbital - LUMO) generating electron-hole (e–/h+) pairs (eq. 1).
These agents will get involved in a sequence of redox reactions producing highly
oxidizing species like hydroxyl radicals (HO•) and superoxide radicals (O2•–) [29, 30].
In aerated conditions, the molecular oxygen is adsorbed in the surface of the
semiconductor acting as an electron acceptor (eq. 2) with formation of superoxide
radicals. On the other hand, adsorbed water molecules and hydroxyl anions act as
electron donors leading to the formation of hydroxyl radicals (eqs. 3 and 4).
𝐒𝐂 𝐡→ 𝐒𝐂(𝐞𝐂𝐁
− + 𝐡𝐕𝐁+ ) (1)
𝐒𝐂(𝐞𝐂𝐁− ) + (𝐎𝟐)𝐚𝐝𝐬 → 𝐒𝐂 + (𝐎𝟐
•−) (2)
𝐒𝐂(𝐡𝐕𝐁+ ) + (𝐇𝟐𝐎)𝐚𝐝𝐬 → 𝐒𝐂 + (𝐇𝐎•)𝐚𝐝𝐬 + (𝐇+)𝐚𝐝𝐬 (3)
𝐒𝐂(𝐡𝐕𝐁+ ) + (𝐎𝐇−)𝐚𝐝𝐬 → 𝐒𝐂 + (𝐇𝐎•)𝐚𝐝𝐬 (4)

8
Once generated, the highly oxidizing HO• radicals will react with the organic molecule
(OM) adsorbed in the catalyst surface, which structure will breakdown into
intermediate compounds that can be totally mineralized to CO2 and H2O (eq. 5).
𝐎𝐌𝐚𝐝𝐬 + (𝐇𝐎•)𝐚𝐝𝐬 → 𝐢𝐧𝐭𝐞𝐫𝐦𝐞𝐝𝐢𝐚𝐭𝐞𝐬 → 𝐂𝐎𝟐 + 𝐇𝟐𝐎 (5)
Titanium dioxide has been the most studied semiconductor in photocatalysis. In
1921, C. Renz accounted for the first report with relation to this topic by describing
the partial reduction of TiO2 upon illumination using sunlight in the presence of
glycerol [31].
1.2.2 Titanium dioxide photocatalyst
Titanium dioxide (TiO2) has been widely used as photocatalyst, due to its chemical
stability, relatively low toxicity and affordable cost or easy synthesis, and because
this material is a very powerful oxidant when excited under Ultra Violet (UV) or
near-UV to Visible (Vis) irradiation [16, 18, 29, 31-36]. Photons with energy above
3.2 eV generate highly reactive surface excited electrons and holes which are
responsible for the subsequent oxidation of the organic pollutants through the
previously described photocatalytic process by the formation of the hydroxyl and
superoxide radicals or by direct oxidation with photogenerated holes [34].
Photocatalytically active TiO2 powders can be easily synthesized by means of the
sol-gel method, materials with distinct properties being obtained by varying the
synthesis conditions [33, 35, 37-39]. This preparation technique involves the use of
a metal alkoxide as a precursor, which is dissolved in an alcohol. The alkoxide is
hydrolyzed and then the condensation of the polymeric chains takes place. The
resulting gel is allowed to dry under ambient or supercritical conditions forming a
xerogel or an aerogel, respectively. Further calcination helps to eliminate the
remaining solvent and, at different calcination temperatures, distinct crystalline
phases can be attained. Very homogeneous materials are obtained using the sol-gel
synthesis procedure and the possibility to include other phases in the TiO2 matrix is
an additional advantage [40-45].
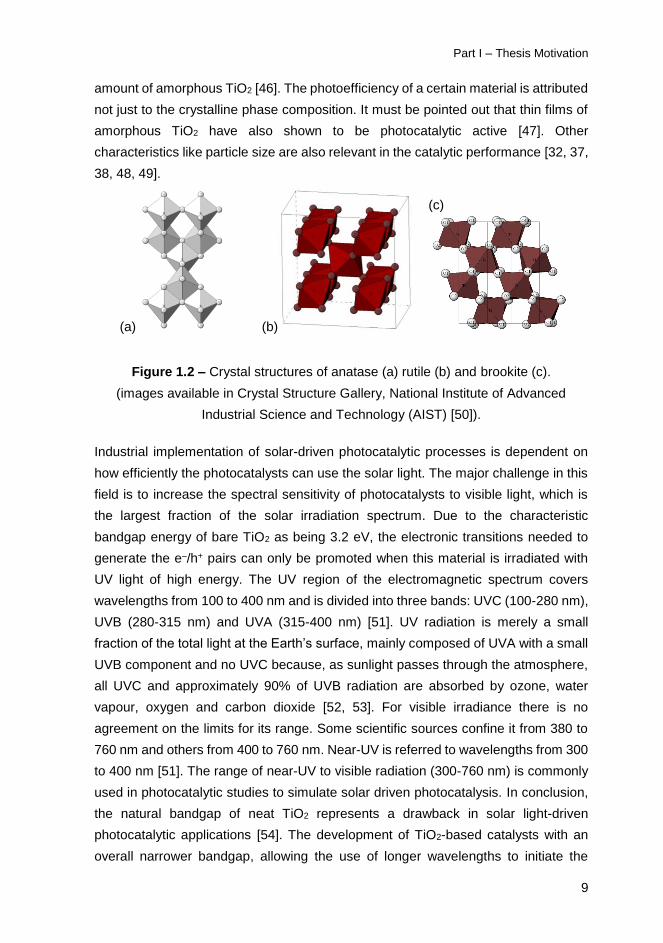
The most reported three polymorphs of TiO2 that can be found in nature are anatase,
rutile and brookite, which crystal structures are represented in Error! Reference
source not found.. The commercial TiO2 most used in photocatalytic applications is
AEROXIDE TiO2 P25 (Evonik Degussa Corporation) which is constituted by a
mixture of anatase and rutile crystalline phases in a 4:1 mass ratio plus a certain
Part I – Thesis Motivation
9
amount of amorphous TiO2 [46]. The photoefficiency of a certain material is attributed
not just to the crystalline phase composition. It must be pointed out that thin films of
amorphous TiO2 have also shown to be photocatalytic active [47]. Other
characteristics like particle size are also relevant in the catalytic performance [32, 37,
38, 48, 49].
(a) (b)
(c)
Figure 1.2 – Crystal structures of anatase (a) rutile (b) and brookite (c).
(images available in Crystal Structure Gallery, National Institute of Advanced
Industrial Science and Technology (AIST) [50]).
Industrial implementation of solar-driven photocatalytic processes is dependent on
how efficiently the photocatalysts can use the solar light. The major challenge in this
field is to increase the spectral sensitivity of photocatalysts to visible light, which is
the largest fraction of the solar irradiation spectrum. Due to the characteristic
bandgap energy of bare TiO2 as being 3.2 eV, the electronic transitions needed to
generate the e–/h+ pairs can only be promoted when this material is irradiated with
UV light of high energy. The UV region of the electromagnetic spectrum covers
wavelengths from 100 to 400 nm and is divided into three bands: UVC (100-280 nm),
UVB (280-315 nm) and UVA (315-400 nm) [51]. UV radiation is merely a small
fraction of the total light at the Earth’s surface, mainly composed of UVA with a small
UVB component and no UVC because, as sunlight passes through the atmosphere,
all UVC and approximately 90% of UVB radiation are absorbed by ozone, water
vapour, oxygen and carbon dioxide [52, 53]. For visible irradiance there is no
agreement on the limits for its range. Some scientific sources confine it from 380 to
760 nm and others from 400 to 760 nm. Near-UV is referred to wavelengths from 300
to 400 nm [51]. The range of near-UV to visible radiation (300-760 nm) is commonly
used in photocatalytic studies to simulate solar driven photocatalysis. In conclusion,
the natural bandgap of neat TiO2 represents a drawback in solar light-driven
photocatalytic applications [54]. The development of TiO2-based catalysts with an
overall narrower bandgap, allowing the use of longer wavelengths to initiate the
10
reaction, is thus a current issue of research aiming at the possible reduction of the
operating costs by better exploiting sunlight.
1.3 Improving the photo-efficiency of the semiconductor TiO2
In order to extend light absorption towards wavelengths in the visible range, TiO2 has
been modified following different approaches which are recently revised in the
literature [19, 55-57]. Modifications are carried out namely by doping or loading the
TiO2 structure with other elements, either metal or non-metal species [23, 57-65], by
dye-sensitization [57], by forming composites with other oxides [66] or with different
carbon phases like activated carbons, graphene, fullerenes or carbon nanotubes [19,
56, 67-71].
The photo-efficiency of a certain material also generally depends on crystalline phase
composition, particle size, surface area, particle morphology and distribution of
hydroxyl groups [48, 49, 72].
Recently, high emphasis has been given to synergies created between TiO2 and
carbon materials, in particular with carbon nanotubes (CNTs) upon photo-excitation
of the resulting composite catalysts [19, 56]. The effect caused by the introduction of
carbon nanotubes in the photo-activation mechanism of TiO2/CNT composites is
further discussed in Section 1.3.1.
1.3.1 TiO2/CNT composites and photo-activation mechanism
Composites based on TiO2 and CNTs are reported to possess enhanced
photocatalytic response under both UV and visible light irradiation for the oxidative
degradation of many different organic pollutants [42, 56, 71, 73-76]. Due to their
electric conductivity, CNTs can promote e- diffusion, reduce e-/h+ recombination and
act as photosensitizers and dispersing agents for TiO2 particles, being possible to
take advantage of CNTs properties to prepare more efficient photocatalysts.
However, this is not always the case, since it has been found that for the molecules
with stronger electron-withdrawing (deactivating) groups, such as 4-nitrophenol, the
combination of CNTs with TiO2 is not favourable for the photocatalytic degradation
process [76].
For instance, Yao et al. [74] who have studied the photocatalytic degradation of
phenol with TiO2/CNT powders concluded that the composites prepared with 100 nm

Part I – Thesis Motivation
11
anatase and single-walled CNTs exhibited enhanced and selective photocatalytic
oxidation of phenol in comparison to pure anatase or P25 particles. The results are
explained based on an optimal arrangement between phases for a weight ratio of
CNTs to TiO2 of ca. 20%, stabilizing charge separation and reducing charge
recombination, this ratio being identified as optimal in many other works with
TiO2/CNT [56, 71, 75, 76].
In fact, TiO2/CNTs are believed to take benefit of the CNTs capacity of absorbing
visible light to initiate the reaction mechanism, leading to the generation of the so
reactive oxidant species [42, 77, 78]. The enhanced response in the visible range of
the spectrum for these composites is represented in Figure 1.3.
Figure 1.3 – TiO2 light absorption enhancement
when in composite form with CNTs.
Moreover than the proved shift towards longer wavelengths it is reported that the light
absorption increases with the amount of CNTs in the respective composite [42, 76].
Two of the proposed mechanisms described in literature that are believed to operate
in a sensitized photoreaction with TiO2/CNT composites are partially represented in
the schemes of Figure 1.4 and Figure 1.5. It must be noticed that the schemes do not
show all the reactions involved, but just intend to illustrate the generation of the
superoxide (a) and hydroxyl (b) oxidizing agents.
The mechanism represented in Figure 1.4 and resumed in eqs. 5-9 begins with the
absorption of visible light by CNTs, with the excited electrons being transferred to the CB
of TiO2. If the diffusion of the e–/h+ pairs to the photocatalyst surface is more effective than

12
e–/h+ recombination and molecular oxygen present in the reaction medium is abundant,
it will be reduced by the excited e– at the surface of TiO2 to form the superoxide radical.
(a)
(b)
Figure 1.4 – CNTs acting as photosensitizers in the composite catalyst:
(a) following photon absorption, an electron is injected into the CB of TiO2
semiconductor; (b) the electron is back-transferred to CNTs with the formation of a
hole in the VB of TiO2 semiconductor and reduction of the so formed hole by
adsorbed OH— (adapted from [42]).
On the other hand, electrons on the VB of TiO2 can migrate to the surface of CNTs
generating positive holes, which will oxidize the hydroxide anions to form hydroxyl
radicals. The organic molecules (OM) will be then decomposed by radicals attack. The
main steps involved are summarized in the following equations:
𝐓𝐢𝐎𝟐/𝐂𝐍𝐓 𝐡→ 𝐓𝐢𝐎𝟐/𝐂𝐍𝐓(𝐞𝐂𝐁
− + 𝐡𝐕𝐁+ ) (5)
𝐓𝐢𝐎𝟐/𝐂𝐍𝐓(𝐞𝐂𝐁− + 𝐡𝐕𝐁
+ ) → 𝐓𝐢𝐎𝟐(𝐞𝐂𝐁− )/𝐂𝐍𝐓(𝐡𝐕𝐁
+ ) (6)
𝐓𝐢𝐎𝟐(𝐞𝐂𝐁− ) + (𝐎𝟐)𝐚𝐝𝐬 → 𝐓𝐢𝐎𝟐 + (𝐎𝟐
•−) (7)
𝐓𝐢𝐎𝟐(𝐡𝐕𝐁+ ) + (𝐎𝐇−)𝐚𝐝𝐬 → 𝐓𝐢𝐎𝟐 + (𝐇𝐎•)𝐚𝐝𝐬 (8)
(𝐇𝐎•)𝐚𝐝𝐬 + 𝐎𝐌 → 𝐢𝐧𝐭𝐞𝐫𝐦𝐞𝐝𝐢𝐚𝐭𝐞𝐬 → 𝐂𝐎𝟐 + (𝐇𝟐𝐎)𝐚𝐝𝐬 (9)
On the other hand, if the irradiated light is of enough energy to be absorbed by TiO2, the
electronic transitions will be promoted and the excited electrons will migrate to the CB
generating h+ in the VB. The formation of the hydroxyl radicals can occur either due to h+

Part I – Thesis Motivation
13
reduction by the adsorbed water or by OH— oxidation, as shown in Figure 1.5. In the
same way, the so-formed oxidizing agents will initiate the photo-degradation of organic
pollutants through sequential redox reactions.
Figure 1.5 – Simplified representation of the interaction between TiO2 and the
CNTs and the way HO• may be formed following e−/h+ pair generation
(adapted from [77]).
These composites are usually used in powder form as slurries which is a very
common procedure when compared with systems implementing immobilized
catalysts, due to the large amount of catalyst per reactor volume in the first case,
minimizing mass transfer limitations.
However, slurry operation at industrial scale requires final separation of the catalyst
incurring in additional costs and precluding the possibility of reaction in continuous
mode. To surpass this drawback, thin films have been developed to operate in
adequate photo-reactors overcoming the disadvantage of the post separation step
for suspensions, but mostly TiO2 films are reported with very scarce information on
the development of TiO2/CNT composite films with enhanced photo-activity for water
remediation [73, 79-91]. At laboratorial scale, operating with catalysts in powder form
is useful for screening experiments with the aim to select the most efficient materials
to be further immobilized on support surfaces. Different techniques have been
applied to prepare photocatalytic films, such as spin coating, dip coating, liquid phase
deposition or doctor blade [73, 82, 83, 86-88, 92-94]. Doctor blade method is a very
simple technique for mass production of thin films with good uniformity and
reproducible properties [95] which has been recently applied to prepare TiO2/CNT
composites for photocatalytic applications [73, 83].

14
At the present moment, it is of high relevance the development of TiO2/CNT
composite films with an intimate interaction between the semiconductor and the
carbon phase, for achieving high yields of charge separation and ensuring efficient
charge carriers interchange upon photo-excitation with near-UV to visible radiation.
The ultimate goal is the development of efficient catalysts for solar-driven applications
at industrial scale. Having a deep knowledge about the TiO2/CNT interphase
interaction is of great importance and has been scarcely studied. In most cases the
photocatalytic efficiencies are assessed based on empirical observations rather than
on well-established scientific arguments.
The synergy commonly observed between TiO2 and CNTs must be object of
comprehensive studies by understanding in detail CNTs properties and the possible
modifications to better achieve a consistent interphase resulting in photocatalytic
composites with high efficiency response under near-UV to visible light irradiation.
1.3.2 Carbon nanotubes and surface chemistry modification
Carbon nanotubes are structures of particular interest due to their unique properties,
such as high mechanical resistance and exceptional thermal stability under oxidizing
atmosphere conditions [96, 97]. Ideal CNTs are made of one (Single-Walled Carbon
Nanotubes, SWCNTs) or more (Multi-Walled Carbon Nanotubes, MWCNTs)
graphene sheets with hexagonal display of sp2 hybridized carbon atoms. Depending
on the way in which the graphene layers are rolled up, CNTs have either metallic or
semi-conductive properties [98]. The successful synthesis of MWCNTs by Iijima in
1991 [99] opened a prolific domain of new research. Rapidly was realized that single-
shell structures were required to better understand their properties and two years
later the synthesis of SWCNTs by arc-discharge was reported by both Iijima and
Ichihashi [100] and Bethune et al. [101] . A few years later in 1996, Thess et al.
produced metallic and highly uniform SWCNTs in yields of more than 70 % by
condensation of a laser-vaporized carbon–nickel–cobalt mixture [102]. Recent
developments in the mass production of MWCNTs, which has gradually evolved from
the bench to the large-scale manufacturing, rendered them the material of choice for
large volume applications, in contrast to the prototype SWCNTs, whose scale-up has
lagged behind because of their significantly higher cost [103-109]. In particular,
commercial MWCNTs are mostly produced by catalytic chemical vapor deposition
(CCVD) for large scale production [110, 111], whose structural properties may be
significantly impaired by the soot-like amorphous carbon emerging as pyrolysis by-
Part I – Thesis Motivation
15
product [112] and inherent defects in the graphitic tube shells due to the relatively low
growth temperature [113].
CNTs have been widely used in general catalytic applications [114] and numerous
studies have been oriented to their use as support materials in catalysis, namely in
hydrogenation reactions, hydrocarbon decomposition or development of fuel cell
electrocatalysts [97, 115]. Several other applications have been reviewed
encompassing a broad range of potential products from conductive, high-strength
composites and lithium-ion battery electrodes to energy storage, sensors and field
emission displays [115-118].
Several properties, which were studied for ideal CNTs, depending mainly on their
diameter and chirality, are also strongly affected by the presence of defects such as
pentagons, heptagons, vacancies or dopant species [119]. Potential applications
have been investigated by introducing defects and modifying the surface chemistry
of CNTs [115, 120-124]. Depending on the required application, several chemical
agents can be hosted at the surface of CNTs like alkali metals [125-127], salen
complexes [128, 129], amines to form polyaniline composites [130, 131], gold
nanoparticles for sensitive determination of nitrite [132] or biomedical applications
[133] and S-containing groups to improve the catalytic performance of CNTs on the
oxidation of organic pollutants [134]. Nevertheless, since CNTs are considered as
almost inert substrates, they are previously subjected to oxidizing treatments and,
depending on the conditions and the oxidizing agents used, is possible to obtain
modifications on the surface chemistry and in the structural integrity at distinct levels
[130, 134-144]. Despite the marked progress in purification of CNTs [145], controlled
functionalization of their hydrophobic and chemically inert surface remains a major
challenge for practical deployment, especially for MWCNTs that, being on the verge
of commercialization, attract particular interest [109].
To accomplish an effective interaction between TiO2 and CNTs, modifications on the
surface chemistry of the carbon phase are required. This is usually achieved through
chemical treatments, often by using nitric acid (HNO3) resulting in the introduction of
surface groups like carboxylic and phenolic functionalities, which are believed to
participate in the covalent anchorage of TiO2 [146].
The chemical surface modification of carbon materials using nitric acid (HNO3) is not
a recent topic [147-155]. It has been performed over distinct carbon materials like
activated carbons [153, 154], carbon xerogels [156-158], graphite [159] or ordered
mesoporous carbons [160, 161]. Liquid phase oxidation with HNO3 is the most

16
prevalent process for the purification of as-grown CNTs by selectively removing
amorphous carbon and residual metal catalyst impurities [114, 145, 162], as a pre-
treatment to provide CNTs with a homogeneous surface [163] and has been studied
for the selective removal of small diameter metallic SWCNTs [164, 165].
Functionalization through HNO3 oxidation results on the opening of the tube caps and
the modification of the surface chemistry of the CNTs by the covalent attachment of
oxygen-containing groups, i.e. carboxylic acids and anhydrides, phenols, carbonyl
quinones, and lactones, preferentially takes place at the tube ends and CNTs side-
walls [121, 166-168], following a sequential oxidation path that sets out at the highly
reactive defect sites of CNTs [169]. These hydrophilic surface groups may drastically
promote the CNTs’ dispersability in various solvents and their colloidal stability [170-
172], enhance the CNTs’ interfacial coupling with polymer matrices for the
development of advanced nanocomposites [173], while simultaneously serving as
anchoring sites for further chemical functionalization and processing [174], resulting
in much higher reactive substrates than the pristine CNTs.
HNO3 treatments have been extensively used at very high concentrations using
boiling methods [135, 155, 175], which are very efficient for the introduction of a high
density of oxygen-containing groups. However, severe degradation effects,
accompany the results especially for SWCNTs, including material’s loss, tube
shortening as well as the formation of structural defects and carbonaceous debris
[155, 162, 164, 176]. The formation of exfoliated carboxylated carbonaceous
fragments (CCFs) via the nitric acid over-oxidation of SWCNTs and subsequent base
washing, arose considerable concerns as to the process effectiveness, which could
undermine the nanotubes’ dispersability in different host matrices [177-182]. Due to
the occurrence of own SWCNT’s consumption, particular attention has been given to
the binding of the created oxygen functionalities to the CCFs amorphous structures
[177-180]. Base washing or more severe oxidant conditions can clean CNT’s surface
from CCFs but there are still a significant fraction of oxygen functionalities that
remains directly covalently bonded to the CNT’s atoms. Although MWCNTs were
found to be more resistant to oxidation than SWCNTs [178], similar detrimental
effects including the formation of oxidation debris by nitric acid reflux were also
identified [135, 138, 183-186], which could largely compromise their performance for
example in catalytic [187] or electrochemical applications [188]. The underlying
reaction mechanism resulting from the interplay of the various abovementioned
effects has been the subject of several investigations [99, 162, 164, 170, 177-180,
189-192].

Part I – Thesis Motivation
17
Even though significant insights on the diverse HNO3 oxidation pathways have been
recently provided by the combination of thorough experimental and theoretical
investigations [169], kinetic control of the CNTs surface functionalization by the
oxidation duration and/or reaction temperature remains a challenging task [178],
justifying the high interest in the development of controllable
purification/functionalization processes of CNTs [112, 193, 194]. It is worth
mentioning that usually boiling methods are not applied in a controlled mode, since
there are no correlations between the degree of functionalization and the conditions
used. Given the relevance of the functionalization step in the preparation of different
carbon based materials for numerous applications, the development of methods for
the controlled modification of their surface chemistry is required.
To probe the functional groups created at CNTs surface different techniques have
been performed, namely acid base titration, X-ray photoelectron spectroscopy,
infrared and Raman vibrational spectroscopies, temperature programmed desorption
(TPD), thermogravimetric analysis (TGA) together with electron microscopy [195,
196], however an accurate characterization based on type and amount of surface
groups cannot be provided by single spectroscopic or microscopic investigations. As
reported earlier in literature, with respect to the mechanism of the oxidation process
over SWCNTs, sequential stages are proposed involving defect generating and
defect consuming steps [162], which highlight the need of detailed investigations at
atomic scale concerning structure and electronic surface modifications. In particular,
resonance Raman spectroscopy has afforded quantitative analysis of stacking order,
finite crystallite size and defect structure of nanographitic materials unveiling unique
information on their electronic and vibrational properties hardly accessible by other
techniques, which establishes a highly competitive position as a powerful tool for the
characterization of CNTs [197-200]. Despite the widespread use of Raman
spectroscopy on the characterization of functionalized SWCNTs through the
activation of defect induced Raman modes [201, 202] and the high sensitivity of the
first order phonon modes of SWCNTs to charge transfer [190, 203], complementary
experimental data on the defect density and textural characterization is missing [204].
1.4 Objectives and thesis outline
The following topics are recognized as of outmost importance and there are currently
under intense research and discussion: i) controlled functionalization of CNTs for the
introduction of oxygen functionalities on their surface; ii) deep knowledge on the

18
subsequent structural modifications to better chose the adequate method for each
carbon nanotube structure; iii) characterization and quality development of the
interphase interaction in TiO2/CNT composites; iv) progress in the synthesis of
TiO2/CNT films and their photocatalytic activity assessment in comparable conditions
with those performed for the respective powders.
The present work aims at increasing the knowledge on the development of TiO2
based photocatalytic composites with improved light response in the near-UV to
visible range of the electromagnetic spectrum for water remediation. The selected
approach consisted in the combination of TiO2 with CNTs with an adequate modified
surface with oxygen functionalities, aiming at the formation of improved bonding
between both phases. The designed materials should be able to promote the
oxidation of emerging pollutants or priority substances defined by the EU
Commission Services, under solar radiation in continuous mode at industrial scale.
The manuscript is organized in VI Parts divided by 9 Chapters. This current
introductory revision described the thesis motivation and corresponds to Part I as
being the state of the art of the topic. Part II includes Chapters 2 and 3 and consists
on the description of the Experimental Setups and Analytical techniques used to
obtain the experimental results. Part III includes Chapters 4 and 5 where the chemical
surface modification of different carbon nanotubes structures is carried out and
deeply characterized. The photoactivity of the developed and characterized
TiO2/CNT composites is discussed on the Chapter 6, which composes Part IV. A
customized photocatalytic setup was assembled for the assessment of photocatalytic
composites and corresponds to Chapter 7 on Part V. Part VI includes Chapters 8 and
9 with the final remarks and future work, respectively.
The bibliography revision relative to Chapters 4 to 7 is condensed in Part I. Before
each particular Chapter a brief note is given to frame the developed achievements
within that part of the work. Inside each Chapter the results and discussion are firstly
presented. Complementary experimental details are given at the end of each chapter
in order to provide for the specifics, which are beyond the general descriptions given
within the Chapters 2 and 3 of Part II Experimental Section.
In brief, Chapter 4 is dedicated to the controlled modification of the surface chemistry
of SWCNTs and identification of the desired generated oxygen functionalities
together with a detailed characterization of the following structural modifications due
to the applied hydrothermal HNO3 oxidation.

Part I – Thesis Motivation
19
Chapter 5 stands for the modification of the surface chemistry of MWCNT structures
through the same previously mentioned hydrothermal methodology and compared
with the results achieved for the SWCNTs treated on Chapter 4 and with other
MWCNT nanostructures with different diameter and length. Comparison with the
common HNO3 boiling acid method is discussed.
In Chapter 6, several TiO2/CNT are characterized after being prepared based on
different TiO2 powders with one of them synthesized in the laboratory. Pristine and
previously modified CNTs were used, with high amounts of identified and quantified
oxygen functionalities. The photocatalysts were tested for the oxidative degradation
of the emerging pollutant caffeine as suspensions in a photoimmersion reactor.
Selected composites were further tested in a small cylindrical photo-reactor
deposited in thin glass slides.
Finally, in Chapter 7 a photocatalytic system was assembled to perform consistent
experiments on water treatment studies with catalysts either in powder or film form.
The system was well characterized and improved with optical accessories for a better
usage of the light source and to create different spectral conditions for complete
studies. Characterization was validated with photocatalytic experimental results and
optimal conditions are proposed.
The thesis culminates with final remarks in Chapter 8 with an integrated view of the
obtained results and with some guidelines suggested as future work encouraging the
progress ahead to briefly achieve an effective and real scientific response for the
urgent need of water treatment at industrial scale through heterogeneous
photocatalysis with the promising TiO2/CNT composites, facing the well-known
concerns in nowadays Europe.
1.5 References
[1] Introduction to the new EU Water Framework Directive. 25/04/2014 [cited
10/05/2014]; Available from: http://ec.europa.eu/environment/water/water-
framework/info/intro_en.htm
[2] European waters — assessment of status and pressures. Copenhagen:
European Environment Agency (EEA); 2012.
[3] The European environment — state and outlook 2010 (SOER 2010).
Copenhagen: European Environment Agency (EEA); 2010.
20
[4] Directive 2008/105/EC of the European Parliament and of the Council.
Official Journal of the European Union: Strasbourg 2008.
[5] Priority substances supporting information and documentation. 25/04/2014
[cited 10/05/2014]; Available from: http://ec.europa.eu/environment/water/water-
dangersub/lib_pri_substances.htm
[6] Scott JP, Ollis DF. Integration of chemical and biological oxidation processes
for water treatment: review and recommendations. Environ Prog. 1995; 14 (2):88-
103.
[7] Tabrizi GB, Mehrvar M. Integration of advanced oxidation technologies and
biological processes: Recent developments, trends, and advances. J Environ Sci
Health Part A-Toxic/Hazard Subst Environ Eng. 2004; 39 (11-12):3029-81.
[8] Oller I, Malato S, Sánchez-Pérez JA. Combination of Advanced Oxidation
Processes and biological treatments for wastewater decontamination—A review. Sci
Total Environ. 2011; 409 (20):4141-66.
[9] Augugliaro V, Litter M, Palmisano L, Soria J. The combination of
heterogeneous photocatalysis with chemical and physical operations: A tool for
improving the photoprocess performance. J Photochem Photobiol C-Photochem
Rev. 2006; 7 (4):127-44.
[10] Homem V, Santos L. Degradation and removal methods of antibiotics from
aqueous matrices – A review. J Environ Manage. 2011; 92 (10):2304-47.
[11] Sin JC, Lam SM, Mohamed AR, Lee KT. Degrading endocrine disrupting
chemicals from wastewater by tiO 2 photocatalysis: A review. Int J Photoenergy.
2012; 2012.
[12] Ahmed S, Rasul MG, Martens WN, Brown R, Hashib MA. Heterogeneous
photocatalytic degradation of phenols in wastewater: A review on current status and
developments. Desalination. 2010; 261 (1-2):3-18.
[13] Chiron S, Fernandez-Alba A, Rodriguez A, Garcia-Calvo E. Pesticide
chemical oxidation: State-of-the-art. Water Res. 2000; 34 (2):366-77.
[14] Malato S, Fernández-Ibáñez P, Maldonado MI, Blanco J, Gernjak W.
Decontamination and disinfection of water by solar photocatalysis: Recent overview
and trends. Catal Today. 2009; 147 (1):1-59.

Part I – Thesis Motivation
21
[15] Chong MN, Jin B, Chow CWK, Saint C. Recent developments in
photocatalytic water treatment technology: A review. Water Res. 2010; 44 (10):2997-
3027.
[16] Gogate PR, Pandit AB. A review of imperative technologies for wastewater
treatment I: Oxidation technologies at ambient conditions. Adv Environ Res. 2004; 8
(3-4):501-51.
[17] Gogate PR, Pandit AB. A review of imperative technologies for wastewater
treatment II: Hybrid methods. Adv Environ Res. 2004; 8 (3-4):553-97.
[18] Andreozzi R, Caprio V, Insola A, Marotta R. Advanced oxidation processes
(AOP) for water purification and recovery. Catal Today. 1999; 53 (1):51-9.
[19] Di Paola A, García-López E, Marcì G, Palmisano L. A survey of photocatalytic
materials for environmental remediation. J Hazard Mater. 2012; 211-212:3-29.
[20] Prihod'ko RV, Soboleva NM. Photocatalysis: Oxidative processes in water
treatment. Journal of Chemistry. 2013; Article number 168701.
[21] Ohtani B. Revisiting the fundamental physical chemistry in heterogeneous
photocatalysis: Its thermodynamics and kinetics. Phys Chem Chem Phys. 2014; 16
(5):1788-97.
[22] Silva AMT, Nouli E, Xekoukoulotakis NP, Mantzavinos D. Effect of key
operating parameters on phenols degradation during H2O2-assisted TiO2
photocatalytic treatment of simulated and actual olive mill wastewaters. Appl Catal B-
Environ. 2007; 73 (1-2):11-22.
[23] Silva AMT, Silva CG, Dražić G, Faria JL. Ce-doped TiO2 for photocatalytic
degradation of chlorophenol. Catal Today. 2009; 144 (1-2):13-8.
[24] Silva AMT, Nouli E, Carmo-Apolinário AC, Xekoukoulotakis NP, Mantzavinos
D. Sonophotocatalytic/H2O2 degradation of phenolic compounds in agro-industrial
effluents. Catal Today. 2007; 124 (3-4):232-9.
[25] Kositzi M, Antoniadis A, Poulios I, Kiridis I, Malato S. Solar photocatalytic
treatment of simulated dyestuff effluents. Sol Energy. 2004; 77 (5):591-600.
[26] Jelic A, Michael I, Achilleos A, Hapeshi E, Lambropoulou D, Perez S, et al.
Transformation products and reaction pathways of carbamazepine during
photocatalytic and sonophotocatalytic treatment. J Hazard Mater. 2013; 263:177-86.

22
[27] Arslan I, Balcioǧlu IA, Bahnemann DW. Advanced chemical oxidation of
reactive dyes in simulated dyehouse effluents by ferrioxalate-Fenton/UV-A and
TiO2/UV-A processes. Dyes Pigment. 2000; 47 (3):207-18.
[28] Ali AH, Kapoor S, Kansal SK. Studies on the photocatalytic decolorization of
pararosanilne chloride dye and its simulated dyebath effluent. Desalin Water Treat.
2011; 25 (1-3):268-75.
[29] Faria JL. The heterogeneous photocatalytic process. In: Pereira MM,
Figueiredo JL, Faria JL, eds. Catalysis from Theory to Application - An Integrated
Course. Coimbra: Coimbra University Press 2008, p. 479-94.
[30] Herrmann JM. Photocatalysis fundamentals revisited to avoid several
misconceptions. Appl Catal B-Environ. 2010; 99 (3-4):461-8.
[31] Fujishima A, Zhang X, Tryk DA. TiO2 photocatalysis and related surface
phenomena. Surf Sci Rep. 2008; 63 (12):515-82.
[32] Silva CG, Faria JL. Effect of key operational parameters on the photocatalytic
oxidation of phenol by nanocrystalline sol-gel TiO2 under UV irradiation. J Mol Catal
A: Chem. 2009; 305 (1-2):147-54.
[33] MacWan DP, Dave PN, Chaturvedi S. A review on nano-TiO 2 sol-gel type
syntheses and its applications. J Mater Sci. 2011; 46 (11):3669-86.
[34] Herrmann JM. Heterogeneous photocatalysis: an emerging discipline
involving multiphase systems. Catal Today. 1995; 24 (1–2):157-64.
[35] Isley SL, Penn RL. Titanium Dioxide Nanoparticles: Effect of Sol−Gel pH on
Phase Composition, Particle Size, and Particle Growth Mechanism. J Phys Chem C.
2008; 112 (12):4469-74.
[36] Fujishima A, Zhang X, Tryk DA. Heterogeneous photocatalysis: From water
photolysis to applications in environmental cleanup. Int J Hydrog Energy. 2007; 32
(14):2664-72.
[37] Arconada N, Durán A, Suárez S, Portela R, Coronado JM, Sánchez B, et al.
Synthesis and photocatalytic properties of dense and porous TiO2-anatase thin films
prepared by sol-gel. Appl Catal B-Environ. 2009; 86 (1-2):1-7.
[38] Kolen’ko YV, Garshev AV, Churagulov BR, Boujday S, Portes P, Colbeau-
Justin C. Photocatalytic activity of sol–gel derived titania converted into
nanocrystalline powders by supercritical drying. J Photochem Photobiol A-Chem.
2005; 172 (1):19-26.
Part I – Thesis Motivation
23
[39] Montoya IA, Viveros T, Domínguez JM, Canales LA, Schifter I. On the effects
of the sol-gel synthesis parameters on textural and structural characteristics of TiO2.
Catal Lett. 1992; 15 (1-2):207-17.
[40] Jang JS, Ji SM, Bae SW, Son HC, Lee JS. Optimization of CdS/TiO2 nano-
bulk composite photocatalysts for hydrogen production from Na2S/Na2SO3 aqueous
electrolyte solution under visible light (λ ≥ 420 nm). J Photochem Photobiol A-Chem.
2007; 188 (1):112-9.
[41] Poznyak SK, Talapin DV, Kulak AI. Structural, optical, and
photoelectrochemical properties of nanocrystalline TiO2-In2O3 composite solids and
films prepared by sol-gel method. J Phys Chem B. 2001; 105 (21):4816-23.
[42] Wang W, Serp P, Kalck P, Faria JL. Visible light photodegradation of phenol
on MWNT-TiO2 composite catalysts prepared by a modified sol-gel method. J Mol
Catal A: Chem. 2005; 235 (1-2):194-9.
[43] Wang W, Silva CG, Faria JL. Photocatalytic degradation of Chromotrope 2R
using nanocrystalline TiO2/activated-carbon composite catalysts. Appl Catal B-
Environ. 2007; 70 (1-4):470-8.
[44] Yoshida M, Prasad PN. Sol−Gel-Processed
SiO2/TiO2/Poly(vinylpyrrolidone) Composite Materials for Optical Waveguides.
Chem Mater. 1996; 8 (1):235-41.
[45] Abdelaal MY, Mohamed RM. Novel Pd/TiO2 nanocomposite prepared by
modified sol-gel method for photocatalytic degradation of methylene blue dye under
visible light irradiation. J Alloys Compd. 2013; 576:201-7.
[46] Ohtani B, Prieto-Mahaney OO, Li D, Abe R. What is Degussa (Evonic) P25?
Crystalline composition analysis, reconstruction from isolated pure particles and
photocatalytic activity test. J Photochem Photobiol A-Chem. 2010; 216 (2-3):179-82.
[47] Eufinger K, Poelman D, Poelman H, De Gryse R, Marin GB. Photocatalytic
activity of dc magnetron sputter deposited amorphous TiO2 thin films. Appl Surf Sci.
2007; 254 (1):148-52.
[48] Zhang Z, Wang C-C, Zakaria R, Ying JY. Role of Particle Size in
Nanocrystalline TiO2-Based Photocatalysts. J Phys Chem B. 1998; 102 (52):10871-
8.

24
[49] Silva CG, Faria JL. Anatase vs.rutile efficiency on the photocatalytic
degradation of clofibric acid under near UV to visible irradiation. Photochem Photobiol
Sci. 2009; 8 (5):705-11.
[50] Crystal Structure Gallery. [cited 10/05/2014]; Available from:
https://staff.aist.go.jp/nomura-k/english/itscgallary-e.htm
[51] Space Environment (natural and artificial) - Process for determining solar
irradiances (ISO 21348). ISO copyright office: Switzerland 2007.
[52] Global Solar UV Index. 2014 [cited 10/05/2014]; Available from:
http://www.who.int/uv/publications/globalindex/en/
[53] Properties of sunlight. Terrestrial Solar Radiation. Atmospheric Effects.
[cited 10/05/2014]; Available from: http://pveducation.org/pvcdrom/properties-of-
sunlight/atmospheric-effects
[54] Mills AL, Soo-Keun. Semiconductor photocatalysis. In: Parsons S, ed.
Advanced Oxidation Processes for Water and Wastewater Treatment. London: IWA
Publishing 2004, p. 137-66.
[55] Daghrir R, Drogui P, Robert D. Modified TiO2 for environmental
photocatalytic applications: A review. Ind Eng Chem Res. 2013; 52 (10):3581-99.
[56] Cao Q, Yu Q, Connell DW, Yu G. Titania/carbon nanotube composite
(TiO2/CNT) and its application for removal of organic pollutants. Clean Technol
Environ Policy. 2013; 15 (6):871-80.
[57] Park H, Park Y, Kim W, Choi W. Surface modification of TiO2 photocatalyst
for environmental applications. J Photochem Photobiol C-Photochem Rev. 2013; 15
(1):1-20.
[58] Ohno T, Akiyoshi M, Umebayashi T, Asai K, Mitsui T, Matsumura M.
Preparation of S-doped TiO2 photocatalysts and their photocatalytic activities under
visible light. Appl Catal A-Gen. 2004; 265 (1):115-21.
[59] Klosek S, Raftery D. Visible light driven V-doped TiO2 photocatalyst and its
photooxidation of ethanol. J Phys Chem B. 2001; 105 (14):2815-9.
[60] Braun A, Akurati KK, Fortunato G, Reifler FA, Ritter A, Harvey AS, et al.
Nitrogen Doping of TiO2 Photocatalyst Forms a Second eg State in the Oxygen 1s
NEXAFS Pre-edge. J Phys Chem C. 2009; 114 (1):516-9.

Part I – Thesis Motivation
25
[61] Chen D, Jiang Z, Geng J, Wang Q, Yang D. Carbon and nitrogen co-doped
TiO2 with enhanced visible-light photocatalytic activity. Ind Eng Chem Res. 2007; 46
(9):2741-6.
[62] Dozzi MV, Selli E. Doping TiO2 with p-block elements: Effects on
photocatalytic activity. J Photochem Photobiol C-Photochem Rev. 2013; 14 (1):13-
28.
[63] Michalow KA, Logvinovich D, Weidenkaff A, Amberg M, Fortunato G, Heel A,
et al. Synthesis, characterization and electronic structure of nitrogen-doped TiO2
nanopowder. Catal Today. 2009; 144 (1–2):7-12.
[64] Devi LG, Kavitha R. A review on non metal ion doped titania for the
photocatalytic degradation of organic pollutants under UV/solar light: Role of
photogenerated charge carrier dynamics in enhancing the activity. Appl Catal B-
Environ. 2013; 140-141:559-87.
[65] Zaleska A. Doped-TiO2: A review. Recent Pat Engin. 2008; 2 (3):157-64.
[66] Akurati KK, Vital A, Dellemann J-P, Michalow K, Graule T, Ferri D, et al.
Flame-made WO3/TiO2 nanoparticles: Relation between surface acidity, structure
and photocatalytic activity. Appl Catal B-Environ. 2008; 79 (1):53-62.
[67] Leary R, Westwood A. Carbonaceous nanomaterials for the enhancement of
TiO2 photocatalysis. Carbon. 2011; 49 (3):741-72.
[68] Morales-Torres S, Pastrana-Martínez LM, Figueiredo JL, Faria JL, Silva
AMT. Design of graphene-based TiO2 photocatalysts-a review. Environmental
Science and Pollution Research. 2012; 19 (9):3676-87.
[69] Morales-Torres S, Pastrana-Martínez LM, Figueiredo JL, Faria JL, Silva
AMT. Graphene oxide-P25 photocatalysts for degradation of diphenhydramine
pharmaceutical and methyl orange dye. Appl Surf Sci. 2013; 275:361-8.
[70] Zhang H, Lv X, Li Y, Wang Y, Li J. P25-graphene composite as a high
performance photocatalyst. ACS Nano. 2010; 4 (1):380-6.
[71] Marques RRN, Sampaio MJ, Carrapiço PM, Silva CG, Morales-Torres S,
Dražić G, et al. Photocatalytic degradation of caffeine: Developing solutions for
emerging pollutants. Catal Today. 2013; 209:108-15.
[72] Araña J, Doña-Rodríguez JM, Portillo-Carrizo D, Fernández-Rodríguez C,
Pérez-Peña J, González Díaz O, et al. Photocatalytic degradation of phenolic
compounds with new TiO2 catalysts. Appl Catal B-Environ. 2010; 100 (1-2):346-54.

26
[73] Sampaio MJ, Silva CG, Marques RRN, Silva AMT, Faria JL. Carbon
nanotube–TiO2 thin films for photocatalytic applications. Catal Today. 2011; 161
(1):91-6.
[74] Yao Y, Li G, Ciston S, Lueptow RM, Gray KA. Photoreactive TiO2/Carbon
Nanotube Composites: Synthesis and Reactivity. Environ Sci Technol. 2008; 42
(13):4952-7.
[75] Tian L, Ye L, Deng K, Zan L. TiO2/carbon nanotube hybrid nanostructures:
Solvothermal synthesis and their visible light photocatalytic activity. J Solid State
Chem. 2011; 184 (6):1465-71.
[76] Silva CG, Faria JL. Photocatalytic Oxidation of Phenolic Compounds by
Using a Carbon Nanotube-Titanium Dioxide Composite Catalyst. ChemSusChem.
2010; 3 (5):609-18.
[77] Martínez C, Canle L M, Fernández MI, Santaballa JA, Faria J. Kinetics and
mechanism of aqueous degradation of carbamazepine by heterogeneous
photocatalysis using nanocrystalline TiO2, ZnO and multi-walled carbon nanotubes-
anatase composites. Appl Catal B-Environ. 2011; 102 (3-4):563-71.
[78] Ouyang K, Xie S, Ma X. Photocatalytic activity of TiO2 supported on multi-
walled carbon nanotubes under simulated solar irradiation. Ceram Int. 2013; 39
(7):7531-6.
[79] Dionysiou DD, Burbano AA, Suidan MT, Baudin I, Laîné J-M. Effect of
Oxygen in a Thin-Film Rotating Disk Photocatalytic Reactor. Environ Sci Technol.
2002; 36 (17):3834-43.
[80] Kowalska E, Rau S. Photoreactors for Wastewater Treatment: A Review.
Recent Pat Engin. 2010; 4 (3):242-66.
[81] Langlet M, Kim A, Audier M, Guillard C, Herrmann JM. Transparent
photocatalytic films deposited on polymer substrates from sol–gel processed titania
sols. Thin Solid Films. 2003; 429 (1–2):13-21.
[82] Sampaio MJ, Silva CG, Silva AM, Vilar VJ, Boaventura RA, Faria JL.
Photocatalytic activity of Tio2-coated glass raschig rings on the degradation of
phenolic derivatives under simulated solar light irradiation. Chem Eng J. 2013; 224
(1):32-8.
[83] Sampaio MJ, Marques RRN, Tavares PB, Faria JL, Silva AMT, Silva CG.
Tailoring the properties of immobilized titanium dioxide/carbon nanotube composites

Part I – Thesis Motivation
27
for photocatalytic water treatment. Journal of Environmental Chemical Engineering
(JECE). 2013; 1 (4):945-53.
[84] Bosc F, Ayral A, Albouy P-A, Guizard C. A Simple Route for Low-
Temperature Synthesis of Mesoporous and Nanocrystalline Anatase Thin Films.
Chem Mater. 2003; 15 (12):2463-8.
[85] Koelsch M, Cassaignon S, Ta Thanh Minh C, Guillemoles JF, Jolivet JP.
Electrochemical comparative study of titania (anatase, brookite and rutile)
nanoparticles synthesized in aqueous medium. Thin Solid Films. 2004; 451–452
(0):86-92.
[86] Çamurlu HE, Kesmez O, Burunkaya E, Kiraz N, Yȩsil Z, Asiltürk M, et al. Sol-
gel thin films with anti-reflective and self-cleaning properties. Chem Pap. 2012; 66
(5):461-71.
[87] Wang J, Cai Q, Li H, Cui Y, Wang H. A review on TiO 2 nanotube film
photocatalysts prepared by liquid-phase deposition. Int J Photoenergy. 2012; 2012.
[88] Akbarzadeh R, Umbarkar SB, Sonawane RS, Takle S, Dongare MK.
Vanadia–titania thin films for photocatalytic degradation of formaldehyde in sunlight.
Appl Catal A-Gen. 2010; 374 (1–2):103-9.
[89] Han H, Bai R. Effect of Thickness of Photocatalyst Film Immobilized on a
Buoyant Substrate on the Degradation of Methyl Orange Dye in Aqueous Solutions
under Different Light Irradiations. Ind Eng Chem Res. 2011; 50 (21):11922-9.
[90] Krýsa J, Novotná P, Kment Š, Mills A. Effect of glass substrate and deposition
technique on the properties of sol gel TiO2 thin films. J Photochem Photobiol A-
Chem. 2011; 222 (1):81-6.
[91] Yurdakal S, Loddo V, Palmisano G, Augugliaro V, Berber Hs, Palmisano L.
Kinetics of 4-Methoxybenzyl Alcohol Oxidation in Aqueous Solution in a Fixed Bed
Photocatalytic Reactor. Ind Eng Chem Res. 2009; 49 (15):6699-708.
[92] Pastrana-Martínez LM, Morales-Torres S, Papageorgiou SK, Katsaros FK,
Romanos GE, Figueiredo JL, et al. Photocatalytic behaviour of nanocarbon-TiO2
composites and immobilization into hollow fibres. Appl Catal B-Environ. 2013; 142-
143:101-11.
[93] Chen Y, Dionysiou DD. Bimodal mesoporous TiO2–P25 composite thick
films with high photocatalytic activity and improved structural integrity. Appl Catal B-
Environ. 2008; 80 (1–2):147-55.

28
[94] Seeley ZM, Bandyopadhyay A, Bose S. Titanium dioxide thin films for high
temperature gas sensors. Thin Solid Films. 2010; 519 (1):434-8.
[95] Berni A, Mennig M, Schmidt H. Doctor Blade. In: Aegerter M, Mennig M, eds.
Sol-Gel Technologies for Glass Producers and Users: Springer US 2004, p. 89-92.
[96] Dresselhaus MS, Dresselhaus G, Jorio A. Unusual Properties and Structure
of Carbon Nanotubes. Ann Rev Mater Res. 2004; 34 (1):247-78.
[97] Serp P, Figueiredo JL. Carbon Nanotubes and Nanofibers in Catalysis. In:
John Wiley & Sons I, ed. Carbon Materials for Catalysis. New Jersey: John Wiley &
Sons, Inc. 2009, p. 309-72.
[98] Ouyang M, Huang J-L, Lieber CM. Fundamental Electronic Properties and
Applications of Single-Walled Carbon Nanotubes. Acc Chem Res. 2002; 35
(12):1018-25.
[99] Iijima S. Helical microtubules of graphitic carbon. Nature. 1991; 354
(6348):56-8.
[100] Iijima S, Ichihashi T. Single-shell carbon nanotubes of 1-nm diameter.
Nature. 1993; 363 (6430):603-5.
[101] Bethune DS, Klang CH, de Vries MS, Gorman G, Savoy R, Vazquez J, et al.
Cobalt-catalysed growth of carbon nanotubes with single-atomic-layer walls. Nature.
1993; 363 (6430):605-7.
[102] Thess A, Lee R, Nikolaev P, Dai H, Petit P, Robert J, et al. Crystalline Ropes
of Metallic Carbon Nanotubes. Science. 1996; 273 (5274):483-7.
[103] Eklund P AP, Blackmon R, Hart AJ, Kong J, Pradhan B, et al. WTEC
international assessment of research and development of carbon nanotube
manufacturing and applications. Technical Report.; 2007.
[104] Danafar F, Fakhru'l-Razi A, Salleh MAM, Biak DRA. Fluidized bed catalytic
chemical vapor deposition synthesis of carbon nanotubes-A review. Chem Eng J.
2009; 155 (1-2):37-48.
[105] Dervishi E, Li Z, Xu Y, Saini V, Biris AR, Lupu D, et al. Carbon nanotubes:
Synthesis, properties, and applications. Part Sci Technol. 2009; 27 (2):107-25.
[106] Prasek J, Drbohlavova J, Chomoucka J, Hubalek J, Jasek O, Adam V, et al.
Methods for carbon nanotubes synthesis - Review. J Mater Chem. 2011; 21
(40):15872-84.
Part I – Thesis Motivation
29
[107] See CH, Harris AT. A review of carbon nanotube synthesis via fluidized-bed
chemical vapor deposition. Ind Eng Chem Res. 2007; 46 (4):997-1012.
[108] Terrones M. Science and Technology of the Twenty-First Century: Synthesis,
Properties, and Applications of Carbon Nanotubes. Ann Rev Mater Res. 2003;
33:419-501.
[109] Lehman JH, Terrones M, Mansfield E, Hurst KE, Meunier V. Evaluating the
characteristics of multiwall carbon nanotubes. Carbon. 2011; 49 (8):2581-602.
[110] Tessonnier J-P, Rosenthal D, Hansen TW, Hess C, Schuster ME, Blume R,
et al. Analysis of the structure and chemical properties of some commercial carbon
nanostructures. Carbon. 2009; 47 (7):1779-98.
[111] Kumar M, Ando Y. Chemical vapor deposition of carbon nanotubes: A review
on growth mechanism and mass production. J Nanosci Nanotechnol. 2010; 10
(6):3739-58.
[112] Rinaldi A, Frank B, Su DS, Hamid SBA, Schlögl R. Facile Removal of
Amorphous Carbon from Carbon Nanotubes by Sonication. Chem Mater. 2011; 23
(4):926-8.
[113] Behler K, Osswald S, Ye H, Dimovski S, Gogotsi Y. Effect of thermal
treatment on the structure of multi-walled carbon nanotubes. J Nanopart Res. 2006;
8 (5):615-25.
[114] Serp P, Corrias M, Kalck P. Carbon nanotubes and nanofibers in catalysis.
Applied Catalysis A: General. 2003; 253 (2):337-58.
[115] Pahmy RH, Mohamed AR. Utilization of carbon nanotubes as a support
material in metal-based catalyst systems: Applications in catalysis. Recent Pat Engin.
2012; 6 (1):31-47.
[116] Endo M, Strano MS, Ajayan PM. Potential applications of carbon nanotubes.
In: Jorio A, Dresselhaus G, Dresselhaus MS, eds. Carbon Nanotubes Advanced
Topics in the Synthesis, Structure, Properties and Applications: Springer-Verlag
Berlin Heidelberg 2008, p. 13-62.
[117] Schnorr JM, Swager TM. Emerging Applications of Carbon Nanotubes.
Chem Mater. 2010; 23 (3):646-57.
[118] Baughman RH, Zakhidov AA, de Heer WA. Carbon Nanotubes--the Route
Toward Applications. Science. 2002; 297 (5582):787-92.

30
[119] Charlier JC. Defects in carbon nanotubes. Acc Chem Res. 2002; 35
(12):1063-9.
[120] Banerjee S, Hemraj-Benny T, Wong SS. Covalent Surface Chemistry of
Single-Walled Carbon Nanotubes. Adv Mater. 2005; 17 (1):17-29.
[121] Balasubramanian K, Burghard M. Chemically Functionalized Carbon
Nanotubes. Small. 2005; 1 (2):180-92.
[122] De Volder MFL, Tawfick SH, Baughman RH, Hart AJ. Carbon nanotubes:
Present and future commercial applications. Science. 2013; 339 (6119):535-9.
[123] Oriňáková R, Oriňák A. Recent applications of carbon nanotubes in hydrogen
production and storage. Fuel. 2011; 90 (11):3123-40.
[124] Vairavapandian D, Vichchulada P, Lay MD. Preparation and modification of
carbon nanotubes: Review of recent advances and applications in catalysis and
sensing. Anal Chim Acta. 2008; 626 (2):119-29.
[125] Garcia J, Gomes HT, Serp P, Kalck P, Figueiredo JL, Faria JL. Carbon
nanotube supported ruthenium catalysts for the treatment of high strength
wastewater with aniline using wet air oxidation. Carbon. 2006; 44 (12):2384-91.
[126] Akuzawa N, Okano Y, Iwashita T, Matsumoto R, Soneda Y. Application of
alkali metal-doped carbons for hydrogen recovery and isotope separation. J Nanosci
Nanotechnol. 2011; 11 (10):9046-9.
[127] Li N, Lee G, Yang JW, Kim H, Yeom MS, Scheicher RH, et al. Noncovalent
functionalization with alkali metal to separate semiconducting from metallic carbon
nanotubes: A theoretical study. J Phys Chem C. 2013; 117 (8):4309-13.
[128] Baleizão C, Gigante B, Garcia H, Corma A. Vanadyl salen complexes
covalently anchored to single-wall carbon nanotubes as heterogeneous catalysts for
the cyanosilylation of aldehydes. J Catal. 2004; 221 (1):77-84.
[129] Zhang Y, Li J, Gao F, Kang F, Wang X, Ye F, et al. Electropolymerization
and electrochemical performance of salen-type redox polymer on different carbon
supports for supercapacitors. Electrochim Acta. 2012; 76:1-7.
[130] Lafuente E, Callejas MA, Sainz R, Benito AM, Maser WK, Sanjuán ML, et al.
The influence of single-walled carbon nanotube functionalization on the electronic
properties of their polyaniline composites. Carbon. 2008; 46 (14):1909-17.
[131] Liao Y, Li XG, Hoek EMV, Kaner RB. Carbon nanotube/polyaniline nanofiber
ultrafiltration membranes. J Mater Chem A. 2013; 1 (48):15390-6.

Part I – Thesis Motivation
31
[132] Afkhami A, Soltani-Felehgari F, Madrakian T, Ghaedi H. Surface decoration
of multi-walled carbon nanotubes modified carbon paste electrode with gold
nanoparticles for electro-oxidation and sensitive determination of nitrite. Biosens
Bioelectron. 2014; 51:379-85.
[133] Wang S, Li L, Jin H, Yang T, Bao W, Huang S, et al. Electrochemical
detection of hepatitis B and papilloma virus DNAs using SWCNT array coated with
gold nanoparticles. Biosens Bioelectron. 2013; 41 (1):205-10.
[134] Rocha RP, Silva AMT, Romero SMM, Pereira MFR, Figueiredo JL. The role
of O- and S-containing surface groups on carbon nanotubes for the elimination of
organic pollutants by catalytic wet air oxidation. Appl Catal B-Environ. 2014; 147:314-
21.
[135] Datsyuk V, Kalyva M, Papagelis K, Parthenios J, Tasis D, Siokou A, et al.
Chemical oxidation of multiwalled carbon nanotubes. Carbon. 2008; 46 (6):833-40.
[136] Reyhani A, Mortazavi SZ, Nozad Golikand A, Moshfegh AZ, Mirershadi S.
The effect of various acids treatment on the purification and electrochemical
hydrogen storage of multi-walled carbon nanotubes. J Power Sources. 2008; 183
(2):539-43.
[137] Pereira MFR, Figueiredo JL, Órfão JJM, Serp P, Kalck P, Kihn Y. Catalytic
activity of carbon nanotubes in the oxidative dehydrogenation of ethylbenzene.
Carbon. 2004; 42 (14):2807-13.
[138] Solhy A, Machado BF, Beausoleil J, Kihn Y, Gonçalves F, Pereira MFR, et
al. MWCNT activation and its influence on the catalytic performance of Pt/MWCNT
catalysts for selective hydrogenation. Carbon. 2008; 46 (9):1194-207.
[139] Tedim J, Gonçalves F, Pereira MFR, Figueiredo JL, Moura C, Freire C, et al.
Preparation and characterization of poly[Ni(salen)(crown receptor)]/multi-walled
carbon nanotube composite films. Electrochim Acta. 2008; 53 (23):6722-31.
[140] Liu J, Rinzler AG, Dai H, Hafner JH, Bradley RK, Boul PJ, et al. Fullerene
Pipes. Science. 1998; 280 (5367):1253-6.
[141] Kuznetsova A, Popova I, Yates JT, Bronikowski MJ, Huffman CB, Liu J, et
al. Oxygen-Containing Functional Groups on Single-Wall Carbon Nanotubes:
NEXAFS and Vibrational Spectroscopic Studies. J Am Chem Soc. 2001; 123
(43):10699-704.

32
[142] Liu M, Yang Y, Zhu T, Liu Z. A General Approach to Chemical Modification
of Single-Walled Carbon Nanotubes with Peroxy Organic Acids and Its Application in
Polymer Grafting. J Phys Chem C. 2007; 111 (6):2379-85.
[143] Laudenbach J, Gebhardt B, Syrgiannis Z, Hauke F, Hirsch A, Maultzsch J.
Raman bands of nano-graphene flakes on carbon nanotubes after oxidation. Phys
Status Solidi B. 2013; 250 (12):2687-91.
[144] Likodimos V, Steriotis TA, Papageorgiou SK, Romanos GE, Marques RRN,
Rocha RP, et al. Controlled surface functionalization of multiwall carbon nanotubes
by HNO3 hydrothermal oxidation. Carbon. 2014; 69:311-26.
[145] Hou P-X, Liu C, Cheng H-M. Purification of carbon nanotubes. Carbon. 2008;
46 (15):2003-25.
[146] Wang Q, Yang D, Chen D, Wang Y, Jiang Z. Synthesis of anatase titania-
carbon nanotubes nanocomposites with enhanced photocatalytic activity through a
nanocoating-hydrothermal process. J Nanopart Res. 2007; 9 (6):1087-96.
[147] Noh JS, Schwarz JA. Effect of HNO3 treatment on the surface acidity of
activated carbons. Carbon. 1990; 28 (5):675-82.
[148] Papirer E, Dentzer J, Li S, Donnet JB. Surface groups on nitric acid oxidized
carbon black samples determined by chemical and thermodesorption analyses.
Carbon. 1991; 29 (1):69-72.
[149] Bandosz TJ, Jagiello J, Schwarz JA. Comparison of methods to assess
surface acidic groups on activated carbons. Anal Chem. 1992; 64 (8):891-5.
[150] Otake Y, Jenkins RG. Characterization of oxygen-containing surface
complexes created on a microporous carbon by air and nitric acid treatment. Carbon.
1993; 31 (1):109-21.
[151] Fanning PE, Vannice MA. A DRIFTS study of the formation of surface groups
on carbon by oxidation. Carbon. 1993; 31 (5):721-30.
[152] Vinke P, van der Eijk M, Verbree M, Voskamp AF, van Bekkum H.
Modification of the surfaces of a gasactivated carbon and a chemically activated
carbon with nitric acid, hypochlorite, and ammonia. Carbon. 1994; 32 (4):675-86.
[153] Menéndez JA, Illán-Gómez MJ, y León CAL, Radovic LR. On the difference
between the isoelectric point and the point of zero charge of carbons. Carbon. 1995;
33 (11):1655-7.

Part I – Thesis Motivation
33
[154] Moreno-Castilla C, Ferro-Garcia MA, Joly JP, Bautista-Toledo I, Carrasco-
Marin F, Rivera-Utrilla J. Activated Carbon Surface Modifications by Nitric Acid,
Hydrogen Peroxide, and Ammonium Peroxydisulfate Treatments. Langmuir. 1995;
11 (11):4386-92.
[155] Hu H, Zhao B, Itkis ME, Haddon RC. Nitric Acid Purification of Single-Walled
Carbon Nanotubes. J Phys Chem B. 2003; 107 (50):13838-42.
[156] Apolinário ÂC, Silva AMT, Machado BF, Gomes HT, Araújo PP, Figueiredo
JL, et al. Wet air oxidation of nitro-aromatic compounds: Reactivity on single- and
multi-component systems and surface chemistry studies with a carbon xerogel. Appl
Catal B-Environ. 2008; 84 (1–2):75-86.
[157] Gomes HT, Machado BF, Ribeiro A, Moreira I, Rosário M, Silva AMT, et al.
Catalytic properties of carbon materials for wet oxidation of aniline. J Hazard Mater.
2008; 159 (2–3):420-6.
[158] Silva AMT, Machado BF, Figueiredo JL, Faria JL. Controlling the surface
chemistry of carbon xerogels using HNO3-hydrothermal oxidation. Carbon. 2009; 47
(7):1670-9.
[159] Seredych M, Tamashausky AV, Bandosz TJ. Surface features of exfoliated
graphite/bentonite composites and their importance for ammonia adsorption. Carbon.
2008; 46 (9):1241-52.
[160] Calvillo L, Lázaro MJ, García-Bordejé E, Moliner R, Cabot PL, Esparbé I, et
al. Platinum supported on functionalized ordered mesoporous carbon as
electrocatalyst for direct methanol fuel cells. J Power Sources. 2007; 169 (1):59-64.
[161] Salgado JRC, Quintana JJ, Calvillo L, Lazaro MJ, Cabot PL, Esparbe I, et al.
Carbon monoxide and methanol oxidation at platinum catalysts supported on ordered
mesoporous carbon: the influence of functionalization of the support. Phys Chem
Chem Phys. 2008; 10 (45):6796-806.
[162] Zhang J, Zou H, Qing Q, Yang Y, Li Q, Liu Z, et al. Effect of Chemical
Oxidation on the Structure of Single-Walled Carbon Nanotubes. J Phys Chem B.
2003; 107 (16):3712-8.
[163] Park T-J, Banerjee S, Hemraj-Benny T, Wong SS. Purification strategies and
purity visualization techniques for single-walled carbon nanotubes. J Mater Chem.
2006; 16 (2):141-54.

34
[164] Yang C-M, Park JS, An KH, Lim SC, Seo K, Kim B, et al. Selective Removal
of Metallic Single-Walled Carbon Nanotubes with Small Diameters by Using Nitric
and Sulfuric Acids. J Phys Chem B. 2005; 109 (41):19242-8.
[165] Komatsu N, Wang F. A comprehensive review on separation methods and
techniques for single-walled carbon nanotubes. Materials. 2010; 3 (7):3818-44.
[166] Kundu S, Wang Y, Xia W, Muhler M. Thermal Stability and Reducibility of
Oxygen-Containing Functional Groups on Multiwalled Carbon Nanotube Surfaces: A
Quantitative High-Resolution XPS and TPD/TPR Study. J Phys Chem C. 2008; 112
(43):16869-78.
[167] Wepasnick KA, Smith BA, Schrote KE, Wilson HK, Diegelmann SR,
Fairbrother DH. Surface and structural characterization of multi-walled carbon
nanotubes following different oxidative treatments. Carbon. 2011; 49 (1):24-36.
[168] Marques RRN, Machado BF, Faria JL, Silva AMT. Controlled generation of
oxygen functionalities on the surface of Single-Walled Carbon Nanotubes by HNO3
hydrothermal oxidation. Carbon. 2010; 48 (5):1515-23.
[169] Gerber I, Oubenali M, Bacsa R, Durand J, Gonçalves A, Pereira MFR, et al.
Theoretical and Experimental Studies on the Carbon-Nanotube Surface Oxidation by
Nitric Acid: Interplay between Functionalization and Vacancy Enlargement. Chem-
Eur J. 2011; 17 (41):11467-77.
[170] Tchoul MN, Ford WT, Lolli G, Resasco DE, Arepalli S. Effect of Mild Nitric
Acid Oxidation on Dispersability, Size, and Structure of Single-Walled Carbon
Nanotubes. Chem Mater. 2007; 19 (23):5765-72.
[171] Smith B, Wepasnick K, Schrote KE, Cho H-H, Ball WP, Fairbrother DH.
Influence of Surface Oxides on the Colloidal Stability of Multi-Walled Carbon
Nanotubes: A Structure−Property Relationship. Langmuir. 2009; 25 (17):9767-76.
[172] Kim SW, Kim T, Kim YS, Choi HS, Lim HJ, Yang SJ, et al. Surface
modifications for the effective dispersion of carbon nanotubes in solvents and
polymers. Carbon. 2012; 50 (1):3-33.
[173] Coleman JN, Khan U, Blau WJ, Gun’ko YK. Small but strong: A review of the
mechanical properties of carbon nanotube–polymer composites. Carbon. 2006; 44
(9):1624-52.
[174] Karousis N, Tagmatarchis N, Tasis D. Current Progress on the Chemical
Modification of Carbon Nanotubes. Chem Rev. 2010; 110 (9):5366-97.

Part I – Thesis Motivation
35
[175] Andrade NF, Martinez DST, Paula AJ, Silveira JV, Alves OL, Souza Filho
AG. Temperature effects on the nitric acid oxidation of industrial grade multiwalled
carbon nanotubes. J Nanopart Res. 2013; 15 (7).
[176] Bergeret Cl, Cousseau J, Fernandez V, Mevellec J-Y, Lefrant S.
Spectroscopic Evidence of Carbon Nanotubes’ Metallic Character Loss Induced by
Covalent Functionalization via Nitric Acid Purification. J Phys Chem C. 2008; 112
(42):16411-6.
[177] Salzmann CG, Llewellyn SA, Tobias G, Ward MAH, Huh Y, Green MLH. The
Role of Carboxylated Carbonaceous Fragments in the Functionalization and
Spectroscopy of a Single-Walled Carbon-Nanotube Material. Adv Mater. 2007; 19
(6):883-7.
[178] Yu H, Jin Y, Peng F, Wang H, Yang J. Kinetically Controlled Side-Wall
Functionalization of Carbon Nanotubes by Nitric Acid Oxidation. J Phys Chem C.
2008; 112 (17):6758-63.
[179] Worsley KA, Kalinina I, Bekyarova E, Haddon RC. Functionalization and
Dissolution of Nitric Acid Treated Single-Walled Carbon Nanotubes. J Am Chem Soc.
2009; 131 (50):18153-8.
[180] Price BK, Lomeda JR, Tour JM. Aggressively Oxidized Ultra-Short Single-
Walled Carbon Nanotubes Having Oxidized Sidewalls. Chem Mater. 2009; 21
(17):3917-23.
[181] Romanos GE, Likodimos V, Marques RRN, Steriotis TA, Papageorgiou SK,
Faria JL, et al. Controlling and Quantifying Oxygen Functionalities on Hydrothermally
and Thermally Treated Single-Wall Carbon Nanotubes. J Phys Chem C. 2011; 115
(17):8534-46.
[182] Del Canto E, Flavin K, Movia D, Navio C, Bittencourt C, Giordani S. Critical
Investigation of Defect Site Functionalization on Single-Walled Carbon Nanotubes.
Chem Mater. 2010; 23 (1):67-74.
[183] Rosca ID, Watari F, Uo M, Akasaka T. Oxidation of multiwalled carbon
nanotubes by nitric acid. Carbon. 2005; 43 (15):3124-31.
[184] Verdejo R, Lamoriniere S, Cottam B, Bismarck A, Shaffer M. Removal of
oxidation debris from multi-walled carbon nanotubes. Chem Commun. 2007; (5):513-
5.

36
[185] González-Guerrero AB, Mendoza E, Pellicer E, Alsina F, Fernández-
Sánchez C, Lechuga LM. Discriminating the carboxylic groups from the total acidic
sites in oxidized multi-wall carbon nanotubes by means of acid–base titration. Chem
Phys Lett. 2008; 462 (4–6):256-9.
[186] Wang Z, Shirley MD, Meikle ST, Whitby RLD, Mikhalovsky SV. The surface
acidity of acid oxidised multi-walled carbon nanotubes and the influence of in-situ
generated fulvic acids on their stability in aqueous dispersions. Carbon. 2009; 47
(1):73-9.
[187] Rinaldi A, Zhang J, Frank B, Su DS, Abd Hamid SB, Schlögl R. Oxidative
Purification of Carbon Nanotubes and Its Impact on Catalytic Performance in
Oxidative Dehydrogenation Reactions. ChemSusChem. 2010; 3 (2):254-60.
[188] Ambrosi A, Pumera M. Amorphous Carbon Impurities Play an Active Role in
Redox Processes of Carbon Nanotubes. J Phys Chem C. 2011; 115 (51):25281-4.
[189] Zhang M, Yudasaka M, Iijima S. Diameter Enlargement of Single-Wall
Carbon Nanotubes by Oxidation. J Phys Chem B. 2004; 108 (1):149-53.
[190] Zhou W, Vavro J, Nemes NM, Fischer JE, Borondics F, Kamarás K, et al.
Charge transfer and Fermi level shift in p-doped single-walled carbon nanotubes.
Phys Rev B. 2005; 71 (20):205423.
[191] Forrest GA, Alexander AJ. A Model for the Dependence of Carbon Nanotube
Length on Acid Oxidation Time. J Phys Chem C. 2007; 111 (29):10792-8.
[192] Dementev N, Feng X, Borguet E. Fluorescence Labeling and Quantification
of Oxygen-Containing Functionalities on the Surface of Single-Walled Carbon
Nanotubes. Langmuir. 2009; 25 (13):7573-7.
[193] Moraitis G, Špitalský Z, Ravani F, Siokou A, Galiotis C. Electrochemical
oxidation of multi-wall carbon nanotubes. Carbon. 2011; 49 (8):2702-8.
[194] Ming J, Wu Y, Yu Y, Zhao F. Steaming multiwalled carbon nanotubesvia acid
vapour for controllable nanoengineering and the fabrication of carbon nanoflutes.
Chem Commun. 2011; 47 (18):5223-5.
[195] Boehm HP. Surface oxides on carbon and their analysis: a critical
assessment. Carbon. 2002; 40 (2):145-9.
[196] Itkis ME, Perea DE, Jung R, Niyogi S, Haddon RC. Comparison of Analytical
Techniques for Purity Evaluation of Single-Walled Carbon Nanotubes. J Am Chem
Soc. 2005; 127 (10):3439-48.

Part I – Thesis Motivation
37
[197] Dresselhaus MS, Dresselhaus G, Saito R, Jorio A. Raman spectroscopy of
carbon nanotubes. Phys Rep. 2005; 409 (2):47-99.
[198] Pimenta MA, Dresselhaus G, Dresselhaus MS, Cancado LG, Jorio A, Saito
R. Studying disorder in graphite-based systems by Raman spectroscopy. Phys Chem
Chem Phys. 2007; 9 (11):1276-90.
[199] Dresselhaus MS, Jorio A, Hofmann M, Dresselhaus G, Saito R. Perspectives
on carbon nanotubes and graphene Raman spectroscopy. Nano Lett. 2010; 10
(3):751-8.
[200] Cançado LG, Hartschuh A, Novotny L. Tip-enhanced Raman spectroscopy
of carbon nanotubes. J Raman Spectrosc. 2009; 40 (10):1420-6.
[201] Fantini C, Pimenta MA, Strano MS. Two-Phonon Combination Raman Modes
in Covalently Functionalized Single-Wall Carbon Nanotubes. J Phys Chem C. 2008;
112 (34):13150-5.
[202] Maciel IO, Anderson N, Pimenta MA, Hartschuh A, Qian H, Terrones M, et
al. Electron and phonon renormalization near charged defects in carbon nanotubes.
Nat Mater. 2008; 7 (11):878-83.
[203] Kavan L, Kalbác M, Zukalová M, Dunsch L. Electrochemical Doping of
Chirality-Resolved Carbon Nanotubes. J Phys Chem B. 2005; 109 (42):19613-9.
[204] Graupner R. Raman spectroscopy of covalently functionalized single-wall
carbon nanotubes. J Raman Spectrosc. 2007; 38 (6):673-83.


Part II
Experimental Setups and Analytical Techniques


2 Experimental Setups
Different setups were used to perform the experimental studies involved on the
modification of carbon nanotubes surface chemistry through liquid nitric acid
oxidation and on photocatalytic reactions in liquid phase to assess the catalytic
activity of the prepared TiO2/CNT composites. The experimental setups and the
corresponding procedures performed in the present study are described in this
section.

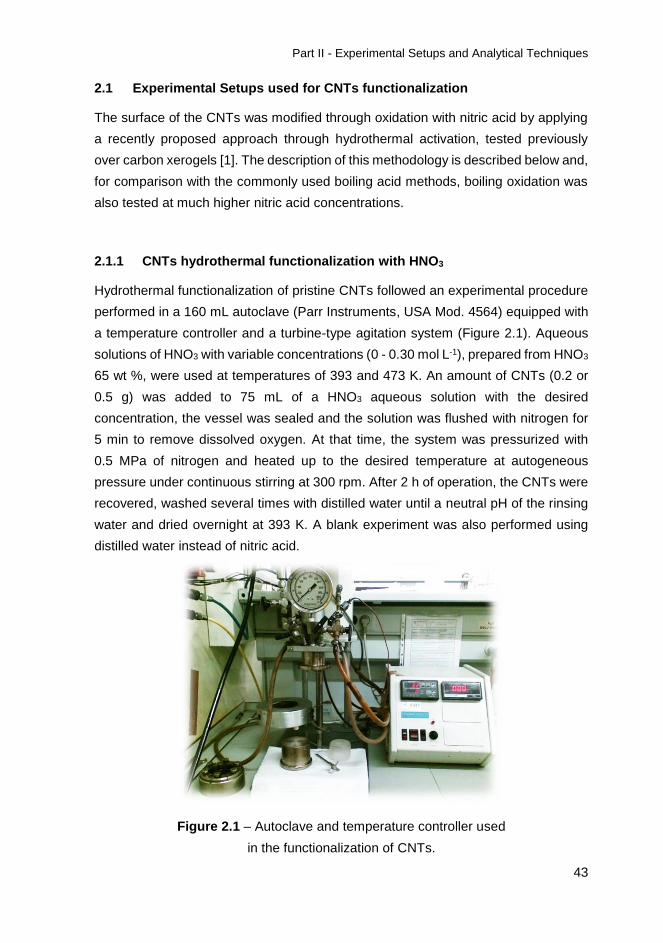
Part II - Experimental Setups and Analytical Techniques
43
2.1 Experimental Setups used for CNTs functionalization
The surface of the CNTs was modified through oxidation with nitric acid by applying
a recently proposed approach through hydrothermal activation, tested previously
over carbon xerogels [1]. The description of this methodology is described below and,
for comparison with the commonly used boiling acid methods, boiling oxidation was
also tested at much higher nitric acid concentrations.
2.1.1 CNTs hydrothermal functionalization with HNO3
Hydrothermal functionalization of pristine CNTs followed an experimental procedure
performed in a 160 mL autoclave (Parr Instruments, USA Mod. 4564) equipped with
a temperature controller and a turbine-type agitation system (Figure 2.1). Aqueous
solutions of HNO3 with variable concentrations (0 - 0.30 mol L-1), prepared from HNO3
65 wt %, were used at temperatures of 393 and 473 K. An amount of CNTs (0.2 or
0.5 g) was added to 75 mL of a HNO3 aqueous solution with the desired
concentration, the vessel was sealed and the solution was flushed with nitrogen for
5 min to remove dissolved oxygen. At that time, the system was pressurized with
0.5 MPa of nitrogen and heated up to the desired temperature at autogeneous
pressure under continuous stirring at 300 rpm. After 2 h of operation, the CNTs were
recovered, washed several times with distilled water until a neutral pH of the rinsing
water and dried overnight at 393 K. A blank experiment was also performed using
distilled water instead of nitric acid.
Figure 2.1 – Autoclave and temperature controller used
in the functionalization of CNTs.

44
2.1.2 CNTs boiling oxidation with HNO3
In a typical activation run, the CNTs were immersed in 150 mL of a HNO3 solution
with a concentration of 7.0 or 10 mol L-1. A round bottom flask equipped with a
condenser was used and the suspension was heated to boiling temperature and kept
under magnetic stirring for 3 h. After cooling, the suspension was washed up until a
neutral pH of the rinsing water was attained and the recovered nanotubes were dried
overnight at 393 K.
2.2 Experimental Setups used for photocatalytic studies
The setups used to study catalysts activity, either in powder or film form, are here
described. Two type of photo-reactors and light sources were tested in different
conditions.
2.2.1 Immersion reactor
The first photocatalytic experiments were carried out in an immersion reactor with
5 main units: the immersion lamp placed inside a quartz housing, a glass cooling
jacket, the photocatalytic reactor, the magnetic stirrer and the gas feed, as shown in
Figure 2.2.
(a) (b)
Figure 2.2 – Photocatalytic immersion reactor setup picture (a) and scheme (b).
The lamp in use was an UV-vis Heraeus TQ 150 medium pressure mercury vapour
lamp located axially and held in a quartz immersion tube with the more intense lines
at 254, 313, 365, 436, 546 and 578 nm (Figure 2.3). The use of the DURAN 50® glass
inout
Ar/O2/O3
Ar/O2
KI/KIO3
sampling
O2 Ar
power supply
H2O

Part II - Experimental Setups and Analytical Techniques
45
jacket allows to cool by water circulation to maintain a constant temperature, acting
also as an optical cut-off of UVB and UVC radiation. The resulting emission lines are
represented in Figure 2.3 a, as confirmed by the irradiance spectrum measured with
a UV-vis spectroradiometer USB2000+, OceanOptics, USA, shown in Figure 2.3 b.
(a) (b)
Figure 2.3 – Spectral irradiance of the TQ 150 lamp:
(a) data provided by the manufacturer and cut-off effect of DURAN® filter
(b) emission lines recorded in the laboratory at a distance of 7 cm from the
irradiation source through a borosilicate glass filter.
In a typical experiment the reactor is charged with a fixed amount of catalyst in
powder form and with 250 mL of the organic solution, under magnetic stirring, being
continuously bubbled with oxygen diluted in argon. After a dark phase, which is
performed until the adsorption-desorption equilibrium of the organic on the surface of
the catalyst is reached, the light is turned on and the suspension starts to be
illuminated.
2.2.2 Reactor with external light source
Photocatalytic experiments using supported catalysts deposited over thin glass slides
in the form of films, were performed in a borosilicate reactor with a cylindrical
configuration, as shown in Figure 2.4 a. The thin glass round slides can be carefully
placed on the top of the reactor cover and fixed with a Viton® O-ring. The reaction
setup is composed by the same main components as the one previously described
for the reactions using powder catalysts, namely the emission lamp with the
irradiation characteristics specified in Section 2.2.1, but in this case placed in an
external position, as illustrated in Figure 2.4 b. The TQ150 medium pressure mercury
200 250 300 350 400 450 500 550 6000
20
40
60
80
100
T (
%)
Sp
ectr
al ir
rad
ian
ce
(a
rbitra
ry u
nits)
(nm)
DURAN 50 filter
350 400 450 500 550 600
0
3
6
9
12
15
18
E (
W m
-2 n
m-1)
(nm)

46
vapour lamp, located inside the glass cooling jacket, illuminates the cylindrical
photo-reactor placed over the magnetic stirrer and fed with O2.
(a) (b)
Figure 2.4 – Photocatalytic cylindrical reactor (a) and setup scheme (b).
In a typical experiment, the photo-reactor is sealed with the catalyst film fixed at the
top of the reactor cover and the magnetic bar inside and filled with 7 mL of the
contaminant aqueous solution through one of the top openings. The reactor is then
positioned over the magnetic stirrer and the gas feed is turned on flowing through the
top opening closer to the cap and the other one is used for sampling (see Figure 2.4).
For all the reactions performed in the abovementioned configurations, the dark period
necessary to establish adsorption-desorption equilibrium is studied for each couple
of catalyst/organic compound, until the concentration of the last is constant and the
corresponding instant considered as t = 0 for the photocatalytic reactions, when the
irradiation is turned on. At this time, in order to determine the organic concentration
in solution, the first sample is withdrawn and is then considered as the initial
concentration (C0) after dark adsorption for further calculations of conversion results.
An experiment in the absence of catalyst is also performed, to be considered as the
blank experiment, in order to calculate the contribution from direct photolysis. The
gas feed is used to provide oxygen in solution which acts as electron acceptor.
Samples were periodically withdrawn, centrifuged and analyzed by High
Performance Liquid Chromatography (HPLC) at the conditions described in
Section 3.2.1 of the following Chapter 3.
2.3 References
[1] Silva AMT, Machado BF, Figueiredo JL, Faria JL. Controlling the surface
chemistry of carbon xerogels using HNO3-hydrothermal oxidation. Carbon. 2009; 47
(7):1670-9.
power supply
in
out
O2 Ar
sampling
magnetic
stirrer
catalyst
film
H2O


3 Analytical Techniques
In this section there are described the procedures and conditions concerning the
analytical techniques employed to determine the surface chemistry, thermal stability,
morphology, structure and electronic properties of the solid materials and to perform
product analysis to follow photo degradation experiments.


Part II - Experimental Setups and Analytical Techniques
51
3.1 Materials characterization
3.1.1 Temperature Programmed Desorption (TPD)
The surface chemistry of the CNTs was quantified in terms of oxygen functional
groups by TPD analysis using an AMI-200 Catalyst Characterization Instrument
(Altamira Instruments) equipped with a quadrupole mass spectrometer (Ametek,
Mod. Dymaxion). Each sample (0.1 g) was placed in a U-shaped quartz tube and
heated at 5 K min-1 until reach the maximum temperature of 1273 K in an electrical
furnace, under a constant flow of 25 cm3 min-1 of helium, used as carrier gas. The
amount of CO and CO2 released was determined using the calibration performed at
the end of each analysis and the experimental error was lower than 8%.
Deconvolution of the obtained CO and CO2 spectra allows quantifying the amount of
each specific oxygen functionality which are desorbed at known temperature ranges.
3.1.2 Thermogravimetric Analysis (TGA)
Thermogravimetric studies were performed to investigate the thermal stability of
selected materials and the amount of volatiles and ash content on CNTs. Both
analyses were conducted in different equipments.
TGA was performed using a Mettler M3 balance to assess the fixed carbon and the
ash content of pristine and functionalized CNTs. Firstly, humidity was removed at a
constant temperature of 383 K under N2. Then, the samples were heated at 25 K min-1
to the final temperature of 1173 K. The weight change observed during this stage
allows the quantification of volatile compounds at the surface. When a constant
weight was attained, the amount of fixed carbon was determined and the gas feed
was turned to O2 until a new stable weight was reached. At these conditions, the
entire organic fraction of the sample is burned and the remaining material
corresponds to the ash content.
Thermogravimetry with simultaneous differential scanning calorimetry (DSC) was
conducted on a Setaram SETSYS Evolution 16/18, TGA/DSC analyzer. For each
experiment, approximately 20 mg of the material was loaded on the sample crucible,
the system was sealed, fed with 16 cm3 min-1 air (purity 99.9%) and a temperature
ramp (10 K min-1) was applied. For simultaneous DSC measurements the system
was pre-calibrated with a series of standards following the manufacturer’s procedure.

52
3.1.3 Water vapor adsorption/desorption
Water vapor adsorption-desorption measurements were conducted on a
microbalance (CI Electronics, UK) as a rapid indicative of the modification on CNTs
surface after HNO3 functionalization, regarding the creation of acidic surface groups
where the water molecules are preferentially adsorbed. The mass of the samples and
counterweight pans, the hooks, the counterweight material, and the hang chains of
the microbalance assembly were on the order of 100 - 300 mg/item and were defined
with an accuracy of ± 0.1%. The materials were appropriately selected to induce a
symmetrical configuration to the balance setup in order to minimize buoyancy effects.
The microbalance had a 0.1 µg stable resolution. Before each measurement, the
samples were degassed under high vacuum (10-5 mbar) at 180 ºC.
3.1.4 Nitrogen adsorption isotherms (N2 isotherms)
Materials specific surface area calculation based on the Brunauer-Emmett-
Teller (BET) theory (SBET) was determined by multipoint analysis of N2 adsorption
isotherms at 77 K in the relative pressure range from 0.05 to 0.3 using BET method,
with a Quantachrome NOVA 4200e multi-station apparatus. Each sample was
degassed under vacuum for 6 h at 573 K prior to analysis.
In some cases, N2 adsorption-desorption measurements were carried out at 77 K in
the relative pressure range of 10-5-0.995 on a Quantachrome Autosorb-1-MP
apparatus. Each sample (60-80 mg) was outgassed under high vacuum at 573 K
overnight, prior to analysis.
Pore size distributions (PSDs) were obtained after using the Quenched Solid Density
Functional Theory (QSDFT) N2-carbon equilibrium transition kernel at 77 K of
Quantachrome’s Library.
3.1.5 Raman spectroscopy
Raman measurements were conducted to explore modifications on the graphitic
structure of CNTs at nanoscale and were performed in backscattering configuration
using a Renishaw inVia Reflex microscope with an Ar+ ion laser (λ = 514.5 nm, E =
2.41 eV) and a high power near-infrared (NIR) diode laser (λ = 785 nm, E = 1.58 eV)
as excitation sources. The laser light was focused on the samples using a long
working distance (8 mm) 50 x (NA = 0.55) objective of a Leica DMLM microscope at

Part II - Experimental Setups and Analytical Techniques
53
power density lower than 0.05 mW μm-2 for both laser lines, to avoid sample heating.
The spectra were averaged over 5-10 randomly different spots for each sample, while
the frequency shifts were calibrated by an internal Si reference. Spectral
deconvolution was carried out by nonlinear least-squares fitting of the Raman peaks
to a mixture of Lorentzian and Gaussian lineshapes.
3.1.6 Diffuse reflectance UV-Vis (DRUV) spectroscopy
Diffuse reflectance spectroscopy in the range of UV-Vis was performed to
characterize catalysts absorption bands within electronic transitions are allowed. The
spectra were collected on a Jasco V-560 UV-Vis spectrophotometer, equipped with
an integrating sphere attachment (JASCO ISV-469), and transformed by the
instrument software (JASCO) to equivalent absorption Kubelka-Munk units.
3.1.7 Diffuse reflectance infrared Fourier transformed (DRIFT) spectroscopy
Surface structure of the TiO2 catalysts was assessed through vibrational DRIFT
spectroscopy, which was performed in a Nicolet 510P FTIR Spectrometer equipped
with a beam collector (Spectra Tech). The interferograms were converted to
equivalent absorption units in the Kubelka-Munk scale by using the instrument
software (OMNIC).
3.1.8 Electron microscopy
Morphology and phase dispersion on TiO2/CNT composites was observed through
both Scanning Electron Microscopy (SEM) performed in a FEI Quanta
400FEG ESEM/EDAX Genesis X4M instrument and Transmission Electron
Microscopy (TEM) analysis in a JEOL 2010F analytical electron microscope,
equipped with a Schottky field-emission gun.
3.1.9 X-ray diffraction (XRD)
Crystalline phase and crystallite size of TiO2 particles was calculated based on XRD
spectral analysis, which was carried out in a PANalytical X’Pert MPD equipped with
a X’Celerator detector and secondary monochromator (Cu K λ = 0.154 nm, 50 kV,
40 mA; data recorded at a 0.017º step size, 100 s/step).

54
3.2 Product analysis
3.2.1 High Performance Liquid Chromatography (HPLC)
Concentration of organics degraded in photocatalytic experiments were followed
through HPLC. The samples were previously centrifuged, in the case of powder
suspensions, and analyzed using a Hitachi Elite LaChrom instrument equipped with
a Diode Array Detector (L-2450), a Purospher Star RP-18 column (250 mm x 4.6 mm,
5 µm particles), and a solvent delivery pump (L-2130) at a fixed flow rate of
1 mL min-1. At first, the column was equilibrated with a A:B (70:30) mixture of ultra-
pure water (A) and methanol (B), followed by a linear gradient run to A:B (30:70) in
30 min, and finally with isocratic elution during 2 min.
3.2.2 UV-Vis spectroscopy
UV-Vis spectroscopy was conducted to monitor the concentration of some organics
in liquid phase, which were being oxidized through photocatalytic degradation. The
absorption spectra were recorded on a Jasco V-560 UV-Vis spectrophotometer.


Part III
Modification of CNTs surface chemistry


4 SWCNTs functionalization by hydrothermal oxidation
Controlled generation of oxygen functionalities by HNO3
hydrothermal oxidation on the surface of single-walled carbon
nanotubes and characterization of its chemically modified
surface1, 2
The surface chemistry of single-walled carbon nanotubes (SWCNTs) is finely tailored
by a HNO3 hydrothermal method. The degree of oxygen functionalization is
correlated with HNO3 concentration through a mathematical function. Operating
temperature and HNO3 concentration are key parameters in the modification of the
surface chemistry. Temperature programmed desorption, water
adsorption/desorption, thermogravimetric studies, nitrogen adsorption isotherms and
porosimetry analysis were the techniques used to determine the nature,
concentration and acidic strength of different oxygen functionalities, which are
introduced in a controlled mode. These results were correlated to Raman
spectroscopy data that allowed identifying the marked evolution of the defect-
activated phonon modes of SWCNTs (Institute of Advanced Materials,
NCSR Demokritos, Greece). The SWCNTs functionalization procedure can be
effectively controlled and quantified, and the optimum conditions can be defined in
relation to the desired physicochemical properties and pore structure characteristics
for specific applications.
1 Marques, R.R.N., Machado, B.F., Faria, J.L., Silva, A.M.T. (2010) Controlled generation of oxygen functionalities on the surface of single-walled carbon nanotubes by HNO3 hydrothermal oxidation. Carbon, 48, 1515-1523. 2 Romanos, G.E., Likodimos, V., Marques, R.R.N., Steriotis, T.A., Papageorgiou, S.K., Faria, J.L., Figueiredo, J.L., Silva, A.M.T., Falaras, P. (2011) Controlling and Quantifying Oxygen Functionalities on Hydrothermally and Thermally Treated Single-Wall Carbon Nanotubes. The Journal of Physical Chemistry C, 115, 8534-8546.


Part III - Modification of CNTs surface chemistry
61
4.1 Results and discussion
Recently, nitric acid hydrothermal oxidation was developed in our group as a
controllable and mild functionalization method to tailor the surface chemistry of
carbon xerogels [1] by the thermally activated generation of oxygen functional
groups, whose density correlated analytically with the HNO3 concentration. In the
present work, the surface functionalization of commercial SWCNTs grown by
catalytic chemical vapor deposition (CCVD) is drawn to tailor the introduction of
oxygen functionalities using the same previously mentioned HNO3 hydrothermal
oxidation procedure, as described in detail in Section 2.1.1 of Chapter 2.
4.1.1 Identification of the nature of surface functionalities by water
adsorption/desorption
At first glance, the results of water adsorption/desorption isotherms shown in Figure
4.1 illustrate that HNO3 hydrothermal treatment truly modifies SWCNT’s surface,
since the range of water uptake is enhanced about three times. The presence of
acidic surface groups with affinity to the water phase is in line with the high amount
of water adsorbed, ca. 500 µmol/g as confirmed later by Temperature Programmed
Desorption (TPD) quantification, on the surface of SWCNTs treated with the highest
HNO3 concentration of 0.3 mol L-1, even after keeping the sample for 24 h under high
vacuum (10-5 mbar) conditions.
The adsorption capacity could also be influenced by the filling of the micropores and
the adsorption of water on nonacidic surface sites, however studies on water
immersion calorimetry with carbon surfaces show that the enthalpy variation
corresponding to the aforementioned interactions are minor compared to those
between water molecules and oxygen groups such as carboxyls, lactones, quinones
and carboxylic anhydrides [2]. Nevertheless, adsorption experiments with other probe
molecules on CSI reference material (see Experimental section 4.3) lead to conclude
that the contribution of micropores in the water adsorption of the CSI sample is
negligible (results not shown).

62
Figure 4.1 – Water vapor adsorption/desorption isotherms for the (a) SWCNTs
treated with 0.3 mol L-1 of HNO3 and (b) pristine SWCNTs samples.
Full symbols: adsorption; open symbols: desorption.
Therefore, it can be inferred that water adsorption on the functionalized SWCNTs is
highly specific, depending primarily on the degree of functionalization and can be
used as a tool to quantify and, possibly, qualify oxygen surface functionalities on
SWCNTs. In particular, the amount of water adsorbed upon completion of the
monolayer can be related to the total content of the acidic surface groups, whereas
the amount of water remaining adsorbed after evacuation can be associated with the
most acidic ones among the different oxygen groups on the SWCNTs surface.
4.1.2 Identification and quantification of surface functionalities by
Temperature Programmed Desorption
The distinct oxygen groups that are chemically bonded to the surface of CNTs upon
oxidizing treatments, represented in Figure 4.2, can be decomposed upon heating at
different temperatures and released as CO or CO2 [3, 4].
0.00 0.05 0.10 0.15 0.20 0.25 0.300
100
200
300
400 (b)
SWCNT
Pristine
Relative pressure (P0/P)
0
400
800
1200 (a)
SWCNT 0.30 M
PristineW
ate
r upta
ke (
µm
ol/g)

Part III - Modification of CNTs surface chemistry
63
(a)
Figure 4.2 – Oxygen-containing functional groups: schematic representation.
In Figure 4.3 a and b are represented the TPD spectra corresponding to the groups
evolved as CO and CO2, respectively, from the surface of SWCNTs, pristine and
treated under different HNO3 concentrations at 473 K.
The amount of oxygen functionalities introduced on the surface of SWCNTs is
strongly dependent on the concentration of HNO3. Comparing the curves obtained
for the pristine SWCNTs and for the blank test carried out with water instead of HNO3,
it is visible that no considerable amount of groups is present at the surface. This
indicates that the introduction of oxygen-containing groups is totally ascribed to the
presence of nitric acid instead of some effect of water at high temperatures. By
increasing the oxidizing conditions, the amount of groups evolved as CO and CO2
continuously increases. Both Figure 4.3 a and b suggest a good correlation between
the concentration of the oxygen functionalities and the concentration of HNO3. The
measured concentrations of CO and CO2 for both temperatures tested are gathered
on Table 4.1.

64
(a)
(b)
Figure 4.3 – TPD spectra for the pristine SWCNTs and treated under different
HNO3 concentrations at 473 K: (a) CO and (b) CO2 release.
In the TPD spectra the amount of groups evolved as CO is considerably higher than
that evolved as CO2. Accordingly, the ratio CO/CO2 was always higher than unity.
This ratio generally decreases with increasing HNO3 concentrations.
300 500 700 900 1100 1300
0.0
0.5
1.0
1.5
0.300.20
0.100.05
0.030.01
0 (Blank)0 - Pristine
[HNO 3
] (m
ol L-1 )
T (K)
CO
(
mo
l g
-1 s
-1)
300 500 700 900 1100 1300
0.0
0.1
0.2
0.3
0.4
0.5
0.300.20
0.100.05
0.030.01
0 (Blank)0 - Pristine
[HNO 3
] (m
ol L-1 )
T (K)
CO
2 (
mo
l g
-1 s
-1)

Part III - Modification of CNTs surface chemistry
65
Table 4.1 – Total amount of CO and CO2 calculated from the TPD spectra obtained
for different HNO3 concentrations (393 and 473 K).
[HNO3]
(mol L-1)
393 K 473 K
CO
(mol g-1)
CO2
(mol g-1) CO/CO2
CO
(mol g-1)
CO2
(mol g-1) CO/CO2
Prist.SWCNT 545 90 6.0 545 90 6.0
0 (Blank) 756 75 10.1 714 89 8.1
0.01 661 125 5.3 1034 232 4.5
0.03 --- --- --- 1541 350 4.4
0.05 705 109 6.5 1917 388 4.9
0.10 689 120 5.8 2407 586 4.1
0.20 781 173 4.5 3000 724 4.1
0.30 879 158 5.6 3148 907 3.5
To quantify the correlation between the amount of oxygen groups and the HNO3
concentration used, the area under the spectrum was plotted against the HNO3
concentration. In Figure 4.4 the two curves obtained for CO and CO2 are represented.
In addition, in order to test the influence of temperature on the functionalization
process, the range of HNO3 concentrations used at 473 K was also tested over
pristine SWCNTs at 393 K and the results are shown in the same figure.
It becomes clear that the functionalization degree not only depends on the HNO3
concentration but also on the temperature used. Surface groups are not introduced
on SWCNTs at 393 K even at the highest HNO3 concentrations tested. The present
results suggest that activation energy is controlling the process, requiring a certain
temperature to initiate the functionalization of SWCNTs. For the temperature of
473 K, the experimental data are well fitted by a single-exponential function, as shown
in Figure 4.4.

66
Figure 4.4 – Evolution of the amount of CO and CO2 with HNO3 concentration:
open symbols – 393 K; solid symbols – 473 K (for mathematical correlations
[HNO3] must be inserted in mol L-1 for a [COx] in mol g-1).
Comparing the results obtained in this work with those previously obtained in our
group for a carbon xerogel using the same functionalization method [1], a similar
behavior is observed, suggesting that activation energy must be truly associated with
the functionalization process. In that study a maximum functionalization degree is
attained for 393 K but, when increasing the temperature for 473 K, the concentration
of oxygen functionalities introduced on the surface of the carbon xerogel also
increases and no plateau was observed for the highest HNO3 concentrations.
By temperature deconvolution of the TPD spectrum for CO and CO2 is possible to
quantify the amount of oxygen functional groups present in the samples [3, 4]. It is
relevant to point out that for the deconvolution process some assumptions are
necessary according to the method reported in literature [4]. For instance, carboxylic
anhydrides are supposed to decompose both as CO and CO2. Once determined the
peak parameters at which these groups were released as CO2, an identical peak on
the CO spectrum was defined. The concentration of each group is determined by
calculating the area under the curve of the correspondent peak. As an example,
Figure 4.5 a and b show the TPD spectra for the SWCNTs that were treated under
the highest HNO3 concentration (0.30 mol L-1) and their respective deconvolution to
obtain the distinct peaks from the decomposition of acidic carboxylic groups,
carboxylic anhydrides, lactones, phenols and carbonyl/quinones.
0.00 0.05 0.10 0.15 0.20 0.25 0.300
1000
2000
3000
4000
, CO
, CO2
[CO
x]
(m
ol g
-1)
[HNO3] (mol L
-1)
[CO] = 3216 - 2467 exp ( - 11.82 [HNO3])
r2 = 0.998
[CO2] = 942 - 802 exp ( - 8.06 [HNO
3])
r2 = 0.967

Part III - Modification of CNTs surface chemistry
67
(a)
(b)
Figure 4.5 – Oxygen-containing functional groups: deconvolution of TPD-MS
spectra for the SWCNTs treated with 0.3 mol L-1 of HNO3 at 473 K (a) CO and (b)
CO2 spectra.
The main groups identified in the CO2 spectra were carboxylic acids and lactones,
while the most abundant functional groups determined from the CO spectra were
phenols, indicating a high degree of hydroxylation upon hydrothermal HNO3
oxidation. The concentrations determined for individual oxygen-containing functional
groups on selected samples are shown in Table 4.2.
300 500 700 900 1100 13000.0
0.2
0.4
0.6
0.8
1.0
1.2
1.4
Carbonyls /
Quinones
Phenols
Carboxylic
Anhydrides
CO
(
mol
g-1
s-1
)
T (K)
300 500 700 900 1100 13000.00
0.05
0.10
0.15
0.20
0.25
CO
2 (
mol
g-1
s-1
)
Carboxylic
Anhydrides
Lactones
T (K)
Carboxylic
Acids

68
Table 4.2 – Quantification of oxygen functional groups by TPD-MS analysis as a
function of the nitric acid concentration.
[HNO3]
(mol L-1)
phenols
(mol g-1)
carbonyl/
quinones
(mol g-1)
carboxylic
anhydrides
(mol g-1)
lactones
(mol g-1)
carboxylic
acids
(mol g-1)
Prist.SWCNT 336 66 < 35 < 35 < 35
0.03 1074 376 127 160 126
0.10 1876 270 226 239 219
0.20 2524 262 312 326 360
0.30 2628 214 315 340 400
All the original TPD spectra curves (Figure 4.3) were deconvoluted using the same
abovementioned approach and the release as CO and CO2 is, respectively,
represented as a function of the HNO3 concentration in Figure 4.6 a and b.
For every HNO3 concentration studied, the main groups identified on CO2 spectra
were carboxylic acids and lactones and the oxygen functions observed at the highest
concentrations on the surface of SWCNTs were phenols, released as CO. Also
carbonyls/quinones were identified on CO spectra, but in lower amounts. Carboxylic
anhydrides were present in the lowest quantities, identified both on CO and CO2
spectra.
As found for the total amount of groups at the surface of SWCNTs, an exponential
function also fits the results obtained for the concentration of each single oxygen
moiety (not shown). It is relevant to note that the concentration of all functionalities
increase with HNO3 concentration except for the carbonyl/quinones groups. The
mechanism proposed in the literature reports that the formation of oxygen-containing
surface groups seems to follow a progressive pathway starting with the creation of
phenols (-OH) and carbonyl/quinones (C=O) being further developed into carboxylic
functionalities (-COOH) if the material is exposed to oxidizing conditions for enough
time to allow the conversion reaction [5-7]. Under our oxidizing conditions, the
development of phenols is notorious and, the formation of carboxylic groups seems
to result from the conversion of the carbonyl/quinones firstly created at the surface of
the SWCNTs.

Part III - Modification of CNTs surface chemistry
69
(a)
(b)
Figure 4.6 – Evolution of specific oxygen groups concentration created at the
SWCNTs surface under HNO3 treatment at 473 K, released as (a) CO and (b) CO2.
The weight percentage of the amount of molecular oxygen released (% O2) as CO
and CO2 was calculated based on the concentrations determined by TPD analysis.
The results are gathered in Table 4.3 for 393 and 473 K.
0.00 0.05 0.10 0.15 0.20 0.25 0.300
100
200
300
400
500C
O
(m
ol g-1)
Phenols
Carbonyl / Quinones
Carboxylic Anhydrides
[HNO3] (mol L
-1)
CO
(
mol
g-1
)
500
1000
1500
2000
2500
3000
0.00 0.05 0.10 0.15 0.20 0.25 0.300
100
200
300
400
500
CO
2 (
mol
g-1
)
[HNO3] (mol L
-1)
Carboxylic Acids
Lactones
Carboxylic Anhydrides

70
Table 4.3 – Volatiles, ash content (determined by TGA) and % O2 (determined by
TPD) quantified for the pristine and treated SWCNT with different HNO3
concentrations (393 and 473 K).
[HNO3]
(mol L-1)
393 K 473 K
% O2
(wt. %)
% Volatiles % Ash
Content
% O2
(wt. %)
% Volatiles % Ash
Content
Prist.SWCNT 1.2 7.0 6.9 1.2 7.0 6.9
0 (Blank) 1.4 10.2 6.6 1.4 9.3 8.6
0.01 1.5 10.0 6.1 2.4 10.2 5.5
0.03 --- --- --- 3.6 12.3 4.5
0.05 1.5 9.3 7.0 4.3 13.3 3.1
0.10 1.5 12.1 6.3 5.7 15.8 3.3
0.20 1.8 --- --- 7.1 18.5 3.1
0.30 1.9 12.9 6.3 7.9 19.2 3.4
The total amount of molecular O2 is representative of the total concentration of
oxygen groups introduced on the surface of SWCNTs. As expected, the trend of the
O2 released corroborates the TPD results. For the temperature of 393 K, no
considerable surface modification was observed. On the other hand, at 473 K, the
total amount of oxygen groups increases progressively with the HNO3 concentration
(Figure 4.7). Despite the poor surface chemistry of pristine SWCNTs with an O2
concentration of 1.2 wt.%, the HNO3 hydrothermal treatment is able to produce a
considerable surface modification, introducing 7.9 wt.% of molecular O2 at the
strongest oxidizing conditions tested (0.3 mol L-1 of HNO3).
Weight percentage of volatiles and ash content were determined by
Thermogravimetric Analysis (TGA) and the results gathered in Table 4.3. The
temperature of 393 K is insufficient to modify the surface of the CNTs and to remove
the ash content present in the material. Since volatiles correspond mainly to the
oxygen functionalities that are released during TGA, the results at 473 K are once
again fitted to a single-exponential function and follow the same trend as found for
the evolution of molecular oxygen (Figure 4.7). The difference observed between the
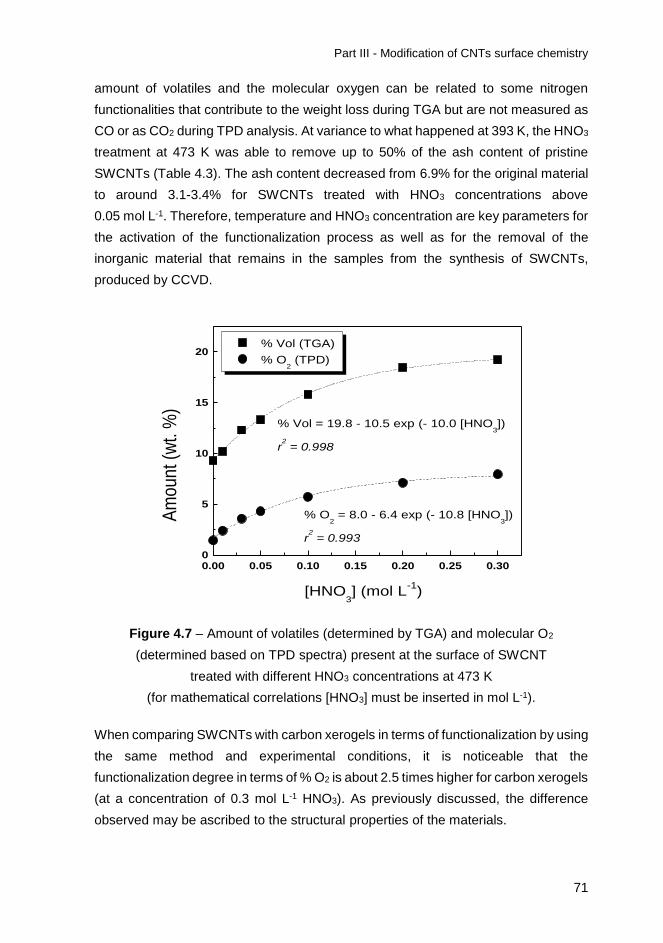
Part III - Modification of CNTs surface chemistry
71
amount of volatiles and the molecular oxygen can be related to some nitrogen
functionalities that contribute to the weight loss during TGA but are not measured as
CO or as CO2 during TPD analysis. At variance to what happened at 393 K, the HNO3
treatment at 473 K was able to remove up to 50% of the ash content of pristine
SWCNTs (Table 4.3). The ash content decreased from 6.9% for the original material
to around 3.1-3.4% for SWCNTs treated with HNO3 concentrations above
0.05 mol L-1. Therefore, temperature and HNO3 concentration are key parameters for
the activation of the functionalization process as well as for the removal of the
inorganic material that remains in the samples from the synthesis of SWCNTs,
produced by CCVD.
Figure 4.7 – Amount of volatiles (determined by TGA) and molecular O2
(determined based on TPD spectra) present at the surface of SWCNT
treated with different HNO3 concentrations at 473 K
(for mathematical correlations [HNO3] must be inserted in mol L-1).
When comparing SWCNTs with carbon xerogels in terms of functionalization by using
the same method and experimental conditions, it is noticeable that the
functionalization degree in terms of % O2 is about 2.5 times higher for carbon xerogels
(at a concentration of 0.3 mol L-1 HNO3). As previously discussed, the difference
observed may be ascribed to the structural properties of the materials.
0.00 0.05 0.10 0.15 0.20 0.25 0.300
5
10
15
20
[HNO3] (mol L
-1)
% O2 = 8.0 - 6.4 exp (- 10.8 [HNO
3])
r2 = 0.993
% Vol (TGA)
% O2 (TPD)
Am
ount
(w
t. %
)
% Vol = 19.8 - 10.5 exp (- 10.0 [HNO3])
r2 = 0.998
72
CNTs are very well organized carbon materials with ordered graphite layers and thus
poor reactive due to the high chemical stability. In this case, the introduction of
oxygen functionalities proceeds over the defects that are introduced during HNO3
hydrothermal treatment. On the other hand, carbon xerogels are structures with a
totally distinct morphology, like a bulk material with a developed porosity. In this case,
the carbon structure is not so organized like in CNTs, thus providing more sites for
the attachment of the oxygen moieties. Therefore, the reactivity of carbon xerogels is
supposed to be much higher than the one of CNTs, which can explain the difference
on the functionalization degrees achieved with the current HNO3 hydrothermal
treatment. However, in both cases, the % O2 is correlated with the HNO3
concentration by an exponential function as presented for SWCNTs in Figure 4.7.
During each HNO3 hydrothermal run, it was verified that the SWCNTs weight loss
(WL) varied significantly with the conditions used. The WL is computed from the
difference between the weight of SWCNTs introduced into the autoclave (0.2 g, in
this case) and the final weight of the recovered material after the HNO3 hydrothermal
treatment, normalized to the initial weight in percentage. In Figure 4.8 the WL is
represented as a function of HNO3 concentration for both 393 and 473 K.
For the temperature of 393 K, the WL variation observed with increasing HNO3
concentration is negligible. However, at 473 K the oxidizing conditions are such that
the WL varies significantly with the used HNO3 concentration (up to 50%). As
observed for the amount of oxygen functionalities introduced on the surface of
SWCNTs, an exponential function fits the WL experimental data, suggesting that both
phenomena are related. In fact, during the acidic oxidation process, CNTs can
collapse and form carboxylated carbonaceous fragments (CCFs). It is reported that
the carboxylated functions produced by HNO3 treatment are mainly on CCFs
adsorbed on SWCNTs instead of directly covalently anchored to the surface of
SWCNTs [8, 9]. Under strong enough oxidizing conditions these CCFs can be fully
gasified to form CO2, which can explain the verified WL.
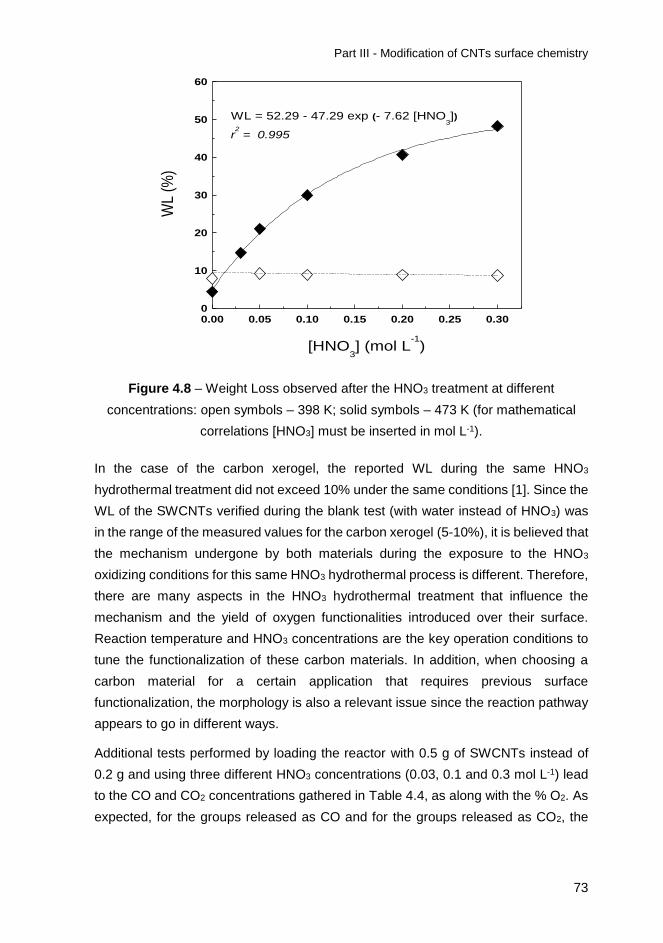
Part III - Modification of CNTs surface chemistry
73
Figure 4.8 – Weight Loss observed after the HNO3 treatment at different
concentrations: open symbols – 398 K; solid symbols – 473 K (for mathematical
correlations [HNO3] must be inserted in mol L-1).
In the case of the carbon xerogel, the reported WL during the same HNO3
hydrothermal treatment did not exceed 10% under the same conditions [1]. Since the
WL of the SWCNTs verified during the blank test (with water instead of HNO3) was
in the range of the measured values for the carbon xerogel (5-10%), it is believed that
the mechanism undergone by both materials during the exposure to the HNO3
oxidizing conditions for this same HNO3 hydrothermal process is different. Therefore,
there are many aspects in the HNO3 hydrothermal treatment that influence the
mechanism and the yield of oxygen functionalities introduced over their surface.
Reaction temperature and HNO3 concentrations are the key operation conditions to
tune the functionalization of these carbon materials. In addition, when choosing a
carbon material for a certain application that requires previous surface
functionalization, the morphology is also a relevant issue since the reaction pathway
appears to go in different ways.
Additional tests performed by loading the reactor with 0.5 g of SWCNTs instead of
0.2 g and using three different HNO3 concentrations (0.03, 0.1 and 0.3 mol L-1) lead
to the CO and CO2 concentrations gathered in Table 4.4, as along with the % O2. As
expected, for the groups released as CO and for the groups released as CO2, the
0.00 0.05 0.10 0.15 0.20 0.25 0.300
10
20
30
40
50
60
WL
(%)
[HNO3] (mol L
-1)
WL = 52.29 - 47.29 exp (- 7.62 [HNO3])
r2 = 0.995

74
amount of surface groups obtained with the same HNO3 concentration is always
lower for the load of 0.5 g.
Table 4.4 – Total amount of CO and CO2 calculated from the TPD spectra and
respective % O2 as function of [HNO3]/mSWCNT and HNO3 concentration at 473 K.
[HNO3]
(mol L-1)
mSWCNT
(g)
[HNO3] / mSWCNT
(mol L-1 g-1)
CO
(mol g-1)
CO2
(mol g-1) CO/CO2
% O2
(wt. %)
0.03 0.5 0.06 1134 184 6.2 2.4
0.03 0.2 0.15 1541 350 4.4 3.7
0.10 0.5 0.20 1888 428 4.4 4.4
0.10 0.2 0.50 2407 586 4.1 5.9
0.30 0.5 0.60 2535 606 4.2 6.2
0.30 0.2 1.50 3148 907 3.5 8.4
In Figure 4.9 is plotted the percentage of the total amount of molecular oxygen
determined by TPD (released as CO and CO2) against [HNO3]/mSWCNT for all the
SWCNTs loads and HNO3 concentrations studied at 473 K.
Figure 4.9 – Amount of molecular oxygen present as oxygen groups on the surface
of SWCNTs treated at 473 K as a function of [HNO3]/mSWCNT.
0.0 0.2 0.4 0.6 0.8 1.0 1.2 1.4 1.60
2
4
6
8
10
0.2 g
0.5 g
% O
2 (
wt.
%)
[HNO3]/m
SWCNT (mol L
-1 g
-1)
% O2 = 8.6 - 6.9 exp (-2.0 [HNO
3]/m
SWCNT)
r2 = 0.990

Part III - Modification of CNTs surface chemistry
75
As expected, the % O2 is dependent on the [HNO3]/mSWCNT ratio. In addition, since
one single mathematical correlation fits quite well the data for both loads (0.2 g and
0.5 g), for a given [HNO3]/mSWCNT ratio, the % O2 seems to be independent with
respect to the SWCNTs load (i.e., when the HNO3 concentration increases
proportionally to the SWCNTs load in order to maintain the [HNO3]/mSWCNT ratio).
Therefore, a mathematical correlation between the amount of oxygen groups which
can be introduced at the surface of SWCNTs and the [HNO3]/mSWCNT ratio is
established. The functionalization degree can now be predicted not also for a fixed
load of SWCNTs but for the whole range of [HNO3]/mSWCNT studied, including several
SWCNTs loads and HNO3 concentrations. Thus, using the obtained mathematical
correlations can accurately control the surface modification of SWCNTs by the HNO3
hydrothermal method.
4.1.3 Structural modifications on hydrothermally treated SWCNTs: surface
area and pore size distribution
The amount of oxygen-containing groups introduced on the surface of carbon
xerogels was higher than that attained with the SWCNTs using the same temperature
and HNO3 concentrations. Moreover, the difference between the two materials
increased with the HNO3 concentration, for identical oxidizing conditions. This trend
is intrinsically related on the distinct morphology of both carbon materials. It is worth
noting that the concept of porosity is quite different when considering carbon xerogels
or carbon nanotubes. Carbon xerogels present a type of porosity similar to that of
well-known activated carbons. The available area for the introduction of the oxygen
functionalities is on the micro, meso and macropores. The porosity of CNTs is usually
associated to a bundle and not to a single carbon nanotube, since the graphite layers
are non-porous. The porosity of a bundle of CNTs is the result of different
contributions [10]: (i) the area available at the surface of the bundle, (ii) the existing
area between distinct individual carbon nanotubes, which is called interstitial and (iii)
the area inside the pores of the bundle, which corresponds to the inner cavities of the
opened CNTs. The degree of functionalization must then always be compared taking
into account the specific morphology of each material.
The N2 adsorption–desorption isotherms of the pristine and treated SWCNTs at 473 K
under four different HNO3 concentrations are represented in Figure 4.10 and the
respective BET surface areas were calculated from these isotherms.

76
Figure 4.10 – Nitrogen adsorption isotherms for the original and treated SWCNT
with different HNO3 concentrations at 473 K.
The materials treated with different HNO3 concentrations present similar BET surface
areas varying less than 5% with relation to the original material (406 m2 g-1). In
accordance with the IUPAC classification [11], the observed isotherms are classified
as Type IV developing to Type I for the highest HNO3 concentrations. It is known from
the literature [12, 13] that the adsorption capacity of SWCNTs decreases with the
presence of surface functional groups and structural defects. Figure 4.10 shows that
the N2 uptake at higher p/p0 relative pressures decreases with the increase of the
HNO3 concentration used. This seems to be related to the amount of oxygen-
containing groups and structural defects generated on the SWCNTs surface at high
HNO3 concentration.
Before determination of the N2 adsorption isotherm the samples are degassed for 6 h
at 573 K under vacuum. In order to confirm that oxygen groups are still present on
the SWCNTs surface after the degasification procedure, reducing the adsorption
capacity, the TPD spectra were compared for the SWCNTs treated with 0.2 mol L-1
of HNO3 before and after N2 adsorption isotherm analysis. Only 3% of oxygen
functionalities were removed during the procedure used to determine N2 adsorption
0
200
400
600
800
Vad
s (
cm
3 g
-1,
ST
P)
Pristine
SWCNT
[HNO3]
0.03 mol L-1
[HNO3]
0.2 mol L-1
[HNO3]
0.1 mol L-1
[HNO3]
0.3 mol L-1
p/p0
0 1 0 10 10 10 1

Part III - Modification of CNTs surface chemistry
77
isotherms, confirming that the surface groups can be responsible by the observed
decrease on the N2 uptake.
Esteves et al. [13] developed a procedure to obtain information about the surface
area and the porosity of SWCNTs bundles. Type I isotherms are related with the filling
up of the tubes with adsorbate while the other types of isotherms are associated with
adsorption on the external surface of the bundles. Accordingly, the results presented
in Figure 4.10 lead to the conclusion that the hydrothermal treatment has a significant
influence on the external surface of SWCNTs and little or no effect on their internal
surface.
When the acidic treatment was carried out over carbon xerogels [1], the area
increased about 30% when high HNO3 concentrations were used and this was
ascribed to the development of the microporosity during the functionalization process.
In the case of the carbon xerogel, the introduction of the oxygen-containing groups
took place over all the available surface area, whereas for CNTs the defects created
at the surface of the graphite layers are the single positions which present some
chemical reactivity to form the desired functionalities.
Therefore, the nature of the carbon material should be taken into account when
predicting the functionalization degree to be achieved with the HNO3 hydrothermal
treatment.
The pore size distributions (PSDs) obtained by Quenched Solid Density Functional
Theory (QSDFT) of the pristine and functionalized SWCNT samples are presented
in Figure 4.11. All PSDs reveal a “dual” pore system consisting of micropores (pore
widths 0.7 - 0.9 nm) and a rather broad distribution of mesopores. This bimodal pore
texture is consistent with the interstitial space between individual nanotubes
(micropores), while the mesopores originate from the packing of the nanotube
bundles (mesopores). A straightforward observation on the effect of acid treatment
on the pore structure is that upon oxidation (and thus incorporation of functional
groups) there is a monotonic decrease of the mesopores volume. In fact, while the
mean mesopores average size remains constant (around 2.8 nm) the amount of
larger pores diminishes rapidly, even under mild oxidation conditions of 0.03 mol L-1
of HNO3, and the mesopores size distribution becomes narrower toward smaller
sizes.
This effect can be explained on the basis of more efficient packing/organization of
the SWCNTs bundles upon introducing functional groups, presumably due to excess
hydrogen bonding. Indeed, it has been reported that surface functionalities promote

78
the stronger aggregation of the CNTs bundles [14, 15]. In the case of micropores, it
is obvious (Figure 4.11 b) that even a mild acid treatment (0.03 or 0.10 mol L-1) shifts
microporosity to smaller sizes (0.93 to 0.85 nm), the shift being more pronounced at
stronger oxidative conditions (0.20, 0.30 mol L-1). This smaller size can be related to
the chemical enrichment of the outer surface that facilitates individual SWCNTs to
pack closer to each other and create more dense bundles. In Figure 4.11, it can be
also observed that the micropore volume increases significantly after mild treatment
(0.03, 0.10 mol L-1). However, stronger oxidation leads to a decrease of the micropore
volume compared to the pristine sample probably due to the stereochemical
hindrance imposed by the large number of functional groups.
(a)
0.00
0.02
0.04
0.06
0.08
0.10
0.12
0.14
0.1 1 10 100
Pore width (nm)
dV
/dr
(cm
3S
TP
/g/n
m)
Pristine SWCNT
SWCNT 0.03 M
SWCNT 0.10 M
SWCNT 0.20 M
SWCNT 0.30 M
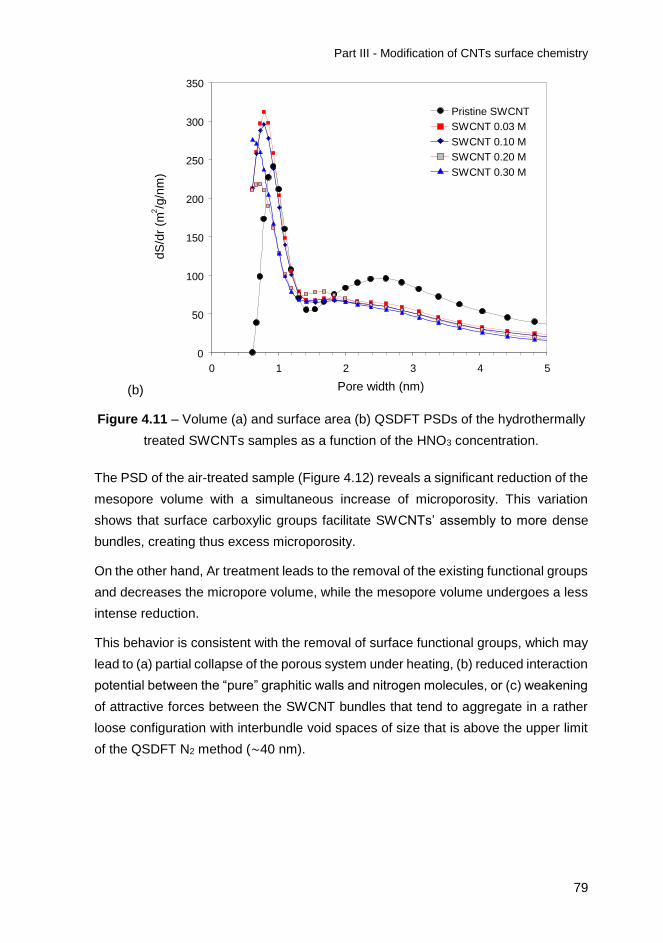
Part III - Modification of CNTs surface chemistry
79
(b)
Figure 4.11 – Volume (a) and surface area (b) QSDFT PSDs of the hydrothermally
treated SWCNTs samples as a function of the HNO3 concentration.
The PSD of the air-treated sample (Figure 4.12) reveals a significant reduction of the
mesopore volume with a simultaneous increase of microporosity. This variation
shows that surface carboxylic groups facilitate SWCNTs’ assembly to more dense
bundles, creating thus excess microporosity.
On the other hand, Ar treatment leads to the removal of the existing functional groups
and decreases the micropore volume, while the mesopore volume undergoes a less
intense reduction.
This behavior is consistent with the removal of surface functional groups, which may
lead to (a) partial collapse of the porous system under heating, (b) reduced interaction
potential between the “pure” graphitic walls and nitrogen molecules, or (c) weakening
of attractive forces between the SWCNT bundles that tend to aggregate in a rather
loose configuration with interbundle void spaces of size that is above the upper limit
of the QSDFT N2 method (∼40 nm).
0
50
100
150
200
250
300
350
0 1 2 3 4 5
Pore width (nm)
dS
/dr
(m2/g
/nm
)
Pristine SWCNT
SWCNT 0.03 M
SWCNT 0.10 M
SWCNT 0.20 M
SWCNT 0.30 M

80
Figure 4.12 – Volume QSDFT PSDs of the pristine SWCNTs in comparison with
the air- (300 ºC) and Ar-treated (500 ºC) analogues.
4.1.4 Identification of charge transfer effects by resonance Raman
spectroscopy
The effect of the functional groups on the SWCNTs surface was investigated by
Raman spectroscopy at two different excitation wavelengths in the NIR (785 nm) and
visible range (514.5 nm). Figure 4.13 a and b shows the evolution of the Raman
spectra for the hydrothermally treated samples in the spectral range of
1200 – 1900 cm-1, where the first-order tangential G modes and the highly dispersive
defect-induced D band are observed at 514.5 and 785 nm, respectively.
The contribution of elastic scattering from defects together with one phonon inelastic
scattering has been successfully applied to explain the origin of the D-band and its
excitation dependence based on double resonant Raman scattering [16], rendering
this mode the characteristic fingerprint of structural disorder in graphitic materials
[17].
0.00
0.02
0.04
0.06
0.08
0.10
0.12
0.14
0.16
0.1 1 10 100
Pore width (nm)
dV
/dr
(cm
3S
TP
/g/n
m)
Pristine SWCNT
SWCNT Air
SWCNT Ar

Part III - Modification of CNTs surface chemistry
81
Figure 4.13 – Raman spectra of the hydrothermally treated SWCNTs samples at
(a) 514.5 and (b) 785 nm. Variation of the ID/IG intensity ratio as a function of (c)
[HNO3] and (d) [COx] concentrations. Lines designate the corresponding
exponential and linear best fit curves to the ID/IG vs [HNO3] and [COx], respectively.
Specifically, the intensity ratio ID/IG between the integrated areas of the D and G
bands has been long exploited as a measure of the in-plane crystallite size of
nanographites [18], while recently it has been quantitatively related to the average
distance between defects in covalently functionalized SWCNTs [19] and Ar+
ion-irradiated graphene [20].
The Raman spectra of the oxidized samples reveal a marked dependence of the
dispersive D band (1350 cm-1, ∼48 cm-1/eV) with [HNO3] at both excitation
wavelengths, as shown in Figure 4.13 a and b. The relative intensity of the D-band
with respect to that of the tangential G-band increases rapidly with the increase of
the nitric acid concentration, following the concomitant increase of the amount of
oxygen functionalities on the SWCNTs. Moreover, at high HNO3 concentrations
(>0.05 mol L-1), the defect-induced D' band at ∼1620 cm-1, originating from a similar
double resonance process as the D-band, can be clearly resolved, especially at
514.5 nm, indicating the increase of structural disorder on the CNTs [17].
785 nm
514.5 nm
1200 1300 1400 1500 1600 1700
0.0
0.4
0.8
1.2
1.6
1200 1300 1400 1500 1600 1700
0.0
0.4
0.8
1.2
1.6
0.00 0.05 0.10 0.15 0.20 0.25 0.300.0
0.4
0.8
1.2
1.6
2.0
2.4
0.05 M
Norm
aliz
ed I
nte
nsity
Raman shift (cm-1)
D G
D'
(a)
Pristine SWCNT
0.03 M
0.10 M
0.20 M
0.30 M
D'
Raman shift (cm-1)
785 nm(b)
0.30 M
0.20 M
0.10 M
0.05 M
0.03 M
Pristine SWCNT
D G
ID/I
G=2.2-1.76exp(-12.5[HNO3])
r2=0.992
I D/I
G
[HNO3] (mol/L)
ID/I
G=1.1-0.75exp(-15.5[HNO3])
r2=0.994
(c)
1000 2000 3000 40000.0
0.5
1.0
1.5
2.0
2.5
I D/I
G
[COx] (mol/g)
(d)
785 nm
514.5 nm
514.5 nm

82
Quantification of this variation through the integrated intensity ratio ID/IG shows that
the experimental data can be well fitted to a single exponential function as a function
of the HNO3 concentration (Figure 4.13 c). The corresponding exponent values
depend on the laser excitation energy, resembling the excitation laser dependence
of the ID/IG ratio in nanographites [17] and functionalized SWCNTs [19]. This variation
closely follows the evolution of the concentration of surface groups determined by the
amount of CO and CO2 released during TPD [21]. Most importantly, plotting ID/IG as
a function of the total amount of functional groups, quantified by [COx] = [CO] + [CO2],
reveals a linear scaling of ID/IG with the defect concentration (Figure 4.13 d), while a
similar correlation can be found with the water adsorption/desorption results. This
indicates that the ID/IG ratio can provide a quantitative probe of the total amount of
oxygen functional groups on the SWCNTs surface at these defect concentration
levels.
Figure 4.14 a compares the Raman spectra of the pristine and the fully functionalized
SWCNT 0.30 M samples up to higher frequencies at 514.5 nm, where the overtones
and combination modes of SWCNTs are clearly observed. The dominant feature in
the second order Raman spectra, is the highly dispersive (∼109 cm-1/eV) G' band
corresponding to the overtone of the D-band (2D). The G' band originates from a
two-phonon double resonance process that is, in principle, independent of disorder
[17]. However, near-field Raman measurements have recently identified an additional
defect-induced G' peak at higher/lower frequencies near defect sites spatially
resolved along individual SWCNTs, due to the defect-induced renormalization of the
electron and phonon energies [22].
In the present case, a gradual shift of the G' band is systematically observed toward
higher frequencies with the increase of the HNO3 concentration, reaching 16 cm-1 for
the SWCNT 0.30 M sample (inset of Figure 4.14 a), in qualitative agreement with the
acceptor action (hole doping) of oxygen functional groups [23]. However, the
presence of two distinct G' peaks could not be reliably resolved, as the strong
dependence of the G' mode on tube diameter, metallicity and excitation energy can
be effectively averaged for SWCNTs bundles [24].
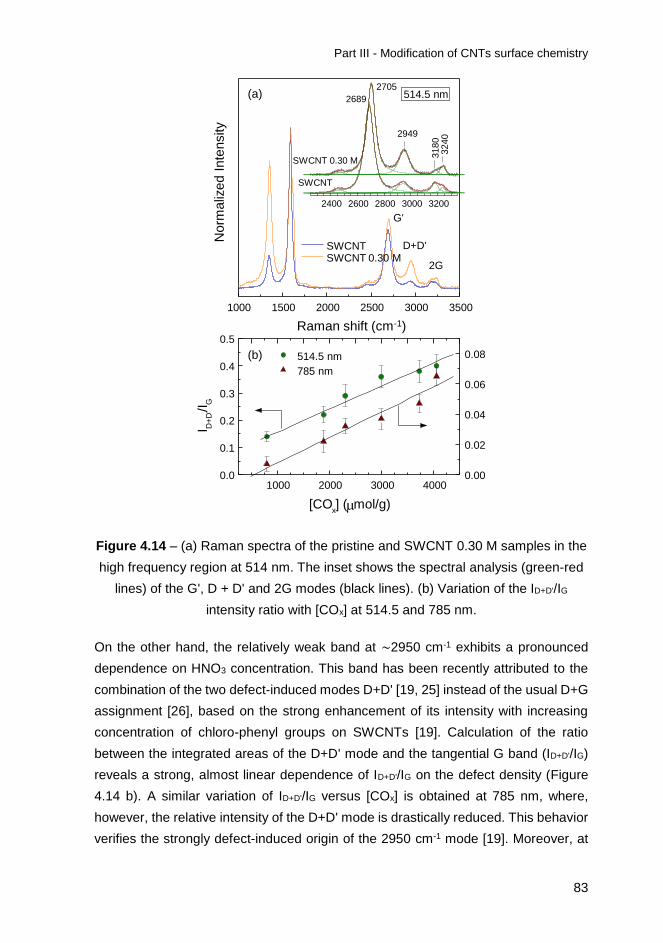
Part III - Modification of CNTs surface chemistry
83
Figure 4.14 – (a) Raman spectra of the pristine and SWCNT 0.30 M samples in the
high frequency region at 514 nm. The inset shows the spectral analysis (green-red
lines) of the G', D + D' and 2G modes (black lines). (b) Variation of the ID+D'/IG
intensity ratio with [COx] at 514.5 and 785 nm.
On the other hand, the relatively weak band at ∼2950 cm-1 exhibits a pronounced
dependence on HNO3 concentration. This band has been recently attributed to the
combination of the two defect-induced modes D+D' [19, 25] instead of the usual D+G
assignment [26], based on the strong enhancement of its intensity with increasing
concentration of chloro-phenyl groups on SWCNTs [19]. Calculation of the ratio
between the integrated areas of the D+D' mode and the tangential G band (ID+D'/IG)
reveals a strong, almost linear dependence of ID+D'/IG on the defect density (Figure
4.14 b). A similar variation of ID+D'/IG versus [COx] is obtained at 785 nm, where,
however, the relative intensity of the D+D' mode is drastically reduced. This behavior
verifies the strongly defect-induced origin of the 2950 cm-1 mode [19]. Moreover, at
1000 2000 3000 40000.0
0.1
0.2
0.3
0.4
0.5
0.00
0.02
0.04
0.06
0.08
1000 1500 2000 2500 3000 3500
2400 2600 2800 3000 3200
(b) 514.5 nm
I D+
D'/I
G
[COx] (mol/g)
785 nm
SWCNTSWCNT 0.30 M
Norm
aliz
ed I
nte
nsity
Raman shift (cm-1)
G'
D+D'
2G
(a) 514.5 nm
3180
3240
SWCNT
SWCNT 0.30 M
2689
2705
2949

84
higher frequencies, an intriguing double peak structure is observed at ∼3200 cm-1,
where the first overtone of the G-band is expected. Deconvolution of this composite
band reveals two individual peaks at approximately 3180 and 3240 cm-1 (inset of
Figure 4.14 a). The former corresponds closely to the second harmonic of the
tangential G band (∼1590 cm-1), frequently identified in SWCNTs [27], while the latter
is consistent with the corresponding shifted variant in graphitic materials and
multi-walled CNTs (MWCNTs) due to the overbending of the graphite phonon
dispersion curves [28]. Calculation of the corresponding intensity ratios I3180/IG and
I3240/IG versus [COx] concentration reveals a counter-dependence of the intensity of
the two peaks with increasing concentration of the oxygen functional groups, i.e., a
decrease (increase) of I3180/IG (I3240/IG) with [COx]. The intensification of the 3240 cm-1
mode correlates well with the enhancement of the defect-induced D' band with
increasing HNO3 concentration. The evolution of these two features may then be
associated with the formation of CCFs or even the presence of MWCNTs, as
indicated by the relatively lower SWCNT purity (> 60%).
Furthermore, the presence of small amounts of MWCNTs or even few-walled CNTs
(FWCNT) in the SWCNTs samples (SWCNT purity > 60%), generally characterized
by a higher D band intensity due to their inherently more defective structure, may
effectively compromise the averaged Raman spectra on the powder samples. In that
case, the contribution of functionalized MWCNTs and FWCNTs that are more
resistant to the exfoliation into CCFs under nitric acid treatment [8], might promote
the formation of the defect-induced D' band (Figure 4.13) or the splitting of the 2G
overtone (Figure 4.14) in the SWCNT samples.
The location of the oxygen functional groups on the CNTs has been subsequently
explored by Raman spectroscopy on the thermally treated SWCNTs and
SWCNT 0.30 M samples in air and argon atmosphere at 300 and 500 ºC, respectively
(Figure 4.15). Mild oxidative treatment in air results in significant decrease of the
relative D-band intensity for the SWCNT 0.30 M sample at both excitation
wavelengths, leading to the decrease of ID/IG to 1.3(1) and 0.7(1) at 785 and
514.5 nm, respectively. These values are approximately 35% lower than those of the
fully functionalized SWCNT 0.30 M sample (Figure 4.13 d), verifying that an
appreciable portion of the D-band intensity stems from amorphous carbon and CCFs,
which are oxidized at 300 ºC. On the other hand, the persistence of substantial D
band intensity after mild air oxidation suggests that a significant amount of oxygen
functionalities remains or becomes attached on the CNTs surface rather than on
CCFs, in agreement with the results of water adsorption/desorption analysis. This is

Part III - Modification of CNTs surface chemistry
85
further supported by the variation of the ID/IG ratio upon thermal treatment of the
SWCNT 0.30 M sample in inert atmosphere at 500 ºC, where it decreases to 1.0(1)
and 0.5(1) at 785 and 514.5 nm, respectively.
Figure 4.15 – Raman spectra of the Pristine and SWCNT 0.30 M samples thermally
treated in air and Ar atmosphere at 573 and 773 ºC, respectively, in comparison
with the corresponding spectra of the pristine samples at 785 nm. The left inset
depicts the variation of the radial breathing modes for the SWCNT 0.30 M sample,
while the right inset shows the corresponding Raman spectra at 514.5 nm.
The latter treatment is expected to decompose the more acidic groups on the
SWCNTs, while leaving intact amorphous carbon/CCFs and the less acidic functional
groups such as phenols that are the most abundant species created during
hydrothermal HNO3 treatment. In that case, removal of the strong acidic functional
groups to a larger extent results in the increased reduction of ID/IG, which is thus found
to correlate mainly with the variation of the water desorption capacity of the thermally
treated SWCNT 0.30 M sample.
Similar effects are also observed on the D' and D+D' bands most clearly resolved at
514.5 nm (right inset of Figure 4.15). Both bands become gradually suppressed upon
air and Ar treatment, verifying their defect-induced origin and their dependence on
the density of functional groups. Appreciable variations are also observed in the
1200 1600 2400 2800 3200150 200 250 300 350
500 1000 1500 2000 2500 3000
Pristine
Air 300 oC
Ar 500 oC
Raman shift (cm-1)
Norm
aliz
ed I
nte
nsity
SWCNT
SWCNT 0.30 M
785 nm
D GD'
SWCNT 0.30 M
514.5 nm
G'
2GD+D'
573 K773 K

86
characteristic first-order radial breathing modes (RBMs) at 785 nm (left inset of Figure
4.15). The SWCNTs samples consist of CNTs bundles with a broad distribution of
diameters (<2 nm), to which the dominant peaks in the RBM frequency region occur
at 267 cm-1 under 785 nm excitation. These RBMs arise from semiconducting
SWCNTs [29]. Thermal treatment leads to a systematic increase of the relative RBM
intensity, most pronounced for the 500 ºC Ar-treated SWCNT 0.30 M sample. This
variation can be associated with the decomposition of strongly acidic groups and the
concomitant recover of the resonance conditions, partially suppressed in the
SWCNT 0.30 M sample through charge transfer [23, 30, 31]. Qualitatively similar,
though minor, changes are also traced for the RBM bands of the thermally treated
SWCNTs samples, whereas the defect-induced D and D+D' modes were hardly
affected (the ID/IG ratio remains practically constant at both excitations), in agreement
with the weak variation of its water adsorption/desorption capacity upon thermal
treatment.
4.2 Conclusions
The controlled surface modification of SWCNTs was successfully performed by
means of a HNO3 hydrothermal functionalization method and the present study
shows that a controlled functionalization can be achieved by setting with precision
the HNO3 concentration and the temperature. The observed dependency in
temperature confirms that activation energy is controlling the functionalization
process.
The combined analytical power of water adsorption/desorption, resonance Raman
spectroscopy, TGA, TPD-MS and nitrogen porosimetry provides a sensitive means
to measure and quantify oxygen functionalities on SWCNTs bundles subjected to
both hydrothermal and thermal treatment. In addition explains the origin of the pore
structure alteration as result of the functionalization conditions and properties of the
pristine materials.
By conducting water vapor adsorption-desorption isotherms in acidified SWCNTs, it
was possible to discriminate the population of the high acidity carboxylic groups and
correlate these findings with the TPD results. The method can be used to provide a
rapid estimate on the amount of acidic groups attached to the surface of the CNTs,
which are of particular interest for specific applications. However, this methodology
may not be applicable for samples exhibiting high microporosity with pores in the

Part III - Modification of CNTs surface chemistry
87
ultramicropore region, where the contribution of physisorption to the total monolayer
capacity may be significant.
The functionalization degree on the surface of SWCNTs, studied through TPD
analysis, is correlated with the HNO3 concentration by a single-exponential function
for the total amount of groups released as CO or CO2 and can even be, in particular,
numerically computed as function of the concentration of each oxygen specific group.
In this way it can be used to consistently predict the functionalization results for each
carbon material at defined HNO3 concentrations.
Raman spectroscopy of the functionalized SWCNTs reveals a linear scaling of the
defect-activated Raman mode intensity with the concentration of surface groups
determined by TPD-MS and water adsorption-desorption measurements. In this way
quantitative information extracted from Raman data can be correlated with the
functionalization process. Distinct variations have been also identified in the
first-order tangential and radial breathing Raman modes as well as the D and G band
overtones of SWCNTs upon functionalization, reflecting the release of the resonance
Raman condition caused by charge transfer and the underlying shift of the Fermi
level, which depends on the amount and acidity of the oxygen functional groups as
well as the SWCNT’s chirality. Water adsorption-desorption and Raman
measurements on thermally treated SWCNTs samples in air and argon atmosphere
point to the formation of amorphous carbon, which depends on the aggressiveness
of the oxidative conditions. However, a large fraction of the carboxylic groups that
form upon acidification is concluded to remain attached on the SWCNT’s surface
rather than on the generated CCFs.
Analysis of the bimodal pore texture of SWCNTs by QSDFT calculations has shown
that application of a soft acidification process results in the progressive decrease of
the mesopore volume that correlates inversely with the acidity of the treatment
solution. In addition, the micropore volume is shifted toward lower sizes. Both
phenomena dictate more efficient packing/organization of the nanotube bundles and
of individual CNTs upon the introduction of oxygen functional groups. Interesting
enough is that the increase of the micropore volume exhibits a maximum in relation
to the acidity of the solution. This variation evidences the optimum treatment above
which the addition of more functional groups could stereochemically hinder the
diffusion of gaseous molecules in the intertube space of SWCNTs bundles.

88
4.3 Experimental section
Pristine SWCNTs synthesized by Catalytic Chemical Vapor Deposition (CCVD) were
purchased from Shenzhen Nanotechnologies Co. Ltd. (NTP) with the following
manufacturer data: purity of CNT > 90%, purity of SWCNT > 50%, main range of
diameter < 2 nm, length = 5-15 µm. The as received material will be referred as
pristine SWCNTs.
Comparison was made with highly functionalized electric arc-discharge (EA)
reference materials (CSI) from Carbon Solutions, Inc. (USA). CSI samples are
characterized by the highest purity of most commercially available EA-SWCNTs
(SWCNT purity > 90%) and a narrow distribution of diameters around 1.4 nm, while
they are in a heavily functionalized state (∼ 6 wt % of carboxylic acid groups) after
oxidative treatment in concentrated HNO3 [32, 33].
4.3.1 Single-Walled Carbon Nanotubes functionalization
The functionalization of SWCNTs followed an experimental procedure described in
detail in Section 2.1.1 of Chapter 2. The CNTs (0.2 or 0.5 g) were immersed in HNO3
solutions of different concentrations ranging from 0 – 0.3 mol L-1 in a pressurized
autoclave at high temperature (393 or 473 K) during 2 h of operation.
4.3.2 Single-Walled Carbon Nanotubes characterization
Temperature Programmed Desorption (TPD) analysis was carried out using 0.1 g of
each sample placed in a U-shaped quartz tube and heated at 5 K min-1 until reach
the maximum temperature of 1273 K. The concentration of CO and CO2 released
was determined using the calibration performed at the end of each analysis and the
experimental error was less than 8%.
The amount of volatiles, fixed carbon and ash content was assessed for each sample
by Thermogravimetric Analysis (TGA). The samples were heated under a N2
atmosphere to the final temperature of 1173 K allowing the calculation of the amount
of volatile compounds at the surface and the amount of fixed carbon. After the gas
feed was turned to O2 the ash content is determined when a new stable weight was
reached.
The materials texture was determined by N2 adsorption-desorption isotherms at 77 K
with calculation of the surface area based on the Brunauer, Emmett and Teller (BET)

Part III - Modification of CNTs surface chemistry
89
theory, SBET, determined by multipoint analysis in the relative pressure range from
0.05 to 0.3.
Other treatments and analytical techniques were performed in cooperation with the
Institute of Advanced Materials, NCSR Demokritos, Greece.
Water vapor adsorption-desorption measurements were conducted on a
microbalance with a 0.1 µg stable resolution. Before each measurement, the samples
were degassed under high vacuum (10-5 mbar) at 180 ºC.
Mild oxidative and pyrolytic treatments in air and argon atmosphere were applied on
the fully functionalized and pristine SWCNTs in order to determine the extent of
amorphous carbon generation and the relative distribution of functional groups and
CCFs. Argon treatment was performed with a ramp rate of 5 K min-1 up to the
temperature of 773 K and an isothermal step of 30 min. For the air treatment the ramp
rate was maintained at 2.5 K min-1 up to the temperature of 573 K followed by an
isothermal step of 30 min.
Pore size distributions (PSDs) were obtained after using the Quenched Solid Density
Functional Theory (QSDFT) N2-carbon equilibrium transition kernel at 77 K of
Quantachrome’s Library [34].
Raman measurements were performed to assess structural morphologic changes at
molecular level by applying an Ar+ ion laser (λ = 514.5 nm, E = 2.41 eV) and a high
power near-infrared (NIR) diode laser (λ = 785 nm, E = 1.58 eV) as excitation
sources.
Detailed description of the applied conditions for every analytical technique
mentioned before is explained in Chapter 3.
4.4 References
[1] Silva AMT, Machado BF, Figueiredo JL, Faria JL. Controlling the surface
chemistry of carbon xerogels using HNO3-hydrothermal oxidation. Carbon. 2009; 47
(7):1670-9.
[2] López-Ramón MV, Stoeckli F, Moreno-Castilla C, Carrasco-Marın F. Specific
and non-specific interactions of water molecules with carbon surfaces from
immersion calorimetry. Carbon. 2000; 38 (6):825-9.

90
[3] Figueiredo JL, Pereira MFR, Freitas MMA, Órfão JJM. Modification of the
surface chemistry of activated carbons. Carbon. 1999; 37 (9):1379-89.
[4] Figueiredo JL, Pereira MFR, Freitas MMA, Órfão JJM. Characterization of
Active Sites on Carbon Catalysts. Ind Eng Chem Res. 2007; 46 (12):4110-5.
[5] Ros TG, van Dillen AJ, Geus JW, Koningsberger DC. Surface Oxidation of
Carbon Nanofibres. Chem-Eur J. 2002; 8 (5):1151-62.
[6] Yang D-Q, Rochette J-F, Sacher E. Functionalization of Multiwalled Carbon
Nanotubes by Mild Aqueous Sonication. J Phys Chem B. 2005; 109 (16):7788-94.
[7] Zhang J, Zou H, Qing Q, Yang Y, Li Q, Liu Z, et al. Effect of Chemical
Oxidation on the Structure of Single-Walled Carbon Nanotubes. J Phys Chem B.
2003; 107 (16):3712-8.
[8] Yu H, Jin Y, Peng F, Wang H, Yang J. Kinetically Controlled Side-Wall
Functionalization of Carbon Nanotubes by Nitric Acid Oxidation. J Phys Chem C.
2008; 112 (17):6758-63.
[9] Salzmann CG, Llewellyn SA, Tobias G, Ward MAH, Huh Y, Green MLH. The
Role of Carboxylated Carbonaceous Fragments in the Functionalization and
Spectroscopy of a Single-Walled Carbon-Nanotube Material. Adv Mater. 2007; 19
(6):883-7.
[10] Serp P, Corrias M, Kalck P. Carbon nanotubes and nanofibers in catalysis.
Appl Catal A-Gen. 2003; 253 (2):337-58.
[11] Sing KSW, Everett DH, Haul RAW, Moscou L, Pierotti RA, Rouquerol J, et
al. Reporting physisorption data for gas/solid systems with special reference to the
determination of surface area and porosity (Recommendations 1984). Pure Appl
Chem. 1985; 57 (4):603-19.
[12] Mawhinney DB, Naumenko V, Kuznetsova A, Yates Jr JT, Liu J, Smalley RE.
Surface defect site density on single walled carbon nanotubes by titration. Chem
Phys Lett. 2000; 324 (1–3):213-6.
[13] Esteves IAAC, Cruz FJAL, Müller EA, Agnihotri S, Mota JPB. Determination
of the surface area and porosity of carbon nanotube bundles from a Langmuirian
analysis of sub- and supercritical adsorption data. Carbon. 2009; 47 (4):948-56.
[14] Yang CM, Kim DY, Lee YH. Single-walled carbon nanotube network with
bimodal pore structures of uniform microporosity and mesoporosity. J Nanosci
Nanotechnol. 2005; 5 (6):970-4.

Part III - Modification of CNTs surface chemistry
91
[15] Arai M, Kanamaru M, Matsumura T, Hattori Y, Utsumi S, Ohba T, et al. Pore
characterization of assembly-structure controlled single wall carbon nanotube.
Adsorpt. 2007; 13 (5-6):509-14.
[16] Thomsen C, Reich S. Double Resonant Raman Scattering in Graphite. Phys
Rev Lett. 2000; 85 (24):5214-7.
[17] Pimenta MA, Dresselhaus G, Dresselhaus MS, Cancado LG, Jorio A, Saito
R. Studying disorder in graphite-based systems by Raman spectroscopy. Phys Chem
Chem Phys. 2007; 9 (11):1276-90.
[18] Tuinstra F, Koenig JL. Roman spectrum of graphite. J Chem Phys. 1970; 53
(3):1280-1.
[19] Fantini C, Pimenta MA, Strano MS. Two-Phonon Combination Raman Modes
in Covalently Functionalized Single-Wall Carbon Nanotubes. J Phys Chem C. 2008;
112 (34):13150-5.
[20] Lucchese MM, Stavale F, Ferreira EHM, Vilani C, Moutinho MVO, Capaz RB,
et al. Quantifying ion-induced defects and Raman relaxation length in graphene.
Carbon. 2010; 48 (5):1592-7.
[21] Marques RRN, Machado BF, Faria JL, Silva AMT. Controlled generation of
oxygen functionalities on the surface of Single-Walled Carbon Nanotubes by HNO3
hydrothermal oxidation. Carbon. 2010; 48 (5):1515-23.
[22] Maciel IO, Anderson N, Pimenta MA, Hartschuh A, Qian H, Terrones M, et
al. Electron and phonon renormalization near charged defects in carbon nanotubes.
Nat Mater. 2008; 7 (11):878-83.
[23] Zhou W, Vavro J, Nemes NM, Fischer JE, Borondics F, Kamarás K, et al.
Charge transfer and Fermi level shift in p-doped single-walled carbon nanotubes.
Phys Rev B. 2005; 71 (20):205423.
[24] Kalbac M, Kavan L, Farhat H, Kong J, Dresselhaus MS. Large Variety of
Behaviors for the Raman G′ Mode of Single Walled Carbon Nanotubes upon
Electrochemical Gating Arising from Different (n,m) of Individual Nanotubes. J Phys
Chem C. 2009; 113 (5):1751-7.
[25] Nemanich RJ, Solin SA. First- and second-order Raman scattering from
finite-size crystals of graphite. Phys Rev B. 1979; 20 (2):392-401.
[26] Tan P, An L, Liu L, Guo Z, Czerw R, Carroll DL, et al. Probing the phonon
dispersion relations of graphite from the double-resonance process of Stokes and
92
anti-Stokes Raman scatterings in multiwalled carbon nanotubes. Phys Rev B. 2002;
66 (24):245410.
[27] Dresselhaus MS, Dresselhaus G, Saito R, Jorio A. Raman spectroscopy of
carbon nanotubes. Phys Rep. 2005; 409 (2):47-99.
[28] Thomsen C. Second-order Raman spectra of single and multiwalled carbon
nanotubes. Phys Rev B. 2000; 61 (7):4542-4.
[29] O’Connell MJ, Sivaram S, Doorn SK. Near-infrared resonance Raman
excitation profile studies of single-walled carbon nanotube intertube interactions: A
direct comparison of bundled and individually dispersed HiPco nanotubes. Phys Rev
B. 2004; 69 (23):235415.
[30] Itkis ME, Perea DE, Jung R, Niyogi S, Haddon RC. Comparison of Analytical
Techniques for Purity Evaluation of Single-Walled Carbon Nanotubes. J Am Chem
Soc. 2005; 127 (10):3439-48.
[31] Kavan L, Kalbác M, Zukalová M, Dunsch L. Electrochemical Doping of
Chirality-Resolved Carbon Nanotubes. J Phys Chem B. 2005; 109 (42):19613-9.
[32] Hu H, Zhao B, Itkis ME, Haddon RC. Nitric Acid Purification of Single-Walled
Carbon Nanotubes. J Phys Chem B. 2003; 107 (50):13838-42.
[33] Itkis ME, Perea DE, Niyogi S, Rickard SM, Hamon MA, Hu H, et al. Purity
Evaluation of As-Prepared Single-Walled Carbon Nanotube Soot by Use of Solution-
Phase Near-IR Spectroscopy. Nano Lett. 2003; 3 (3):309-14.
[34] Neimark AV, Lin Y, Ravikovitch PI, Thommes M. Quenched solid density
functional theory and pore size analysis of micro-mesoporous carbons. Carbon.
2009; 47 (7):1617-28.


5 MWCNTs functionalization by hydrothermal oxidation
Controlled surface functionalization of multi-walled carbon
nanotubes by HNO3 hydrothermal oxidation3
Given the structural differences between SWCNTs and MWCNTs, with a predictable
higher resistance for the latter to post effects of oxidation treatments and the
significantly lower costs for mass production, the potential of nitric acid hydrothermal
oxidation was systematically explored for their controlled functionalization. Two types
of commercially available MWCNTs, grown by catalytic chemical vapor deposition,
with largely different morphological characteristics (diameter and length) were
compared. The same conditions were reproduced from the previously tested with the
SWCNTs. The effectiveness on the creation of surface oxygen-functionalities was
compared based on the results obtained with temperature programmed desorption
coupled with mass spectrometry from which was possible to identify and quantify the
groups created at the surface. Further detailed characterization was carried out to
evaluate the occurred structural modifications by thermogravimetry and differential
scanning calorimetry, Raman spectroscopy and N2 porosimetry analysis (Institute of
Advanced Materials, NCSR Demokritos, Greece). Comparison was made with the
commonly used boiling acid methods, revealing that hydrothermal oxidation is a
competitive methodology to efficiently modify CNTs surface using much lower
amounts of oxidizing agent and reducing amorphous carbon deposits on CNTs
surface. On the other hand, boiling acid methods provide higher amounts of the
carboxylic acid functionalities on MWCNTs surface, which are of particular interest
on the progress of this research, namely in the synthesis of CNT composite materials
for photocatalytic applications.
3 Likodimos, V., Steriotis, T.A., Papageorgiou, S.K., Romanos, G.Em., Marques, R.R.N., Rocha, R.P., Faria, J.L., Pereira, M.F.R., Figueiredo, J.L., Silva, A.M.T., Falaras, P. (2014) Controlled surface functionalization of multiwall carbon nanotubes by HNO3 hydrothermal oxidation, Carbon, 69, 311-326.


Part III - Modification of CNTs surface chemistry
97
5.1 Results and discussion
Commercially available Multi-Walled Carbon Nanotubes (MWCNTs) grown by
catalytic chemical vapor deposition (CCVD) with different morphologies, regarding
diameter and length, were studied and compared to the SWCNTs discussed in the
previous Chapter 4 with basis on the extent of surface functionalization and
subsequent structural modifications after being oxidized through the same
hydrothermal HNO3 oxidation method. The results were compared with those
obtained with the aggressive oxidation of CNTs in concentrated HNO3 at boiling
temperature. Experimental conditions used on the oxidation treatments are given in
detail in Sections 2.1.1 and 2.1.2 of Chapter 2. Information about the CNTs involved
in this work can be found in Experimental section 5.3.
5.1.1 Identification and quantification of oxygen groups
Figure 4.1 displays the Temperature Programmed Desorption (TPD) spectra arising
from specific oxygen groups released as CO and CO2 from the surface of the
hydrothermally treated NTX3 MWCNTs (see Experimental section 5.3), as a function
of the HNO3 concentration. These results are obtained by coupling TPD to mass
spectrometry (MS). The TPD profiles measured for the pristine NTX3 material and
for the blank experiment in the absence of HNO3 are also included for comparison.
Qualitatively similar TDP spectra were acquired for the thin and narrow NC3100
MWCNTs (see Experimental section 5.3) under identical HNO3 concentrations as for
the NTX3, though using higher amount (0.5 g) of NC3100 material (not shown).
(a)
300 400 500 600 700 800 900 1000 1100 1200 1300
0.0
0.2
0.4
0.6
0.3
0.2
0.1
0.05
0 (Blank)
0 - Pristine [HNO
3] (m
ol L-1 )
T (K)
CO
(
mo
l g-1
s-1
)

98
(b)
Figure 5.1 – TPD spectra for the pristine and hydrothermally treated NTX3
MWCNTs at different HNO3 concentrations and 473 K: (a) CO and (b) CO2 release.
To quantify the relationship between oxygen groups and HNO3 concentrations, the
total amount of surface groups released as CO and CO2 was determined from the
area under the corresponding TPD spectra (Table 5.1). The weight percentage of the
total amount of molecular oxygen released as CO and CO2 (wt.% O2), which is
representative of the total amount of oxygenated groups introduced on the CNT
surface, was calculated based on the amounts determined by the TPD analysis.
Table 5.1 - Total amount of CO, CO2 and wt.% O2 calculated from the TPD spectra
obtained for the hydrothermally functionalized NTX3 different HNO3 concentrations
and 473 K.
[HNO3]
(mol L-1)
CO (20)
(mol g-1)
CO2 (20)
(mol g-1) CO/CO2 O2 (wt.%)
0 – Pristine 218 43 5.12 0.5
0 (Blank) 278 23 12.3 0.5
0.05 946 304 3.11 2.5
0.10 1156 482 2.40 3.4
0.20 1463 545 2.68 4.1
0.30 1573 662 2.38 4.6
7.0 (Boiling) 1344 751 1.79 4.6
300 400 500 600 700 800 900 1000 1100 1200 1300
0.0
0.1
0.2
0.3
0.3
0.2
0.1
0.05
0 (Blank)
0 - Pristine [HNO
3] (m
ol L-1 )
T (K)
CO
2 (
mo
l g-1
s-1
)

Part III - Modification of CNTs surface chemistry
99
Pristine NTX3 materials comprised low amounts of surface groups leading to a low
amount of released wt.% O2. Furthermore, hydrothermal treatment without nitric acid
was verified to cause negligible effects on the poor surface chemistry of the pristine
NTX3 MWCNTs. On the other hand, hydrothermal treatment in the presence of nitric
acid resulted in a marked increase of the release of both CO and CO2 that depended
strongly on the HNO3 concentration, as shown in Figure 5.2.
Previous studies [1] have pointed out that oxygen containing groups are not created
on the surface of SWCNTs when hydrothermal oxidation is performed at a lower
temperature (393 K), the two key parameters of the functionalization process being
the temperature and HNO3 concentration. However, pressure during hydrothermal
treatment may also promote surface group kinetics and the homogenous generation
of oxygen functional groups within the MWCNTs layers, as inferred from their low
thermal stability (Section 5.1.2).
Figure 5.2 - Evolution of the amount of CO and CO2 released from the surface of
the hydrothermally treated NTX3 and NC3100 MWCNTs vs. the HNO3
concentration.
In addition, a single exponential function was found to describe analytically the
evolution of CO and CO2 amounts with the HNO3 concentration, in qualitative
agreement with the results obtained for hydrothermally treated SWCNTs [1, 2], and
0.00 0.05 0.10 0.15 0.20 0.25 0.300
500
1000
1500
2000
2500
0
500
1000
1500 NTX3 [CO]
NTX3= 1583 - 1290 exp (- 12.4 [HNO
3])
NC3100 [CO]
NC3100= 3186 - 3071 exp (- 3.4 [HNO
3])
[C
O] (
mol g
-1)
[HNO3] (mol L
-1)
[C
O2] (
mol g
-1)
NTX3
[CO2]NTX3
=650-625 exp(-11.9 [HNO3])
NC3100
[CO2]NC3100
=837-815 exp(-5.7 [HNO3])

100
carbon xerogels [3]. This shows that oxygen surface functionalization of both
MWCNTs and SWCNTs can be accurately controlled through the hydrothermal
methodology regardless of the structural differences between them and the different
amounts of surface groups introduced on the CNT’s surface. However, despite the
qualitatively similar evolution of oxygen functionalities on the hydrothermally treated
materials, the degree of oxygen functionalization as monitored by the CO, CO2 and
CO/CO2 dependence on [HNO3], varied appreciably for the two different types of
MWCNTs. In fact, the amounts of oxygen groups released as CO and CO2 for
NC3100 exceeded significantly the corresponding ones of NTX3 at HNO3
concentrations above 0.1 mol L-1 (Table 5.1). This difference is further augmented if
we take into account the higher loading of NC3100 MWCNTs (0.5 g) that would be
expected to effectively decrease the amount of oxygen functionalities on the MWCNT
surface at the same HNO3 concentration. These distinct differences between NTX3
and NC3100, indicate that the nanotube morphology and particularly the MWCNT’s
diameter and length, which differ considerably between the two types of CCVD tubes,
are critical parameters for the extent of surface functionalization by the HNO3
hydrothermal process. Furthermore, comparison with the corresponding results on
hydrothermally treated SWCNTs [1] shows that the degree of surface
functionalization of the MWCNTs is systematically lower, especially for NTX3, where
the amount of groups released as CO is nearly two times lower for all the HNO3
concentrations.
Although the TPD profiles of the hydrothermally treated MWCNTs are similar to the
corresponding ones of SWCNTs, the CO/CO2 ratios for the MWCNTs (< 3.11) are
considerably lower than those of the SWCNTs (> 3.50) [1], implying that the
generation of surface groups released as CO2 with respect to CO is favored on the
MWCNTs surface in comparison with SWCNTs. In typical liquid phase
functionalization methods with acids, the CO/CO2 ratio tends to decrease with the
increase of the concentration of the oxidizing agent due to the introduction of more
acidic groups on the CNTs surface that are released as CO2. This implies the
formation of relatively more acidic groups, in comparison to basic groups, on the
surface of MWCNTs than on SWCNTs oxidized under similar conditions. In order to
further assess the interplay between the efficiency of hydrothermal oxidation for
CNTs surface functionalization and the intrinsic materials properties, the total amount
of molecular oxygen released from the materials’ surface (wt.% O2) was compared
for both types of MWCNTs, NTX3 and NC3100, including previous results on

Part III - Modification of CNTs surface chemistry
101
hydrothermally treated SWCNTs (SBET ~ 400 m2 g-1 for SWCNTs) [1] as a function of
the [HNO3]/mCNT ratio, which is independent of the CNTs loading (Figure 5.3).
Figure 5.3 - Amount of molecular oxygen present as oxygen groups in the surface
of SWCNT, NC3100 and NTX3 as a function of the [HNO3]/mCNT ratio.
In fact, it has been proved that the wt.% O2 for two different loadings of SWCNTs
(namely 0.2 and 0.5 g) scale consistently, when plotted as a function of the
[HNO3]/mCNT ratio [1], which may thus serve as common scale for the comparison of
functionalized CNTs by the hydrothermal oxidation methodology.
The [HNO3] dependence of the amount of molecular O2 was thus found to vary
considerably for the different types of CNTs, the most pronounced differences
occurring between NC3100 and NTX3. In particular, the short and thin (length of
~ 1.5 µm and diameter of ~ 10 nm) NC3100 MWCNTs were functionalized to a
considerably higher extent than the much longer (>10 µm) and thicker (diameter in
the range of 25-40 nm) NTX3 nanotubes, in accordance with the respective BET
surface area of the pristine materials (SBET ~ 300 and 80 m2 g-1 for NC3100 and NTX3,
respectively), i.e. a higher functionalization is obtained for MWCNTs with higher
surface area. This confirms that the CNTs morphology and especially the MWCNT’s
diameter and length and the concomitant variation of the surface area, dictate to a
large extent the degree of surface functionalization. Additionally, regarding both
NTX3 and SWCNTs, Figure 5.3 shows a plateau for the wt.% O2 evolution at the
higher [HNO3]/mCNT ratios, which was not observed for the NC3100 samples since
0.0 0.2 0.4 0.6 0.8 1.0 1.2 1.4 1.60
2
4
6
8
10
[HNO3]/m
CNT (mol L
-1 g
-1)
O2 (
wt.
%)
SWNTs
MWNTs-NC3100
MWNTs-NTX3
O2 = 7.55 - 7.29 exp (- 2.14 [HNO
3])
r2 = 0.981
O2 = 4.60 - 4.09 exp (- 2.46 [HNO
3])
r2 = 0.989
O2 = 8.46 - 6.74 exp (- 2.04 [HNO
3])
r2 = 0.985

102
only lower [HNO3]/mCNT ratios were tested in this particular case. The total amount of
CO and CO2, as well as the [HNO3]/mCNT ratio, were also normalized to the BET
surface area of each sample (i.e. CO + CO2/SBET vs. [HNO3]/mCNT/SBET, not shown).
The amount of groups per surface area were thus found to be slightly higher for
SWCNTs in comparison to NC3100, corroborating that the surface of the longer and
thinner SWCNTs is more easily oxidized than that of the shorter and thicker MWCNT
NC3100. However, the CO + CO2/SBET ratio for a given [HNO3]/mCNT/SBET was higher
for NTX3 than for the other two materials, even if the total amount of groups
introduced in these MWCNTs is much lower (Figure 5.3), indicating that NTX3 offers
less (but more reactive) sites for surface functionalization.
To explore further the modification of the MWCNT’s surface chemistry by
hydrothermal oxidation, the nature of the distinct functional groups and their amounts
were determined as function of the HNO3 concentration by deconvolution of the CO
and CO2 TPD spectra following the procedure previously developed for activated
carbons [4, 5]. All spectra were deconvoluted and the amount of each group
(determined by calculating the area under the correspondent peak) is presented as
a function of the HNO3 concentration in Figure 5.4.
(a)
Carboxylic Anhydrides
Phenols
Carbonyl / Quinones
0.00 0.05 0.10 0.15 0.20 0.25 0.300
50
100
150
200
250
300
CO
(
mol g
-1)
[HNO3] (mol L
-1)
CO
(
mol g
-1)
0
300
600
900
1200
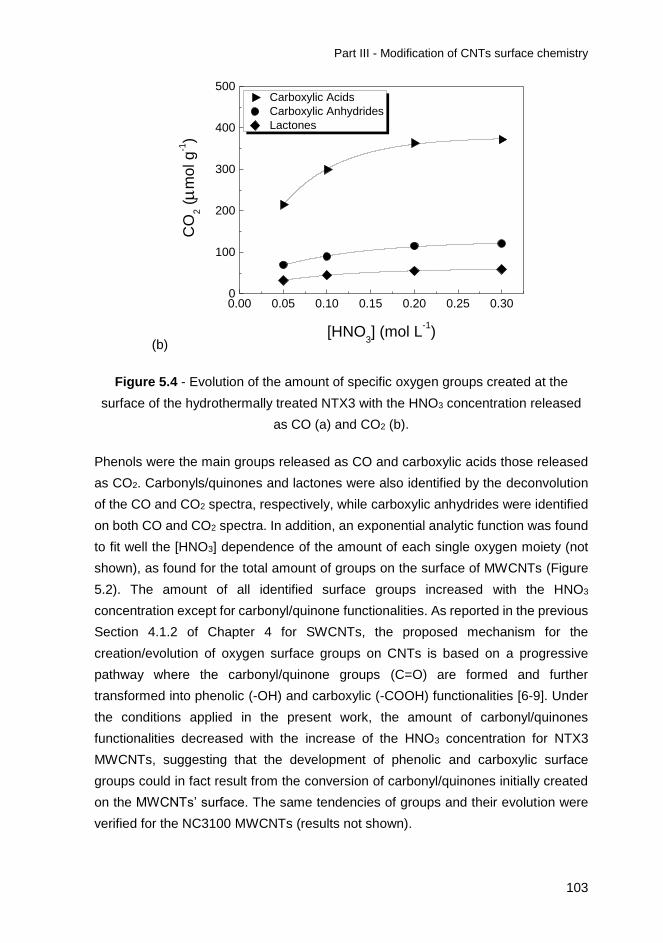
Part III - Modification of CNTs surface chemistry
103
(b)
Figure 5.4 - Evolution of the amount of specific oxygen groups created at the
surface of the hydrothermally treated NTX3 with the HNO3 concentration released
as CO (a) and CO2 (b).
Phenols were the main groups released as CO and carboxylic acids those released
as CO2. Carbonyls/quinones and lactones were also identified by the deconvolution
of the CO and CO2 spectra, respectively, while carboxylic anhydrides were identified
on both CO and CO2 spectra. In addition, an exponential analytic function was found
to fit well the [HNO3] dependence of the amount of each single oxygen moiety (not
shown), as found for the total amount of groups on the surface of MWCNTs (Figure
5.2). The amount of all identified surface groups increased with the HNO3
concentration except for carbonyl/quinone functionalities. As reported in the previous
Section 4.1.2 of Chapter 4 for SWCNTs, the proposed mechanism for the
creation/evolution of oxygen surface groups on CNTs is based on a progressive
pathway where the carbonyl/quinone groups (C=O) are formed and further
transformed into phenolic (-OH) and carboxylic (-COOH) functionalities [6-9]. Under
the conditions applied in the present work, the amount of carbonyl/quinones
functionalities decreased with the increase of the HNO3 concentration for NTX3
MWCNTs, suggesting that the development of phenolic and carboxylic surface
groups could in fact result from the conversion of carbonyl/quinones initially created
on the MWCNTs’ surface. The same tendencies of groups and their evolution were
verified for the NC3100 MWCNTs (results not shown).
0.00 0.05 0.10 0.15 0.20 0.25 0.300
100
200
300
400
500 Carboxylic Acids
Carboxylic Anhydrides
Lactones
CO
2 (
mol g
-1)
[HNO3] (mol L
-1)

104
Furthermore, comparison between the two types of MWCNT showed that the
generation of both phenols and carboxylic groups was markedly enhanced for
NC3100, confirming that this material offers more sites for surface functionalization
compared with the long and large diameter NTX3 MWCNTs. Moreover, the amount
of carboxylic anhydrides for MWCNTs was comparable (NTX3) or even higher
(NC3100) than that estimated for SWCNTs at the same conditions [1]. Regarding the
other surface groups, the amounts of carbonyl/quinones, phenols and lactones were
smaller in MWCNTs compared to the corresponding ones obtained for SWCNTs.
However, the amount of carboxylic acids was similar for NTX3 or considerably larger
for the NC3100 MWCNTs in comparison with the SWCNTs, verifying that the
transformation of carbonyl/quinones to carboxylic acids is more favorable on the
surface of MWCNTs than on SWCNTs, in particular when compared to phenols. This
justifies the lower CO/CO2 ratios found for hydrothermally treated MWCNTs with
respect to their SWCNT analogues and further emphasizes the high efficiency of
hydrothermal oxidation for CCVD MWCNTs under optimal conditions. The enhanced
surface reactivity of hydrothermally treated MWCNTs for -COOH generation may be
in principle rationalized by the inherent differences in the spatial dimensions and
defect structure (e.g. CNTs caps with pentagons and heptagons) of MWCNTs with
respect to SWCNTs. This could effectively alter the nature and density of reactive
sites for oxygen groups’ formation and lead to diverse oxidation mechanisms under
hydrothermal conditions. Recent theoretical work on the oxidation of MWCNTs under
HNO3 reflux predicted a four step reaction mechanism for a monovacancy defect
leading to a surface carboxylic group accompanied with vacancy enlargement [6]. On
the other hand, a different oxidation mechanism may occur for SWCNTs, where the
confined diameter and diverse chirality were predicted to lower the adsorption barrier
for NO2 attack on the tube walls leading to the preferential functionalization and even
selective removal of small diameter metallic SWCNTs [10].
For comparison, the boiling acid method was also applied for the surface
functionalization of the NTX3 and NC3100 MWCNTs. Figure 5.5 shows the TPD
spectra for NTX3 treated with 7.0 mol L-1 HNO3 at boiling temperature and their
deconvolution to the individual components of the different oxygen surface groups
(see Figure A.1 in Appendix A for the corresponding spectra of NC3100 MWCNTs).
The corresponding amount of surface groups released as CO and CO2 as well as
wt.% O2 are included in Table 5.1. The total amount of surface groups was
comparable, though systematically lower, than that obtained under hydrothermal
treatment at the highest HNO3 concentration (0.3 mol L-1), especially for the highly

Part III - Modification of CNTs surface chemistry
105
functionalized NC3100 samples (results not shown – forward to Figure A.1 in
Appendix A). These results indicate that apart from being a controllable
functionalization process that consumes a lower amount of oxidizing agent,
hydrothermal oxidation competes well with the harsh boiling HNO3 treatment in terms
of the generation of sufficient quantities of oxygen functionalities on the MWCNTs
surface.
(a)
(b)
Figure 5.5 - Deconvolution of TPD spectra for NTX3 treated with [HNO3] =
7.0 mol L-1 at boiling temperature: groups released as (a) CO and (b) CO2 (PH –
phenols; CAn – carboxylic anhydrides; CQ – carbonyl quinones; LC – lactones; CAc
– carboxylic acids; SA – strong acidic CAc; WA – weakly acidic CAc).
Nevertheless, the CO2 amount was relatively higher (by 13%) in the MWCNTs
oxidized under boiling acid compared to the hydrothermally treated ones (Table 5.1).
300 400 500 600 700 800 900 1000 1100 1200 13000.0
0.1
0.2
0.3
0.4
T (K)
CO
(
mo
l g
-1s
-1)
CQ
CAc
CAn
PH
300 400 500 600 700 800 900 1000 1100 1200 13000.00
0.05
0.10
0.15
0.20
0.25
LC
CAn
WA
T (K)
CO
2 (
mo
l g
-1s
-1)
SA

106
Specifically, the amounts of carboxylic acids for the NTX3 sample treated with the
boiling method (7.0 mol L-1) and for the hydrothermally treated sample at the highest
HNO3 concentration (0.3 mol L-1) reached 520 and 370 µmol g-1, respectively. In the
case of NC3100, the corresponding amounts were 550 and 440 µmol g-1,
respectively, indicating that more acidic surface groups were produced on the
MWCNT surface not only due to the aggressive oxidizing conditions of the boiling
acid method but also because hydrothermal oxidation is performed at 473 K, a
temperature where a fraction of carboxylic acids can be partially released. In this
context, the CO2 TPD spectrum of the hydrothermally treated samples (Figure 5.1 b)
differed appreciably from that obtained under boiling conditions (Figure 5.5 b). In the
latter case, CO2 evolved from lower temperatures, due to the higher amount of
carboxylic acids in this sample, allowing the distinction of two different types of
carboxylic acids by the deconvolution of the CO2 TPD spectrum, namely strong acidic
(SA) and weakly acidic (WA) carboxylic acids, which have been established to evolve
at lower and higher temperatures, respectively [41]. A shoulder in the CO spectrum
can be also traced at the same temperatures, where the carboxylic acids evolve in
the CO2 spectrum (identified as CAc in Figure 5.5 a), whose origin, however, is not
fully understood [5]. An additional process that occurs during the hydrothermal
oxidation is the weight loss (WL) that corresponds to the difference between the
weight of CNTs introduced into the autoclave and the final weight of the recovered
material after the hydrothermal run. Figure 5.6 compares the observed Weight
Loss (WL) as a function of the [HNO3]/mCNT ratio for the SWCNTs, NTX3 and NC3100
MWCNTs.
The observed WL variation can be fitted to exponential functions, resembling the
dependence of the oxygen groups with the [HNO3]/mCNT ratio. This effect can be
associated with the preferential formation of oxygen groups on carboxylated
carbonaceous fragments (CCFs) produced by the CNT’s consumption during HNO3
treatment, especially SWCNTs that are most susceptible to acid oxidation [2, 11-14].
It was proposed that under strong enough oxidizing conditions the adsorbed CCFs
on the CNTs walls can be fully gasified to CO2, accounting for the observed WL and
its dependence on the HNO3 concentration [1].

Part III - Modification of CNTs surface chemistry
107
Figure 5.6 - Weight loss observed after hydrothermal treatment of NTX3, NC3100
and SWCNTs as a function of the [HNO3]/mCNT ratio.
In the present case, the WL increased upon hydrothermal treatment at 0.30 mol L-1
HNO3 up to around 50%, 25% and 30% for SWCNTs, NTX3 and NC3100 materials,
respectively. These results confirm the higher stability of the MWCNT structure to
nitric acid oxidation compared with the SWCNTs. Moreover, NC3100 exhibited
appreciable WL upon hydrothermal oxidation, approaching that of SWCNTs,
consistently with their highly functionalized state.
5.1.2 Thermal analysis
Further evidence for the efficiency of MWCNT hydrothermal oxidation was provided
by TGA-DSC measurements. Figure 5.7 compares the TGA curves and the
corresponding enthalpy (DSC) changes on the pristine and hydrothermally treated
NTX3 MWCNTs at different HNO3 concentrations.
The effect of hydrothermal treatment was evident on both classes of materials, as
increasing the HNO3 concentration resulted in significantly lower thermal stability of
the functionalized MWCNTs due to the existence of covalently bonded oxidizing
surface groups and the concurrent partial loss of crystallinity [15].
0.0 0.2 0.4 0.6 0.8 1.0 1.2 1.4 1.60
10
20
30
40
50
60
[HNO3]/m
CNT (mol L
-1 g
-1)
WL
(%
)
SWNTs
MWNTs-NC3100
MWNTs-NTX3
WL = 153 - 149 exp (- 0.30 [HNO3])
r2 = 0.999
WL = 52.3 - 47.3 exp (- 1.52 [HNO3])
r2 = 0.995
WL = 32.4 - 27.4 exp (- 1.00 [HNO3])
r2 = 0.999

108
Figure 5.7 – TGA-DSC curves on the pristine and hydrothermally treated NTX3
MWCNTs at different HNO3 concentrations.
No marked differences were observed on the thermal stability between the pristine
NTX3 and the NC3100 samples. The onset of thermal degradation for the pristine
NTX3 occurred at ca. 753 K, only 30 K higher than the corresponding one of NC3100
MWCNTs, despite their much larger diameter (the oxidation temperatures
determined from the maxima of the corresponding mass loss rates were 861 and
870 K for the NTX3 and NC3100, respectively). This further implies that the thin and
short NC3100 MWCNTs present a high degree of crystallinity, in spite of their small
diameter that would otherwise lead to considerably lower oxidation temperature and
thermal stability [16]. Hydrothermal functionalization reduced drastically the thermal
stability of NTX3 with increasing HNO3 concentration, as for the functionalized
samples of NC3100. For the last, thermal degradation started at 603 and 543 K for
the treated samples at 0.1 and 0.3 mol L-1 HNO3, followed by complete burn out at
878 and 813 K, respectively (results not shown). However, contrary to the NC3100
MWCNTs, two major components with distinct thermal properties were clearly
differentiated by a slope change of the TGA traces around 763 K and a double peak
profile of the DSC curve for the functionalized NTX3 samples. The first component
was identified at temperatures slightly below the corresponding oxidation peak of
NC3100, while the second one occurred at higher temperatures, indicative of a
MWCNT fraction more resistant to oxidation. This distinctive behavior may be related
to the diverse reactivity of inner and outer CNT layers to thermal decomposition [17]
most pertinent to the large diameter NTX3 MWCNTs comprising a high number
(25-50) of rolled graphitic layers. Furthermore, TGA measurements on the NTX3 and
NC3100 MWCNTs oxidized with 7.0 mol L-1 HNO3 at boiling temperature (not shown),
revealed considerably higher thermal stability of both samples compared to the
0
20
40
60
80
100
NC3100
Pristine
0.1 M
0.3 M
We
igh
t (%
)
0
30
60
90
120
150
NC3100
Pristine
0.1 M
0.3 M
He
ta f
low
(m
W)
100 200 300 400 500 600 7000
20
40
60
80
100
NTX3
Pristine
0.1 M
0.3 M
Temperature (oC)
We
igh
t (%
)
100 200 300 400 500 600 700
0
30
60
90
120
150
NTX3
Pristine
0.1 M
0.3 M
He
ta f
low
(m
W)
Temperature (oC)

Part III - Modification of CNTs surface chemistry
109
corresponding (0.3 mol L-1) hydrothermally functionalized ones, in spite of the
presence of comparable amounts of oxygen functional groups (Table 5.1). This would
further imply that hydrothermal treatment results in more homogenous distribution of
oxygen groups within the MWCNTs, most likely through the beneficial effect of
pressure, leading to the distinct reduction of MWCNT thermal stability compared to
the boiling acid method. In the latter case, surface modification including the
formation of amorphous carbon may be limited to the external layers of the MWCNTs,
leaving intact the internal CNTs structure and justifying the relatively higher thermal
stability of boiling acid treated samples.
5.1.3 Raman spectroscopy
The effect of hydrothermal oxidation on the MWCNTs’ microstructure was further
investigated by Raman spectroscopy. Figure 5.8 presents the evolution of the Raman
spectra for the hydrothermally functionalized NTX3 samples compared with the
pristine one at two different excitation wavelengths in the NIR (785 nm) and visible
range (514.5 nm).
The characteristic Raman modes of MWCNTs were thus identified, the most
prominent being the first order tangential G band (~1585 cm-1) together with two
highly dispersive modes, the defect-induced D band (~1350 cm-1 at 514.5 nm) and
its overtone (G' band) at 2D (~2700 cm-1 at 514.5 nm). The D band originates from a
double resonant Raman process that involves elastic scattering from defects together
with one phonon inelastic scattering, rendering it the characteristic feature for the
identification of structural disorder and defects in graphitic materials [18].
(a)
1000 1200 1400 1600 1800
800 1200 1600 2400 2800 3200
No
rma
lize
d I
nte
nsity
Raman shift (cm-1)
514.5 nm
(b)
G'
D+D'
2G
800 1200 1600 2400 2800 3200
(a)
785 nm
Pristine
0.05 M
0.10 M
0.20 M
0.30 M
No
rma
lize
d I
nte
nsity
D
G
D'
D3
D4
Pristine
1000 1200 1400 1600 1800
800 1200 1600 2400 2800 3200
No
rma
lize
d Inte
nsity
Raman shift (cm-1)
514.5 nm
(b)
G'
D+D'
2G
800 1200 1600 2400 2800 3200
(a)
785 nm
Pristine
0.05 M
0.10 M
0.20 M
0.30 M
No
rma
lize
d Inte
nsity
D
G
D'
D3
D4
Pristine
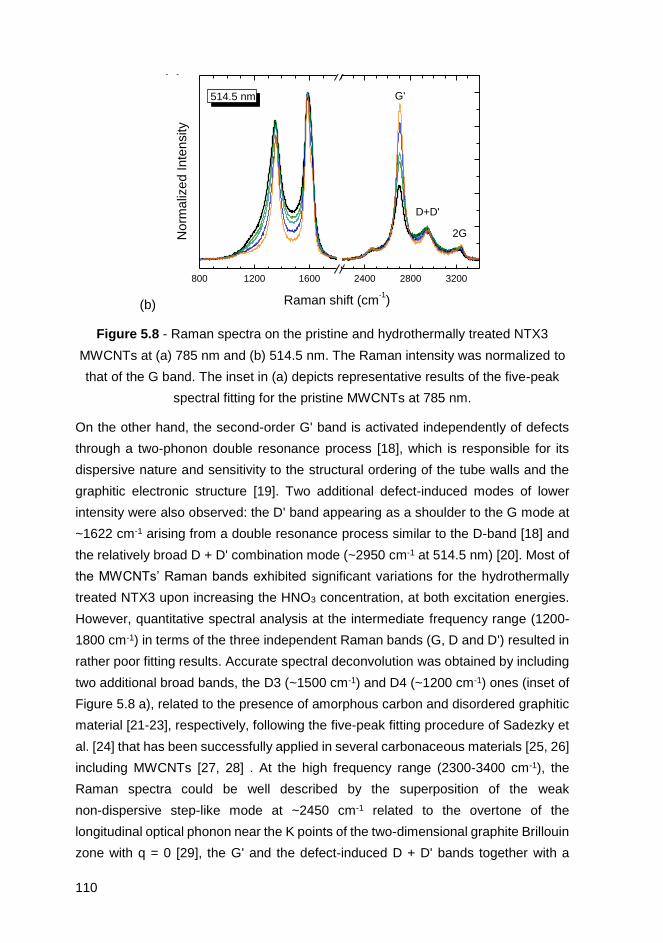
110
(b)
Figure 5.8 - Raman spectra on the pristine and hydrothermally treated NTX3
MWCNTs at (a) 785 nm and (b) 514.5 nm. The Raman intensity was normalized to
that of the G band. The inset in (a) depicts representative results of the five-peak
spectral fitting for the pristine MWCNTs at 785 nm.
On the other hand, the second-order G' band is activated independently of defects
through a two-phonon double resonance process [18], which is responsible for its
dispersive nature and sensitivity to the structural ordering of the tube walls and the
graphitic electronic structure [19]. Two additional defect-induced modes of lower
intensity were also observed: the D' band appearing as a shoulder to the G mode at
~1622 cm-1 arising from a double resonance process similar to the D-band [18] and
the relatively broad D + D' combination mode (~2950 cm-1 at 514.5 nm) [20]. Most of
the MWCNTs’ Raman bands exhibited significant variations for the hydrothermally
treated NTX3 upon increasing the HNO3 concentration, at both excitation energies.
However, quantitative spectral analysis at the intermediate frequency range (1200-
1800 cm-1) in terms of the three independent Raman bands (G, D and D') resulted in
rather poor fitting results. Accurate spectral deconvolution was obtained by including
two additional broad bands, the D3 (~1500 cm-1) and D4 (~1200 cm-1) ones (inset of
Figure 5.8 a), related to the presence of amorphous carbon and disordered graphitic
material [21-23], respectively, following the five-peak fitting procedure of Sadezky et
al. [24] that has been successfully applied in several carbonaceous materials [25, 26]
including MWCNTs [27, 28] . At the high frequency range (2300-3400 cm-1), the
Raman spectra could be well described by the superposition of the weak
non-dispersive step-like mode at ~2450 cm-1 related to the overtone of the
longitudinal optical phonon near the K points of the two-dimensional graphite Brillouin
zone with q = 0 [29], the G' and the defect-induced D + D' bands together with a
1000 1200 1400 1600 1800
800 1200 1600 2400 2800 3200
No
rma
lize
d I
nte
nsity
Raman shift (cm-1)
514.5 nm
(b)
G'
D+D'
2G
800 1200 1600 2400 2800 3200
(a)
785 nm
Pristine
0.05 M
0.10 M
0.20 M
0.30 M
No
rma
lize
d I
nte
nsity
D
G
D'
D3
D4
Pristine

Part III - Modification of CNTs surface chemistry
111
composite band at higher frequencies (see Figure A.2 in Appendix A). The latter band
could be approximated by two weak peaks at ~3180 and ~3240 cm-1 corresponding
to the frequencies of the G band overtone (2G) and its shifted variant in graphitic
materials due to the overbending of the graphite phonon dispersion curve [2, 30].
Figure 5.9 a and b show the [HNO3] dependence of the Raman intensity ratios of the
D, D', D+D', D3 and D4 bands (ID/IG, ID'/IG, ID+D'/IG, ID3/IG and ID4/IG) relative to the
tangential G mode for the NTX3 MWCNTs, calculated from the areas of the
corresponding Raman bands, at 514.5 and 785 nm, respectively.
A gradual decrease of the integrated intensity ratios for both the defect activated D,
D', and D + D' modes and the two broad D3 and D4 bands due to
amorphous/disordered carbon, was evidenced at both excitation wavelengths upon
successive introduction of oxygen functionalities on the NTX3 MWCNTs with
increasing HNO3 concentration. This variation apparently contrasts with the linear
increment of the corresponding defect-activated Raman band intensity ratios with the
amount of oxygen groups on hydrothermally functionalized SWCNTs under the same
conditions [2] as well as the frequently observed increase of the ID/IG ratio with the
reaction time for MWCNTs oxidized by the boiling acid method [31, 32].
The decrease of the intensity ratios was further accompanied by the progressive
narrowing of the width (full width at half-maximum – FWHM) of the defect activated
Raman bands, as shown in Figure 5.9 c, together with a systematic upward shift of
their frequency reaching 5, 8 and ~15 cm-1 for the D, D' and D + D' bands,
respectively, under the highest HNO3 concentration of 0.30 mol L-1.
Both effects, i.e. the relative intensity reduction and the narrowing/shift of the defect
activated Raman bands, point to the preferential oxidation of the most reactive
external carbon layers on the surface of NTX3 MWCNTs with hydrothermal
treatment, in close analogy to previous results on soot oxidation [25]. On the other
hand, the G' band, which is independent of defects and sensitive to the graphitic
structural ordering [19], was significantly enhanced upon increasing the HNO3
concentration. Specifically, the intensity ratio IG'/IG increased continuously with
[HNO3], while the FWHM of the G' band decreased drastically in the same
concentration range (Figure 5.9 d).
This effect can be rationalized by the partial removal of the amorphous carbon
deposits on the MWCNTs or even the consumption of the most disordered/defective
outer MWCNTs shells upon hydrothermal oxidation [33], directly probed by the
decrease of the D3 and D4 band intensities.
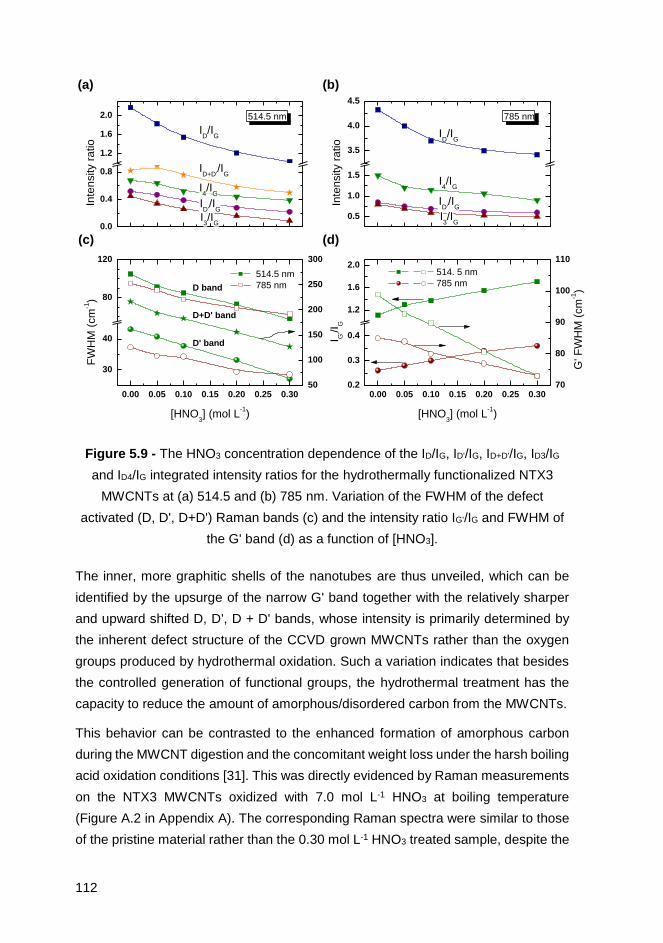
112
Figure 5.9 - The HNO3 concentration dependence of the ID/IG, ID'/IG, ID+D'/IG, ID3/IG
and ID4/IG integrated intensity ratios for the hydrothermally functionalized NTX3
MWCNTs at (a) 514.5 and (b) 785 nm. Variation of the FWHM of the defect
activated (D, D', D+D') Raman bands (c) and the intensity ratio IG'/IG and FWHM of
the G' band (d) as a function of [HNO3].
The inner, more graphitic shells of the nanotubes are thus unveiled, which can be
identified by the upsurge of the narrow G' band together with the relatively sharper
and upward shifted D, D', D + D' bands, whose intensity is primarily determined by
the inherent defect structure of the CCVD grown MWCNTs rather than the oxygen
groups produced by hydrothermal oxidation. Such a variation indicates that besides
the controlled generation of functional groups, the hydrothermal treatment has the
capacity to reduce the amount of amorphous/disordered carbon from the MWCNTs.
This behavior can be contrasted to the enhanced formation of amorphous carbon
during the MWCNT digestion and the concomitant weight loss under the harsh boiling
acid oxidation conditions [31]. This was directly evidenced by Raman measurements
on the NTX3 MWCNTs oxidized with 7.0 mol L-1 HNO3 at boiling temperature
(Figure A.2 in Appendix A). The corresponding Raman spectra were similar to those
of the pristine material rather than the 0.30 mol L-1 HNO3 treated sample, despite the
0.0
0.4
0.8
1.2
1.6
2.0
0.5
1.0
1.5
3.5
4.0
4.5
0.00 0.05 0.10 0.15 0.20 0.25 0.300.2
0.3
0.4
1.2
1.6
2.0
70
80
90
100
110
50
100
150
200
250
300
ID+D'
/IG
I4/I
G
I3/I
G
ID'/I
G
ID/I
G
(d)(c)
(b)
In
ten
sity r
atio
514.5 nm
(a)
Inte
nsity r
atio
785 nm
ID/I
G
I4/I
G
ID'/I
G
I3/I
G
0.00 0.05 0.10 0.15 0.20 0.25 0.30
30
40
80
120
D' band
FW
HM
(cm
-1)
[HNO3] (mol L
-1)
514.5 nm
785 nmD band
I G'/I
G
[HNO3] (mol L
-1)
514. 5 nm
785 nm
G' F
WH
M (
cm
-1)
D+D' band

Part III - Modification of CNTs surface chemistry
113
comparable amounts of functional groups produced by the boiling and hydrothermal
treatments. In fact, spectral analysis revealed that the D, D', D + D' bands were not
severely affected by the boiling acid oxidation (the ID/IG, ID'/IG, ID+D'/IG intensity ratios
decreased by 10% at most compared to the pristine NTX3). On the other hand, the
relative intensity of the D3 band at ~1500 cm-1 associated with the presence of
amorphous carbon increased significantly, i.e. the ID3/IG ratio was doubled for the
boiling acid treated NTX3, in sharp contrast to the hydrothermally treated sample at
0.30 mol L-1 HNO3, where the corresponding ratio showed a fivefold decrease. This
behavior confirmed that hydrothermal oxidation is much more efficient in the
generation of oxygen functionalities on the MWCNTs compared to the aggressive
boiling acid oxidation, where the creation of more carboxylic acid groups identified by
TPD analysis is accompanied by extensive formation of amorphous carbon on the
MWCNT surface.
Spectral analysis of pristine NC3100 MWCNTs at 514.5 nm revealed that the relative
intensity of the defect activated Raman bands, especially that of the D, D' and D4
bands, as well as their width were appreciably lower than those of the corresponding
NTX3 MWCNTs (results not shown). In addition, the relative intensity of the G' band
was considerably enhanced for the pristine NC3100 by ca. 70%, indicating that these
MWCNTs are more crystalline and contain smaller amounts of amorphous carbon
than the NTX3 ones, in agreement with high resolution TEM results on NC3100 [34].
Hydrothermal oxidation resulted in a moderate and most importantly non-
monotonous dependence of the ID/IG, ID'/IG, ID+D'/IG, ID3/IG and ID4/IG intensity ratios on
the HNO3 concentration. In particular, a modest decrease of the relative Raman
intensity was observed up to 0.1 mol L-1 HNO3, most evident for the D band, followed
by a gradual increase to the initial values at higher nitric acid concentrations. This
variation was further accompanied by the decrease of the Raman band width,
especially up to 0.10 mol L-1. Likewise, the G' band exhibited a decrease of the IG'/IG
intensity ratio together with narrowing up to 0.10 mol L-1, whereas it remained nearly
stable at higher HNO3 concentrations. This evolution complies favorably with the TPD
results, where a faster increment of both the CO and CO2 amounts was observed
above 0.10 mol L-1 HNO3. This dependence can be accordingly accounted for the
decrease of the amorphous carbon content at relatively low HNO3 concentrations
(0.10 mol L-1), similar to NTX3, while the excessive production of oxygen surface
groups appears to take over at higher HNO3 concentrations.
To further investigate the extent of amorphous carbon generation and the thermal
stability of oxygen surface groups on the oxidized MWCNTs, the hydrothermally

114
treated NTX3 and NC3100 samples at the highest HNO3 concentration (0.30 mol L-1)
and the boiling acid NTX3 (7.0 mol L-1) samples were subjected to successive
isothermal oxidations at 623 and 673 K in air. Mild oxidative treatment at 623-673 K
in air is expected to oxidize amorphous carbon and CCFs from CNTs without affecting
drastically oxygen groups such as carboxylic anhydrides and those released as CO
that decompose at higher temperatures (Figure 5.1), and thus provide an
independent probe of their modified surface chemistry upon HNO3 oxidation [2].
Figure 5.10 compares the corresponding Raman spectra of the thermally treated
NTX3 samples at 514.5 nm.
Figure 5.10 - Raman spectra of the boiling (7.0 mol L-1)
and hydrothermally (0.3 mol L-1) acid treated NTX3 MWCNTs
under isothermal oxidation at 623 and 673 K.
1000 1200 1400 1600 2400 2800 3200
1000 1200 1400 1600 2400 2800 3200
514.5 nm
D+D'
0.30 M NTX3
350 oC
400 oC
Norm
aliz
ed
In
ten
sity
Raman shift (cm-1)
D
G
D'
G'
2G
Boiling 7.0 M NTX3
350 oC
400 oC
D
G
D'G'
D+D'
2G
514.5 nm
623 K673 K
623 K673 K

Part III - Modification of CNTs surface chemistry
115
The Raman spectra of the hydrothermally functionalized 0.30 mol L-1 NTX3 MWCNTs
showed rather small changes upon isothermal oxidation, the most notable variation
being the decrease of ID/IG by ca. 5%, which can be mainly related to the moderate
removal of acidic groups released as CO2 rather than amorphous carbon [35], since
the relative intensity of the D3 and D4 Raman bands was hardly affected. On the
other hand, the Raman spectra of the boiling acid treated NTX3 exhibited appreciable
changes upon thermal oxidation demonstrating clearly the counter acting effects of
hydrothermal and boiling acid treatment on the MWCNT surface chemistry. In that
case, thermal oxidation led to the progressive narrowing and decrease of the relative
intensity of the defect activated D, D', and D + D' modes reaching 20% at 673 K,
together with an even higher reduction of the ID3/IG and ID4/IG intensity ratios (40% at
673 K) due to the decrease of the amorphous carbon content. In addition, the G' band
gradually narrowed (the FWHM decreased from 102 to 85 cm-1 at 673 K) and its
intensity ratio was greatly enhanced upon increasing the isothermal annealing
temperature, resembling closely the effect of hydrothermal treatment with the
increase of HNO3 concentration on the NTX3 MWCNTs.
These results confirm the beneficial effects of hydrothermal HNO3 treatment that
outperforms the harsh boiling acid oxidation by generating controlled amounts of
oxygen groups on the CNTs, while partially removing amorphous carbon fragments
from the surface of MWCNTs. The efficiency and the mild oxidative conditions
underlying hydrothermal treatment were further corroborated by the isothermal
oxidation experiments on the heavily functionalized 0.30 mol L-1 NC3100
characterized also by the highest degree of graphitization. Despite the large amounts
of oxygen functionalities, the Raman spectra of the thin NC3100 MWCNTs exhibited
the least sensitivity to thermal oxidation (see Figure A.3 in Appendix A), where minor
changes of the D, D', and D + D' modes could be traced. The lowest amount of
amorphous carbon/CCFs that could be thermally exfoliated from the MWCNTs’
surface was observed for the NC3100 MWCNT. This further emphasizes that apart
from the CNT morphological characteristics (diameter and length) the inherent
structural properties and purity of the starting MWCNT materials are critical factors
for the efficiency of the functionalization process and the nature of surface groups
introduced on the nanotube surface under hydrothermal oxidation.

116
5.1.4 Pore structure analysis
The N2 adsorption-desorption isotherms of the pristine and hydrothermally treated
MWCNTs at different HNO3 concentrations were assessed and the results for the
NTX3 samples are presented in Figure 5.11.
Figure 5.11 – Adsorption-desorption N2 isotherms at 77 K of the pristine and
hydrothermally functionalized NTX3 MWCNTs at different HNO3 concentrations (left
to right: 0, 0.05, 0.10, 0.20 and 0.30 mol L-1 HNO3).
The N2 adsorption isotherms for the NTX3 series are of type II and exhibit a steep
increase of adsorption close to the saturation pressure, indicative of pore
condensation into large meso and macropores without completely filling the pore
volume of the material, precluding the accurate determination of the total pore
volume. Smaller pristine and treated NC3100 samples present typical type IV
isotherms (not shown), with hysteresis at high p/p0, in agreement with previous
results [34]. Moreover, while the shapes of the NTX3 isotherms remained practically
the same at high p/p0, the total pore volume values, Vtot, (determined from the N2
uptake at p/p0 = 0.99) increased appreciably with HNO3 treatment (Table 5.2). The
mesopore structure of the samples is closely associated with the pore space between
the CNTs, i.e. the bundle free space. This behavior points to an inefficient re-packing
of the nanotubes during acid treatment, which can be attributed to the large size
(mainly length) of NTX3 MWCNTs, in contrast to what was observed for the smaller
NC3100 samples as significant pore volume is lost (from 2.9 for the pristine MWCNTs
to 1.1 ml g-1 for the material treated with 0.30 mol L-1 HNO3), pointing to a more
efficient arrangement of the nanotube bundles upon hydrothermal treatment. The
BET surface areas, SBET, increased continuously with the increase of the HNO3

Part III - Modification of CNTs surface chemistry
117
concentration, as shown in Figure 5.12. The values seem to approach asymptotically
a maximum, correlating with the evolution of the surface group’s concentration on the
hydrothermally treated MWCNTs (Figure 5.3).
Figure 5.12 - Normalized (with respect to pristine samples) BET surface areas of
the pristine and hydrothermally functionalized MWCNTs at different HNO3
concentrations.
A small increase in surface area (80 up to 102 m2/g for the pristine and 0.30 mol L-1
treated nanotubes, respectively) and micropore volume, Vmicro, was derived (Figure
5.12 and Table 5.2), both being significantly lower than for those of the NC3100
samples. This SBET and Vmicro increase may be attributed to progressive decrease of
the amorphous carbon content as well as the enhanced accessibility to the inner part
of the nanotubes by defect creation and/or the opening of the nanotube caps.
To delineate the underlying variations in the MWCNTs pore structure upon
hydrothermal oxidation, pore size analysis was performed by means of quenched
solid density functional theory (QSDFT) adsorption kernels up to a size of 50 nm.
Pure cylindrical models were thereby used, while the quenched solid variance of the
method was applied as it allows the study of heterogeneous surfaces [36].
Although this model is based on slit pore geometry, it was considered as the most
appropriate for the present case for the following reasons: (a) all experimental N2
adsorption isotherms at 77 K reveal hysteresis loops of H3 type [37], which is typical
for layered materials/slit pore geometries, (b) in contrast to all other NonLocal Density
Functional Theory (NLDFT) or Grand Canonical Monte Carlo (GCMC) models that
1
1.1
1.2
1.3
1.4
1.5
1.6
0 0.1 0.2 0.3 0.4
Norm
aliz
ed S
BE
T
HNO3 concentration (mol L-1)
NTX3
NC3100

118
assume structureless homogeneous graphitic pore walls, the QSDFT method takes
into account the effects of surface heterogeneity, which is typical for our
functionalized samples, and (c) the QSDFT method eliminates artificial gaps and
minimizes artificial peaks in the PSDs, a typical problem encountered in NLDFT
calculations.
Table 5.2 - BET surface areas, SBET, DFT micropore volume, Vmicro and pore volume
at p/p0 = 0.99, designated as V *, for the pristine and hydrothermally treated NTX3
samples [38].
[HNO3] (mol L-1) SBET (m2 g-1) Vmicro (cm3 g-1) V * (cm3 g-1)
0- pristine 80 0.029 0.9
0.05 90 0.034 1.0
0.10 95 0.036 1.1
0.20 98 0.037 1.1
0.30 102 0.039 1.3
The pertinent pore size distributions (PSDs) for NTX3 samples are presented in
Figure 5.13 showing rather small pores at the limit of micropore sizes (around 2 nm).
As in the case of NC3100, these pores become more and more accessible to fluid
molecules through defects created upon hydrothermal treatment. Beyond this size
there is practically a continuum of different mesopores (e.g. local peaks at 5 and
10 nm) indicative of the rather random nature of the NTX3 texture in the mesoscale.
In the case of NC3100 group, the PSDs revealed a systematic and more significant
enhancement of the small mesopore peaks (3-6 nm) centered around 4 nm, arising
from the inner part of the nanotubes, with increasing HNO3 concentration. Moreover,
the 0.30 mol L-1 treated sample revealed a slight decrease of the 4 nm pore volume
coupled with a stronger sign of microporosity. Such a feature may be related to the
partial deterioration of the CNT structure and the development of amorphous (or low
crystallinity) areas in a way that part of the inner nanotube space is narrowed, since
the original structure is smaller and thinner than that of the NTX3. Much larger pores
(>40 nm) are observed for the pristine NTX3 MWCNTs and their size decreased to
ca. 32 nm for the treated samples, while the strongest treatment (0.30 mol L-1)
resulted in a pore size peak at 24 nm. It may be thus concluded that the main

Part III - Modification of CNTs surface chemistry
119
structural effect of hydrothermal treatment on the NTX3 nanotubes is a minimal
disentaglement, together with a small re-organization of the tubes (since the mean
pore size of large pores is slightly reduced).
Figure 5.13 - QSDFT pore size distributions of pristine and hydrothermally
functionalized NTX3 MWCNTs at different HNO3 concentrations.
Due to original structural differences, the pore sizes of NC3100 were centered at 33,
27, 24 and 18 nm for the pristine, 0.05, 0.10 and 0.20 mol L-1 treated samples,
respectively, while no further significant reduction (in volume and size) was observed
for the sample treated with 0.30 mol L-1 HNO3. This trend can be attributed to the
oxygen surface groups that can increase the attractive forces between individual
nanotubes, e.g. through H-bonding.
5.2 Conclusions
Nitric acid hydrothermal oxidation is demonstrated as a controlled and highly efficient
functionalization process for CCVD grown MWCNTs under mild acidic conditions.
Analytical investigations by TPD-MS and TGA-DSC have shown that HNO3
hydrothermal treatment results in the progressive generation of distinct oxygen
2 4 6 8 20 40 60
0.00
0.01
0.01
0.02
0.02
0.03
1 10 100
dV
(d) (c
m3
ST
P/n
m/g
)
diameter (nm)
pristine
0.05M
0.1M
0.2M
0.3M

120
functional groups on the MWCNT surface, controlled by the nitric acid concentration.
The amount and thermal stability of oxygen functionalities was further found to be
primarily determined by the MWCNTs morphology (diameter and length), as well as
by the crystallinity and purity of the pristine materials. Furthermore, Raman
spectroscopy revealed a progressive intensity reduction along with a shift and
narrowing of the defect activated MWCNT Raman bands accompanied by the
gradual enhancement of the graphitic G' (2D) band, indicative of the oxidation of the
highly reactive external carbon layers on the surface of hydrothermally treated
MWCNTs with increasing the HNO3 concentration. This behavior was contrasted with
the enhanced amorphous carbon generation obtained upon comparative processing
of the CCVD MWCNTs with the boiling acid oxidation method that produced
comparable amounts of oxygen functionalities, while consuming higher amounts of
oxidizing agent.
Pore structure analysis of the functionalized MWCNTs revealed that upon
hydrothermal treatment, the inner part of the nanotubes becomes progressively more
accessible to fluid molecules, leading to the increase of surface area (also micropore
volume, which remains rather low for all the samples). In the case of the short and
thin MWCNTs (NC3100) hydrothermal oxidation additionally triggered a
disentanglement followed by more efficient reorganization of the nanotube bundles,
shifting thus the mean pore size from the macro to the mesopore areas. This behavior
was considerably lessened for the long MWCNTs (NTX3), where the most
pronounced effect of hydrothermal oxidation involved a small increase of the total
pore volume. Nitric acid hydrothermal treatment is accordingly proposed as an
effective mild functionalization process that affords the controlled modification of the
MWCNTs’ surface chemistry with significant amounts of oxygen functional groups,
while removing the amorphous carbon from the CCVD MWCNT surface, a major
drawback of conventional liquid phase oxidation methods.
The main global conclusions following the studies over SWCNTs and MWCNTs with
relation to the hydrothermal and boiling acid methods are:
(i) CNTs morphology and especially the MWCNT’s diameter and length and the
concomitant variation of the surface area, dictate to a large extent the degree of
surface functionalization.
(ii) MWCNTs structures present higher stability to nitric acid oxidation when
compared to SWCNTs.
Part III - Modification of CNTs surface chemistry
121
(iii) Under similar conditions, the evolution of acidic groups, namely carboxylic acids,
is favored on the surface of MWCNTs structures rather than on SWCNTs, in a greater
extent for smaller and thinner tubes.
(iv) Due to the higher temperatures applied on the hydrothermal oxidation
methodology, more acidic groups are effectively anchored on MWCNTs surface
through the boiling nitric acid route, since at those higher temperatures (473 K) a
fraction of these functionalities can be released out of the CNT’s surface.
(v) Despite comparable amounts of oxygen functional groups, MWCNTs show higher
thermal stability when treated under boiling nitric acid conditions comparing with the
analog samples hydrothermally oxidized.
(vi) Boiling acid methods require greater amounts of oxidizing agents but can produce
high amounts of oxidized CNTs without need of applying higher temperature and
pressure, which also implies higher costs. Simultaneously, hydrothermal oxidation is
a consistent tool for such pre-treatments where the amount and type of groups
needed are previously known and required for specific applications.
5.3 Experimental section
Pristine MWCNTs of large diameter (25-40 nm) produced by CCVD were purchased
from Nanothinx S.A. with purity of 98.35% and length >10 µm, designated with the
product code NTX3. For comparison purposes, in order to get some information about
the influence of the CNTs structural properties on their functionalization, the results
were compared with those obtained in our group with thin MWCNTs purchased from
NANOCYLTM, designated as NC3100, which were oxidized under similar conditions
[39]. These MWCNTs are produced via the CCVD process with average diameter
and length of 9.5 nm and 1.5 µm, respectively, and purity greater than 95%.
5.3.1 Multi-Walled Carbon Nanotubes functionalization
The NTX3 CNTs (0.2 g) were hydrothermally oxidized immersed in a HNO3 solution
at different concentrations (0 - blank experiment, 0.05, 0.1, 0.2, 0.3 mol L-1) inside a
pressurized vessel at the temperature of 473 K. HNO3 oxidation was also performed
by direct contact of the MWCNTs with the acid solution at boiling temperature, as it
is a commonly used methodology to modify CNTs surface. The CNTs (0.5 g) were
immersed in 7.0 mol L-1 HNO3 solutions during 3 h. The detailed procedure for both

122
oxidation methods is described in Sections 2.1.1 and 2.1.2 of Chapter 2. Conditions
at which the NC3100 CNTs were oxidized are described elsewhere [39].
5.3.2 Multi-Walled Carbon Nanotubes characterization
The surface chemistry of the MWCNTs was quantified in terms of oxygen
functionalities by deconvolution of the CO and CO2 profiles obtained by temperature
programmed desorption (TPD) coupled with mass spectrometry (MS).
Other analytical techniques were performed in cooperation with the Institute of
Advanced Materials, NCSR Demokritos, Greece.
The specific surface area (SBET) of the materials was determined through N2
adsorption-desorption isotherms, the total pore volume and the micropore volume,
Vmicro, performed by means of QSDFT.
Thermogravimetric analysis (TGA) with simultaneous differential scanning
calorimetry (DSC) was conducted to evaluate the effect of hydrothermal oxidation on
thermal stability and physical transformations on MWCNTs.
Structural morphologic changes at molecular level were assessed by Raman
measurements at two different excitation wavelengths in the near infrared (785 nm)
and visible range (514.5 nm) by evaluating the evolution of the graphite and defect
Raman modes against the different oxidizing conditions tested.
Detailed description of the conditions applied in all the above mentioned analytical
techniques are described in Chapter 3.
5.4 References
[1] Marques RRN, Machado BF, Faria JL, Silva AMT. Controlled generation of
oxygen functionalities on the surface of Single-Walled Carbon Nanotubes by HNO3
hydrothermal oxidation. Carbon. 2010; 48 (5):1515-23.
[2] Romanos GE, Likodimos V, Marques RRN, Steriotis TA, Papageorgiou SK,
Faria JL, et al. Controlling and Quantifying Oxygen Functionalities on Hydrothermally
and Thermally Treated Single-Wall Carbon Nanotubes. J Phys Chem C. 2011; 115
(17):8534-46.

Part III - Modification of CNTs surface chemistry
123
[3] Silva AMT, Machado BF, Figueiredo JL, Faria JL. Controlling the surface
chemistry of carbon xerogels using HNO3-hydrothermal oxidation. Carbon. 2009; 47
(7):1670-9.
[4] Figueiredo JL, Pereira MFR, Freitas MMA, Órfão JJM. Modification of the
surface chemistry of activated carbons. Carbon. 1999; 37 (9):1379-89.
[5] Figueiredo JL, Pereira MFR, Freitas MMA, Órfão JJM. Characterization of
Active Sites on Carbon Catalysts. Ind Eng Chem Res. 2007; 46 (12):4110-5.
[6] Gerber I, Oubenali M, Bacsa R, Durand J, Gonçalves A, Pereira MFR, et al.
Theoretical and Experimental Studies on the Carbon-Nanotube Surface Oxidation by
Nitric Acid: Interplay between Functionalization and Vacancy Enlargement. Chem-
Eur J. 2011; 17 (41):11467-77.
[7] Zhang J, Zou H, Qing Q, Yang Y, Li Q, Liu Z, et al. Effect of Chemical
Oxidation on the Structure of Single-Walled Carbon Nanotubes. J Phys Chem B.
2003; 107 (16):3712-8.
[8] Ros TG, van Dillen AJ, Geus JW, Koningsberger DC. Surface Oxidation of
Carbon Nanofibres. Chem-Eur J. 2002; 8 (5):1151-62.
[9] Yang D-Q, Rochette J-F, Sacher E. Functionalization of Multiwalled Carbon
Nanotubes by Mild Aqueous Sonication. J Phys Chem B. 2005; 109 (16):7788-94.
[10] Yang C-M, Park JS, An KH, Lim SC, Seo K, Kim B, et al. Selective Removal
of Metallic Single-Walled Carbon Nanotubes with Small Diameters by Using Nitric
and Sulfuric Acids. J Phys Chem B. 2005; 109 (41):19242-8.
[11] Yu H, Jin Y, Peng F, Wang H, Yang J. Kinetically Controlled Side-Wall
Functionalization of Carbon Nanotubes by Nitric Acid Oxidation. J Phys Chem C.
2008; 112 (17):6758-63.
[12] Worsley KA, Kalinina I, Bekyarova E, Haddon RC. Functionalization and
Dissolution of Nitric Acid Treated Single-Walled Carbon Nanotubes. J Am Chem Soc.
2009; 131 (50):18153-8.
[13] Price BK, Lomeda JR, Tour JM. Aggressively Oxidized Ultra-Short Single-
Walled Carbon Nanotubes Having Oxidized Sidewalls. Chem Mater. 2009; 21
(17):3917-23.
[14] Del Canto E, Flavin K, Movia D, Navio C, Bittencourt C, Giordani S. Critical
Investigation of Defect Site Functionalization on Single-Walled Carbon Nanotubes.
Chem Mater. 2010; 23 (1):67-74.

124
[15] Santangelo S, Messina G, Faggio G, Lanza M, Milone C. Evaluation of
crystalline perfection degree of multi-walled carbon nanotubes: correlations between
thermal kinetic analysis and micro-Raman spectroscopy. J Raman Spectrosc. 2011;
42 (4):593-602.
[16] Singh DK, Iyer PK, Giri PK. Diameter dependence of oxidative stability in
multiwalled carbon nanotubes: Role of defects and effect of vacuum annealing. J
Appl Phys. 2010; 108 (8):084313.
[17] Lehman JH, Terrones M, Mansfield E, Hurst KE, Meunier V. Evaluating the
characteristics of multiwall carbon nanotubes. Carbon. 2011; 49 (8):2581-602.
[18] Pimenta MA, Dresselhaus G, Dresselhaus MS, Cancado LG, Jorio A, Saito
R. Studying disorder in graphite-based systems by Raman spectroscopy. Phys Chem
Chem Phys. 2007; 9 (11):1276-90.
[19] Delhaes P, Couzi M, Trinquecoste M, Dentzer J, Hamidou H, Vix-Guterl C. A
comparison between Raman spectroscopy and surface characterizations of multiwall
carbon nanotubes. Carbon. 2006; 44 (14):3005-13.
[20] Fantini C, Pimenta MA, Strano MS. Two-Phonon Combination Raman Modes
in Covalently Functionalized Single-Wall Carbon Nanotubes. J Phys Chem C. 2008;
112 (34):13150-5.
[21] Cuesta A, Dhamelincourt P, Laureyns J, Martínez-Alonso A, Tascón JMD.
Raman microprobe studies on carbon materials. Carbon. 1994; 32 (8):1523-32.
[22] Jawhari T, Roid A, Casado J. Raman spectroscopic characterization of some
commercially available carbon black materials. Carbon. 1995; 33 (11):1561-5.
[23] Dippel B, Jander H, Heintzenberg J. NIR FT Raman spectroscopic study of
flame soot. Phys Chem Chem Phys. 1999; 1 (20):4707-12.
[24] Sadezky A, Muckenhuber H, Grothe H, Niessner R, Pöschl U. Raman
microspectroscopy of soot and related carbonaceous materials: Spectral analysis
and structural information. Carbon. 2005; 43 (8):1731-42.
[25] Ivleva NP, Messerer A, Yang X, Niessner R, Pöschl U. Raman
Microspectroscopic Analysis of Changes in the Chemical Structure and Reactivity of
Soot in a Diesel Exhaust Aftertreatment Model System. Environ Sci Technol. 2007;
41 (10):3702-7.

Part III - Modification of CNTs surface chemistry
125
[26] Vallerot J-M, Bourrat X, Mouchon A, Chollon G. Quantitative structural and
textural assessment of laminar pyrocarbons through Raman spectroscopy, electron
diffraction and few other techniques. Carbon. 2006; 44 (9):1833-44.
[27] Frank B, Rinaldi A, Blume R, Schlögl R, Su DS. Oxidation Stability of
Multiwalled Carbon Nanotubes for Catalytic Applications. Chem Mater. 2010; 22
(15):4462-70.
[28] Rinaldi A, Frank B, Su DS, Hamid SBA, Schlögl R. Facile Removal of
Amorphous Carbon from Carbon Nanotubes by Sonication. Chem Mater. 2011; 23
(4):926-8.
[29] Shimada T, Sugai T, Fantini C, Souza M, Cançado LG, Jorio A, et al. Origin
of the 2450 cm−1 Raman bands in HOPG, single-wall and double-wall carbon
nanotubes. Carbon. 2005; 43 (5):1049-54.
[30] Thomsen C. Second-order Raman spectra of single and multiwalled carbon
nanotubes. Phys Rev B. 2000; 61 (7):4542-4.
[31] Rosca ID, Watari F, Uo M, Akasaka T. Oxidation of multiwalled carbon
nanotubes by nitric acid. Carbon. 2005; 43 (15):3124-31.
[32] Osswald S, Havel M, Gogotsi Y. Monitoring oxidation of multiwalled carbon
nanotubes by Raman spectroscopy. J Raman Spectrosc. 2007; 38 (6):728-36.
[33] Koh AL, Gidcumb E, Zhou O, Sinclair R. Observations of Carbon Nanotube
Oxidation in an Aberration-Corrected Environmental Transmission Electron
Microscope. ACS Nano. 2013; 7 (3):2566-72.
[34] Tessonnier J-P, Rosenthal D, Hansen TW, Hess C, Schuster ME, Blume R,
et al. Analysis of the structure and chemical properties of some commercial carbon
nanostructures. Carbon. 2009; 47 (7):1779-98.
[35] Behler K, Osswald S, Ye H, Dimovski S, Gogotsi Y. Effect of thermal
treatment on the structure of multi-walled carbon nanotubes. J Nanopart Res. 2006;
8 (5):615-25.
[36] Neimark AV, Lin Y, Ravikovitch PI, Thommes M. Quenched solid density
functional theory and pore size analysis of micro-mesoporous carbons. Carbon.
2009; 47 (7):1617-28.
[37] Sing KSW, Everett DH, Haul RAW, Moscou L, Pierotti RA, Rouquerol J, et
al. Reporting physisorption data for gas/solid systems with special reference to the

126
determination of surface area and porosity (Recommendations 1984). Pure Appl
Chem. 1985; 57 (4):603-19.
[38] Gregg SJ, Sing KSW. Adsorption, Surface Area and Porosity. New York:
Academic Press; 1982.
[39] Likodimos V, Steriotis TA, Papageorgiou SK, Romanos GE, Marques RRN,
Rocha RP, et al. Controlled surface functionalization of multiwall carbon nanotubes
by HNO3 hydrothermal oxidation. Carbon. 2014; 69:311-26.


Part IV
TiO2/CNT composites


6 TiO2/CNT composites for photocatalytic degradation of
caffeine aqueous solutions
Photocatalytic degradation of caffeine: Developing solutions for
emerging pollutants4
The photocatalytic degradation of the psychoactive substance caffeine was studied
by testing composites prepared with MWCNTs and three different TiO2 materials: one
synthesized by a modified sol-gel method and two commercial others obtained from
Evonik Degussa Corporation (P25) and Sigma-Aldrich. These materials were
characterized by several techniques (DRIFT, XRD, N2 adsorption-desorption
isotherms, TEM, SEM). The tested materials increased the caffeine degradation rate
in comparison to the pure photochemical regime. The oxygen groups created by acid
treatment on the surface of the carbon nanotubes were crucial for the photocatalytic
activity of all prepared composites. In addition, the photocatalytic activity of TiO2 from
Sigma-Aldrich markedly increased with the addition of functionalized carbon
nanotubes, which seems to be related with the larger TiO2 crystallite sizes and the
better contact of these TiO2 particles with carbon nanotubes. The activity of the
semiconductor TiO2 could be enhanced by taking advantage of the CNTs properties,
in particular those with surface oxygen functionalities previously created by HNO3
oxidation. Radicals and holes scavengers were applied to give some information
about the photocatalytic reaction mechanism under near-UV/Vis irradiation, unveiling
that free radicals produced by photo-excited electrons seem to be responsible for the
higher activity observed for composites prepared with functionalized carbon
nanotubes and TiO2 from Sigma-Aldrich in comparison to bare TiO2. Films prepared
with these composites revealed higher photocatalytic activity than films of the pure
TiO2 benchmark P25.
4 Marques, R.R.N., Sampaio, M.J., Carrapiço, P.M., Silva, C.G., Morales-Torres, S., Dražić, G., Faria, J.L., Silva, A.M.T. (2013) Photocatalytic degradation of caffeine: Developing solutions for emerging pollutants, Catalysis Today, 209, 108-115.


Part IV - TiO2/CNT composites
133
6.1 Results and discussion
Several TiO2/CNT composites were prepared based on different TiO2 powders and
pristine or previously functionalized MWCNTs through HNO3 boiling oxidation and
characterized through complementary analytical techniques. Two commercial TiO2
materials were purchased to industrial companies, P25 (Evonik Degussa
Corporation) and SA (Sigma-Aldrich), and the third one was synthesized in our
laboratory by the sol-gel method (SG). The notation given to refer the composites is
of type XX/CNT-Y, where XX is the type of TiO2 used (SG, SA or P25) and Y is the
mass of CNTs per 100 mass units of bare TiO2. The notation CNTf stands for the
previously functionalized CNTs.
Catalysts photocatalytic activity was tested in suspensions on a photoimmersion
reactor, as described in Section 2.2.1, for the oxidative degradation of caffeine
aqueous solutions and selected materials were further tested in the form of films,
deposited on thin glass slides, using a different small cylindrical photo-reactor, with
experimental details in Section 2.2.2.
6.1.1 Materials characterization
6.1.1.1 Diffuse reflection infrared Fourier transformed (DRIFT)
The vibrational structure of the three different bare TiO2 materials (SG, P25 and SA)
is depicted by the DRIFT spectra in Figure 6.1.
Figure 6.1 - DRIFT spectra for bare TiO2 materials.

134
Table 6.1 – Pseudo-first order kinetic constants (k) and respective standard errors
for the photolytic and photocatalytic degradation of caffeine using different catalysts.
The regression coefficients (r2) are also presented.
Catalyst Scavenger k (10-3 min-1) r2
None none 0.36 ± 0.02 0.93
SG none 4.9 ± 0.1 0.995
SG/CNTf-5 none 6.5 ± 0.5 0.995
SG/CNT-10 none 2.83 ± 0.04 0.998
SG/CNTf-10 none 5.89 ± 0.09 0.998
SG/CNTf-20 none 4.2 ± 0.1 0.99
P25 none 123 ± 10 0.99
P25 EDTA 5.4 ± 0.2 0.993
P25 t-BuOH 36.0 ± 0.9 0.998
P25/CNTf-5 none 62 ± 4 0.9994
P25/CNT-10 none 50 ± 4 0.99
P25/CNTf-10 none 83 ± 3 0.998
P25/CNTf-20 none 76 ± 3 0.997
P25/CNTf-20 EDTA 2.95 ± 0.07 0.994
P25/CNTf-20 t-BuOH 12.3 ± 0.4 0.994
SA none 26 ± 2 0.99
SA EDTA 2.16 ± 0.07 0.99
SA t-BuOH 7.47 ± 0.05 0.9997
SA/CNTf-5 none 53 ± 6 0.98
SA/CNT-10 none 16.6 ± 0.4 0.997
SA/CNTf-10 none 63 ± 3 0.997
SA/CNTf-20 none 77 ± 3 0.998
SA/CNTf-20 EDTA 3.0 ± 0.2 0.95
SA/CNTf-20 t-BuOH 3.49 ± 0.04 0.998

Part IV - TiO2/CNT composites
135
The presence of coordinated water and Ti-OH bonds is confirmed in all materials by
the band at around 1680 cm-1 [1]. The strong peak at around 900-950 cm-1, common
to all spectra, is typical of TiO2 [2].
The broad band between 2500 and 3750 cm-1 is usually attributed to the stretching
vibrations of hydrogen-bonded surface water molecules, adsorbed at face (1 0 1) of
TiO2 crystals, and to hydroxyl groups located close to each other [1-3]. This broad
band is more intense for SG than for P25 and SA. It can be also observed a very
small shoulder at around 3700 cm-1 that has been attributed to surface defects and
isolated hydroxyl groups present on the face (0 0 1) [3]. These hydroxyl groups can
interact with the oxygen surface groups of carbon nanotubes (e.g. carboxylic groups),
creating Ti-O-C bonds in TiO2/CNT composites.
6.1.1.2 X-ray diffraction (XRD)
XRD spectra for bare TiO2 and respective composites are shown in Figure 6.2. The
2 diffraction peaks at ca. 25.3°, 37.7°, 48.0° and 54.0° (marked as A in the XRD
spectra) correspond to anatase crystalline phase. The major characteristic peak of
rutile crystalline phase that appears at 27.4° (marked as R in the XRD spectra) is only
detected for P25, as expected.
Figure 6.2 - XRD spectra for bare and respective
TiO2/CNT (XX/CNTf-20) composites.
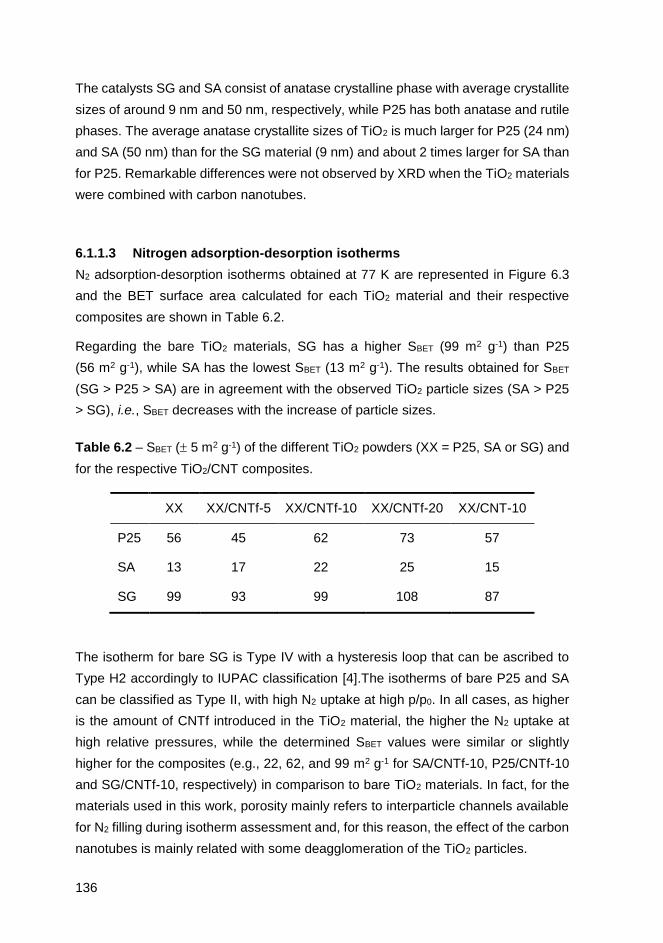
136
The catalysts SG and SA consist of anatase crystalline phase with average crystallite
sizes of around 9 nm and 50 nm, respectively, while P25 has both anatase and rutile
phases. The average anatase crystallite sizes of TiO2 is much larger for P25 (24 nm)
and SA (50 nm) than for the SG material (9 nm) and about 2 times larger for SA than
for P25. Remarkable differences were not observed by XRD when the TiO2 materials
were combined with carbon nanotubes.
6.1.1.3 Nitrogen adsorption-desorption isotherms
N2 adsorption-desorption isotherms obtained at 77 K are represented in Figure 6.3
and the BET surface area calculated for each TiO2 material and their respective
composites are shown in Table 6.2.
Regarding the bare TiO2 materials, SG has a higher SBET (99 m2 g-1) than P25
(56 m2 g-1), while SA has the lowest SBET (13 m2 g-1). The results obtained for SBET
(SG > P25 > SA) are in agreement with the observed TiO2 particle sizes (SA > P25
> SG), i.e., SBET decreases with the increase of particle sizes.
Table 6.2 – SBET ( 5 m2 g-1) of the different TiO2 powders (XX = P25, SA or SG) and
for the respective TiO2/CNT composites.
XX XX/CNTf-5 XX/CNTf-10 XX/CNTf-20 XX/CNT-10
P25 56 45 62 73 57
SA 13 17 22 25 15
SG 99 93 99 108 87
The isotherm for bare SG is Type IV with a hysteresis loop that can be ascribed to
Type H2 accordingly to IUPAC classification [4].The isotherms of bare P25 and SA
can be classified as Type II, with high N2 uptake at high p/p0. In all cases, as higher
is the amount of CNTf introduced in the TiO2 material, the higher the N2 uptake at
high relative pressures, while the determined SBET values were similar or slightly
higher for the composites (e.g., 22, 62, and 99 m2 g-1 for SA/CNTf-10, P25/CNTf-10
and SG/CNTf-10, respectively) in comparison to bare TiO2 materials. In fact, for the
materials used in this work, porosity mainly refers to interparticle channels available
for N2 filling during isotherm assessment and, for this reason, the effect of the carbon
nanotubes is mainly related with some deagglomeration of the TiO2 particles.

Part IV - TiO2/CNT composites
137
Figure 6.3 - N2 adsorption-desorption isotherms for bare and respective TiO2/CNT
(XX/CNTf-20) composites.
As expected, introduction of the carbon phase on the TiO2 matrix promoted the
dispersion of the small nanoparticles, increasing the surface area in proportion with
the CNT loading on the corresponding composites. It is relevant to note that there
was no increase on the SBET when the composites were prepared with
non-functionalized CNTs. When functionalized CNTs were used the increase on the
surface area for the same CNT loading was notorious, in particular for P25 and SA,
where the measured increase was of 10 and 70%, respectively. It reinforces the
relevance of a functionalization pre-treatment on the synthesis of TiO2/CNT
composites.
6.1.1.4 Electron microscopy
The representative SEM images of bare TiO2 materials are shown in Figure 6.4 (a-c)
for SG, P25 and SA and the corresponding arrangement with carbon nanotubes can
be observed in Figure 6.4 (d-f). SG materials significantly differ from P25 and SA
samples. TiO2 crystallites are very small in the SG material (as determined by XRD)
and seem to be strongly aggregated forming very large clusters of TiO2 particles
(Figure 6.4 a and 6.4 d), in contrast with materials prepared with P25 (Figure 6.4 b
and 6.4 e) and SA (Figure 6.4 c and 6.4 f) which have higher crystallite sizes, due to
the different routes of fabrication and, as consequence, resulting in different
arrangements with carbon nanotubes. Therefore, TiO2 crystallite sizes have a strong
influence on the way as TiO2 and carbon nanotubes are distributed in the composite.
For the SG/CNTf-20 material (Figure 6.4 d) the contact between TiO2 and carbon
nanotubes is not as good as that obtained in P25/CNTf-20 (Figure 6.4 e) or in
SA/CNTf-20 (Figure 6.4 f). For P25/CNTf-20 and SA/CNTf-20, carbon nanotubes
seem to uniformly turn around TiO2 particles, an indication of good assembling.
0 10
30
60
90
120
150
180
0 1 0 1 0 1
Vads (cm
3 g
-1,
ST
P)
SG
SG
/CN
Tf-
5
SG
/CN
Tf-
10
SG
/CN
Tf-
20
p/p0
p/p0
0 10
100
200
300
400
0 1 0 1 0 1
P25
P2
5/C
NT
f-1
0
P25/C
NT
f-5
P25/C
NT
f-20
p/p0
0 10
30
60
90
120
150
180
0 1 0 1 0 1
Vads (cm
3 g
-1,
ST
P)
SA
SA
/CN
Tf-
5
SA
/CN
Tf-
10
SA
/CN
Tf-
20
p/p0
p/p0

138
TEM micrographs of SG/CNTf-20, P25/CNTf-20 and SA/CNTf-20 are shown in
Figure 6.4 (g-i), respectively. These images reinforce the previous observations
made by SEM. SG crystallites synthesized through the sol-gel method (ca. 9 nm as
determined by XRD) form big aggregates (a TiO2 aggregate of 500 nm in size is
shown in Figure 6.4 g), in this case the interaction between the TiO2 crystallites and
carbon nanotubes being weaker than in P25/CNTf-20 (Figure 6.4 h) or in SA/CNTf-20
(Figure 6.4 i).
Figure 6.4 - (a-f) SEM and (g-i) TEM micrographs of bare TiO2 materials and
TiO2/CNT composites.
Therefore, Figure 6.4 (d-i) show that particles distribution in TiO2/CNT composites is
clearly different depending on TiO2 particle sizes. Among the prepared composites:
(i) SG particles have the worst distribution since they usually form big aggregates
with very weak interaction with the carbon phase; (ii) P25 based composites show a
good distribution of TiO2 particles along the walls of the carbon nanotubes; (iii) SA
(a) SG (b) P25 (c) SA
TiO2
CNT
TiO2
(d) SG/CNTf-20 (f) SA/CNTf-20 (e) P25/CNTf-20
(g) SG/CNTf-20 (h) P25/CNTf-20 (i) SA/CNTf-20

Part IV - TiO2/CNT composites
139
particles also show a good contact with the carbon nanotubes and these particles are
in some cases rolled up by the carbon nanotubes, as already observed in literature
for TiO2/CNT composites prepared with SA [5], due to their larger TiO2 particle sizes
(not observed for P25-based composites).
6.1.2 Photocatalytic experiments
As an emergent pollutant, caffeine was chosen to be the organic probe molecule for
photocatalytic studies. It is a psychoactive substance widely consumed either in
beverages or in pharmaceuticals and personal care products. It has been detected
in natural watercourses [6] over many different countries, being used as a chemical
marker for surface water pollution [7]. Caffeine is an antagonist of adenosine, thus its
chemistry is dominated by radical adduct formation in the presence of oxidative
radicals such as HO• [8]. Caffeine degradation studies are already reported in
literature using TiO2 and photo-Fenton approaches under solar conditions [9-12] and
TiO2 particles with magnetic properties modified with iron oxide under UV illumination
[13]. However, to our knowledge, the photocatalytic degradation of this pollutant by
using TiO2/CNT composites is here firstly reported.
In addition, exploratory experiments to assess the feasibility of using catalytic films
were performed with diphenhydramine (DP), another emerging pollutant which was
studied in our group [14]. DP is a first generation antihistamine drug mainly used in
the treatment of allergies as well as in many sleep aids which presents low
biodegradability and high toxicity with mutagenic and carcinogenic effects [15].
6.1.2.1 Photocatalytic activity of bare TiO2 materials in powder form
To ensure that the experimental results reflect caffeine disappearance in solution due
to oxidative photocatalytic degradation, instead of the effect of the incident radiation
on it, the absorption spectra of an organic aqueous solution (30 µM ~ 6 ppm) is
depicted in Figure 6.5 together with the resulting emission lines when using the
DURAN® 50 cut-off filter (see Section 2.2.1).
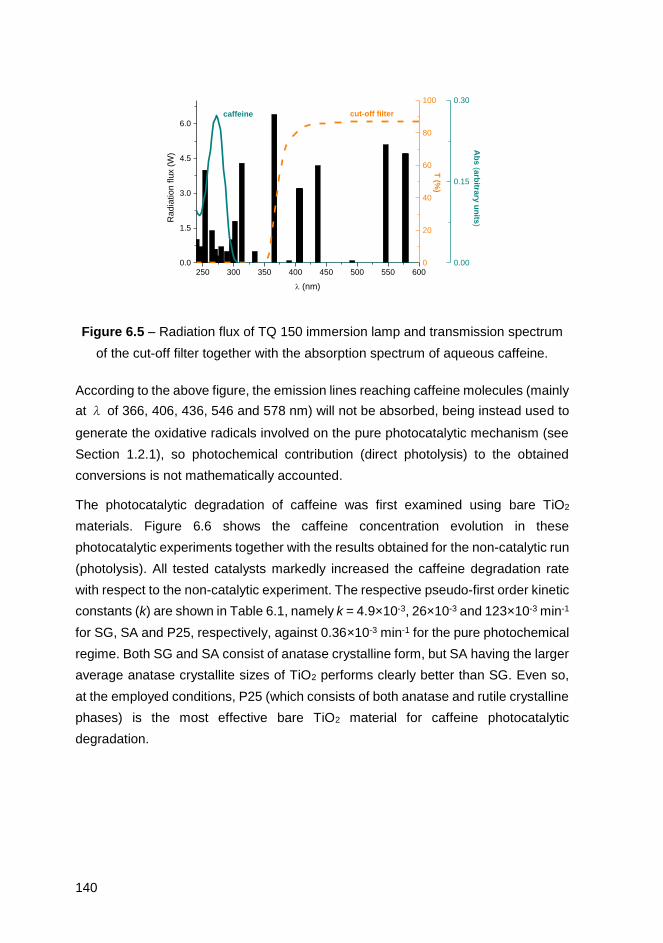
140
Figure 6.5 – Radiation flux of TQ 150 immersion lamp and transmission spectrum
of the cut-off filter together with the absorption spectrum of aqueous caffeine.
According to the above figure, the emission lines reaching caffeine molecules (mainly
at λ of 366, 406, 436, 546 and 578 nm) will not be absorbed, being instead used to
generate the oxidative radicals involved on the pure photocatalytic mechanism (see
Section 1.2.1), so photochemical contribution (direct photolysis) to the obtained
conversions is not mathematically accounted.
The photocatalytic degradation of caffeine was first examined using bare TiO2
materials. Figure 6.6 shows the caffeine concentration evolution in these
photocatalytic experiments together with the results obtained for the non-catalytic run
(photolysis). All tested catalysts markedly increased the caffeine degradation rate
with respect to the non-catalytic experiment. The respective pseudo-first order kinetic
constants (k) are shown in Table 6.1, namely k = 4.9×10⁻³, 26×10-3 and 123×10-3 min-1
for SG, SA and P25, respectively, against 0.36×10⁻³ min-1 for the pure photochemical
regime. Both SG and SA consist of anatase crystalline form, but SA having the larger
average anatase crystallite sizes of TiO2 performs clearly better than SG. Even so,
at the employed conditions, P25 (which consists of both anatase and rutile crystalline
phases) is the most effective bare TiO2 material for caffeine photocatalytic
degradation.
250 300 350 400 450 500 550 6000.0
1.5
3.0
4.5
6.0
0
20
40
60
80
100
T (%
)
Ra
dia
tio
n f
lux (
W)
(nm)
cut-off filtercaffeine
0.00
0.15
0.30
Ab
s (a
rbitra
ry u
nits
)

Part IV - TiO2/CNT composites
141
Figure 6.6 – Photolytic (blank) and photocatalytic degradation of caffeine over bare
TiO2 materials.
6.1.2.2 Photocatalytic activity of TiO2/CNT composites in powder form
Figure 6.7 a-d show the photo-degradation profiles obtained with the TiO2/CNT
composites and in Figure 6.8 are represented the caffeine conversions after 30 min
of irradiation. Figure 6.7 (a-c) show the caffeine concentration evolution in
photocatalytic experiments as function of the CNT:TiO2 ratio. It is possible to observe
that carbon nanotubes have negligible effect on the activity of the SG material (see
Figure 6.8), the pseudo-first order kinetic constants for SG-based materials being
always very low (5.55×10⁻³ ± 1.44×10⁻³ min-1 in Table 6.1). Regarding P25-based
materials, all have demonstrated to be very efficient on achieving high caffeine
conversions; however, when carbon nanotubes are combined with P25, a significant
decrease of the photocatalytic activity was always observed (see Figure 6.8), the
pseudo-first order kinetic constant decreasing from 123×10-3 min-1 for bare P25 to
under 83×10-3 min-1 for the respective composites, regardless the content of carbon
nanotubes (Table 6.1). In contrast, the positive effect of functionalized carbon
nanotubes on SA matrix is evident with the progressive increase on CNT loading as
shown in Figure 6.8, the photocatalytic activity of SA (k = 26×10-3 min-1) markedly
increasing with the addition of CNTf: SA/CNTf-5 (k = 53×10-3 min-1) < SA/CNTf-10 (k
= 63×10-3 min-1) < SA/CNTf-20 (k = 77×10-3 min-1).
Time (min)
0 30 60 90 120 150 180
C/C
0
0.0
0.2
0.4
0.6
0.8
1.0
Blank
SG
P25
SA
Model

142
Figure 6.7 – Photolytic (blank) and photocatalytic degradation of caffeine over (a)
XX/CNTf-5, (b) XX/CNTf-10, (c) XX/CNTf-20 and (d) XX/CNT-10 composites in
powder form.
The photocatalytic degradation of caffeine using composites prepared with
non-functionalized CNT (XX/CNT-10 in Figure 6.7 d) and functionalized CNT
(XX/CNTf-10 in Figure 6.7 b) show that the oxygen groups introduced on carbon
nanotubes play an important role in the catalytic activity of the prepared composites,
corroborating characterization results (see Figure 6.3), with caffeine conversion for
SA-based composites increasing from 23% (with pristine CNT) to 88% (with CNTf) in
30 min (see Figure 6.8), and the respective pseudo-first order kinetic constants from
16.6×10⁻³ to 63×10-3 min-1 (Table 6.1).
Time (min)
0 30 60 90 120 150 180
C/C
0
0.0
0.2
0.4
0.6
0.8
1.0
Blank
SG/CNTf-5
P25/CNTf-5
SA/CNTf-5
Model
(a)
Time (min)
0 30 60 90 120 150 180
C/C
0
0.0
0.2
0.4
0.6
0.8
1.0
Blank
SG/CNTf-10
P25/CNTf-10
SA/CNTf-10
Model
(b)
Time (min)
0 30 60 90 120 150 180
C/C
0
0.0
0.2
0.4
0.6
0.8
1.0
Blank
SG/CNTf-20
P25/CNTf-20
SA/CNTf-20
Model
(c)
Time (min)
0 30 60 90 120 150 180
C/C
0
0.0
0.2
0.4
0.6
0.8
1.0
Blank
SG/CNT-10
P25/CNT-10
SA/CNT-10
(d)

Part IV - TiO2/CNT composites
143
Figure 6.8 – Caffeine conversion after 30 min of irradiation, X caff, 30 min (%), for bare
TiO2 materials (XX = P25, SA, SG) and for the respective TiO2/CNT composites.
This marked enhancement on the photocatalytic activity was also observed for
P25-based composites (k = 50×10-3 and 83×10-3 min-1 for P25/CNT-10 and
P25/CNTf-10, respectively) and less notorious for SG-based composites (k =
2.83×10⁻³ and 5.89×10⁻³ min-1 for SG/CNT-10 and SG/CNTf-10, respectively), as
clearly shown in Figure 6.8. In fact, the applied nitric acid treatment introduces a
considerable amount of oxygen groups in the poor surface of the pristine carbon
nanotubes, which were identified by TPD analysis following a methodology described
elsewhere [16]. The total amount of oxygen containing groups released as CO and
CO2, was of 1066 µmol g-1 and 434 µmol g-1, respectively. The amount of phenols
(evolved as CO) is 803 µmol g-1 and the amount of carboxylic acids (evolved as CO2)
is 289 µmol g-1, which represent 55 and 20% of the total groups at the CNT surface,
respectively. The remaining 25% correspond to the contribution of carboxylic
anhydrides, carbonyl/quinones and lactones. Phenolic and carboxylic acid groups
promote the dispersion of TiO2 particles in TiO2/CNT composites and are also
expected for contributing to the formation of Ti-O-C bonds, as in esterification
reactions between the carboxylic acid groups of CNTs and the hydroxyl groups of
TiO2 (observed by DRIFT analysis) [14].
The pseudo-first order kinetic constants obtained for SA and for the respective
composites, including that prepared with non-functionalized CNT (SA/CNT-10) are
XX/CNT-10
XX/CNTf-2
0
XX/CNTf-1
0
XX/CNTf-5
XX
0
20
40
60
80
100
57
949
5
88
100
23
93
88
84
7
49
11
1514
P25
SA
X C
aff
, 3
0 m
in (
%)
Xca
ff,
30
min (
%)
SG
13

144
all represented in Figure 6.9, where the benefit of functionalized CNT on the
photocatalytic activity of SA-based materials becomes clear.
Figure 6.9 – Effect of CNT content on the pseudo-first order kinetic constant when
using SA/CNTf-Y composites and comparison with SA and SA/CNT-10 materials.
Curves represent the fitting of the pseudo-first order equation to the experimental
data.
In conclusion, the larger TiO2 crystallite sizes of SA lead to a good contact between
the anatase TiO2 particles and the carbon nanotubes, and the oxygen surface groups
in carbon nanotubes are crucial on the high activity of these composites.
6.1.2.3 Photocatalytic degradation pathway
The main oxidative routes of the photocatalytic process were discriminated by using
EDTA and t-BuOH, acting as scavengers for holes and radicals, respectively [17, 18].
Figure 6.10 a and b show the caffeine concentration evolution in these photocatalytic
experiments for the bare P25 and SA materials, respectively, and the corresponding
pseudo-first order kinetic constants are presented in Table 6.1.
These constants decrease for both SA (from 26×10-3 to 2.16×10⁻³ and 7.47×10⁻³ min-1
with EDTA and t-BuOH, respectively) and P25 (from 123×10-3 to 5.4×10⁻³ and
36.0×10⁻³ min-1 with EDTA and t-BuOH, respectively). Therefore, t-BuOH decreased
the pseudo-first order kinetic constants for both TiO2 materials, but the addition of
EDTA reduced in a higher extent the caffeine photo-degradation. Regarding the
wt.% CNT in SA/CNT composites
0 5 10 15 20
k (
min
-1)
0.01
0.03
0.05
0.07
0.09
functionalized CNT
non-functionalized CNT

Part IV - TiO2/CNT composites
145
TiO2/CNT composites, the pseudo-first order kinetic constant of SA/CNTf-20
decreased from 77×10-3 to 3.0×10⁻³ min-1 with EDTA and to 3.49×10⁻³ min-1 with
t-BuOH (Figure 6.10 d and Table 6.1), while for P25/CNTf-20 the observed decrease
was from 76×10-3 to 2.95×10⁻³ min-1 with EDTA and to 12.3×10⁻³ min-1 with t-BuOH
(Figure 6.10 c and Table 6.1).
Figure 6.10 – Effect of holes/radicals scavengers (EDTA/t-BuOH) on the
photocatalytic degradation of caffeine when using (a) P25, (b) SA, (c) P25/CNTf-20
and (d) SA/CNTf-20 as catalysts in powder form.
Therefore, photogenerated holes play a major role on this mechanism (both direct
oxidation and through formation of reactive radicals), but free radicals produced by
photoexcited electrons also participate in this mechanism and are particularly
important when comparing the results obtained with SA/CNTf-20 and bare SA, since
the reduction on the pseudo-first order kinetic constant with t-BuOH is more
pronounced for SA/CNTf-20 (95% - from 77×10-3 to 3.49×10⁻³ min-1) than for SA (71%
- from 26×10-3 min-1 to 7.47×10⁻³ min-1). From the results presented, carbon
nanotubes seem to have a positive effect on the photocatalytic activity of SA by
Time (min)
0 30 60 90 120 150 180
C/C
0
0.0
0.2
0.4
0.6
0.8
1.0
Blank
P25
P25 - EDTA
P25 - tBuOH
Model
(a)
Time (min)
0 30 60 90 120 150 180
C/C
0
0.0
0.2
0.4
0.6
0.8
1.0
Blank
SA
SA - EDTA
SA - tBuOH
Model
(b)
Time (min)
0 30 60 90 120 150 180
C/C
0
0.0
0.2
0.4
0.6
0.8
1.0
Blank
P25/CNTf-20
P25/CNTf-20 - EDTA
P25/CNTf-20 - tBuOH
Model
(c)
Time (min)
0 30 60 90 120 150 180
C/C
0
0.0
0.2
0.4
0.6
0.8
1.0
Blank
SA/CNTf-20
SA/CNTf-20 - EDTA
SA/CNTf-20 - tBuOH
Model
(d)

146
increasing the ability to produce free oxidative radicals generated by photoexcited
electrons.
6.1.2.4 Photocatalytic activity of TiO2/CNT composites in film form
The separation of nanometric catalyst powders from the treated water requires critical
separation steps that should be considered for the materials technological
implementation. The associated short and long term implications of nanomaterials on
the public health and environment are also a current major concern. Stabilization of
these nanomaterials over adequate substrates, for instance in the form of films, is a
possibility to overcome the drawback of the powders suspensions.
Given the results obtained with powder catalysts in suspension it was considered that
the most promising composite for further studies is the one based on SA TiO2 with
the highest load on functionalized CNT, SA/CNTf-20, since the synergy resulting from
the contact with the carbon phase was evident through characterization (see Figure
6.3 and Figure 6.4) and photocatalytic results (see Figure 6.8). Despite the
significantly faster kinetics for original P25 when compared to bare SA (k = 123×10-3
and 26×10-3 min-1, respectively, in Table 6.1), it is believed that the synergistic effects
between phases for composite materials can gain relevance when these are
supported in a substrate, since scattering effects and density properties cease to
have meaning during reaction with catalysts in film form.
For this reason a set of experiments was carried out with a film prepared with the
SA/CNTf-20 composite and the efficiency compared to that obtained with a film based
on the benchmark P25. The method used to prepare the films consisted in the doctor
blade technique, which is described in Section 6.3.3. The experimental conditions
were the same used previously for the studies with powder catalysts, regarding light
irradiation and the initial concentration of caffeine. More details on the experimental
procedure is given in Section 2.2.2 of Chapter 2. Figure 6.11 a shows that the film
made of SA/CNTf-20 has a significantly higher photocatalytic activity for caffeine
degradation than that prepared with P25 (k = 8.3 10-3 and 5.6 10-3 min-1,
respectively).
For comparison purposes, a few exploratory experiments to assess the feasibility of
using this type of films were also performed with diphenhydramine (DP). In line with
the caffeine results, the pollutant abatement was faster with the SA/CNTf-20 film than
with the one of P25 (12.0 10-3 and 7.0 10-3 min-1, respectively), as shown in Figure
6.11 b.

Part IV - TiO2/CNT composites
147
Figure 6.11 – Photocatalytic degradation of (a) caffeine and (b) diphenhydramine
over P25 and SA/CNTf-20 catalysts in the form of films. Curves represent the fitting
of the pseudo-first order equation to the experimental data.
Film characterization reveal a homogenous smooth and thin surface (ca. 3.75 µm)
for the composite SA/CNTf-20, as shown in Figure 6.12 a. As described elsewhere
[19], SA based films evidenced to be more homogeneous and thinner than P25 based
ones, with a good interphase interaction between carbon and the semiconducting SA
phase, most probably due to the larger nanoparticles (crystallite sizes SA 50 nm >
P25 24 nm), then promoting electronic transitions in the visible range (λ > 400 nm),
as shown in Figure 6.12 b.
Figure 6.12 – SEM image of SA/CNT-20 sectional cut of the film (a); diffuse
reflectance UV-Vis spectra of SA based films (b) and of the corresponding powder
substrate (SA*) [19].
Time (min)
0 30 60 90 120 150 180
C/C
0
0.0
0.2
0.4
0.6
0.8
1.0
BlankP25
SA/CNTf-20
Model
(a)
Time (min)
0 30 60 90 120 150 180
C/C
0
0.0
0.2
0.4
0.6
0.8
1.0
Blank
P25
SA/CNTf-20
Model
(b)
(a) (b)
148
In fact, the increase in materials absorption seems to be proportional to the CNT
loading and furthermore the absorption edge is shifted to higher wavelengths which
indicates a progressive decrease in the band gap energy for the composite materials,
in agreement with results for TiO2/CNT powders reported in literature [20-22].
The motivation on choosing this composite as the base to produce the films was
based on the activity of the bare SA TiO2 which takes advantage of the synergy with
the functionalized CNTs. It follows from the previous study with powder catalysts that
SA/CNTf-20 films can be a promising solution on further studies with TiO2 based
materials modified with CNTs for technological applications, as they overcome the
photocatalytic activity of the commercial benchmark P25 TiO2 films on caffeine
degradation.
In fact, all the powder composites prepared in this study were further deposited and
tested in films on the photo-degradation of 10 mg L-1 of methylene blue, which is a
model compound commonly used on photocatalysts screening reactions [23-26] .
The activity of all the films prepared with basis on SA TiO2 was systematically higher
than those based on P25 (conversions for methylene blue after 60 min of irradiation:
e.g. 89% for SA/CNTf-20 and 74% for P25) [19].
A deeper knowledge on the improvement of TiO2 photo-activity by promoting the
quality of the interphase with the CNTs was investigated by synthesizing new
composites [27]. The traditional sol-gel method was used to prepare composites by
including the CNTs directly on the ageing step of the sol, to be compared with their
analogues prepared by hydration-dehydration (SG/CNT) referred in the above
Section 6.3.2. The powders were deposited in glass slides through the doctor blade
technique and tested for the photocatalytic degradation of methylene blue solutions
of 10 mg L-1. The objective was to search for the advantage on including the carbon
phase during the formation of the TiO2 matrix enhancing the quality of the created
interphase, with the possibility of decoration of CNTs sidewalls with smaller TiO2
nanoparticles, especially with functionalized CNTs, avoiding the formation of the big
aggregates previously observed in Figure 6.4 g.
As expected, the characterization results revealed that the interphase between the
TiO2 and the CNTs is significantly improved when the CNTs are included during the
formation of the sol and especially when these are previously functionalized,
corroborating all the previous results about the advantage on having the CNT walls
decorated with oxygen functionalities representing anchoring points for the TiO2
nanoparticles. The observed aggregates of TiO2 nanoparticles are appreciably

Part IV - TiO2/CNT composites
149
shortened when the composites are synthesized by sol-gel instead of being prepared
by the hydration-dehydration method and a much more homogeneous catalyst is
obtained even when using the non-functionalized CNTs [27]. The achievement of
catalysts with a homogeneous distribution of the phases counteracting the
segregation observed for composites prepared by hydration-dehydration, allows a
good electronic interphase and consequently results in a most effective yield on
charge separation, leading to higher photocatalytic activities, at variance with high
rates of electron-hole recombination occurring in bulk aggregates with low photonic
yield on the degradation process.
The photocatalytic results for the films on the degradation of methylene blue after
60 min of irradiation have, in fact, corroborated what was observed through
characterization analysis [27]. Accordingly to the results obtained with SG/CNT
catalysts in the photocatalytic degradation of caffeine (see Figure 6.8), the
functionalization of CNT resulted in higher activities for the films on the degradation
of methylene blue either for the composites prepared by hydration-dehydration
(58% > 33%) or sol-gel methods (62% > 53%). Even comparing the activity of the
films prepared with non-functionalized CNTs by the different methods, the higher
efficiency for the sol-gel synthesis was clear (53% > 33%). Despite the results
obtained with bare TiO2 films with higher conversions for the composites prepared
through hydration-dehydration (59% > 46%), the synergy with the carbon phase was
clearly developed through the sol-gel synthesis for composites prepared with high
amounts of functionalized CNTs (62% > 58%). Once again the results obtained with
the aforementioned films were higher than those obtained for the films of P25 with a
conversion of 53%.
It is then possible to conclude that the behavior of catalysts on powder suspensions
cannot be directly related with their performance in the form of films. Photocatalysis
in suspensions is favored when catalysts have low density, showing a good
distribution in solution and a high contact with the organics to be degraded. However,
when the catalysts are supported in substrates, density is no more an issue and other
properties gain relevance for the inherent oxidative photocatalytic mechanism,
namely the synergy with a carbon phase which can act as a dispersing agent for TiO2
nanoparticles, as co-adsorbent or as photosensitizer [20, 22, 28].
Composites prepared by the traditional sol-gel method showed better results when
tested in films, in comparison with those prepared through hydration-dehydration,
unveiling that an intimate contact between TiO2 and CNTs can be created, resulting
in homogeneous composites with a good interphase and light response in the

150
near-UV to visible range with lower band gaps, even overcoming the results obtained
in films with the benchmark P25 [27].
In a recent study developed to shed light on the interdependency of the photocatalytic
efficiency and the interface properties of the TiO2/CNT composites prepared by the
hydration-dehydration method (referred on Section 6.3.2), important conclusions
could be obtained [29]. A new liquid nitrogen porosimetry methodology was proposed
to assess catalysts photo-efficiency on the degradation of aqueous caffeine as
function of their mixing quality in the synthesized composites, supported on
complementary characterization analysis. In particular, Raman analysis concluded to
the absence of any interfacial interaction. As expected, in the absence of synergetic
effects the photocatalytic efficiency correlated well with the extent of mixing between
the CNTs and TiO2 phases.
From this point on, further insights on the development of methods to synthesize
TiO2/CNT composites are needed in order to improve the quality of the interphase
created between both phases, taking advantages of the intimate contact at electronic
level to give an effective response to what the photocatalytic mechanism involves. As
discussed previously, the traditional sol-gel method to synthesize TiO2 nanoparticles
in the presence of functionalized CNTs is a good start point to future studies aiming
high efficiencies on the degradation of different organic pollutants with supported
catalysts [27].
6.2 Conclusions
Three different TiO2 materials (P25, SA, SG) were studied as a basis to produce
TiO2/CNT composites with improved photo-efficiency on the near-UV to visible region
for the photocatalytic degradation of caffeine, as a model compound. All the prepared
composites revealed photocatalytic activity towards the chosen reactions.
DRIFT analysis revealed the presence of hydroxyl groups at the surface of all the
TiO2 materials. The hydroxyl groups of TiO2 interact with oxygen groups on the
carbon nanotubes surface (e.g. carboxylic groups), creating Ti-O-C bonds on the
TiO2/CNT composites. Therefore, CNTs were successfully functionalized through a
nitric acid boiling method creating a modified chemical surface populated with
hydroxyl and carboxylic groups which can, by esterification reactions, bond with TiO2
nanoparticles.

Part IV - TiO2/CNT composites
151
The average crystallite size and crystalline phases of the TiO2 catalysts was
investigated by XRD showing that SG and SA are pure anatase with crystallite sizes
of 9 and 50 nm, respectively, and P25 constituted as a mix of anatase and rutile
phases with an average crystallite size of 24 nm.
The surface area of the composites increased with CNT loading, especially when
using functionalized CNTs. This was due to promoted dispersion of the TiO2
nanoparticles, following the introduction of the carbon phase in the semiconductor
matrix.
The SG particles form big aggregates with a very weak interaction with the carbon
phase. On the other hand, a good mixture is observed in the case of the big SA
particles which are in some cases rolled up by the CNTs. Finally, the P25 based
composites show also a good distribution of the smaller nanoparticles along the walls
of the CNTs.
The photocatalytic oxidation of caffeine could be ascribed to a pseudo-first order
kinetic model with the reference catalysts having the following order for the kinetic
constant: k = 4.9×10⁻³, 26×10-3 and 123×10-3 min-1 for SG, SA and P25, respectively.
Despite the higher activities for P25 based composites, SA TiO2 was the catalyst
which markedly took benefit of the combination with the carbon phase. Furthermore,
its photo-efficiency increased with CNTs loading. In addition, functionalized CNTs
gave rise to much more active photocatalysts.
Selective trapping of photogenerated holes and radicals allowed concluding that
holes play a major role in this reaction mechanism however, for SA based materials,
the mechanism seems to undergo a different pathway since free radicals produced
by photo-excited electrons appears to be responsible for the higher activity of
SA/CNTf-20 in comparison to bare SA.
When used in the film form SA/CNTf-20 was the most efficient photocatalyst for
caffeine degradation, better than that prepared with P25.
Photocatalytic results on the degradation of methylene blue with the composites in
film form, demonstrate that the synergy between TiO2 and CNTs is markedly
developed in the case of composites prepared by the sol-gel technique as compared
to the materials prepared by hydration-dehydration.
The performance of the composites prepared by hydration-dehydration is directly
correlated to the quality of the mixing between TiO2 and CNTs phases. However, it

152
is not due to the existence of a good interphase interaction, as confirmed by the
Raman analysis.
From the gathered evidence is obvious that the hydration-dehydration method has a
poor contribution to the creation of a real interphase interaction. The traditional sol-gel
method revealed to be a good synthesis procedure.
It follows from the above that the selection of the synthesis procedure must be
rigorously complemented with a deep characterization of the materials, especially
based on Raman spectroscopy to evaluate the interphase interaction. Once
confirmed the advantage of using a particular TiO2 in combination with CNTs, in
powder suspensions, reactions with supported catalysts should be finally performed
on the photo-degradation of different organic molecules, mixtures and finally real
effluents.
6.3 Experimental section
Multi-walled CNT structures were chosen for the synthesis of TiO2 based composites,
in detriment of SWCNTs, because of their higher thermal stability and the favored
evolution of acidic groups, namely carboxylic acids which are of interest for covalent
bonds with TiO2, under HNO3 oxidation. MWCNTs synthesized by chemical vapor
deposition (CVD) were purchased from Shenzhen Nanotechnologies Co. Ltd.
(purity ≥ 95%, main range of diameter < 10 nm, length = 5-15 µm, ash content
≤ 0.2 wt%, amorphous carbon < 3%).
Three different types of TiO2 powders were used: (i) TiO2 synthesized through a
modified acid catalyzed sol-gel method (SG); (ii) benchmark TiO2 from Evonik
Degussa Corporation (P25); (iii) commercial TiO2 from Sigma-Aldrich (SA).
6.3.1 Functionalization of CNTs
Accordingly to the previous study on the functionalization of CNTs, MWCNTs were
elected to be functionalized by boiling nitric acid to preserve the required carboxylic
acids for TiO2/CNT composites preparation. 0.5 g of the pristine MWCNTs were
immersed in 150 mL of a HNO3 solution with a concentration of 10.0 mol L-1 in a
round bottom flask equipped with a condenser. The suspension was heated to boiling
temperature and kept under magnetic stirring for 3 h. After cooling, the suspension

Part IV - TiO2/CNT composites
153
was washed up and the powder was recovered and stored after being dried overnight
at 383 K. Functionalized CNTs are here designated as CNTf.
6.3.2 Sol-gel synthesis of TiO2 and preparation of TiO2/CNT composites
TiO2 (SG) was prepared by an acid catalyzed sol-gel method, as described elsewhere
[30]. An alkoxide precursor Ti (OC3H7)4 (Aldrich, 97 %) was dissolved in ethyl alcohol
(Panreac, 99.5 %) under magnetic stirring and the reaction was catalyzed by adding
HNO3 (Fluka, 65 wt. %). The mixture was loosely covered and kept under stirring until
a homogeneous gel was formed. The gel was aged in air for several days and when
completely dried was crushed into fine powder. To obtain pure crystalline anatase
phase, the powder was calcined in nitrogen for 2 h at 673 K before being stored.
The composite powders were prepared by a simple hydration/dehydration method
adapted from procedures described in literature [5, 31]. Briefly, CNTs were dispersed
in 1 L of distilled water under sonication and then TiO2 added under stirring, the
mixture heated at 353 K until complete evaporation of water and the resulting
composite dried overnight at 383 K. The composites prepared with functionalized
CNT and different TiO2 powders were made at different mass ratios. These
composites are labelled as XX/CNTf-Y, where XX is the type of TiO2 used (SG, SA
or P25) and Y (5, 10 or 20) is the mass of CNTf per 100 mass units of bare TiO2,
giving approximately 5, 9 and 17 wt.% of CNTf. Composites were also prepared with
pristine CNTs using the three different TiO2 powders at a fixed mass ratio
(XX/CNT-10). Major emphasis is given in the present work to materials prepared with
17 wt.% of CNTf, since the highest photocatalytic activities for degradation of different
pollutants if often found near this ratio [28].
6.3.3 Preparation of photocatalytic films
Selected materials were also prepared on glass slides as films using the doctor blade
technique, as described elsewhere [19]. Briefly, glass slides of 1.5 cm diameter are
coated on one side with different pastes of each material. For each powder catalyst,
a paste was prepared by mixing 50 mg with 1.5 mL of a solution constituted by
acetone (10.0 mL), -terpineol (5.0 mL) and ethylcellulose (0.3 g). The mixture was
left under stirring during 24 h in a closed vial and then the vial was opened until
solvent evaporation for another 24 h. On a freshly cleaned transparent glass slide the
paste was spread using the doctor blade technique by limiting the surface to be

154
covered with the catalyst by two parallel stripes of adhesive tape, in order to obtain
an area of 1.0 1.0 cm. After deposition over the glass slides the films were calcined
at 723 K for 2 h.
6.3.4 Materials characterization
The structure of materials surface was investigated by Diffuse Reflection Infrared
Fourier Transformed (DRIFT) spectroscopy and the interferograms are presented in
Kubelka-Munk scale. The morphology and the phase dispersion on the composites
were observed by scanning electron microscopy (SEM) and transmission electron
microscopy (TEM) analysis. Crystalline phases and crystallite sizes on bare TiO2
materials and the respective composites were determined through X-ray diffraction
(XRD) analysis. BET surface area (SBET) of the prepared materials was determined
from N2 adsorption-desorption isotherms obtained at 77 K. The amount of oxygen
groups introduced on the pristine CNTs surface was quantified through temperature
programmed desorption (TPD) analysis. Caffeine absorption spectrum was collected
by UV-Vis spectroscopy. Details on the conditions under which the analyses took
place are described in Chapter 3.
6.3.5 Photocatalytic experiments
Photocatalytic experiments with powders were conducted in a glass-immersion
photochemical reactor equipped with a UV-Vis Heraeus TQ 150 medium pressure
mercury vapour lamp located axially and held in a quartz immersion tube, as depicted
in Figure 2.2 in Section 2.2.1 of Chapter 2. A DURAN 50® glass jacket was used for
cool water circulation to maintain a constant temperature, acting also as an optical
cut-off of UVB and UVC irradiation (λ > 350 nm). The reactor was charged with a
fixed amount of each catalyst (1.0 g L-1) and with 250 mL of a caffeine solution
(50 mg L-1) continuously bubbled with a 20 vol.% of oxygen. A series of preliminary
experiments was performed using four different catalyst loads of bare P25, SA and
SG materials (0.8, 0.9, 1.0 and 1.1 g L-1), that were selected having into account the
minimum TiO2 content used on 1 g L-1 of a TiO2/CNT composite (i.e., ca. 0.8 g L-1 for
XX/CNTf-20). The results obtained were similar with a given material for different
catalyst loads (deviations lower than 5%), indicating that the reaction rate was
independent on the amount of TiO2 at these conditions.
Part IV - TiO2/CNT composites
155
Dark experiments were performed to establish the period of time needed to achieve
the adsorption-desorption equilibrium for the prepared materials and to determine
t = 0 for the photocatalytic reactions (instant to turn on the irradiation). An experiment
in the absence of catalyst was also performed as blank in order to calculate the
contribution from direct photolysis. Photocatalytic tests with caffeine were also
conducted employing hole and radical trapping agents (10 mM of EDTA and t-BuOH,
respectively) with the aim to study the photocatalytic reaction mechanism. Some
materials were also tested in the form of films, and in this case a smaller reactor was
used maintaining the operating conditions and radiation source, accordingly to the
procedure and experimental setup described in detail in Section 2.2.2 of Chapter 2.
Experimental data revealed that the photocatalytic oxidation of caffeine could be
ascribed to a pseudo-first order kinetic model, as described by the following equation:
𝑪 = 𝑪𝟎𝒆−𝒌∙𝒕 (1)
where C corresponds to pollutant concentration, k is the pseudo-first order kinetic
constant, t is the reaction time and C0 is the pollutant concentration for t = 0. The k
values (Table 6.1) were obtained by non-linear regression, fitting Eq. (1) to the
normalized caffeine concentration evolution (C/C0). The used Marquardt-Levenberg
algorithm seeks the values of the parameters that minimize the sum of the squared
differences between observed and predicted values of the dependent variable (the
tolerance was set at 1 x 10⁻¹⁰). The standard error of each estimated k parameter and
the respective regression coefficient of the model (r2) are shown in Table 6.1 and
indicate in general good fitting of the model to the experimental data.
Samples were periodically withdrawn, centrifuged and analyzed by High
Performance Liquid Chromatography (HPLC) with a mobile phase consisting on
ultra-pure water and methanol. Caffeine concentration was determined at the
maximum absorption wavelength (274 nm). This absorbance was found to be linear
over the whole considered range (a maximum relative standard deviation of 2%).
6.4 References
[1] Gao Y, Masuda Y, Seo W-S, Ohta H, Koumoto K. TiO2 nanoparticles
prepared using an aqueous peroxotitanate solution. Ceram Int. 2004; 30 (7):1365-8.

156
[2] Comparelli R, Fanizza E, Curri ML, Cozzoli PD, Mascolo G, Passino R, et al.
Photocatalytic degradation of azo dyes by organic-capped anatase TiO2
nanocrystals immobilized onto substrates. Appl Catal B-Environ. 2005; 55 (2):81-91.
[3] Araña J, Doña-Rodríguez JM, Portillo-Carrizo D, Fernández-Rodríguez C,
Pérez-Peña J, González Díaz O, et al. Photocatalytic degradation of phenolic
compounds with new TiO2 catalysts. Appl Catal B-Environ. 2010; 100 (1–2):346-54.
[4] Sing KSW, Everett DH, Haul RAW, Moscou L, Pierotti RA, Rouquerol J, et
al. Reporting Physisorption Data for Gas Solid Systems with Special Reference to
the Determination of Surface-Area and Porosity (Recomendations 1984). Pure Appl
Chem. 1985; 57 (4):603-19.
[5] Yao Y, Li G, Ciston S, Lueptow RM, Gray KA. Photoreactive TiO2/Carbon
Nanotube Composites: Synthesis and Reactivity. Environ Sci Technol. 2008; 42
(13):4952-7.
[6] Metcalfe CD, Miao X-S, Koenig BG, Struger J. Distribution of acidic and
neutral drugs in surface waters near sewage treatment plants in the lower Great
Lakes, Canada. Environ Toxicol Chem. 2003; 22 (12):2881-9.
[7] Buerge IJ, Poiger T, Müller MD, Buser H-R. Caffeine, an Anthropogenic
Marker for Wastewater Contamination of Surface Waters. Environ Sci Technol. 2003;
37 (4):691-700.
[8] P. Telo J, J. S. C. Vieira A. Mechanism of free radical oxidation of caffeine in
aqueous solution. J Chem Soc, Perkin Trans 2. 1997; (9):1755-8.
[9] Bernabeu A, Vercher RF, Santos-Juanes L, Simón PJ, Lardín C, Martínez
MA, et al. Solar photocatalysis as a tertiary treatment to remove emerging pollutants
from wastewater treatment plant effluents. Catal Today. 2011; 161 (1):235-40.
[10] Klamerth N, Malato S, Maldonado MI, Agüera A, Fernández-Alba AR.
Application of Photo-Fenton as a Tertiary Treatment of Emerging Contaminants in
Municipal Wastewater. Environ Sci Technol. 2010; 44 (5):1792-8.
[11] Klamerth N, Miranda N, Malato S, Agüera A, Fernández-Alba AR, Maldonado
MI, et al. Degradation of emerging contaminants at low concentrations in MWTPs
effluents with mild solar photo-Fenton and TiO2. Catal Today. 2009; 144 (1–2):124-
30.
[12] Klamerth N, Rizzo L, Malato S, Maldonado MI, Agüera A, Fernández-Alba
AR. Degradation of fifteen emerging contaminants at μg L−1 initial

Part IV - TiO2/CNT composites
157
concentrations by mild solar photo-Fenton in MWTP effluents. Water Res. 2010; 44
(2):545-54.
[13] Álvarez PM, Jaramillo J, López-Piñero F, Plucinski PK. Preparation and
characterization of magnetic TiO2 nanoparticles and their utilization for the
degradation of emerging pollutants in water. Appl Catal B-Environ. 2010; 100 (1–
2):338-45.
[14] Pastrana-Martínez LM, Morales-Torres S, Likodimos V, Figueiredo JL, Faria
JL, Falaras P, et al. Advanced nanostructured photocatalysts based on reduced
graphene oxide–TiO2 composites for degradation of diphenhydramine
pharmaceutical and methyl orange dye. Appl Catal B-Environ. 2012; 123–124
(0):241-56.
[15] Kinney CA, Furlong ET, Werner SL, Cahill JD. Presence and distribution of
wastewater-derived pharmaceuticals in soil irrigated with reclaimed water. Environ
Toxicol Chem. 2006; 25 (2):317-26.
[16] Figueiredo JL, Pereira MFR, Freitas MMA, Órfão JJM. Modification of the
surface chemistry of activated carbons. Carbon. 1999; 37 (9):1379-89.
[17] Minero C, Mariella G, Maurino V, Vione D, Pelizzetti E. Photocatalytic
Transformation of Organic Compounds in the Presence of Inorganic Ions. 2.
Competitive Reactions of Phenol and Alcohols on a Titanium Dioxide−Fluoride
System. Langmuir. 2000; 16 (23):8964-72.
[18] Serpone N, Texier I, Emeline AV, Pichat P, Hidaka H, Zhao J. Post-irradiation
effect and reductive dechlorination of chlorophenols at oxygen-free TiO2/water
interfaces in the presence of prominent hole scavengers. J Photochem Photobiol A-
Chem. 2000; 136 (3):145-55.
[19] Sampaio MJ, Silva CG, Marques RRN, Silva AMT, Faria JL. Carbon
nanotube–TiO2 thin films for photocatalytic applications. Catal Today. 2011; 161
(1):91-6.
[20] Wang W, Serp P, Kalck P, Faria JL. Photocatalytic degradation of phenol on
MWNT and titania composite catalysts prepared by a modified sol–gel method. Appl
Catal B-Environ. 2005; 56 (4):305-12.
[21] Wang W, Serp P, Kalck P, Faria JL. Visible light photodegradation of phenol
on MWNT-TiO2 composite catalysts prepared by a modified sol–gel method. J Mol
Catal A: Chem. 2005; 235 (1–2):194-9.

158
[22] Gao B, Chen GZ, Li Puma G. Carbon nanotubes/titanium dioxide
(CNTs/TiO2) nanocomposites prepared by conventional and novel surfactant
wrapping sol–gel methods exhibiting enhanced photocatalytic activity. Appl Catal B-
Environ. 2009; 89 (3–4):503-9.
[23] Kwon CH, Shin H, Kim JH, Choi WS, Yoon KH. Degradation of methylene
blue via photocatalysis of titanium dioxide. Mater Chem Phys. 2004; 86 (1):78-82.
[24] Kim SY, Lim TH, Chang TS, Shin CH. Photocatalysis of methylene blue on
titanium dioxide nanoparticles synthesized by modified sol-hydrothermal process of
TiCl4. Catal Lett. 2007; 117 (3-4):112-8.
[25] Xiong L, Sun W, Yang Y, Chen C, Ni J. Heterogeneous photocatalysis of
methylene blue over titanate nanotubes: Effect of adsorption. J Colloid Interface Sci.
2011; 356 (1):211-6.
[26] Hwang KJ, Lee JW, Shim WG, Jang HD, Lee SI, Yoo SJ. Adsorption and
photocatalysis of nanocrystalline TiO 2 particles prepared by sol-gel method for
methylene blue degradation. Adv Powder Technol. 2012; 23 (3):414-8.
[27] Sampaio MJ, Marques RRN, Tavares PB, Faria JL, Silva AMT, Silva CG.
Tailoring the properties of immobilized titanium dioxide/carbon nanotube composites
for photocatalytic water treatment. Journal of Environmental Chemical Engineering
(JECE). 2013; 1 (4):945-53.
[28] Silva CG, Faria JL. Photocatalytic Oxidation of Phenolic Compounds by
Using a Carbon Nanotube-Titanium Dioxide Composite Catalyst. ChemSusChem.
2010; 3 (5):609-18.
[29] Miranda SM, Romanos GE, Likodimos V, Marques RRN, Favvas EP,
Katsaros FK, et al. Pore structure, interface properties and photocatalytic efficiency
of hydration/dehydration derived TiO2/CNT composites. Appl Catal B-Environ. 2014;
147:65-81.
[30] Silva CG, Faria JL. Anatase vs.rutile efficiency on the photocatalytic
degradation of clofibric acid under near UV to visible irradiation. Photochem Photobiol
Sci. 2009; 8 (5):705-11.
[31] Vijayan BK, Dimitrijevic NM, Finkelstein-Shapiro D, Wu J, Gray KA. Coupling
Titania Nanotubes and Carbon Nanotubes To Create Photocatalytic
Nanocomposites. ACS Catalysis. 2011; 2 (2):223-9.


Part V
A photocatalytic system to study the activity of
powdered or immobilized catalysts


163
7 Assembling and validation of a customized photocatalytic
system for water remediation studies using caffeine as model
compound
In a heterogeneous photocatalytic process the kinetics are influenced by main
physical parameters namely mass of catalyst, wavelength of the irradiated light, initial
concentration of the compound in study, temperature during reaction and radiant flux
reaching the catalyst. It is therefore relevant to create conditions where these
parameters can be studied with accuracy and their effects assessed for a given
system.
A new customized setup was assembled with the goal of improving some limitations
detected in the system used in Chapter 6 (with the small cylindrical reactor), namely
the inefficiency on the usage of light given the dimensions of the arc of the lamp. In
this new setup, it was used a high-pressure mercury vapor lamp with an arc of
comparable dimensions to the photo-reactor. Optical elements like an optical window
and a biconvex lens were included to optimize the usage of light in the photocatalytic
process, by focusing the emitted light beam on the photo-reactor. This strategy allows
maintaining the wavelength distribution of the beam, with maximum transmittance.
Optical filters can also be used to study catalysts activity at different wavelengths,
approaching to sunlight conditions in solar-driven applications. Optical
characterization and validation of preliminary results in caffeine photocatalytic
degradation with suspensions of the benchmark TiO2 P25 (Evonik Degussa
Corporation) were obtained. The system configuration was optically characterized
and tested at different conditions with or without optical accessories and the reactor
positioned at different distances from the irradiation source. Optimal conditions for
P25 suspensions were obtained: 1.0 g L-1 of catalyst load being irradiated under
near-UV to visible light (350 – 600 nm) through the optical lens with the photo-reactor
positioned at 17 cm to the lamp. This setup is available to study photocatalytic
degradation in aqueous systems either with suspensions or supported catalysts
under different irradiating conditions with optimized usage of the emitted light.


Part V - A photocatalytic system to study the activity of powdered or immobilized catalysts
165
7.1 Results and discussion
Several photo-reactors for wastewater treatment have been thoroughly reviewed [1].
In the present study, the new photocatalytic system was assembled taking into
account some of the published scientific recommendations on photo-reactors
configuration and process intensification regarding efficiency of illumination and mass
transfer limitations [1-5].
In fact, efficiency on the light usage is one of the most important parameters with a
strong influence on photocatalytic studies. This new setup was designed to make up
for the inadequacy of dimensions between the arc of the immersion lamp and the
small cylindrical photo-reactor used in Chapter 6 (see Section 2.2.2 in Chapter 2).
The small photo-reactor with an exposed surface of 3.14 cm2 can now be positioned
at well-defined distances from the light source to evaluate the effect on photocatalytic
results, as irradiance decreases inversely with the square of the distance from the
source [4]. Intensification of the photocatalytic system was accomplished by using an
optical accessory, namely a biconvex lens, for focusing the light beam over the
reactor exposed surface with a uniform distribution of the transmitted wavelengths in
relation to the spectrum originally emitted from the light source. The application of
various optical filters at very well defined distances, to simulate specific spectral
conditions, is also possible. The two main configurations for photocatalytic reactors
vary on the state of the catalyst: suspended photocatalyst particles or immobilized
onto an inert support. Mass transfer limitations are minimized when photocatalytic
reactions are conducted with catalyst suspensions but with the main drawback of
requiring for the solid phase additional post separation processes, besides difficulties
either due to eventual particle aggregation or the preclusion to operation in
continuous mode. In this sense, supported catalysts have been studied over different
supports on diverse photo-reactors configurations representing a way out to
overcome the catalyst separation step [1, 6-8]. Though, increased mass transfer
limitations rise up over the catalyst immobilized layers.
7.1.1 Assembling of the customized photocatalytic reaction system
The HPK125W lamp here in use is a high pressure mercury vapor lamp with similar
spectral emission lines when compared to the TQ150 lamp used in the photocatalytic
studies discussed in the previous Chapter 6, as shown in Figure 7.1 a. However, it is
more suitable to the dimensions of the small cylindrical reactor since the arc has an
adequate scale of ca. 3 cm (Figure 7.1 b).
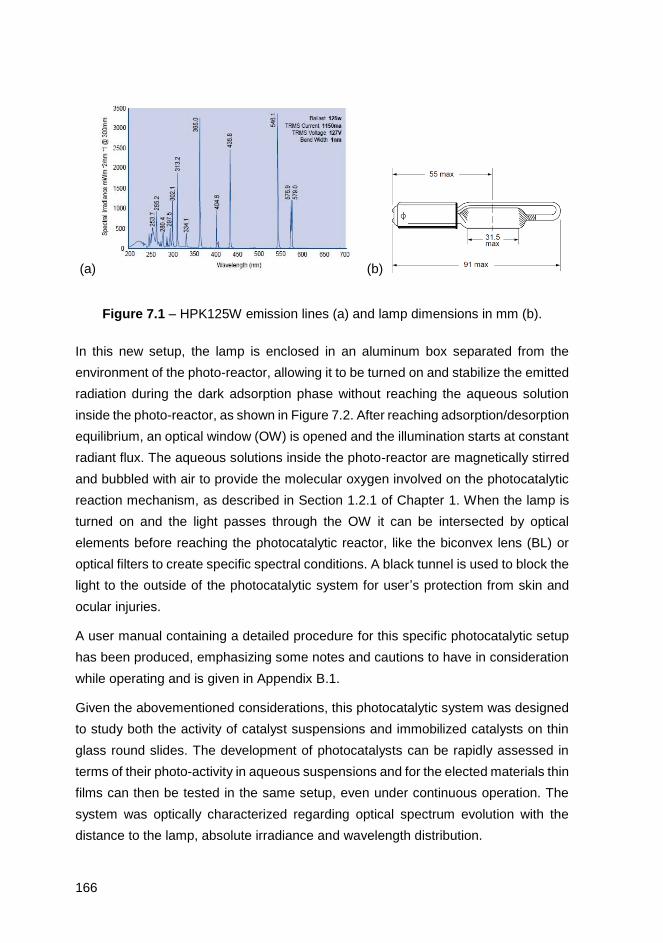
166
(a) (b)
Figure 7.1 – HPK125W emission lines (a) and lamp dimensions in mm (b).
In this new setup, the lamp is enclosed in an aluminum box separated from the
environment of the photo-reactor, allowing it to be turned on and stabilize the emitted
radiation during the dark adsorption phase without reaching the aqueous solution
inside the photo-reactor, as shown in Figure 7.2. After reaching adsorption/desorption
equilibrium, an optical window (OW) is opened and the illumination starts at constant
radiant flux. The aqueous solutions inside the photo-reactor are magnetically stirred
and bubbled with air to provide the molecular oxygen involved on the photocatalytic
reaction mechanism, as described in Section 1.2.1 of Chapter 1. When the lamp is
turned on and the light passes through the OW it can be intersected by optical
elements before reaching the photocatalytic reactor, like the biconvex lens (BL) or
optical filters to create specific spectral conditions. A black tunnel is used to block the
light to the outside of the photocatalytic system for user’s protection from skin and
ocular injuries.
A user manual containing a detailed procedure for this specific photocatalytic setup
has been produced, emphasizing some notes and cautions to have in consideration
while operating and is given in Appendix B.1.
Given the abovementioned considerations, this photocatalytic system was designed
to study both the activity of catalyst suspensions and immobilized catalysts on thin
glass round slides. The development of photocatalysts can be rapidly assessed in
terms of their photo-activity in aqueous suspensions and for the elected materials thin
films can then be tested in the same setup, even under continuous operation. The
system was optically characterized regarding optical spectrum evolution with the
distance to the lamp, absolute irradiance and wavelength distribution.

Part V - A photocatalytic system to study the activity of powdered or immobilized catalysts
167
(a)
(b)
Figure 7.2 – Cylindrical reactor with HPK125W lamp setup scheme (a)
and picture (b).
The effect of the biconvex lens and long pass filters was also evaluated as
accessories to create different optical conditions for the assessment of new
photocatalysts activity. Photocatalytic results on caffeine degradation did corroborate
what was expected given the optical characterization results. Comparison with the
system used in Chapter 6 for the same cylindrical photo-reactor was made and the
results are shown and commented in Appendix B.2.
7.1.2 Optical characterization
7.1.2.1 Variation on the light spectrum with the distance to the lamp
By positioning the reactor at different distances from the lamp, the irradiated spectra
reaching the inside of the borosilicate reactor through the surface exposed to the light

168
beam, previously intersected by the optical window, were collected and are
represented in Figure 6.1.
Figure 7.3 – Evolution on the spectral irradiance reaching the inside of the
photo-reactor with the distance to the irradiation source.
For wavelengths higher than 350 nm, five main emission lines are observed centred
at 365, 405, 436, 546 and a small band centred at 578 nm, resulting from the
contribution of the two peaks at 576.9 and 578 nm, accordingly to the information of
the supplier (Figure 7.1 a). As expected, the intensity of the emission lines decreases
progressively with the distance to the lamp.
The area of the spectrum recorded for each fixed distance was integrated
corresponding to the irradiance represented in Figure 7.4. A maximum of 142 W m-2
was measured at 10 cm, decreasing inversely with the square distance to the lamp
(r2 = 0.9698) with less representative differences for distances above 15 cm, reaching
ca. 35 W m-2 at 18 nm.
Figure 7.4 – Decay of the irradiance as a function of
the distance to the lamp.
0
5
10
15
20
25
350 400 450 500 550 600 650
Eλ
(w m
-2nm
-1)
λ (nm)
10cm
11cm
12cm
13cm
14cm
15cm
16cm
17cm
18cm
0
30
60
90
120
150
10 12 14 16 18
irra
dia
nce (
W m
-2)
distance (cm)

Part V - A photocatalytic system to study the activity of powdered or immobilized catalysts
169
Ideal windows allow the optical beams to pass from one environment to another
without changing the wavelength distribution, so the contribution of each emission
line intensity to the total irradiance was calculated in percentage for each spectrum
at a fixed distance and the results are plotted in Figure 7.5.
Figure 7.5 – Contribution of the intensity of each particular emission line on
the total irradiance for different distances.
In fact, for the presented system, the wavelength distribution is maintained
independent of the total irradiance in the range of the measured distances. The
highest contribution for the total intensity is given by the line at 365 nm with ca. 40%
for the total intensity, working under near-UV to visible light conditions. For the
assessment of pure visible light activity of photocatalysts, the line at 365 nm must be
totally eliminated with optical filters.
7.1.2.2 Effect of the optical elements on the emitted spectrum
Optical elements are of great importance to manage the irradiating light in order to
simulate the required conditions to be studied in photocatalytic reactions. Working at
a fixed distance from the lamp requires focusing the light beam in the surface of
interest that is the exposed face of the borosilicate reactor. For that purpose, a
biconvex lens, which has the property of converging the incident light with a positive
focal length, has been introduced. This lens has great optical transmittance, higher
than 90% for wavelengths upper than 350 nm and a positive focal distance of 20 cm.
As previously mentioned, the study of visible active photocatalysts requires the
management of the optical conditions to obtain a light beam reaching the reactor with
0
10
20
30
40
50
350 400 450 500 550 600 650
% irr
ad
ian
ce
λ (nm)
10 cm
11 cm
12 cm
13 cm
14 cm
15 cm
16 cm
17 cm
18 cm

170
wavelengths greater than 400 nm. Two long pass filters (LP) were used to create
these conditions and the optical transmittance of both is represented in Figure 7.6.
Figure 7.6 – UV-Vis transmittance of long pass filters.
The long pass filter at 400 nm cuts the emission line at 365 nm and using the long
pass filter at 450 nm only 546 and 578 nm emission lines will be used in photocatalytic
reactions. With these optical accessories adequate conditions are created to test
visible light active catalysts.
To confirm the expected working conditions in photocatalytic experiments, the light
spectra reaching the inside of the borosilicate reactor, fixed and centred at 17 cm
from the irradiating source when the light beam is intersected by the different optical
elements, were collected and are represented in Figure 6.2. To mention the different
tested configurations an abbreviated form will be used hereafter, as an example,
OW_BL_LP400_R stands for the light beam being intersected by the optical window,
followed by the biconvex lens and the long pass filter for 400 nm with the
photo-reactor (R) centred at a fixed distance with reference to the lamp. The BL was
fixed just next to the optical window to avoid light dispersion, focusing the light beam,
and the optical filters were disposed right in front of the BL followed by the
photocatalytic reactor which was centred at a distance of 17 cm to the lamp.
The presence of the optical window (OW_R) slightly reduces de intensity of the
emitted spectrum reaching the inside of the photo-reactor (R). Conversely, the effect
of the BL (OW_BL_R) clearly increases the absolute irradiance which is the result of
being focusing the light beam over the photo-reactor volume.
0
20
40
60
80
100
350 400 450 500 550 600 650
T (
%)
λ (nm)
long pass filter 400 nm
long pass filter 450 nm

Part V - A photocatalytic system to study the activity of powdered or immobilized catalysts
171
Figure 7.7 – Effect of the different optical elements on the light spectra
reaching the inside of the photo-reactor
(OW – optical window, BL – biconvex lens, LP – long pass filters, R – photo-reactor).
The configuration here represented by the OW_R curve corresponds to the one in
light pink in Figure 6.1 for the distance of 17 cm. As expected, the line at 365 and
those at 405 and 436 nm are blocked when the filter of 400 or 450 nm are used,
respectively.
Given the advantages on using the BL which focus the light beam on a given surface
area therefore maximizing the irradiance at a fixed position located inside the focal
distance, the configuration in use hereafter is OW_BL_R. The contribution of each
peak for the total irradiance of the spectrum obtained with this configuration is in
accordance with the results obtained for the spectra recorded without the biconvex
lens represented in Figure 7.5, confirming that this optical element does not affect
the wavelength distribution of the original light beam.
7.1.3 Photocatalytic experiments
Preliminary photocatalytic experiments were performed with the benchmark P25 in
powder form over 7 mL of 20 mg L-1 caffeine solutions. Except for the experiments of
catalyst load optimization, the concentration in use was of 1.0 g L-1. The experimental
results were discussed based on the pseudo-first order kinetic constant, k, obtained
by non-linear regression fitting to the experimental data. Degradation profiles were
expressed in caffeine concentration (C) normalized to the initial concentration C0
(C/C0). Marquardt-Levenberg algorithm was used to seek the values of the
parameters that minimize the sum of the squared differences between observed and
predicted values of the dependent variable (tolerance 1 x 10⁻¹⁰). Standard error of
0
2
4
6
8
350 400 450 500 550 600 650
Eλ
(W m
-2 n
m-1
)
λ (nm)
OW_BL_R
R (positioned at 17 cm from the lamp)
OW_R
OW_BL_LP400_R
OW_BL_LP450_R

172
estimated k and the respective regression coefficient of the model (r2) are shown in
Table 7.1 and Table 7.2 indicating in general good fitting of the model to the
experimental data.
7.1.3.1 Effect of the optical elements on the photocatalytic activity of P25 over
caffeine solutions
The modification on the emitted light spectrum with optical accessories was
described in the previous Section 7.1.2.2 and is now evaluated through experimental
results on caffeine degradation. In Figure 7.8 are represented the degradation
profiles for different configurations with the optical elements biconvex lens and the
long pass filter for 400 nm. For the placement of the long pass filters after the
biconvex lens, the closest position for the reactor with reference to the lamp is centred
at 17 cm. In order to have comparable results, all the reactions were performed with
the reactor fixed at this position.
Accordingly to what was expected, the usage of the long pass filter LP400 nullifies
the photo-activity of the benchmark P25, since the drawback of these bare TiO2
catalysts resides on the absence of visible light absorption, which is the major fraction
of sun light reaching the earth’s surface, of relevance for real photocatalytic
applications at industrial scale. Hereupon, the described system is adequate to
identify potential industrial catalysts with pure visible light response.
Figure 7.8 – Effect of the optical accessories on the photocatalytic activity
of P25 suspensions for caffeine degradation.
0.0
0.2
0.4
0.6
0.8
1.0
0 15 30 45 60
C/C
0
time (min)
OW_R
OW_BL_R
OW_BL_LP400_R

Part V - A photocatalytic system to study the activity of powdered or immobilized catalysts
173
Regarding the effect of the biconvex lens, an increase on the measured absolute
irradiance of ca. 67%, from 39 to 65 W m-2, resulted in a raise of 32% in photocatalytic
activity for the configuration using the biconvex lens (from k = 0.107 ± 0.006 min-1 for
OW_R to k = 0.141 ± 0.008 min-1 for OW_BL_R configuration), which means that at
the described conditions the photon flux is not a limiting step, as not all the irradiated
photons are being used in the photocatalytic process. The usage of a non-optimized
catalyst load can be one of the reasons for the incapacity on the generation of more
oxidative radicals in proportion with the photons fed to the system so the study of this
parameter is needed to proceed with future photocatalytic experiments.
7.1.3.2 Optimization of the P25 powder catalyst load on the degradation of
aqueous caffeine
The optimum catalyst dosage to be used on slurry photocatalytic reactions depends
always on the geometry and working conditions of each photo-reactor, ranging
normally within 0.2 to 2.5 g L-1 for TiO2 in slurry batch reactors [1, 9, 10]. In a true
heterogeneous catalytic regime the initial rates of reaction are found to be directly
proportional to the mass of catalyst until reach a certain limit above which they start
to become independent on the catalyst load. For higher amounts of catalyst the
screening effect, due to particles in excess, masks part of photosensitive surface
decreasing the penetration depth of light. Optimal catalyst load is then defined as the
maximum mass of catalyst in which all the particles are totally illuminated, ensuring
total absorption of efficient photons [11].
As crucial parameter to establish optimized operating conditions, the catalyst load of
P25 suspensions was studied in a range of 0.05 to 2.0 g L-1 on caffeine degradation
of 20 ppm solutions with an initial volume of 7 mL during 30 min of irradiation in a
configuration of OW_BL_R, the reactor positioned at 17 cm. The obtained results are
gathered in Figure 7.9 and resumed in Table 7.1 in terms of the pseudo first order
kinetic constants.
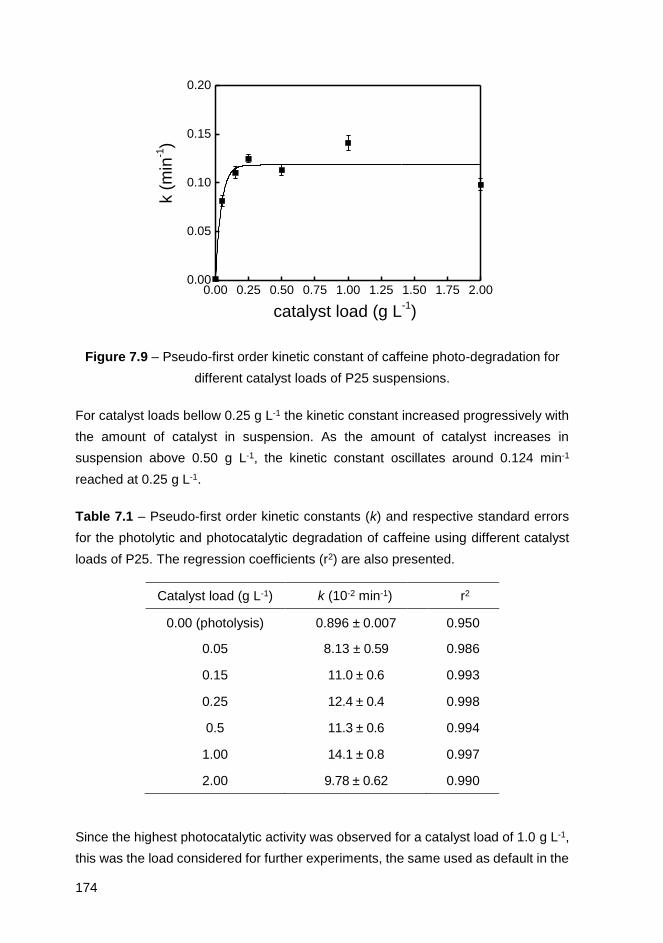
174
Figure 7.9 – Pseudo-first order kinetic constant of caffeine photo-degradation for
different catalyst loads of P25 suspensions.
For catalyst loads bellow 0.25 g L-1 the kinetic constant increased progressively with
the amount of catalyst in suspension. As the amount of catalyst increases in
suspension above 0.50 g L-1, the kinetic constant oscillates around 0.124 min-1
reached at 0.25 g L-1.
Table 7.1 – Pseudo-first order kinetic constants (k) and respective standard errors
for the photolytic and photocatalytic degradation of caffeine using different catalyst
loads of P25. The regression coefficients (r2) are also presented.
Catalyst load (g L-1) k (10-2 min-1) r2
0.00 (photolysis) 0.896 ± 0.007 0.950
0.05 8.13 ± 0.59 0.986
0.15 11.0 ± 0.6 0.993
0.25 12.4 ± 0.4 0.998
0.5 11.3 ± 0.6 0.994
1.00 14.1 ± 0.8 0.997
2.00 9.78 ± 0.62 0.990
Since the highest photocatalytic activity was observed for a catalyst load of 1.0 g L-1,
this was the load considered for further experiments, the same used as default in the
0.00 0.25 0.50 0.75 1.00 1.25 1.50 1.75 2.000.00
0.05
0.10
0.15
0.20
catalyst load (g L-1)
k (
min
-1)

Part V - A photocatalytic system to study the activity of powdered or immobilized catalysts
175
previous studies. The fall of the kinetic constant for a load of 2.0 g L-1 may be
eventually ascribed to the abovementioned screening effects.
7.1.3.3 Optimization of the reactor position relative to the biconvex lens
As previously mentioned, irradiance decreases inversely with the square of the
distance from the light source and in order to have the highest amount of photons
irradiating the photo-reactor it was supposed to place it the nearest as possible to the
lamp. It is reported in literature that the reaction rate is directly proportional to the
radiant flux, confirming the participation of the photo induced electrons and holes in
the reaction mechanism. However, above a certain limit the reaction rate starts to be
proportional to the square root of the radiant flux [5, 9-11]. It is remarked that optimal
light power utilization corresponds to the domain where the reaction rate is
proportional to the radiant flux. Above that limit the rate of electron-hole formation
becomes greater than the photocatalytic rate, which favors the electron-hole
recombination. The usage of the optical lens was proven to increase the system
photocatalytic efficiency, as discussed in the previous Section 7.1.3.1, by focusing
the light beam over the photo-reactor leading to a more efficiency on photons
absorption. Thus, reactor position was optimized in relation to the distance with the
biconvex lens, as illustrated in Figure 7.10. Maximum usage of the light photon flux
also depends on ensuring irradiation over the entire photo-reactor volume for
maximum catalyst photo-activity.
Different possibilities of positioning the photocatalytic reactor inside the focal distance
of the biconvex lens are represented in Figure 7.10. Given the dimensions of the
biconvex lens of 4 cm in diameter and knowing the focal distance as being
positive 20 cm, at 10 cm from the biconvex lens the light beam is focused in a surface
with 2 cm in diameter which overlaps with the round section of the photocatalytic
reactor exposed to the light beam. The length of the cylindrical reactor is of 3.5 cm,
as shown in Figure 2.4 a in Section 2.2.2 of Chapter 2.
Figure 7.10 – Schematic representation of the incidence of the light beam on the
photocatalytic reactor at different distances from the biconvex lens.
0510152025
bic
onvex le
ns
reactor position (cm)
focal distance
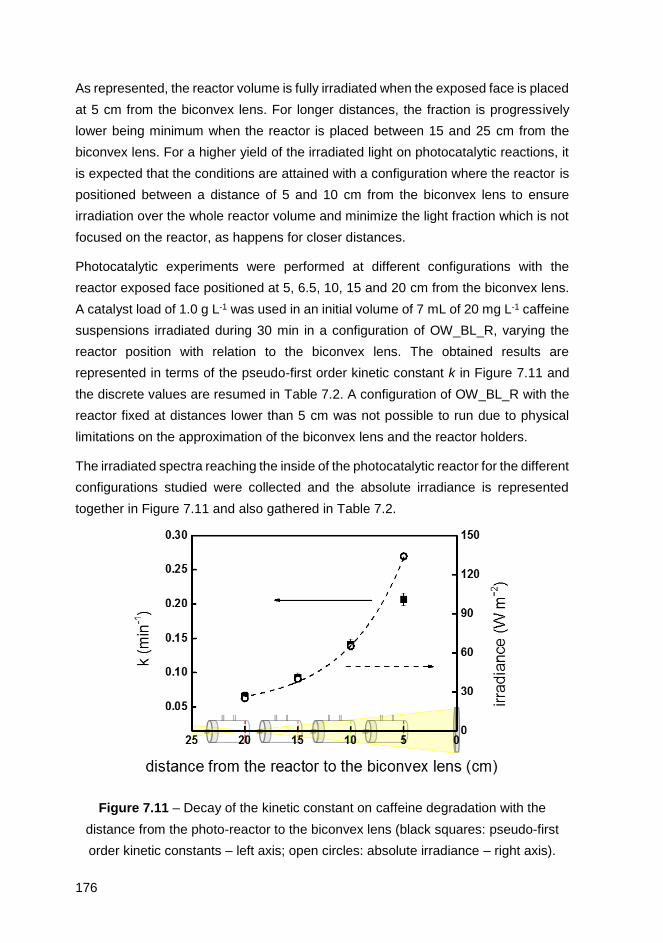
176
As represented, the reactor volume is fully irradiated when the exposed face is placed
at 5 cm from the biconvex lens. For longer distances, the fraction is progressively
lower being minimum when the reactor is placed between 15 and 25 cm from the
biconvex lens. For a higher yield of the irradiated light on photocatalytic reactions, it
is expected that the conditions are attained with a configuration where the reactor is
positioned between a distance of 5 and 10 cm from the biconvex lens to ensure
irradiation over the whole reactor volume and minimize the light fraction which is not
focused on the reactor, as happens for closer distances.
Photocatalytic experiments were performed at different configurations with the
reactor exposed face positioned at 5, 6.5, 10, 15 and 20 cm from the biconvex lens.
A catalyst load of 1.0 g L-1 was used in an initial volume of 7 mL of 20 mg L-1 caffeine
suspensions irradiated during 30 min in a configuration of OW_BL_R, varying the
reactor position with relation to the biconvex lens. The obtained results are
represented in terms of the pseudo-first order kinetic constant k in Figure 7.11 and
the discrete values are resumed in Table 7.2. A configuration of OW_BL_R with the
reactor fixed at distances lower than 5 cm was not possible to run due to physical
limitations on the approximation of the biconvex lens and the reactor holders.
The irradiated spectra reaching the inside of the photocatalytic reactor for the different
configurations studied were collected and the absolute irradiance is represented
together in Figure 7.11 and also gathered in Table 7.2.
Figure 7.11 – Decay of the kinetic constant on caffeine degradation with the
distance from the photo-reactor to the biconvex lens (black squares: pseudo-first
order kinetic constants – left axis; open circles: absolute irradiance – right axis).

Part V - A photocatalytic system to study the activity of powdered or immobilized catalysts
177
As expected, the photo-efficiency of the catalyst decayed with the distance to the
biconvex lens, and at a distance of 5 cm the kinetic constant is the maximum
(0.207 min-1), decreasing almost 70% (0.066 min-1) for a distance of 20 cm.
Table 7.2 – Pseudo-first order kinetic constants (k) and respective standard errors
for the photocatalytic degradation of caffeine using P25 suspensions with the reactor
positioned at different distances from the biconvex lens. Regression coefficients (r2)
and the absolute irradiance for each configuration is also presented.
Distance to the BL (cm) k (10-2 min-1) r2 Irradiance (W m-2)
5 20.7 ± 0.9 0.997 134
6.5 16.0 ± 1.4 0.988 105
10 14.1 ± 0.8 0.997 65
15 9.26 ± 0.68 0.987 40
20 6.57 ± 0.58 0.978 25
In the range of 10 to 20 cm distance, there is proportionality between the absolute
irradiance and the kinetic constant, as the experimental points are overlapped in
Figure 7.11. However, for closer distances the raise in the absolute irradiance is
higher than the gain on the photo-activity of the catalyst. This behaviour reflects that
at these conditions not all the photons irradiated over the photocatalyst in the solution
are consumed for the production of oxidative radicals. An intermediate position of
6.5 cm ensuring irradiation over the total inner volume of the reactor for maximum
photo-activity was also tested in order to set the point from which there is no more
proportionality and the results are gathered in Table 7.2. However, at these conditions
there is a portion of light which is still irradiated outside the reactor volume and so the
proportionality is no longer verified, as the experimental points for the absolute
irradiance and the respective kinetic constant did not overlap (not represented).
The optimum light power utilization is defined in the domain where these parameters
follow a proportionality [9, 11], which is observed in the range of 10 and 20 cm from
the biconvex lens with maximum photocatalyst activity for closer distances. For the
new setup and the studied conditions, the optimized reactor position is considered to
be at a fixed distance of 10 cm from the exposed reactor face to the biconvex lens
(corresponding to a distance of the reactor centred at 17 cm from the lamp) with
maximum photo-activity and minimizing the amount of photons which are not used in
the photocatalytic system. This configuration allows for the use of the optical filters

178
intersecting the light beam between the bifocal lens and the photo-reactor, so
experimental data in the presence or in the absence of the filters can be comparable
if the optimum HPK_OW_BL_R@17cm configuration is used.
7.2 Conclusions
The assembling and validation of a new setup was succeeded to improve some
drawbacks identified in the photocatalytic system used in the previous Chapter 6 with
the same cylindrical reactor, mainly regarding the efficiency on light usage for
photocatalytic studies due to an inadequacy of the dimensions between the lamp and
the photo-reactor. The arc of the HPK125W lamp is on scale with the small cylindrical
photocatalytic reactor and is enclosed in an aluminum box to allow stabilizing the
lamp intensity during the dark phase while adsorption-desorption equilibrium is
established or to create cycles of illuminated and dark periods during reaction. An
optical window separates the environment of the lamp from the photocatalytic reactor,
without changes on the emitted beam regarding wavelength distribution. Optical
accessories can be incorporated at very well defined settings and the light beam
focused on the photo-reactor using a biconvex lens in the wavelength range of
interest by using optical filters.
The absolute irradiance decreases inversely with the square of distance with the
highest contribution from the line at 365 nm with ca. 40% for the total intensity,
working under near-UV to visible light conditions. A long pass filter at 400 nm cuts
the emission line at 365 nm and visible light conditions can be created to test visible
active catalysts. The use of the biconvex lens maximizes the light irradiance over a
given surface area fixed inside the focal distance and therefore a configuration of
type HPK_OW_BL_R was set for the photocatalytic experiments, corresponding to
the light intersected by the optical window immediately followed by the biconvex lens
and with the photo-reactor positioned at a fixed distance.
Results on the photo-degradation of a caffeine solution with powder P25 in
suspensions showed a raise in 32% of the photo-activity in terms of the kinetic
constant for an increase on the absolute irradiance of ca. 67% when using the
biconvex lens. The activity of P25 catalyst was nullified with the application of the
long pass filter at 400 nm in a configuration of HPK_OW_BL_LP400_R since bare
TiO2 materials are not photocatalytically active under visible light conditions.

Part V - A photocatalytic system to study the activity of powdered or immobilized catalysts
179
Within the focal distance of the biconvex lens, the position of the reactor with relation
to this optical accessory was adjusted for optimal light power utilization, which is
defined in the domain where the absolute irradiance and the photo-activity, here in
terms of the kinetic constant, follow proportionality. At the studied conditions, the
optimal reactor position with relation to the biconvex lens was found to be with the
exposed reactor face at a fixed distance of 10 cm, corresponding to have the
photocatalytic reactor centred at 17 cm from the lamp, represented by the
configuration HPK_OW_BL_R@17cm. These settings come out with maximum
photo-activity minimizing the amount of photons which are not used in the
photocatalytic mechanism. This configuration also allows the use of the optical filters
placed between the biconvex lens and the photocatalytic reactor so comparable
results can be obtained for the optimized conditions.
By simulating similar irradiance conditions in a specific configuration, the new system
was compared with the previous one described in Section 2.2.2 of Chapter 2 through
the photocatalytic degradation of a caffeine solution with P25 deposited in the form
of film and the results were in conformity.
The developed setup is available to study photocatalytic degradation in aqueous
systems either with suspensions or with supported catalysts under different
irradiating conditions with optimized usage of the emitted light.
7.3 Experimental section
A high-pressure mercury vapour lamp HPK125W (Heraeus Noblelight) was used.
The transmittance of the borosilicate reactor reaches ca. 90% for λ > 340 nm, with a
cut-off of the main UV bands lower than 300 nm. An optical window with reference
210-1403 (EKSPLA) is used to allow the beam radiation to pass from the inside of
the aluminium box where the lamp is placed to the outside environment avoiding
external interferences and with high optical transmittance. For an optimized use of
the beam energy, making up for the light scattering outside the aluminium box, a
biconvex lens with reference 111-1418 (EKSPLA) is placed before the small
cylindrical reactor to converge the beam into the surface area of interest for the
photocatalytic process (see Figure 7.2 in Section 7.1.1). Long pass optical filters are
also available to provide conditions of visible light for wavelengths higher than 400 nm
or 450 nm (LP400 or LP450) with reference 64-697 and 64-698 (Edmund Optics),
respectively, which are of interest to discriminate pure visible active catalysts as a
180
good industrial promise for real applications under solar conditions. Light
transmittance of the optic accessories was recorded by UV-vis spectroscopy.
The commercial benchmark TiO2 powder from Evonik Degussa Corporation (P25)
consisting in a mixture of rutile and anatase phases, also tested in Chapter 6, was
used in preliminary photocatalytic experiments using this new setup.
7.3.1 Assessment of the irradiated spectra
The light spectra were collected with a UV-vis spectroradiometer USB2000+
(OceanOptics, USA). It is important to note that when the data is collected a
permanent oscillation is observed due to the properties of a light beam so the
recorded data is affected by the unavoidable wave effect. Though it can be balanced
by adjusting the acquisition time and scans to average parameters on the acquiring
moment, for a representative average of the absolute irradiance. In comparison
considerations, small differences must be however discussed given the inherent
abovementioned wave effect. Excepting when particular conditions are mentioned,
all the spectra were collected in the presence of the optical window. At the time of
acquisition the optical fiber was centered inside the photo-reactor.
7.3.2 Photocatalytic experiments
Caffeine photo-degradation experiments were conducted either over catalyst powder
suspensions or in supported films in a small cylindrical borosilicate reactor irradiated
by a high-pressure mercury vapor lamp HPK125, following the experimental
procedure described in Appendix B.1.
For suspensions, the catalyst load was optimized for a caffeine solution (20 mg L-1)
initial volume of 7 mL, with concentrations between 0.05 and 2.0 g L-1. The solution
was saturated in air during reaction to provide oxygen molecules involved in the
photocatalytic mechanism. Preliminary tests were conducted to establish the period
of dark absorption, which is sufficient with 15 min since no adsorption was observed
at the defined concentrations. The same period of time is needed to reach a constant
irradiance from the lamp and at this moment the optical window is opened (see Figure
7.2 in Section 7.1.1) and the reactor starts to be irradiated (t = 0; C = C0). An
experiment in the absence of catalyst was also performed as blank in order to
calculate the contribution from direct photolysis which is practically null. Reactions
with supported catalysts in the form of films deposited in thin glass slides were also
Part V - A photocatalytic system to study the activity of powdered or immobilized catalysts
181
performed at similar irradiating conditions to those referred in Chapter 6 with the
immersion lamp TQ150.
Samples were periodically withdrawn, centrifuged and analyzed by High
Performance Liquid Chromatography (HPLC) with a mobile phase consisting on
ultra-pure water and methanol. Caffeine concentration was determined at the
maximum absorption wavelength (274 nm). This absorbance was found to be linear
over the whole considered range (a maximum relative standard deviation of 2%).
7.4 References
[1] Kowalska E, Rau S. Photoreactors for Wastewater Treatment: A Review.
Recent Pat Engin. 2010; 4 (3):242-66.
[2] Chong MN, Jin B, Chow CWK, Saint C. Recent developments in
photocatalytic water treatment technology: A review. Water Res. 2010; 44 (10):2997-
3027.
[3] Ray AK, Beenackers AACM. Development of a new photocatalytic reactor
for water purification. Catal Today. 1998; 40 (1):73-83.
[4] Van Gerven T, Mul G, Moulijn J, Stankiewicz A. A review of intensification of
photocatalytic processes. Chem Eng Process. 2007; 46 (9 SPEC. ISS.):781-9.
[5] Gogate PR, Pandit AB. A review of imperative technologies for wastewater
treatment I: Oxidation technologies at ambient conditions. Adv Environ Res. 2004; 8
(3-4):501-51.
[6] Bosc F, Ayral A, Albouy P-A, Guizard C. A Simple Route for Low-
Temperature Synthesis of Mesoporous and Nanocrystalline Anatase Thin Films.
Chem Mater. 2003; 15 (12):2463-8.
[7] Dionysiou DD, Burbano AA, Suidan MT, Baudin I, Laîné J-M. Effect of
Oxygen in a Thin-Film Rotating Disk Photocatalytic Reactor. Environ Sci Technol.
2002; 36 (17):3834-43.
[8] Langlet M, Kim A, Audier M, Guillard C, Herrmann JM. Transparent
photocatalytic films deposited on polymer substrates from sol–gel processed titania
sols. Thin Solid Films. 2003; 429 (1–2):13-21.
[9] Herrmann JM. Heterogeneous photocatalysis: state of the art and present
applications In honor of Pr. R.L. Burwell Jr. (1912–2003), Former Head of Ipatieff

182
Laboratories, Northwestern University, Evanston (Ill). Top Catal. 2005; 34 (1-4):49-
65.
[10] Thakur RS, Chaudhary R, Singh C. Fundamentals and applications of the
photocatalytic treatment for the removal of industrial organic pollutants and effects of
operational parameters: A review. J Renew Sustain Energy. 2010; 2 (4):042701.
[11] Herrmann J-M. Heterogeneous photocatalysis: fundamentals and
applications to the removal of various types of aqueous pollutants. Catal Today. 1999;
53 (1):115-29.


Part VI
Final conclusions and future work

8 Final conclusions
Given the lack on visible light absorbance by pure TiO2 photocatalysts, the
incorporation of a carbon phase was performed using different carbon nanotubes
which were pre-treated with nitric acid for the creation of oxygen functionalities to
improve the mixing quality between the semiconductor and the carbon materials.
Photocatalytic tests were performed on the degradation of aqueous caffeine using
different types of TiO2 powders and the respective composites synthesized by a
simple hydration-dehydration methodology. A clear synergy was observed when
using a particular commercial TiO2 catalyst from Sigma-Aldrich and functionalized
MWCNTs with a composite photo-activity overcoming the one attained with the
benchmark P25 when supported in glass slides and used in the photocatalytic
experiments in the form of films. A customized photocatalytic setup was developed
to perform photocatalytic studies with an optimal usage of the emitted light by using
different optical accessories at very well defined settings in suspensions or supported
catalysts applications. The main conclusions drawn based on the overall
experimental data are here summarized.


Part VI – Final conclusions and future work
189
8.1 SWCNTs functionalization by hydrothermal oxidation
The surface chemistry of SWCNTs was finely tailored by a HNO3 hydrothermal
method and the degree of oxygen functionalization correlated with HNO3
concentration through a mathematical function, either for the total amount of groups
released as CO and CO2 or even for each particular oxygen functionality, after
deconvolution of the TPD-MS recorded spectra. The obtained mathematical functions
allow the prediction of the functionalization degree for each material at fixed HNO3
concentrations. Operating temperature and HNO3 concentration were identified as
the key parameters in the modification of the surface chemistry, suggesting that the
activation energy is controlling the functionalization process.
For the rapid assessment of the amount on high acidic carboxylic groups, which are
of particular interest on the synthesis of composites with TiO2 materials for
photocatalytic applications, water vapor adsorption-desorption was also applied and
the results correlated with those obtained with TPD-MS.
Raman spectroscopy on the functionalized SWCNTs reveals linear proportionality of
the defect-activated Raman mode intensity with the amount of surface groups
determined by TPD-MS and water adsorption-desorption measurements, allowing
quantitative correlations of the Raman results with the functionalization process.
Formation of amorphous carbon, which depends on the aggressiveness of the
oxidative conditions, was identified through water adsorption-desorption and Raman
measurements on thermally treated SWCNTs samples in air and argon atmosphere.
It was however concluded that a large fraction of the carboxylic groups formed upon
acidification remains attached on the SWCNTs surface rather than on the generated
carbonaceous fragments.
Porosity modifications were related with the aggressiveness of the oxidation
conditions in a way that the mesopore volume, originated from the packing of the
nanotube bundles, correlates inversely with the acidity of the treatment solution. The
micropore volume, corresponding to the interstitial space between individual
nanotubes, is shifted toward lower sizes. Both phenomena unveil more efficient
packing/organization of the nanotube bundles and of individual CNTs with the
introduction of oxygen functional groups.
Functionalization of SWCNTs can be effectively controlled and quantified and the
optimum conditions defined in relation to the desired physicochemical properties and
pore structure characteristics for specific applications.

190
8.2 MWCNTs functionalization by hydrothermal oxidation
The significantly lower costs for mass production of MWCNTs and the predictably
higher resistance for the post effects of oxidation treatments were the motivation to
reproduce the study of the controlled functionalization through hydrothermal HNO3
oxidation over two types of commercially available materials grown by catalytic
chemical vapor deposition with largely different morphological characteristics
(diameter and length). As observed in the previous study for SWCNTs, the
hydrothermal treatment results in the progressive introduction of oxygen
functionalities on MWCNTs surface correlated mathematically with the HNO3
concentration. Oxygen functionalities concentration and thermal stability was found
to be determined by morphologic characteristics of the CNTs, namely diameter and
length, as well as by the crystallinity and purity of the pristine materials.
With increasing HNO3 concentration, Raman spectroscopy showed a progressive
narrowing and reduction on the intensity of the defect activated MWCNTs Raman
bands, as result of the oxidation of the external carbon layers through hydrothermal
treatment. On the contrary, higher amounts of amorphous carbon were identified for
the MWCNTs treated under boiling acidic conditions, while producing comparable
amounts of oxygen functionalities consuming higher amounts of the oxidizing agent.
Pore structure analysis revealed different modifications depending on the
morphologic characteristics of the MWCNTs. For the short and thin tubes, a more
efficient packing and reorganization of the tube’s bundles resulted in a shift of the
mean pore size from the macro to the mesopore area, at variance with what
happened for the longer and thicker tubes where a small increase of the total pore
volume was the more pronounced effect.
In a comparable analysis over SWCNTs and MWCNTs studies with different
morphologies oxidized through hydrothermal and boiling HNO3 conditions, it was
possible to conclude that diameter and length do dictate the degree of surface
functionalization over CNTs, with higher stability and favored generation of carboxylic
acids for MWCNTs, in particular for smaller and thinner tubes. Hydrothermal
oxidation is a consistent and reliable methodology for CNTs pre-treatment when
precise surface requirements are known and needed for specific applications.
However, boiling acid oxidation is conducted at much lower temperatures than those
required for the creation of comparable amounts of oxygen functionalities with
hydrothermal treatment, at which the carboxylic groups starts to release, thus
ensuring the effective attachment of higher amounts of these groups which are of

Part VI – Final conclusions and future work
191
interest for further synthesis of CNT composite materials to be applied on
photocatalytic studies.
8.3 TiO2/CNT composites for photocatalytic degradation of caffeine
aqueous solutions
After having selected the type of CNTs and the adequate pre-treatment to further
prepare photocatalytic composites with enhanced activity in the near-UV to visible
region of the spectrum, three different types of TiO2 powders were used in
photo-degradation studies, one synthesized by a modified sol-gel method (SG) and
two commercial others obtained from Evonik Degussa Corporation (P25) and
Sigma-Aldrich (SA), in combination with MWCNTs functionalized through the nitric
acid boiling oxidation using a simple hydration-dehydration preparation method.
The surface area of TiO2 materials was increased after the inclusion of the carbon
phase, in proportion with the CNTs loading and especially in the case of composites
prepared with functionalized CNTs, based on N2 adsorption isotherms calculations.
Electron microscopy clarified the difference on the interaction between phases, being
very weak in the case of SG based composites with an observed segregation of
phases with big TiO2 agglomerates. Good distribution of TiO2 particles along the walls
of the CNTs was registered in the case of P25 and SA based composites, in particular
a developed interaction was shown for composites with the bigger SA nanoparticles
around which the CNTs were seen to be rolled up.
Despite the highest activity in caffeine photo-degradation observed for bare P25
catalyst, SA was the one which really took benefit with the addition of the carbon
phase, in accordance with characterization results, especially when functionalized
CNTs were used increasing its photo-efficiency progressively with the load of CNTs.
In fact, the photocatalytic mechanism seems to undergo a different pathway when
SA based catalysts are used in caffeine degradation with free radicals produced by
photoexcited electrons determining the highest activity for SA/CNTf-20, at variance
with a reaction mechanism governed by the generated holes in the case of all other
P25 and SG based catalysts.
With the motivation of seeking for a potential catalyst on visible applications at
industrial scale, the activity of catalysts in film form deposited on thin glass slides was
compared for P25 and the SA/CNTf-20 catalysts, with a ca. 50% higher photo-activity
for the latter in comparison to the benchmark P25. Further studies on the degradation

192
of methylene blue also confirmed the highest activity of SA/CNTf-20 composite film
with relation to the one of bare P25.
Raman spectroscopic complementary studies showed however that there was no
evidence of a real interphase for the composites prepared using the
hydration-dehydration methodology and that the photocatalytic results were simply
correlated with the quality of mixing between the semiconductor and the carbon
phases, which dictated the need to test composites prepared through other
methodologies. Sol-gel synthesis of TiO2 based composites including the carbon
phase previously functionalized during the ageing of the sol with a more consistent
interphase did show higher photo-activity than the benchmark P25 in the form of films
for methylene photo-degradation.
The obtained results showed promising routes to develop potential photocatalysts to
be applied at industrial scale in the form of films overcoming the customary lead of
the well-known P25 on the list of photocatalysts.
8.4 Assembling and validation of a customized photocatalytic system for
water remediation studies using caffeine as model compound
In the final stage of this work a new assembling was set to perform photocatalytic
studies and validated through optical characterization and with the first results on
caffeine degradation with the benchmark P25 catalyst in powder or film form. The
new photocatalytic system was developed with the purpose of improving some of the
lacks identified in the system where the first results were obtained (Chapter 6), in
particular the inefficient usage of the light due to inadequate dimensions of the arc of
the immersion lamp in comparison with those of the photocatalytic reactor.
A high pressure mercury vapour lamp with five main emission lines between 350 and
600 nm, with an arc in scale with the small cylindrical reactor, was enclosed inside
an aluminum box in an environment separated from the photo-reactor, communicated
through an optical window with high transmittance and no appreciable changes on
the emitted beam regarding wavelength distribution. A small window on the aluminum
box itself allows alternating between illuminated and dark cycles with the intensity
lamp perfectly stabilized due to having explicit separated environments.
The light beam can be directly focused on the reactor exposed surface in a specific
wavelength range of interest for the photocatalytic studies through the incorporation
of optical accessories like a biconvex lens and optical filters at very well defined

Part VI – Final conclusions and future work
193
settings. The configuration on photocatalytic experiments was set as using the
biconvex lens positioned immediately next to the optical window since its effect
maximizes the intensity of the emitted lines, raising in 32% the photo-activity of
powder P25 on caffeine degradation in comparison with a configuration with no use
of the biconvex lens. The application of the long pass filter at 400 nm nullified the
activity of bare P25, so the conditions are created to finely discriminate truly visible
active photocatalysts.
Optimum catalyst load was found to be 1.0 g L-1 and the reactor position was set to
work at 10 cm from the biconvex lens corresponding to a configuration with the
photo-reactor centred at 17 cm from the irradiation source. The criterion was based
on the proportionality between the variation in absolute irradiance and the
photo-activity, which implies optimal light power utilization, ensuring maximum
photo-activity and minimizing the amount of photons which are not used in the
photocatalytic mechanism.
The assembling of this customized setup allows performing photocatalytic studies in
aqueous systems using powdered or immobilized catalysts with optimized usage of
the emitted light, having the possibility of varying different parameters with accuracy
and evaluating their effects in the activity of the synthesized materials.


9 Future Work
Suggestions to progress on this line of investigations are here presented based on
the conclusions drawn through the overall work presented in this document, on the
experience of the research group where the work was developed and on other
reported scientific studies already published in related literature.


Part VI – Final conclusions and future work
197
9.1 Surface modification of CNTs
In the present work, liquid phase HNO3 oxidation was chosen as functionalization
methodology to include oxygen functionalities on the surface of the CNTs because it
requires simple means to be carried out resulting in a satisfactory density of surface
groups. Other oxidants can be explored both in liquid and gas phase for different
acidic strength conditions and find the most adequate treatment to each particular
morphology of the CNTs in use, either SWCNTs or MWCNTs with variable diameters
and lengths. Liquid oxidants commonly tested are HNO3, H2SO4, H2O2 and in some
cases are used in combination of more than one single oxidant, as is the case of
piranha solutions consisting in a mixture of H2SO4 and H2O2 with high acidic strength.
Oxygen functionalization of CNTs in gas phase has the advantage of no residual acid
wastes and can be performed under flow of HNO3 vapour, O2 or O3 and even
enhanced through UV irradiation.
Criterion to choose the most adequate functionalization method and respective
conditions must lay on the creation of the surface groups of interest with high thermal
stability and minimum amounts of amorphous carbon at the nanotubes surface, in
accordance to the previously discussed characterization results over treated CNTs
through TPD-MS, Raman spectroscopy and thermal analysis.
9.2 TiO2/CNT composites with visible response on photocatalytic water
treatment studies
Promising results were achieved with SA/CNTf-20 composite films showing highest
performance than those prepared with the benchmark P25 in oxidative
photo-degradation of different organics under near-UV to visible irradiation. Though,
Raman investigations unveil the lack on a real electronic interphase between the
semiconductor and the carbon phases for composites prepared through the applied
hydration-dehydration method. Further investigations should be developed on the
composite synthesis aiming the creation of an effective interphase evidenced by
Raman characterization.
Preparation methods involving the inclusion of the carbon phase during the formation
of the TiO2 matrix and concomitant functionalization of the CNTs could improve the
creation of an intimate electronic interphase with enhanced photo-activity in the
visible region. A first approach was anticipated in the group with the preparation of
TiO2/CNT composites through a modified sol-gel method in acidic media and the
198
results overcame those abovementioned obtained with the SA/CNTf-20 composite,
showing that this procedure is a good starting point to begin with. Different
parameters with presumable influence on the quality of the prepared composites can
be studied like the temperature and time of ageing and calcination.
As concluded during the progress of this work, namely for the hydrothermal
functionalization method, the successful creation of oxygen functionalities on the
CNTs surface is clearly activated by temperature. An improved methodology is here
proposed involving the concomitant CNTs functionalization and TiO2 lattice formation
through a hydrothermal process in acidic media to be carried out in an autoclave with
controlled temperature and pressure conditions. Different TiO2 precursors and
oxidants can be explored, either liquid or gaseous agents, in a broad range of
temperatures and pressures. Other similar carbon phases can also be studied like
graphene oxide which has already shown good photocatalytic results in combination
with TiO2 for visible light response.
Given the exponential functions found to correlate the amount of oxygen surface
groups with the concentration of HNO3, for the hydrothermal functionalization method
presented in this work, the photo-activity of the composites prepared through the here
suggested hydrothermal method should be checked for an analogue correlation with
the oxidant concentration.
After selected a composite with a good interphase between TiO2 and the carbon
phase, the catalyst should be tested in powder and film form under both UV and
visible irradiation and compared with the reference benchmark P25 in the oxidative
photo-degradation of different single organic molecules, mixtures to mimic real
effluents an in an advanced phase for industrial effluents remediation with
representative pollutants concentrations.
9.3 Customized photocatalytic setup
The assembling and validation of a customized photocatalytic system for water
remediation studies at laboratory scale was accomplished. Powdered or immobilized
catalysts developed towards visible response, to make up for the low fraction of UV
light at the earth’s surface, can be further tested in this system using long pass filters
ensuring visible light conditions with an optimization usage of the light beam. Further
investigations on the catalyst activity and stability are suggested to be performed in
continuous mode. The solution to be treated can be continuously pumped from a

Part VI – Final conclusions and future work
199
reservoir placed outside the black tunnel which covers the photo-reactor while
illuminated. Reutilization of the supported catalysts should be experienced seeking
for the lifetime of the catalyst and the release of catalyst particles into the solution,
which can be monitored through UV-Vis spectroscopy. Mechanical resistance of the
catalyst films is also an important issue on the sequence of these investigation.
In the case of particular studies requiring monochromatic irradiance, for instance
when monitoring the concentration of a particular organic within a mixture is needed,
bandpass filters can be applied. In fact, photo-degradation of mixtures and real
effluents are expected to be carried out in this new customized system.


Appendix


Appendix
203
Appendix A. MWCNTs functionalization by hydrothermal
oxidation
Appendix A.1 Identification and quantification of oxygen groups for NC3100
MWCNTs
In Figure A.1 are represented the deconvolution curves for each oxygen group
created at the surface of NC3100 after hydrothermal oxidation, which results are
commented in Section 5.1.1 of Chapter 5.
(a)
(b)
Figure A.1 - Deconvolution of TPD spectra for NC3100 treated with [HNO3] =
7.0 mol L-1 at boiling temperature: groups released as (a) CO and (b) CO2 (PH -
phenols; CAn - carboxylic anhydrides; CQ - carbonyl quinones; LC - lactones; CAc -
carboxylic acids; SA - strong acidic CAc; WA - weakly acidic CAc).
300 400 500 600 700 800 900 1000 1100 1200 13000.0
0.1
0.2
0.3
0.4
CQ
PH
CAn
CAcCO
(
mol g
-1 s
-1)
T (K)
300 400 500 600 700 800 900 1000 1100 1200 13000.0
0.1
0.2
0.3
CAn
LC
WA
CO
2 (
mo
l g
-1 s
-1)
T (K)
SA

204
Appendix A.2 Raman spectroscopy analysis of the oxidizing effects on
MWCNTs microstructure
Deconvolution through multi-peak fitting analysis of the Raman spectra at 514 nm is
shown in Figure A.2 for the acid treated NTX3 MWCNTs in comparison with their
pristine analogues. Comments on these results are included in Section 5.1.3 of
Chapter 5.
Figure A.2 - Multi-peak fitting analysis of the Raman spectra for the hydrothermally
(0.30 mol L-1) and boiling (7.0 mol L-1) acid treated NTX3 MWCNTs in comparison
with the pristine samples at 514.5 nm.
1000 1200 1400 1600 1800
0.0
0.2
0.4
0.6
0.8
1.0
2400 2800 3200
0.0
0.2
0.4
0.6
0.8
1.0
1000 1200 1400 1600 1800
0.0
0.2
0.4
0.6
0.8
1.0
2400 2800 3200
0.0
0.2
0.4
0.6
0.8
1.0
0.30 M NTX3
Norm
aliz
ed Inte
nsity to the G
band
Boiling 7.0 M NTX3
1000 1200 1400 1600 1800
0.0
0.2
0.4
0.6
0.8
1.0
Pristine NTX3
Raman shift (cm-1)
D
G
D'D3
D4
2400 2800 3200
0.0
0.2
0.4
0.6
0.8
1.0
Raman shift (cm-1)
G'
D+D'
2G

Appendix
205
Thin NC3100 MWCNTs hydrothermally functionalized with [HNO3] = 0.30 mol L-1 and
further exposed to isothermal oxidation in air at different temperatures show the
following Raman spectra represented in Figure A.3, which are analysed in
Section 5.1.3 of Chapter 5.
Figure A.3 - Raman spectra of the hydrothermally functionalized NC3100 MWCNTs
at [HNO3] = 0.30 mol L-1 after isothermal oxidation at 623 and 673 K.
1000 1200 1400 1600 2400 2800 3200
623 K
No
rma
lize
d Inte
nsity to th
e G
ba
nd
Raman shift (cm-1)
673 K
0.30 M NC3100
D
G
D'
G'
D+D'
2G
514.5 nm

206
Appendix B. Assembling and validation of a customized
photocatalytic system for water remediation studies using
caffeine as model compound
Appendix B.1 User manual for the customized photocatalytic setup
In a typical experiment, the user should follow the suggested experimental procedure
to perform photocatalytic oxidative degradation of organic pollutants in aqueous
solutions using powdered or immobilized catalysts:
1. Prepare the solution of the organic to be degraded in a volumetric flask.
2. Place the catalyst powder and the magnetic bar inside the cylindrical reactor. In
case of catalyst films, use the tweezers to place the thin glass slide in the bottom of
the reactor cover with the surface where the catalyst was deposited on turned upside
and fix it with a Viton® O-ring. Close the reactor after grease the glass cover and seal
it with Parafilm®.
3. Fill the reactor with 7 mL of the organic solution using a syringe and close the top
opening near the cover with Parafilm®.
4. Place the reactor centered on its support over the magnetic stirrer with the cover
in the opposite side of the lamp, according to what is represented in Figure 7.2.
5. Insert the needle connected to the air pump, after being plugged on, in the top
opening previously closed with Parafilm® to feed the solution with O2.
6. Turn on the magnetic stirrer set in a level to prevent bubbling outside the sampling
opening. The air flow is regulated for 200 cm3 min-1 but it can be further tuned with a
Hoffman clamp to avoid throwing liquid outside the photo-reactor. In case of powder
catalysts, regulating the speed of stirring must ensure a stable suspension.
7. Start counting the time for the dark phase (adsorption time should be determined
for each catalyst and organic pollutant, typically 15 or 30 min).
8. The lamp should be turned on by pulsing the button in the power supply (outside
the aluminum box) 10 minutes before ending the dark phase to get the intensity
stabilized. The fume hood should be working every time the lamp is turned on
avoiding accumulation of O3 generation.
Appendix
207
9. To block the light beam from reaching users eyes and skin, lean the black tunnel
on the aluminum box.
10. After completed the dark phase, take the first sample by displacing the black
tunnel, which corresponds to the initial concentration after adsorption (C0), used on
conversion calculations.
11. Open the window of the aluminum box to start irradiating the reactor and start to
count the time for the photocatalytic reaction regime.
12. Using the glasses for UV protection, take samples regularly by the free top
opening of the reactor. After sampling, always lean on back the black tunnel on the
aluminum box to avoid injuries caused by the emitted radiation.
13. At the end of the reaction time, close the window of the aluminum box and switch
off the lamp by pulsing the button in the power supply. The fume hood must be
working for at least 10 minutes more to eliminate the ozone produced during the lamp
operating.
14. Turn off the stirring and take off the syringe of the air feed. Unplug the air pump.
15. Open the reactor carefully and clean the grinding of the cover with a paper
embedded in acetone to remove the grease. In case of requiring the powder catalyst
recovering, use a paper filter to separate it from the solution. In case of the film
catalysts, use the tweezers to remove the thin glass slide after taking off the
Viton® O-ring. Dry the catalysts overnight at 110 ºC before storing.
16. Clean the photo-reactor with distilled water.
NOTES
N0. Do not get directly exposed to the HPK125W lamp. The lamp should only be
switched on inside the aluminum box placed inside the fume hood and light exposure
through the optical window should be always carried out using protection glasses.
N1. The set up should always be fixed with the four elements aligned: the
photo-reactor, the biconvex lens or other optical accessories and the optical window
in relation to the arc of the lamp (see Figure 7.2).
N2. Cover the top of the aluminum box with a perforated aluminum foil for light
protection and allow the dissipated heat produced by the lamp to be released.
208
N3. Samples should have to be withdrawn more regularly during the first period of
the photocatalytic reaction to provide more information about the kinetic profile for a
better further fitting to mathematic models.
N4. If samples are powder suspensions centrifugation is required to HPLC or UV-Vis
spectrophotometry analysis. The sampling volume should be no more than 700 µL if
centrifugation is required, for catalyst suspensions, and no more than 600 µL if
operating with catalyst films. Maximum of 5 samples are recommended.
N5. The placement of the biconvex lens was set just leaned on the aluminum box
next to the optical window, through which the light beam is irradiated, for focusing the
beam over the photo-reactor minimizing the loose of energy by light scattering.
Studies were performed to set the position of the photo-reactor and the configuration
was optimized to be centered at a distance of 17 cm from the lamp. The distance at
which the reactor is placed always refers to be measured from the center of the
reactor to the center of the lamp arc. The placement of every optical accessory should
be considered with reference to the irradiation source, defined as fixed at 0 cm (see
Figure 7.2), and mentioned as e.g. HPK_OW_BL_R@17 cm for the optimized
configuration. At the referred conditions, the irradiance reaching the inside of the
photo-reactor is ca. 65 W m-2.

Appendix
209
Appendix B.2 Comparison of photocatalytic results at similar irradiance
conditions obtained with TQ and HPK lamps
To compare the photocatalytic systems with TQ and HPK lamps and the small
cylindrical reactor, caffeine degradation with the benchmark P25 supported in glass
slides was performed in the new system, at the same conditions described in
Section 6.1.2.4 of Chapter 6. To mimic the absolute irradiance at which the reaction
occurred spectral conditions were compared. At the same distance from the
irradiation source, the absolute irradiance recorded for HPK is always higher than
that of the TQ lamp, as shown in Figure B.1. However, in the new setup, due to the
housing of the lamp in a separated environment inside the aluminium box (see
Section 7.1.1 on Chapter 7), the placement of the reactor cannot be done at the same
distance that was performed with the TQ lamp. The closest position for the
photo-reactor in the new system is at 12 cm from the lamp and, as shown in
Figure B.1, the irradiance for that conditions is ca. 90 W m-2. Therefore the biconvex
lens was used to make up for the difference in the irradiance.
Figure B.1 – Irradiance for TQ and HPK lamps
varying with the distance.
The configuration of OW_BL_R@12cm was found to have a spectrum comparable
to that obtained with the TQ lamp for the experimental conditions at which the reaction
was performed in Chapter 6, corresponding to a distance from the photo-reactor to
0
30
60
90
120
150
7 8 9 10 11 12 13
irra
dia
nce
(W
m-2
)
distance (cm)
HPK lamp
TQ lamp
biconvex lens
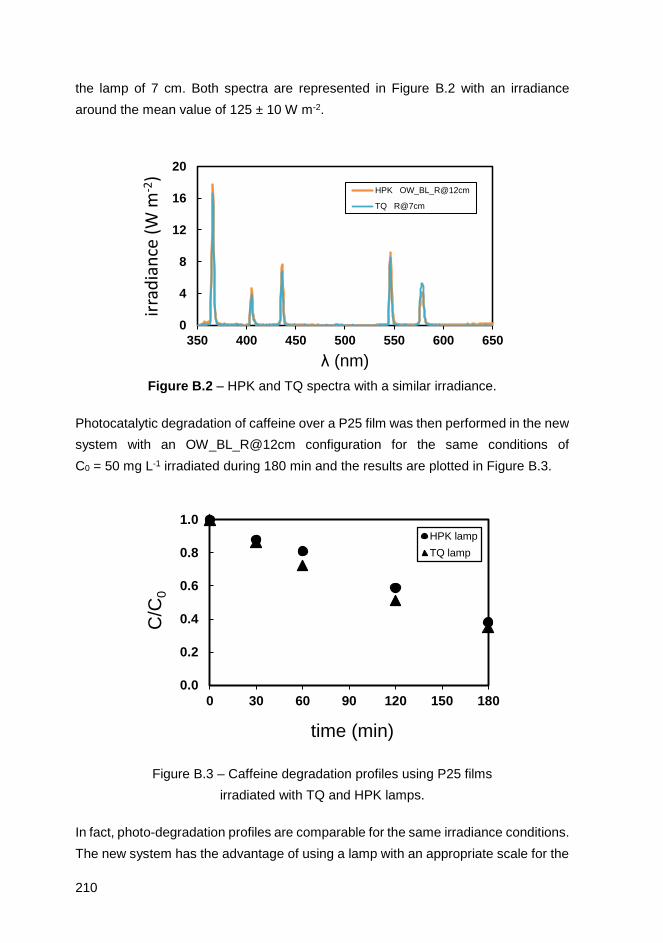
210
the lamp of 7 cm. Both spectra are represented in Figure B.2 with an irradiance
around the mean value of 125 ± 10 W m-2.
Figure B.2 – HPK and TQ spectra with a similar irradiance.
Photocatalytic degradation of caffeine over a P25 film was then performed in the new
system with an OW_BL_R@12cm configuration for the same conditions of
C0 = 50 mg L-1 irradiated during 180 min and the results are plotted in Figure B.3.
Figure B.3 – Caffeine degradation profiles using P25 films
irradiated with TQ and HPK lamps.
In fact, photo-degradation profiles are comparable for the same irradiance conditions.
The new system has the advantage of using a lamp with an appropriate scale for the
0
4
8
12
16
20
350 400 450 500 550 600 650
irra
dia
nce
(W
m-2
)
λ (nm)
HPK OW_BL_R@12cm
TQ R@7cm
0.0
0.2
0.4
0.6
0.8
1.0
0 30 60 90 120 150 180
C/C
0
time (min)
HPK lamp
TQ lamp

Appendix
211
small photocatalytic reactor, housed in a closed box with an optical window which
separates the environment of the lamp from the reactor without affecting the emitted
beam on wavelength distribution. The lamp intensity can be then stabilized inside the
box with the window closed and create dark and illuminated cycles by opening or
closing the optical window allowing the reactor to be in dark or irradiated conditions.
Different optical accessories can be incorporated at very well defined settings to
optimize the incidence of the light beam in the photocatalytic reactor with the spectral
ranges required for the objectives of each particular study.

213
List of Publications
Papers in international scientific periodicals with referees
Likodimos, V., Steriotis, T.A., Papageorgiou , S.K., Romanos, G. E., Marques,
R.R.N., Rocha, R.P., Faria, J.L., Pereira, M.F.R., Figueiredo, J.L., Silva, A.M.T.,
Falaras, P. Controlled surface functionalization of multiwall carbon nanotubes by
HNO3 hydrothermal oxidation. Carbon 69 (2014) 311.
Sampaio, M.J., Marques, R.R.N., Tavares, P.B., Faria, J.L., Silva, A.M.T., Silva, C.G.
Tailoring the properties of immobilized titanium dioxide/carbon nanotube composites
for photocatalytic water treatment. Journal of Environmental Chemical Engineering 1
(2013) 945.
Miranda, S.M., Romanos, G.Em., Likodimos, V., Marques, R.R.N., Favvas, E.P.,
Katsaros, F.K., Stefanopoulos, K.L., Vilar, V.J.P., Faria, J.L., Falaras, P., Silva,
A.M.T. Pore structure, interface properties and photocatalytic efficiency of
hydration/dehydration derived TiO2/CNT composites. Applied Catalysis B:
Environmental 147 (2014) 65.
Marques, R.R.N., Carrapiço, P.M., Dražić, G., Silva, C.G., Faria, J.L., Silva, A.M.T.
Photocatalytic degradation of caffeine: Developing solutions for emerging pollutants.
Catalysis Today 209 (2013) 108.
Silva, C.G., Monteiro, J., Marques, R.R.N., Silva, A.M.T., Martínez, C., Canle L., M.
and Faria, J.L. Photochemical and photocatalytic degradation of trans-resveratrol.
Photochemical and Photobiological Sciences 12 (2013) 638.
Romanos, G.E., Likodimos, V., Marques, R.R.N., Steriotis, T.A., Papageorgiou, S.K.,
Faria, J.L., Figueiredo, J.L., Silva, A.M.T., Falaras, P. Controlling and Quantifying
Oxygen Functionalities on Hydrothermally and Thermally Treated Single-Wall
Carbon Nanotubes. The Journal of Physical Chemistry C 115 (2011) 8534.
Sampaio, M.J., Silva, C.G., Marques, R.R.N., Silva, A.M.T., Faria, J.L. Carbon
nanotube-TiO2 thin films for photocatalytic applications. Catalysis Today 161 (2011)
91.
Marques, R.R.N., Machado, B.F., Faria, J.L., Silva, A.M.T. Controlled generation of
oxygen functionalities on the surface of single-walled carbon nanotubes by HNO3
hydrothermal oxidation. Carbon 48 (2010) 1515.
Recommended