Embed Size (px)
Citation preview
TiO2 Coatings forPhotocatalytic Applications
Processed by Ink-Jet Printing
Melis Arin
Promotor : Prof. Dr. I. Van Driessche
Copromotor : Dr. P. Lommens
Dissertation submitted in fulfillment of the requirements for thedegree of Doctor of Science: Chemistry
Department of Inorganic and Physical ChemistryFaculty of Sciences
2013

Contents
Outline 1
1 Introduction 51.1 Why TiO2? . . . . . . . . . . . . . . . . . . . . . . . 6
1.1.1 Structural properties . . . . . . . . . . . . . 61.1.2 Photon-induced properties . . . . . . . . . 81.1.3 TiO2 nanoparticles . . . . . . . . . . . . . . 12
1.2 General applications . . . . . . . . . . . . . . . . . 131.2.1 Superhydrophilicity . . . . . . . . . . . . . 151.2.2 Self-cleaning . . . . . . . . . . . . . . . . . . 161.2.3 Water and air purification . . . . . . . . . . 171.2.4 Solar water splitting . . . . . . . . . . . . . 191.2.5 Dye sensitized solar cells . . . . . . . . . . 20
References . . . . . . . . . . . . . . . . . . . . . . . . . . 22
2 TiO2 Synthesis and Ink-Jet Printing 272.1 Sol-gel processing . . . . . . . . . . . . . . . . . . . 282.2 Synthesis of nanoparticles . . . . . . . . . . . . . . 32
2.2.1 Sol-gel method . . . . . . . . . . . . . . . . 342.2.2 Hydro/solvo-thermal method . . . . . . . 342.2.3 Microwave-assisted hydrothermal method 362.2.4 Oxidation methods . . . . . . . . . . . . . . 412.2.5 Physical deposition methods . . . . . . . . 42
2.3 Ink-jet printing . . . . . . . . . . . . . . . . . . . . 43References . . . . . . . . . . . . . . . . . . . . . . . . . . 51
ii CONTENTS
3 Ink-Jet Printing from TiO2 Aqueous Solutions 573.1 Introduction . . . . . . . . . . . . . . . . . . . . . . 583.2 Synthesis of aqueous TiO2 precursor solutions . . 59
3.2.1 Preparation . . . . . . . . . . . . . . . . . . 593.2.2 Transition from solution to gel . . . . . . . 603.2.3 Thermal treatment . . . . . . . . . . . . . . 61
3.3 Ink-jet printing . . . . . . . . . . . . . . . . . . . . 623.4 Characterization of the layers . . . . . . . . . . . . 65
3.4.1 Crystallographic characterization . . . . . 653.4.2 Morphology . . . . . . . . . . . . . . . . . . 673.4.3 Transparency and thickness . . . . . . . . . 68
3.5 Conclusions . . . . . . . . . . . . . . . . . . . . . . 71References . . . . . . . . . . . . . . . . . . . . . . . . . . 72
4 Synthesis of Nanoparticle Containing Suspensions 754.1 Introduction . . . . . . . . . . . . . . . . . . . . . . 764.2 Aqueous TiO2 suspensions . . . . . . . . . . . . . . 78
4.2.1 Solution synthesis . . . . . . . . . . . . . . 784.2.2 Analysis of precursor solutions . . . . . . . 794.2.3 Analysis of nanoparticle inks . . . . . . . . 814.2.4 TiO2 solid content . . . . . . . . . . . . . . . 874.2.5 Crystallinity . . . . . . . . . . . . . . . . . . 87
4.3 TiO2 films prepared from hydrothermally treatedsuspensions . . . . . . . . . . . . . . . . . . . . . . 92
4.4 Conclusions . . . . . . . . . . . . . . . . . . . . . . 95References . . . . . . . . . . . . . . . . . . . . . . . . . . 96
5 Ink-Jet Printing of TiO2 Nanoparticle Suspensions 1015.1 Introduction . . . . . . . . . . . . . . . . . . . . . . 1025.2 Aqueous TiO2 Suspensions . . . . . . . . . . . . . 103
5.2.1 Rheological parameters for jettability . . . 1045.3 Ink-jet printing . . . . . . . . . . . . . . . . . . . . 1055.4 Layer characterization . . . . . . . . . . . . . . . . 109
5.4.1 Thickness and morphology . . . . . . . . . 1095.4.2 Transparency . . . . . . . . . . . . . . . . . 113
5.5 Conclusions . . . . . . . . . . . . . . . . . . . . . . 116
CONTENTS iii
References . . . . . . . . . . . . . . . . . . . . . . . . . . 117
6 Photocatalytic Activity of TiO2 Layers 1196.1 Introduction . . . . . . . . . . . . . . . . . . . . . . 1206.2 Photocatalytic Activity of TiO2 Layers . . . . . . . 121
6.2.1 TiO2 layers from aqueous precursor solutions1216.2.2 TiO2 layers from aqueous nanoparticle con-
taining sols . . . . . . . . . . . . . . . . . . 1246.3 Conclusion . . . . . . . . . . . . . . . . . . . . . . . 129References . . . . . . . . . . . . . . . . . . . . . . . . . . 130
7 Durability and Efficiency of Ink-Jet printed TiO2 Coat-ings 1337.1 Introduction . . . . . . . . . . . . . . . . . . . . . . 1347.2 Anti-Bacterial Test . . . . . . . . . . . . . . . . . . . 136
7.2.1 Test Setup . . . . . . . . . . . . . . . . . . . 1367.2.2 Results . . . . . . . . . . . . . . . . . . . . . 138
7.3 Oil Drop Test . . . . . . . . . . . . . . . . . . . . . . 1407.3.1 Test Setup . . . . . . . . . . . . . . . . . . . 1407.3.2 Results . . . . . . . . . . . . . . . . . . . . . 141
7.4 Artificial Weathering . . . . . . . . . . . . . . . . . 1427.4.1 Test Setup . . . . . . . . . . . . . . . . . . . 1427.4.2 Results . . . . . . . . . . . . . . . . . . . . . 143
7.5 Chemical Resistance . . . . . . . . . . . . . . . . . 1487.5.1 Test Setup . . . . . . . . . . . . . . . . . . . 1487.5.2 Results . . . . . . . . . . . . . . . . . . . . . 148
7.6 Conclusions . . . . . . . . . . . . . . . . . . . . . . 150References . . . . . . . . . . . . . . . . . . . . . . . . . . 151
A Glossary 153A.1 List of symbols . . . . . . . . . . . . . . . . . . . . 154A.2 List of abbreviations . . . . . . . . . . . . . . . . . 155
B Instrumentation 157B.1 Rheology . . . . . . . . . . . . . . . . . . . . . . . . 157B.2 Particle sizing . . . . . . . . . . . . . . . . . . . . . 157B.3 Elemental analysis . . . . . . . . . . . . . . . . . . 160

iv CONTENTS
B.4 Microwave synthesis . . . . . . . . . . . . . . . . . 160B.5 Structural characterization . . . . . . . . . . . . . . 161B.6 Thin film analysis . . . . . . . . . . . . . . . . . . . 161B.7 Photocatalytic activity tests . . . . . . . . . . . . . 162
Summary 165
Samenvatting 171
Publications and presentations 177
Acknowledgements 181

Outline
During the past decade, rapid advances in materials science haveled to significant progress in environmental remediation and re-newable energy technologies such as photocatalytic oxidation,adsorption/separation processing, solar cells, fuel cells, and bio-fuels. The design and creation of new materials and substanceschemically modified from the molecular and atomic levels to sizeson the nanoscale promise significantly enhanced functions forenvironmental applications. Soft processing of ceramics has beendeveloped and led a way for a new generation of low expendi-ture of energy in chemical engineering. The possibility to fabri-cate a variety of materials from solutions has been demonstratedalready, but for the design of innovative materials processing,particularly when rapid and environmentally friendly routes arepreferred, significant industrial progress is still needed. Devel-opment of energy efficient and environmentally friendly chemi-cal solution deposition (CSD) methods, control over the kineticsof the process, fundamental understanding of particle assemblyin solution and development of appropriate modified processingtechniques are some of the innovative issues needed.
Thin layers and coatings can be specifically tailored for usein innovative applications and/or give added value to existingproducts. As a semiconductor and with its high refractive index,TiO2 coatings can be used in numerous applications. As a thinfilm, it is widely studied as a photocatalyst, gas sensing agentand active component in dye sentisized solar cells. Moreover,

2 Outline
thin TiO2 coatings of good quality are transparent and colorlessand can be used to create self-cleaning, antifogging and superhy-drophilic surfaces. Currently, photocatalytically active TiO2 coat-ings for commercial purposes are typically obtained via chemicalvapor deposition. However, TiO2 films prepared by chemical so-lution deposition methods are attracting more and more atten-tion, because of the relatively simple production of high purityfilms at low cost and high scalability.
The objective of this work is to study the properties of thinTiO2 films that are prepared from environmentally-benign aque-ous precursor solutions and nanoparticle containing suspensionsusing chemical solution deposition (CSD) approaches. This canpresent a viable alternative to the currently used vacuum deposi-tion techniques, in terms of scaling and ease of production. Elim-inating the synthesis in organic media where hydrolysis is in-duced by adding small amounts of water, and focusing on wa-ter based precursor synthesis using environmentally benign lig-ands, complies with industrial demands. Obtaining suspensionswith preformed nanoparticles using coordination chemistry andbottom-up synthesis, could make it possible to process the thinfilms at lower temperatures, thereby allowing the possibility toapply coatings on heat sensitive sustrates.
Ink-jet printing is an emerging technology, showing advan-tages over currently used CSD techniques such as spray coating,dip-coating and spin-coating, in terms of less material usage andhigher resolution. In this work, the rheology of our solutions andsuspensions are studied for jettability in order to be used in ink-jet printing. For the suspensions, the obtained nanoparticles arestudied in respect of particle size, crystallinity and distribution.The influence of synthesis conditions such as used ligands, pHlevels, hydrothermal temperature and processing times are stud-ied in detail. These solutions and suspensions are then depositedby ink-jet printing using elecromagnetic and piezoelectric noz-zles on microscope glass substrates. Following this, heat treat-ments are applied in order to obtain crystalline TiO2 thin films.Films are characterized and examined carefully in terms of their
Outline 3
surface properties, crystallinity, transparency, as well as photo-catalytic acitvity and resistance to outdoor environment.
This work combines simplicity, low cost and high quality ofthe final products with the aim of preparing thin, transparent andphotocatalytically active TiO2 films that can be transfered to theindustry in order to be used for their self-sterilizing, self-cleaningand anti-fogging properties, upon exposure to surrounding light.The simplicity and industrial advantages lie within the water-based synthesis of the solutions and nanoparticle containing sus-pensions, deposition by CSD technique and low temperature heat-ing of the layers. Thus, the outcome should be (a) stable filmswithout surface imperfections, (b) transparent films, (c) films thatdo not affect the optical or/and mechanical characteristics of thecoated substrate, and (d) photocatalytically active films.
Chapters 1 and 2 describe the general characteristics of TiO2and the theory behind the processing routes applied.
In chapter 3, the synthesis route used to prepare TiO2 aque-ous solutions is described, together with elecromagnetic ink-jetprinting trials. Following the heat treatments, the resulting lay-ers were characterized in respect of morphology and crystallog-raphy.
The synthesis of different sols using microwave irradiation isdescribed in chapter 4. The effects of introducing different com-plexing agents, change in pH levels, different microwave treat-ment dwell times and temperatures related to the size and char-acteristics of the nanoparticles are investigated thoroughly.
Following chapter 4, in chapter 5, we select several optimizedsols and test them for jettability using different kinds of ink-jetprinting systems. The sols are printed on glass substrates usinga piezoelectric ink-jet printer system and the layers are heated atlow temperatures. The obtained layers are characterized in orderto make comparison for transparency and stability.
In chapter 6, the photocatalytic activity of the layers is com-pared with that of commercially available photoactive layers.
In the last chapter of this work, the prepared layers are testedfor outdoor environments. With weather simulation, antibacte-

4 Outline
rial and corrosion tests, the stability of the layers in order to usethem in real life could be determined.

1Introduction
This thesis deals with the synthesis, chracterization, and process-ing of TiO2 films. A theoretical part discusses the properties ofTiO2, followed by an overview of its most important preparationtechniques and applications. This chapter ends with an outlineof the research presented in this work.
6 Introduction
1.1 Why TiO2?
1.1.1 Structural properties
Titanium (Ti) is the world’s fourth most abundant metal and ninthmost abundant element, constituting about 0.63% of the Earth’scrust. It is a transition metal with atomic number 22, which islight, strong, lustrous, and corrosion-resistant. In 1791, ReverendWilliam Gregor was the first to recognize the presence of a newelement in ilmenite, and several years later, the German chemistMartin Heinrich Klaporth discovered it again in rutile and namedit after ”Titans”, who are mythological first sons of the goddessEarth in Greek mythology [1]. Martin H. Klaporth was not able tomake the pure element of titanium, he was only able to produceTiO2 or Titanium Dioxide.
The naturally occurring oxides can be mined and serve as asource for commercial titanium. The metal can also be minedfrom other minerals such as ilmenite or leucoxene ores, or oneof the purest forms, rutile beach sand. Star saphires and rubiesget their asterism from rutile impurities present in them. TiO2 isfound as a mineral in magmatic rocks and hydrothermal veins,as well as weathering rims on perovskite. It also forms lamel-lae in other minerals [2]. Although several polymorphs havebeen identified for titanium dioxide, it crystallizes in three ma-jor different structures; rutile (tetragonal), anatase (tetragonal),and brookite (orthorhombic) which is one of the several associ-ated with higher pressures [1, 3–5]. Rutile, anatase and brookiteall contain six coordinated titanium. The crystal structures of theTiO2 phases are shown in Figure 1.1.
The anatase polymorph of TiO2 is one of its two metastablephases together with the brookite phase. For calcination pro-cesses above 700◦C all anatase structures become rutile. Someauthors also found that for phase transition from anatase to ru-tile, a heat treatment at 500◦C would be enough [6]. The anatasestructure is tetragonal, with two TiO2 formula units per primitivecell. The lattice parameters are: a = b = 3.7710 A and c = 9.430 Awith c/a ratio of 2.5134 [7].

1.1 Why TiO2? 7
Figure 1.1: Crystal structures of (a) anatase (tetragonal 4/m 2/m2/m, space group I41/amd with 2 formula units per primitivecell), (b) rutile (tetragonal 4/m 2/m 2/m, space group 136, sur-rounded by an octahedron of 6 oxygen atoms), and (c) brookite(orthorhombic 2/m 2/m 2/m, space group Pcab with 8 formulaunits per unit cell) [1].
Rutile is the thermodynamically most stable modification (ca.between 5.02 and 11.723 kJ/mol, more stable than anatase). Asstated, anatase and brookite which are metastable phases, bothconvert to rutile when submitting the material at temperaturesabove 700◦C in pure state, when no additives have been added[6, 8, 9]. The conversion to rutile is irreversible and is highly de-pendent upon the method of preparation and particle size, par-ticularly when the material is nanoparticulate [10, 11]. Its unitcell contains Ti atoms that occupy the center of a surroundingcore composed of six oxygen atoms placed approximately at thecorners of a quasi-regular octahedron. The lattice parameters cor-respond now to a = b = 4.5933 A and c = 2.9592 A with c/a ratio of0.6442 [7].
The brookite structure is more complicated and has a largercell volume than the other two. The transition of brookite to ru-tile has been observed to occur both directly and via the anataselattice [12, 13]. The unit cell is composed of eight formula unitsof TiO2 and is formed by edge sharing TiO2 octahedra, similar torutile and anatase. Brookite belongs to the orthorhombic crystalsystem with space group Pbca and the lattice parameters corre-spond to a = 5.4558 A, b = 9.1819 A and c = 5.1429 A with c/a ratio
8 Introduction
of 0.6442 [7]. By definition, the brookite structure is of lower sym-metry than its TiO2 countermorphs, the dimensions of the unitcell are unequal [14]. Also the Ti-O bond lengths vary more thanin the rutile or anatase phases, as do the O-Ti-O bond angles [15].
1.1.2 Photon-induced properties
A semiconductor is a solid whose electrical conductivity is in be-tween that of a conductor and that of an insulator, and can becontrolled over a wide range, either permanently or dynamically.Photons falling on a semiconductor, can create electronhole pairs,and at a junction between two different materials, this effect canset up an electric potential difference across the interface [16].TiO2, as a semiconductor, is characterized by the presence of pho-toinduced phenomena. The photoinduced processes originatefrom the semiconductor band gap. Starting in the late 1960s, thestory began with TiO2 and light, and photoelectrochemical solarenergy conversion, and then shifted into the area of environmen-tal photocatalysis and photo-induced hydrophilicity, and mostrecently into the commercialization of TiO2-based photocatalytic
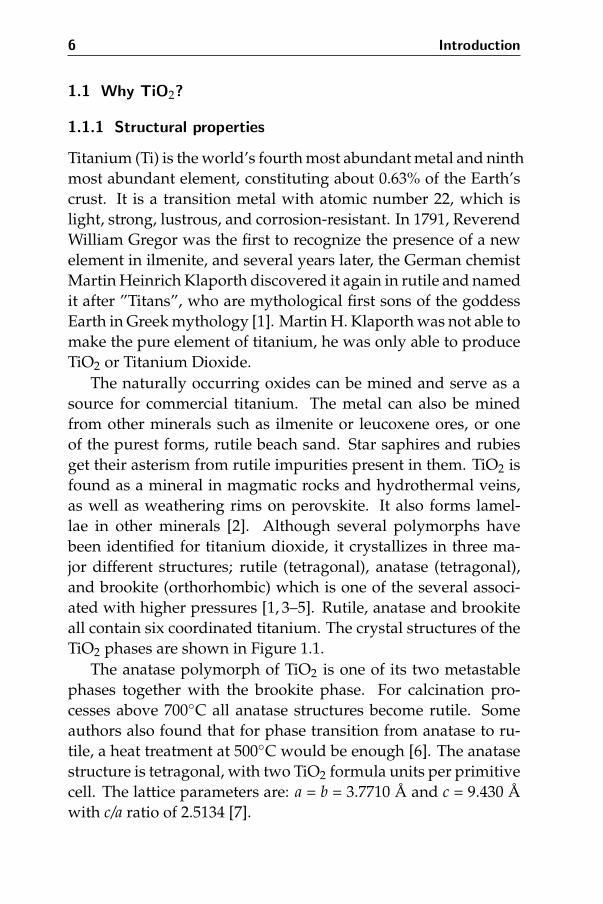
Figure 1.2: Change in the electronic structure of a semiconductorcompound as the number N of monomeric units present increasesfrom unity to clusters of more than 2000 [18].
1.1 Why TiO2? 9
products [17].
In the band electronic structure of a semiconductor, the high-est occupied band (the valence band) and lowest unoccupied en-ergy band (the conduction band) are separated by a region that iswithout any energy level in a perfect crystal, which is called bandgap (∆E) [19]. This is displayed in Figure 1.2. Smaller crystallitedimension of a semiconductor particle yields a larger band gap.Since the band gap is size dependant, it can create all kinds ofelectrical and optical properties that can affect the photocatalyticactivity [18].
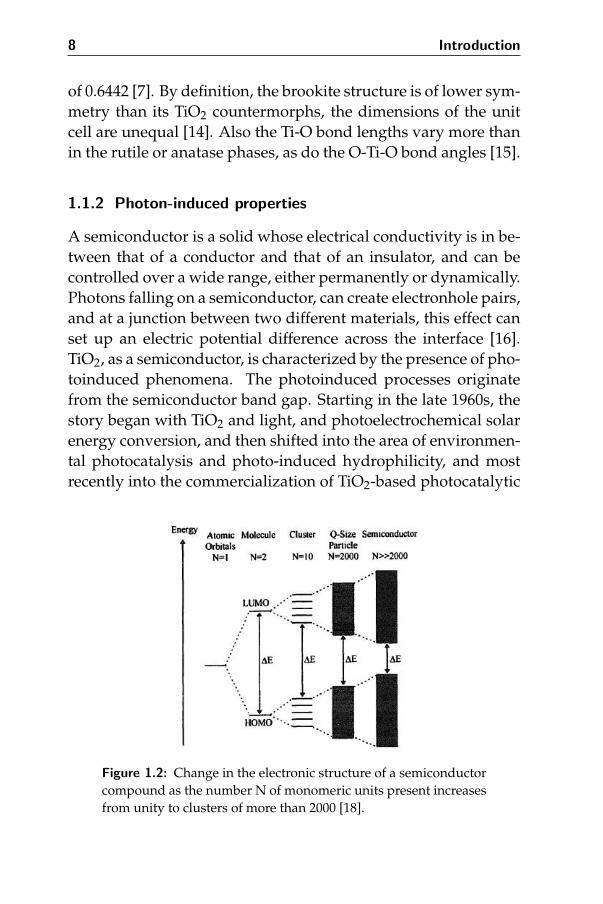
The basic principle of a photocatalytic reaction, and in partic-ular that of a semiconductor, is quite straightforward. The va-lence band of TiO2 is composed of the 2p orbitals of oxygen hy-bridized with the 3d orbitals of titanium, while the conductionband contains only the 3d orbitals of titanium. Absorption of in-coming photons whose energy is equal to or greater than their∆E, results in the excitation of an electron e− from the valenceband to the conduction band, with the creation of electron-hole
Figure 1.3: Energy band diagram of a spherical titania parti-cle. When illuminated with light energy higher than the bandgap,electrons and holes are formed in a semiconductor and are capableof initiating chemical reactions (Eg=∆E) [20].

10 Introduction
pairs which parts into free photoelectrons in the conduction bandand photoholes in the valence band (Fig. 1.3).
The conduction band electrons and the valence band holes,i.e. unoccupied states in the valence band, contribute to the elec-trical conductivity. It must be mentioned that the holes them-selves don’t move, but instead a neighbouring electron can moveto fill the vacancy. In this way, the holes seem to move, and theybehave as they were positively charged particles. These chargecarriers migrate to the surface and react with molecules adsorbedon this surface, thus decomposing them.
In 1972, Fujishima and Honda were the first who emphasizedthe semiconductor properties of TiO2 by studying the photon in-duced charge separation for the first time [21]. In 1977, Frankand Bard examined the possibilities of using TiO2 to decomposecyanide in water [22]. Following this, there has been an increas-ing interest in environmental applications of TiO2 [18, 23] whereTiO2 is used for its photocatalytic behaviour.
The band gap for titania is about 3.2 eV, which correspondsto the UV region of the electromagnetic spectrum. Anatase TiO2,which is the most photoactive phase of TiO2, only absorbs ultra-violet light with wavelengths shorter than 380 nm [17], as shownin Fig. 1.4. The inability of titania to make use of visible light,limits its efficiency and flexibility since a large part of the solarlight is left unused. Therefore, the basic material is only func-tional for outdoor use. One of the major challenges for the sci-entific community involved is to increase the spectral sensitivityof photocatalysts to visible light,which composes the largest partof solar radiation. Research is ongoing to make use of the visiblepart of solar light by introducing noble metal particles into the ti-tania photocatalyst [24–30]. Doping with metal ions (for exampleCr3+, Fe3+) creates local energy levels within the band gap of thephotocatalyst, with corresponding absorption bands lying in thevisible spectral range [31, 32]. Photoexcitation of such impuritiesshould lead to the generation of free charge carriers to initiatesurface chemical processes. Doping with non-metal atoms, suchas N, S and C can help band gap narrowing due to mixing of the

1.1 Why TiO2? 11
Figure 1.4: Spectra of AM 1.5G sunlight (solid line) and a fluores-cent lamp (dashed line), and absorption spectrum of anatase filmphotocatalyst (dotted line) [17] with corresponding intensity vs.wavelength plot.
p states of the dopants with oxygen 2p states forming the valenceband of TiO2 [33].
It is very straightforward that the photocatalytic activity ofTiO2 depends on the ability of the catalyst to create electronholepairs. The electrons in the conduction band facilitate reductionof electron acceptors and the holes facilitate oxidation of electrondonors. These processes generate free radicals or intermediatespecies such as hydroxyl radicals (•OH) and superoxides (O2•−),which can undergo secondary reactions. Yet, these electron-holepairs can also recombine nonradiatively or radiatively (dissipat-ing the input energy as heat). Recombination reactions occurvery frequently and in a high rate, leading to recombination of90% of the carriers prior to reaching the surface [34]. The compe-tition between these processes determines the overall efficiencyfor various applications of TiO2 nanoparticles. This, of course, isa major drawback of titania as a photocatalyst, which can be sur-pressed by the sensitization of the catalyst by noble metals [35].
12 Introduction
Examples of the photo-generation of radicals in atmosphericand aqueous environments are given in the following reactions:
TiO2 + hν ⇀↽ e− + h+ (1.1)
h+ + H2Oabsorbed ⇀↽ H+ +• OH (1.2)
h+ + OH−absorbed⇀↽• OH (1.3)
e− + O2,absorbed ⇀↽• O−2 (1.4)
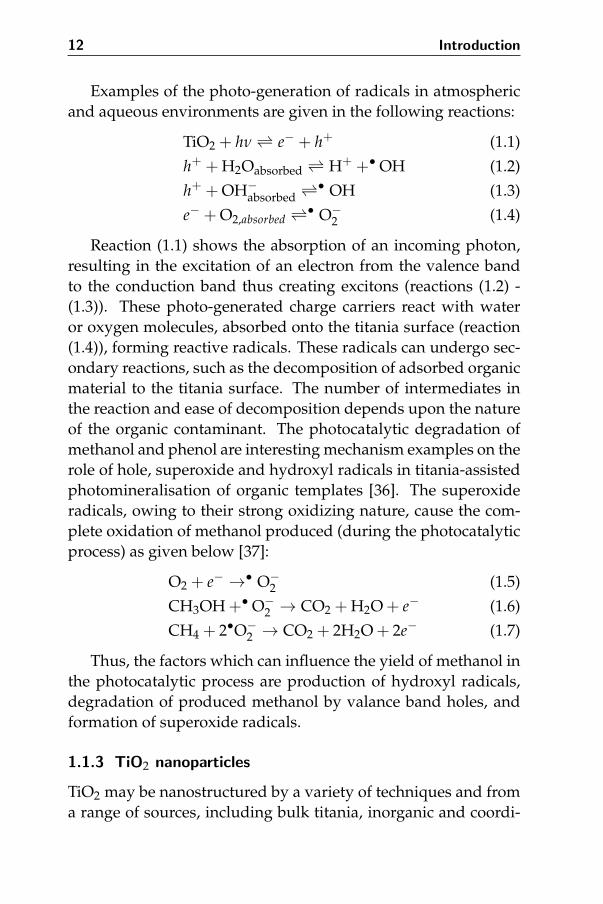
Reaction (1.1) shows the absorption of an incoming photon,resulting in the excitation of an electron from the valence bandto the conduction band thus creating excitons (reactions (1.2) -(1.3)). These photo-generated charge carriers react with wateror oxygen molecules, absorbed onto the titania surface (reaction(1.4)), forming reactive radicals. These radicals can undergo sec-ondary reactions, such as the decomposition of adsorbed organicmaterial to the titania surface. The number of intermediates inthe reaction and ease of decomposition depends upon the natureof the organic contaminant. The photocatalytic degradation ofmethanol and phenol are interesting mechanism examples on therole of hole, superoxide and hydroxyl radicals in titania-assistedphotomineralisation of organic templates [36]. The superoxideradicals, owing to their strong oxidizing nature, cause the com-plete oxidation of methanol produced (during the photocatalyticprocess) as given below [37]:
O2 + e− →• O−2 (1.5)
CH3OH +• O−2 → CO2 + H2O + e− (1.6)
CH4 + 2•O−2 → CO2 + 2H2O + 2e− (1.7)
Thus, the factors which can influence the yield of methanol inthe photocatalytic process are production of hydroxyl radicals,degradation of produced methanol by valance band holes, andformation of superoxide radicals.
1.1.3 TiO2 nanoparticles
TiO2 may be nanostructured by a variety of techniques and froma range of sources, including bulk titania, inorganic and coordi-
1.2 General applications 13
nation compounds. Colloidal TiO2 may be formed from reactiveprecursors such as titanium alkoxides or chlorides which readilyhydrolyse with water to form TiO2 by the respective eliminationof alcohol or hydrochloric acid gas. Due to an increased surfacearea, porosity, and number of defects, the chemical reactivity andphysical characteristics of nanostructured TiO2 often vary signif-icantly in comparison to bulk.
TiO2 nanoparticles, nanorods, nanowires, and nanotubes, arewidely investigated for various applications in photocatalysis,photovoltaics, batteries, photonic crystals, ultraviolet blockers,sensors, surface coatings, pigment, and paints [16,19,21,23,34,38–43]. Methods such as sol-gel, hydrothermal/solvothermal, phys-ical and chemical vapor deposition, electrodeposition, etc., havebeen successfully used in making TiO2 nanomaterials. As thenanoparticles vary in shape and size, new physical and chemicalproperties emerge.
1.2 General applications
An overview with the most important applications of TiO2 isgiven in Fig. 1.5. Titanium dioxide is one of the most widelyapplied metal oxides, thanks to its unique properties. Due to itshigh refractive index it is used as a pigment in paint industry.Its non-toxicity and stability make it possible to apply it in thepure form as a food additive, in pharmaceuticals, and cosmeticproducts [1]. TiO2 plays also an important role as a biocompati-ble material for bone implants etc. TiO2 nanomaterials are verystable, nontoxic, and cheap. Their optical and biologically be-nign properties allow them to be suitable for UV protection ap-plications. The so-called photogenerated catalysis is applied notonly for the decomposition of dyes but also for mineralization ofmany groups of organic pollutants. The number of new TiO2 ap-plications based on its photoelectrochemical properties towardsenvironmental usage is increasing, e.g. for water and air purifi-cation. The photocatalytic reactivity of TiO2 can be applied forthe reduction or elimination of polluted compounds in air such

14 Introduction
Figure 1.5: General applications of TiO2 [44].
as NOx, cigarette smoke, as well as volatile compounds arisingfrom various construction materials. Photocatalyst coupled withUV lights can oxidize organic pollutants into nontoxic materi-als, such as CO2 and water and can disinfect certain bacteria(wastewater treatment). By decomposing the bacterial cells onthe surface with the photocatalytic action, TiO2 shows long-termanti-bacterial (sterilization) effect. TiO2 can also be employed forsolar energy conversion based on dye, polymer, or quantum dotsensitized nanocrystalline TiO2 solar cells using conjugated poly-mers as solid electrolytes [1, 45, 46]. Synthetic single crystals andfilms of TiO2 are used as a semiconductor [19]. Thin films of TiO2are of interest in self-cleaning and anti-fogging surfaces since itbecomes antistatic, super oxidative, and hydrophilic. They arealso used in anti-reflection coatings, dielectric materials, chemi-cal sensors, wave-guides, photocatalysis and photoelectrical gen-eration [47–50].
1.2 General applications 15
1.2.1 Superhydrophilicity
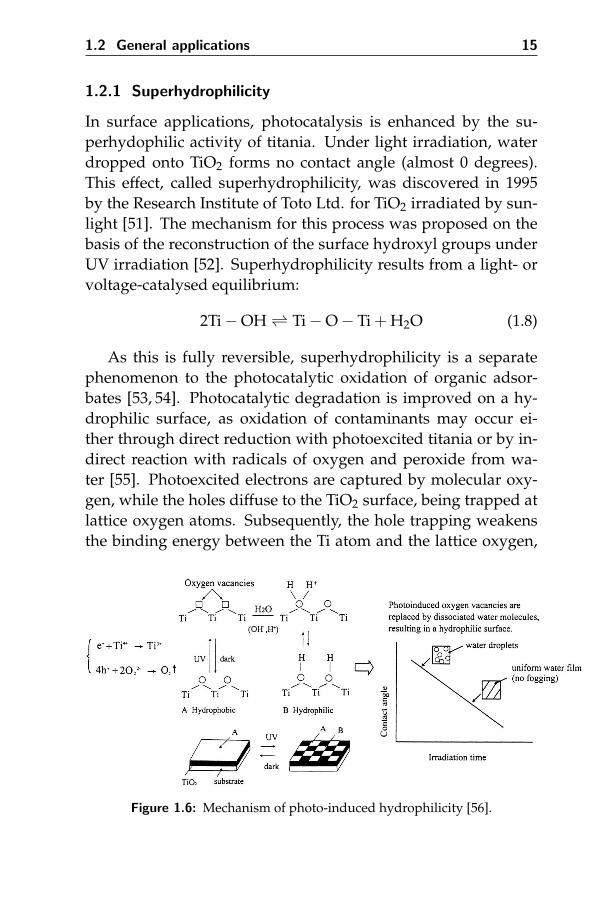
In surface applications, photocatalysis is enhanced by the su-perhydophilic activity of titania. Under light irradiation, waterdropped onto TiO2 forms no contact angle (almost 0 degrees).This effect, called superhydrophilicity, was discovered in 1995by the Research Institute of Toto Ltd. for TiO2 irradiated by sun-light [51]. The mechanism for this process was proposed on thebasis of the reconstruction of the surface hydroxyl groups underUV irradiation [52]. Superhydrophilicity results from a light- orvoltage-catalysed equilibrium:
2Ti−OH ⇀↽ Ti−O− Ti + H2O (1.8)
As this is fully reversible, superhydrophilicity is a separatephenomenon to the photocatalytic oxidation of organic adsor-bates [53, 54]. Photocatalytic degradation is improved on a hy-drophilic surface, as oxidation of contaminants may occur ei-ther through direct reduction with photoexcited titania or by in-direct reaction with radicals of oxygen and peroxide from wa-ter [55]. Photoexcited electrons are captured by molecular oxy-gen, while the holes diffuse to the TiO2 surface, being trapped atlattice oxygen atoms. Subsequently, the hole trapping weakensthe binding energy between the Ti atom and the lattice oxygen,
Figure 1.6: Mechanism of photo-induced hydrophilicity [56].
16 Introduction
and another adsorbed water molecule breaks this bond, form-ing new hydroxyl groups which tend to make the surface hy-drophilic (Fig. 1.6). In the dark, the hydroxyl groups graduallydesorb from the surface in the form of H2O2 or H2O + O2. Thelonger the surface is illuminated with UV light, the smaller thecontact angle for water becomes. The contact angle approacheszero after some time, under a moderate intensity UV light source,thus giving the possibility that water can spread perfectly acrossthe surface [23].
1.2.2 Self-cleaning
The deposition of dirt, vehicular exhaust and other particulatesresults in the necessity of cleaning the surfaces of buildings. Thegrowth of organisms, such as bacteria, algae and fungi disfig-ures the facades of buildings and results in mechanical weaken-ing and eventual destruction. To prevent this, buildings can becoated with a layer of titania. Photocatalysis occurs in the pres-ence of light with the energy corresponding to the band gap en-ergy of the TiO2 and causes the coating to chemically break downthe organic particles adsorbed on the surface of the photocata-lyst. Due to the photocatalytic effect of these TiO2 layers, e.g.self-cleaning windows can be produced. Furthermore, titaniaphotocatalysts can also be used to kill bacteria, so self-sterilizingsurfaces can be prepared [57].
The behaviour depends on two mechanisms which are photo-catalytic activity and superhydrophilicity. During the process ofphotocatalytic degradation, with UV light exposure, decomposi-tion of organic dirt is triggered where oxygen vacancies are cre-ated by ejected oxygen atoms. Water molecules can afterwardsoccupy these oxygen vacancies, producing adsorbed OH groups,making the surface hydrophilic. This can explain why rainwa-ter forms films on the surface instead of behaving as dropletsand rinses away broken-down organic dirt and mineral material.This behaviour is used by applying TiO2 on glasses and mirrorsto keep their optical properties under weather conditions [59].
1.2 General applications 17
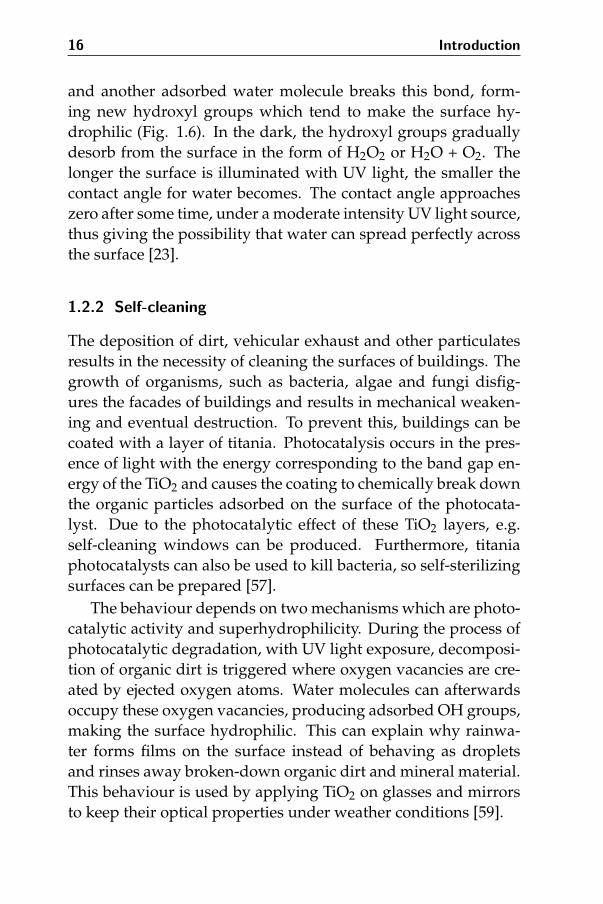
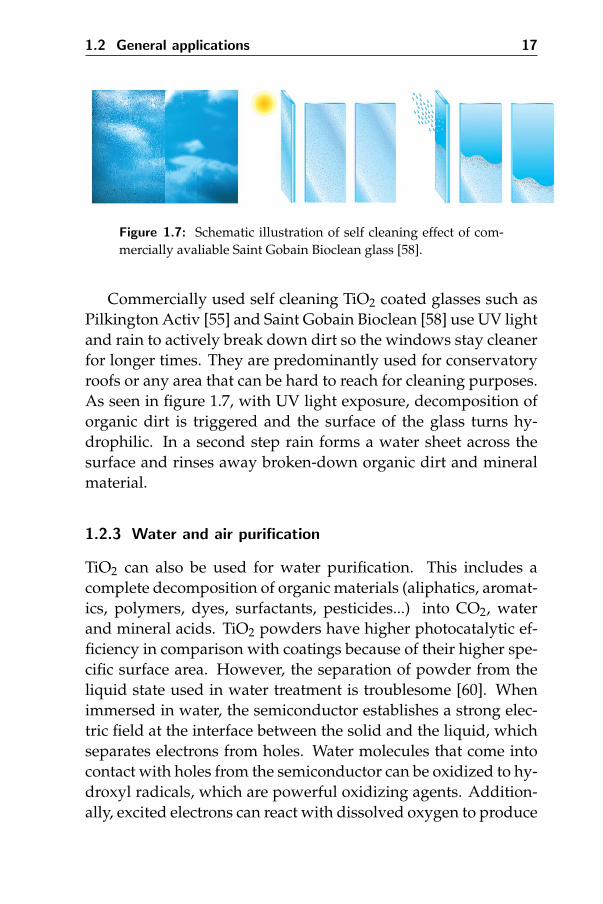
Figure 1.7: Schematic illustration of self cleaning effect of com-mercially avaliable Saint Gobain Bioclean glass [58].
Commercially used self cleaning TiO2 coated glasses such asPilkington Activ [55] and Saint Gobain Bioclean [58] use UV lightand rain to actively break down dirt so the windows stay cleanerfor longer times. They are predominantly used for conservatoryroofs or any area that can be hard to reach for cleaning purposes.As seen in figure 1.7, with UV light exposure, decomposition oforganic dirt is triggered and the surface of the glass turns hy-drophilic. In a second step rain forms a water sheet across thesurface and rinses away broken-down organic dirt and mineralmaterial.
1.2.3 Water and air purification
TiO2 can also be used for water purification. This includes acomplete decomposition of organic materials (aliphatics, aromat-ics, polymers, dyes, surfactants, pesticides...) into CO2, waterand mineral acids. TiO2 powders have higher photocatalytic ef-ficiency in comparison with coatings because of their higher spe-cific surface area. However, the separation of powder from theliquid state used in water treatment is troublesome [60]. Whenimmersed in water, the semiconductor establishes a strong elec-tric field at the interface between the solid and the liquid, whichseparates electrons from holes. Water molecules that come intocontact with holes from the semiconductor can be oxidized to hy-droxyl radicals, which are powerful oxidizing agents. Addition-ally, excited electrons can react with dissolved oxygen to produce
18 Introduction
superoxide radicals which then combine with protons to formhydrogen peroxide, another strong oxidizer. Any organic mate-rial in the water that encounters these highly reactive moleculesdegrades to carbon dioxide and water. This can be followed bythe equations at the following: oxygen is produced by water ox-idation on TiO2 surface (eq. (1.9)) and reduced to hydrogen per-oxide at the electrode (eq. (1.10)), where also reduction to super-oxide (eq. (1.11)) or to water (eq. (1.12)) may occur [23].
2H2O + 4h+ → O2 + 4H+ (1.9)
O2 + 2H+ + 2e− → H2O2 (1.10)
O2 + e− → O−2 (1.11)
O2 + 4e− + 4H+ → 2H2O (1.12)
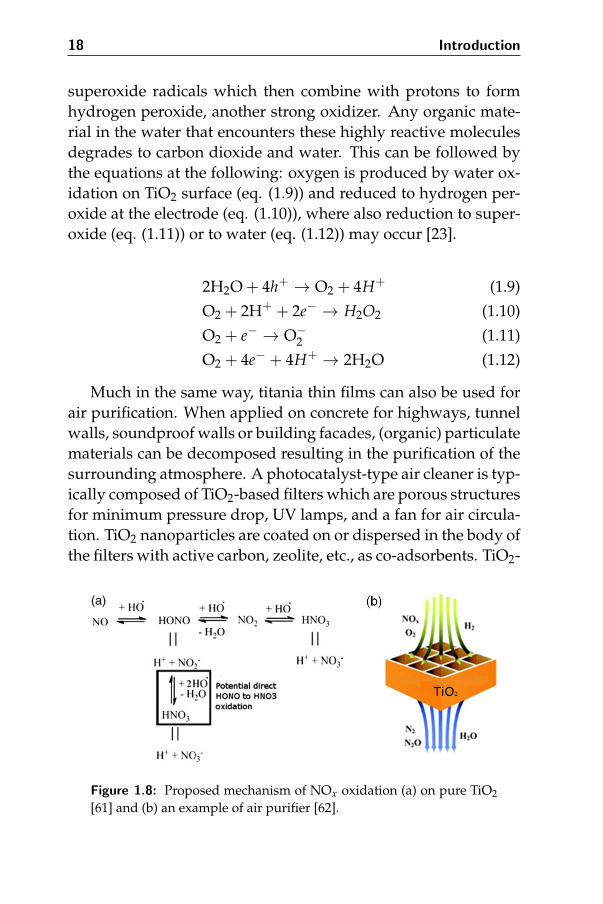
Much in the same way, titania thin films can also be used forair purification. When applied on concrete for highways, tunnelwalls, soundproof walls or building facades, (organic) particulatematerials can be decomposed resulting in the purification of thesurrounding atmosphere. A photocatalyst-type air cleaner is typ-ically composed of TiO2-based filters which are porous structuresfor minimum pressure drop, UV lamps, and a fan for air circula-tion. TiO2 nanoparticles are coated on or dispersed in the body ofthe filters with active carbon, zeolite, etc., as co-adsorbents. TiO2-
Figure 1.8: Proposed mechanism of NOx oxidation (a) on pure TiO2[61] and (b) an example of air purifier [62].
1.2 General applications 19
based photocatalyst filters can decompose the adsorbed pollu-tants (NOx) instead of accumulating them, and thus it exhibitsbetter aircleaning performance [17, 59]. The mechanism for theoxidation of nitrogen oxides (NOx) can be seen in Fig. 1.8. Inaddition, the photocatalyst-type air cleaner can also kill bacteriafloating in indoor air, which is very important for the applica-tions in hospitals.
1.2.4 Solar water splitting
Another application, next to self-cleaning, is photocatalytic wa-ter splitting. Considering the worldwide search for clean, renew-able and formost sustainable energy, the photocatalytic splittingof water into H2 and O2 could help ease the energy crisis througheffective utilization of solar energy, based on photovoltaic andwater-splitting devices. Hydrogen fuel production has gainedincreasing attention as oil and other non-renewable fuels becomeincreasingly depleted and expensive. Novel methods such asphotocatalytic water splitting are being researched in order toproduce hydrogen fuel, which burns cleanly and can be used ina hydrogen fuel cell [34]. Amongst other potential semiconduc-tor materials for hydrogen generation, titania is one of the mostpromising materials because it is photostable, environmentallybenign, cheap and readily available [63].
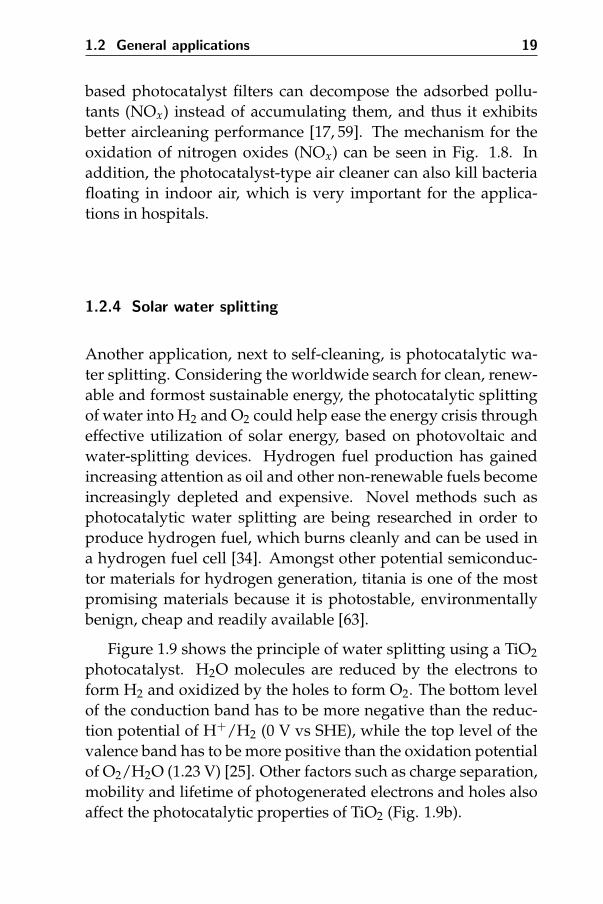
Figure 1.9 shows the principle of water splitting using a TiO2photocatalyst. H2O molecules are reduced by the electrons toform H2 and oxidized by the holes to form O2. The bottom levelof the conduction band has to be more negative than the reduc-tion potential of H+/H2 (0 V vs SHE), while the top level of thevalence band has to be more positive than the oxidation potentialof O2/H2O (1.23 V) [25]. Other factors such as charge separation,mobility and lifetime of photogenerated electrons and holes alsoaffect the photocatalytic properties of TiO2 (Fig. 1.9b).
20 Introduction
Figure 1.9: Principles of water splitting with (a) reactions forsemiconductor photocatalysts, (b) process occuring under pho-toexcitation [25].
1.2.5 Dye sensitized solar cells
TiO2 is a stable photoelectrode in electrochemical cells, even un-der extreme conditions. With its high refractive index, it can beused in dye sensitized solar cells (DSSC). This results in efficientdiffuse scattering of the light inside the porous photoelectrode,which significantly enhances light absorption [64]. In contrast toconventional solar cells, where the semiconductor both assumesthe task as light absorber, as well as charge carrier transport,DSSCs separate those two functions.
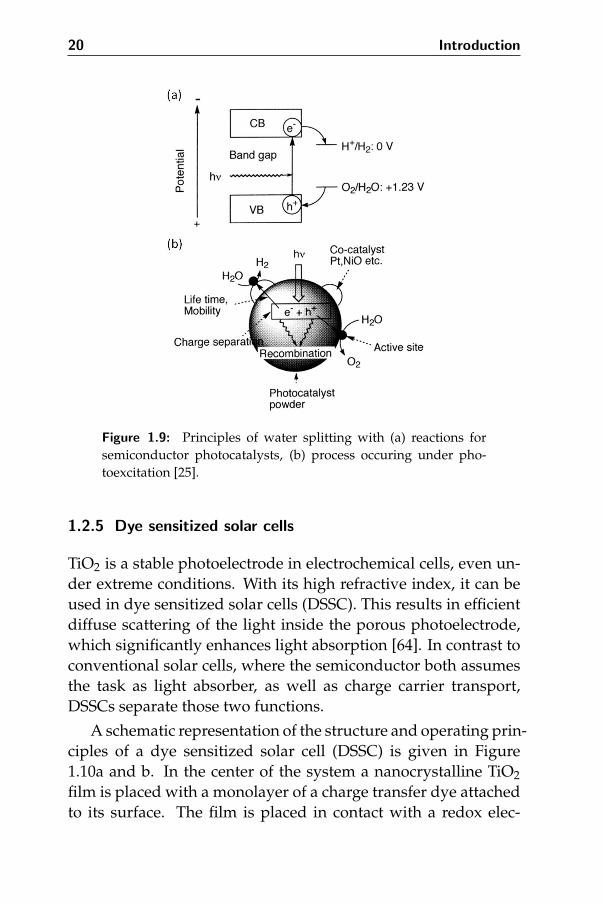
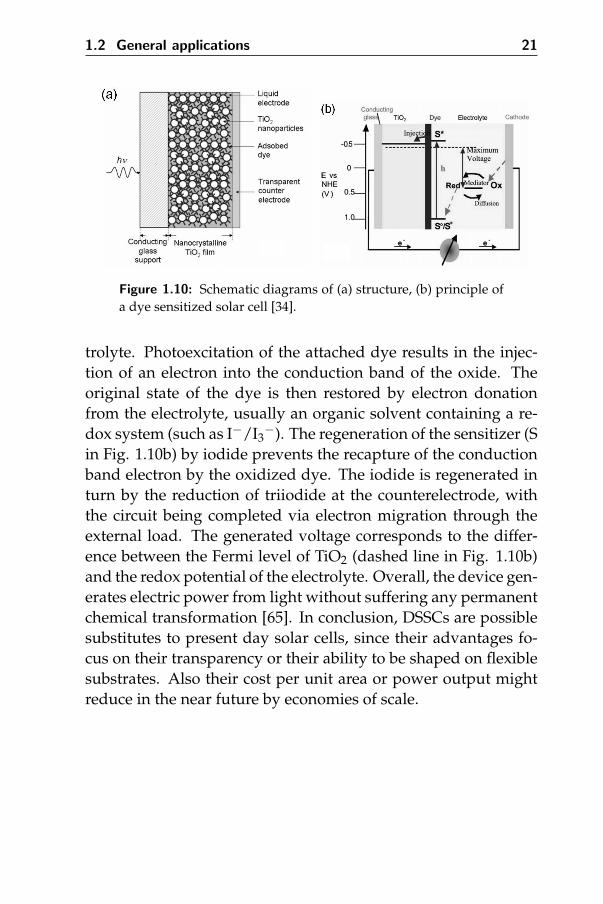
A schematic representation of the structure and operating prin-ciples of a dye sensitized solar cell (DSSC) is given in Figure1.10a and b. In the center of the system a nanocrystalline TiO2film is placed with a monolayer of a charge transfer dye attachedto its surface. The film is placed in contact with a redox elec-
1.2 General applications 21
Figure 1.10: Schematic diagrams of (a) structure, (b) principle ofa dye sensitized solar cell [34].
trolyte. Photoexcitation of the attached dye results in the injec-tion of an electron into the conduction band of the oxide. Theoriginal state of the dye is then restored by electron donationfrom the electrolyte, usually an organic solvent containing a re-dox system (such as I−/I3
−). The regeneration of the sensitizer (Sin Fig. 1.10b) by iodide prevents the recapture of the conductionband electron by the oxidized dye. The iodide is regenerated inturn by the reduction of triiodide at the counterelectrode, withthe circuit being completed via electron migration through theexternal load. The generated voltage corresponds to the differ-ence between the Fermi level of TiO2 (dashed line in Fig. 1.10b)and the redox potential of the electrolyte. Overall, the device gen-erates electric power from light without suffering any permanentchemical transformation [65]. In conclusion, DSSCs are possiblesubstitutes to present day solar cells, since their advantages fo-cus on their transparency or their ability to be shaped on flexiblesubstrates. Also their cost per unit area or power output mightreduce in the near future by economies of scale.

22 Introduction
References
[1] Carp, O.; Huisman, C. L.; and Reller, A., Progress in SolidState Chemistry 2004, 32, 33.
[2] Banfield, J. F.; Veblen, D. R.; and Smith, D. J., American Min-eralogist 1991, 76, 343.
[3] Kalyanasundaram, K. and Gratzel, M., Coordination Chem-istry Reviews 1998, 177, 347.
[4] Diebold, U., Surface Science Reports 2003, 48, 53.
[5] El Goresy, A.; Chen, M.; Dubrovinsky, L.; Gillet, P.; andGraup, G., Science 2001, 293, 1467.
[6] Hanaor, D. A. H. and Sorrell, C. C., Journal of Materials Sci-ence 2011, 46, 855.
[7] Barrett, C. S. and Massalski, T. B., Structure of metals : crys-tallographic methods, principles and data, volume 35 of Interna-tional series on materials science and technology, Oxford ; NewYork : Pergamon 1980.
[8] Peng, X. S. and Chen, A. C., Journal of Materials Chemistry2004, 14, 2542.
[9] Jamieson, J. C.; Olinger, B.; Dachille, F.; Simons, P. Y.; andRoy, R., American Mineralogist 1969, 54, 1477.
[10] Kim, D. J.; Hahn, S. H.; Oh, S. H.; and Kim, E. J., MaterialsLetters 2002, 57, 355.
[11] Zhang, Y. H.; Ebbinghaus, S. G.; Weidenkaff, A.; Kurz, T.;von Nidda, H. A. K.; Klar, P. J.; Gungerich, M.; and Reller,A., Chemistry of Materials 2003, 15, 4028.
[12] Li, J. G. and Ishigaki, T., Acta Materialia 2004, 52, 5143.
[13] So, W. W.; Park, S. B.; Kim, K. J.; Shin, C. H.; and Moon, S. J.,Journal of Materials Science 2001, 36, 4299.
1.2 References 23
[14] Beltran, A.; Gracia, L.; and Andres, J., Journal of PhysicalChemistry B 2006, 110, 23417.
[15] Mo, S. and Ching, W., Physical Review B 1995, 51, 13023.
[16] Gratzel, M., Nature 2001, 414, 338.
[17] Fujishima, A. and Zhang, X. T., Comptes Rendus Chimie 2006,9, 750.
[18] Hoffmann, M. R.; Martin, S. T.; Choi, W. Y.; and Bahnemann,D. W., Chemical Reviews 1995, 95, 69.
[19] Mills, A. and LeHunte, S., Journal of Photochemistry and Pho-tobiology a-Chemistry 1997, 108, 1.
[20] Herrmann, J. M., Catalysis Today 1999, 53, 115.
[21] Fujishima, A. and Honda, K., Nature 1972, 238, 37.
[22] Frank, S. N. and Bard, A. J., Journal of the American ChemicalSociety 1977, 99, 303.
[23] Fujishima, A.; Rao, T.; and Tryk, D., Journal of Photochemistryand Photobiology c-Photochemistry Reviews 2000, 1, 1.
[24] Wang, X. D. and Caruso, R. A., Journal of Materials Chemistry2011, 21, 20.
[25] Kudo, A., Catalysis Surveys from Asia 2003, 7, 31.
[26] Burda, C.; Lou, Y. B.; Chen, X. B.; Samia, A. C. S.; Stout, J.;and Gole, J. L., Nano Letters 2003, 3.
[27] Bessekhouad, Y.; Robert, D.; Weber, J. V.; and Chaoui, N., JPhotochem Photobiol A 2004, 167, 49.
[28] Choi, Y.; Umebayashi, T.; and Yoshikawa, M., J Mater Sci2004, 39, 1837.
[29] Park, J. H.; Kim, S.; and Bard, A., J. Nano Lett 2006, 6, 24.
24 Introduction
[30] Khan, S. U. M.; Al-Shahry, M.; and Ingler, W. B., Jr. Science2002, 297, 2243.
[31] Serpone, N.; Lawless, D.; Disdier, J.; and Herrmann, J. M.,Langmuir 1994, 10, 643.
[32] Takeuchi, M.; Yamashita, H.; Matsuoka, M.; Anpo, M.; Hi-rao, T.; Itoh, N.; and Iwamoto, N., Catalysis Letters 2000, 67,135.
[33] Asahi, R.; Morikawa, T.; Ohwaki, T.; Aoki, K.; and Taga, Y.,Science 2001, 293, 269.
[34] Chen, X. and Mao, S. S., Chemical Reviews 2007, 107, 2891.
[35] Oregan, B. and Gratzel, M., Nature 1991, 353, 737.
[36] Gaya, U. I. and Abdullah, A. H., Journal of Photochemistry andPhotobiology C-Photochemistry Reviews 2008, 9, 1.
[37] Gondal, M. A.; Hameed, A.; Yamani, Z. H.; and Arfaj, A.,Chemical Physics Letters 2004, 392, 372.
[38] Tryk, D. A.; Fujishima, A.; and Honda, K., ElectrochimicaActa 2000, 45, 2363.
[39] Burda, C.; Chen, X. B.; Narayanan, R.; and El-Sayed, M. A.,Chemical Reviews 2005, 105, 1025.
[40] Lan, Y.; Gao, X. P.; Zhu, H. Y.; Zheng, Z. F.; Yan, T. Y.; Wu, F.;Ringer, S. P.; and Song, D. Y., Advanced Functional Materials2005, 15, 1310.
[41] Holland, B. T.; Blanford, C. F.; and Stein, A., Science 1998,281, 538.
[42] Hwang, D. K.; Moon, J. H.; Shul, Y. G.; Jung, K. T.; Kim,D. H.; and Lee, D. W., Journal of Sol-Gel Science and Technology2003, 26, 783.
[43] Linsebigler, A. L.; Lu, G. Q.; and Yates, J. T., Chemical Reviews1995, 95, 735.
1.2 References 25
[44] Nakata, K. and Fujishima, A., Journal of Photochemistry andPhotobiology C: Photochemistry Reviews 2012, 13, 169189.
[45] Li, C. R.; Zheng, Z. H.; Zhang, F. M.; Yang, S. Q.; Wang,H. M.; Chen, L. Z.; Zhang, F.; Wang, X. H.; and Liu, X. H.,Nuclear Instruments Methods in Physics Research Section B-Beam Interactions with Materials and Atoms 2000, 169, 21.
[46] Saini, K. K.; Sharma, S. D.; Chanderkant; Kar, M.; Singh, D.;and Sharma, C. P., Journal of Non-Crystalline Solids 2007, 353,2469.
[47] Kemmitt, T.; Al-Salim, N. I.; Waterland, M.; Kennedy, V. J.;and Markwitz, A., Current Applied Physics 2004, 4, 189.
[48] Zhang, X. T.; Sato, O.; Taguchi, M.; Einaga, Y.; Murakami, T.;and Fujishima, A., Chemistry of Materials 2005, 17, 696.
[49] Eranna, G.; Joshi, B. C.; Runthala, D. P.; and Gupta, R. P.,Critical Reviews in Solid State and Materials Sciences 2004, 29,111.
[50] Gratzel, M., Journal of Sol-Gel Science and Technology 2001, 22,7.
[51] Kommireddy, D. S.; Patel, A.; Shutava, T. G.; Mills, D. K.;and Lvov, Y. M., Journal of Nanoscience and Nanotechnology2005, 5, 1081.
[52] Sakai, N.; Fujishima, A.; Watanabe, T.; and Hashimoto, K.,Journal of Physical Chemistry B 2003, 107, 102.
[53] Stevens, N.; Priest, C. I.; Sedev, R.; and Ralston, J., Langmuir2003, 19, 3272.
[54] Premkumar, J., Chemistry of Materials 2005, 17, 944.
[55] Mills, A.; Lepre, A.; Elliott, N.; Bhopal, S.; Parkin, I. P.; andO’Neill, S. A., Journal of Photochemistry and Photobiology a-Chemistry 2003, 160, 213.
26 Introduction
[56] Fujishima, A.; Hashimoto, K.; and Watanabe, T., TiO2 Photo-catalysis: Fundamentals and Applications, BKC, Tokyo 1999.
[57] Sunada, K.; Kikuchi, Y.; Hashimoto, K.; and Fujishima, A.,Environmental Science Technology 1998, 32, 726.
[58] Saint Gobain UK, L. , http://www.selfcleaningglass.com.
[59] Ramirez, A. M.; Demeestere, K.; De Belie, N.; Mantyla, T.;and Levanen, E., Building and Environment 2010, 45, 832.
[60] Toma, F. L.; Bertrand, G.; Klein, D.; Meunier, C.; and Begin,S., Journal of Nanomaterials 2008, special issue 2, 1.
[61] Folli, A.; Pade, C.; Hansen, T. B.; De Marco, T.; and Macphee,D. E., Cement and Concrete Research 2012, 42, 539.
[62] Liu, Z.; Li, J.; and Woo, S. I., Energy Environmental Science2012, 5, 8799.
[63] Leung, D. Y. C.; Fu, X. L.; Wang, C. F.; Ni, M.; Leung, M.K. H.; Wang, X. X.; and Fu, X. Z., Chemsuschem 2010, 3, 681.
[64] Kay, A. and Gratzel, M., Solar Energy Materials and Solar Cells1996, 44, 99.
[65] Gratzel, M., Journal of Photochemistry and Photobiology a-Chemistry 2004, 164, 3.
2TiO2 Synthesis and Ink-Jet Printing
In this chapter, we give general information about the possiblesynthesis techniques to prepare TiO2 particles and films. Dif-ferent synthesis methods are given as an overview in terms ofinvolved processes and properties of the final product. Specificattention is given to sol-gel methods, as related to the precursorsynthesis methods used in this work. Also, different kinds ofink-jet printing techniques are described. This is a method thatwill be used in this work for further processing. Requirementssuch as rheological properties for the deposition of thin films, arepresented.

28 TiO2 Synthesis and Ink-Jet Printing
2.1 Sol-gel processing
Sol-gel methods have been widely used for the synthesis of sim-ple as well as complex metal oxides since 1969 [1]. It is a multi-step process that involves the conversion of a precursor solutioninto a sol or a gel and subsequent transition to an oxide com-pound at a relatively low temperature [2]. In the sol, particlesare present that can grow by hydrolysis and polycondensationto form a continuous network polymer or gel containing trappedsolvent particles. During heating of the gel, the removal of thetrapped solvent molecules can lead to capillary pressure and acollapse of the gel network, resulting in a product called xero-gel. The second possibility is using supercritical drying of thegel, allowing the removal of the solvent without collapse in thenetwork, leading to an aerogel [3]. With subsequent coating, dry-ing and heating processes it is also possible to obtain pure oxidefilms. The routes of the sol-gel processing are represented in Fig.2.1.
There are three different kinds of sol-gel technologies: col-loidal, inorganic polymeric gel derived from organometallic com-
Figure 2.1: Overview of the sol-gel process [3].
2.1 Sol-gel processing 29
pounds, and gel routes involving formation of organic polymericnetworks.
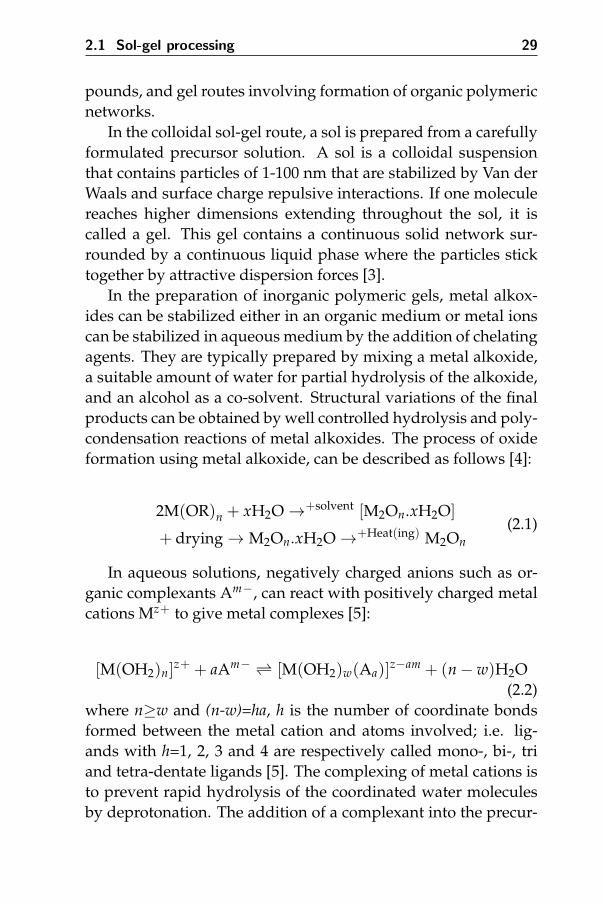
In the colloidal sol-gel route, a sol is prepared from a carefullyformulated precursor solution. A sol is a colloidal suspensionthat contains particles of 1-100 nm that are stabilized by Van derWaals and surface charge repulsive interactions. If one moleculereaches higher dimensions extending throughout the sol, it iscalled a gel. This gel contains a continuous solid network sur-rounded by a continuous liquid phase where the particles sticktogether by attractive dispersion forces [3].
In the preparation of inorganic polymeric gels, metal alkox-ides can be stabilized either in an organic medium or metal ionscan be stabilized in aqueous medium by the addition of chelatingagents. They are typically prepared by mixing a metal alkoxide,a suitable amount of water for partial hydrolysis of the alkoxide,and an alcohol as a co-solvent. Structural variations of the finalproducts can be obtained by well controlled hydrolysis and poly-condensation reactions of metal alkoxides. The process of oxideformation using metal alkoxide, can be described as follows [4]:
2M(OR)n + xH2O→+solvent [M2On.xH2O]
+ drying→ M2On.xH2O→+Heat(ing) M2On(2.1)
In aqueous solutions, negatively charged anions such as or-ganic complexants Am−, can react with positively charged metalcations Mz+ to give metal complexes [5]:
[M(OH2)n]z+ + aAm− ⇀↽ [M(OH2)w(Aa)]
z−am + (n− w)H2O(2.2)
where n≥w and (n-w)=ha, h is the number of coordinate bondsformed between the metal cation and atoms involved; i.e. lig-ands with h=1, 2, 3 and 4 are respectively called mono-, bi-, triand tetra-dentate ligands [5]. The complexing of metal cations isto prevent rapid hydrolysis of the coordinated water moleculesby deprotonation. The addition of a complexant into the precur-

30 TiO2 Synthesis and Ink-Jet Printing
sor solution leads to a lower positive charge of species so depro-tonation of water molecules is less favoured.
Among sol-gel synthesis of various types of materials, one ofthe most promising applications is the preparation of thin filmcoatings. Sol-gel coating methods have advantages over moreconventional thin film deposition methods such as chemical va-por deposition (CVD), sputtering, and evaporation [6]. It re-quires no expensive equipment, and is one of the simplest coat-ing techniques, useful for the preparation of materials with highpurity and homogeneity, allowing microstructural and composi-tional tailoring of the films before or during the deposition.
In this work, in order to prepare aqueous Ti4+ solutions andsuspensions, titanium(IV) alkoxides are used, yet combined withwater as the solvent instead of an organic medium eg. EtOH.These alkoxides are easier to work with than eg. TiCl4, since theyare less sensitive to hydrolysis and do not create acid HCl uponcontact with water eg. from the air. Complexing agents are usedin order to stabilize the Ti4+ ions and slow down the hydroly-sis, before the addition of water. The introduction of water as asolvent brings a number of difficulties in preparing the precur-sors. Common problems are precipitation of metal alkoxides ex-ceeding their solubility products and also precipitation of metalhydroxides that are not soluble due to pH variations. Thus, inorder to lower the concentration of free metal ions, water solublemetal complexes are formed using complexing agents to avoidprecipitation and obtain homogeneous solution. The molecularstructure of some complexing agents which are used in our ex-periments, are represented in Figure 2.2. Further adjusting thepH of the solution is necessary to preserve it for long time peri-ods. Advantages of this precursor system are the environmen-tally friendly character of the solution, using water as the mainsolvent. The precursor materials as well as stabilizing agents arereadily accesible and non-toxic. The use of sol-gel methods canlead to the preparation of nanoparticles with sharp size distribu-tion, obtaining an end product with high purity and the abilityto fine tune the end metal oxide with the addition of dopants or

2.1 Sol-gel processing 31
Figure 2.2: Schematic representation of molecular structuresof complexing agents used in this work (a) citric acid (CA),(b) tetraethylammonium hydroxide (TEA), (c) ethylenediaminete-traacetic acid (EDTA).
careful building of the crystal lattice.In order to have information required to calculate the concen-
tration(s) of the complex(es) formed by the interaction of a metalion with a ligand in solution and to help determine the proper-ties of metal-ligand reactions, stability constants are used. Verylow stability constant numeric values (<1) mean that the metal-ligand complex is not only soluble in water but readily disso-ciates into the metal ionic form shown and the ligand, yieldingessentially metals in ionic form at pH 2 to 3 to as high as neutralpH level [8]. For high stability constants (above 6), there is lessmetal released regardless of how low the pH may be. All metal-

32 TiO2 Synthesis and Ink-Jet Printing
Figure 2.3: Proposed chemical reactions during hydrolysis pro-cess, (a) protonation of titanium isopropoxide by HCl acid, (b) re-action of titanium isopropoxide with an acetic ion [7].
ligand compositions release increasingly more metal ion as thepH is lowered, and more metal hydroxides are released as thepH is raised into the basic end of the pH scale. In Figure 2.3, ex-amples of complexing reactions during the hydrolysis process oftitanium isopropoxide can be observed.
2.2 Synthesis of nanoparticles
Synthesis methods of nanoparticles can be classified according tothe strategy applied (bottom-up or top-down approach), the na-ture of the process (physical, chemical, biological, etc), the energysource (laser, plasma, ion sputtering, electron beam, microwave,hydrothermal, freeze drying, high-energy ball milling, combus-tion, flame, supercritical) or by the media (synthesis in gas, inliquid or in solid).
In a top-down approach, nanoparticle synthesis is by break-ing down bulk materials gradually into smaller sizes, e.g. byhigh-energy ball milling (mechanical milling) in which nanocrys-talline high-temperature phases can be obtained without goingthrough extreme heat treatment for long times [9]. Other ex-

2.2 Synthesis of nanoparticles 33
amples are mechanochemical processing (mechanical activation)for the preparation of nanosized (50-100 nm) TiO2 with a largeamount of acidic agent for several hours and cryochemical pro-cessing [10, 11].
The bottom-up approach refers to the buildup of a materialfrom the bottom: atom by atom, molecule by molecule, or clusterby cluster. Examples are flame synthesis of TiO2 from gaseousTiCl4, chemical vapor reactions using resistant heating, laser orplasma, aerosol pyrolysis; further examples are chemical (reac-tive) precipitation or coprecipitation, such as the wet-chemicalprecipitation of nanocrystals, hydrothermal synthesis, solvother-mal synthesis, supercritical fluid processing, sol-gel synthesis,microwave heating synthesis, synthesis in microemulsions or re-verse micelles and sonochemical synthesis [12, 13].
Feynman’s 1959 talk, entitled ”There’s Plenty of Room at theBottom”, was delivered 50 years ago, and later gave the nameto the new research area of ”nanotechnology” [14]. The essenceof nanotechnology is the ability to work at the molecular level,atom by atom, to create large structures with fundamentally newmolecular organization.
Bottom-up methods based on chemistry have attracted con-siderable attention because of their relatively low cost and highthroughput [15], with controlled growth of nanostructures in theend. Atoms, ions, and molecules, with a certain driving force, as-semble into crystal structures one after another. In recent years,a number of techniques have been developed to control the size,morphology, and uniformity of nanostructures simultaneously[12,13]. These techniques to produce one dimensional TiO2 crys-tals consist of sol-gel template, surfactant directed, and hydrother-mal methods [16–21]. Among various media for crystal growth,solution based methods offer significant advantages, includinglow reaction temperatures, size-selective growth, morphologicalcontrol, and large-scale production.
The liquid-phase approach for the synthesis of inorganic nano-structures is described in the reviews by Cushing et al., Kwon etal. and Chen et. al. [22–24]. This approach combined with mic-
34 TiO2 Synthesis and Ink-Jet Printing
rowave treatment is also the core idea that has guided the workpresented in this thesis.
2.2.1 Sol-gel method
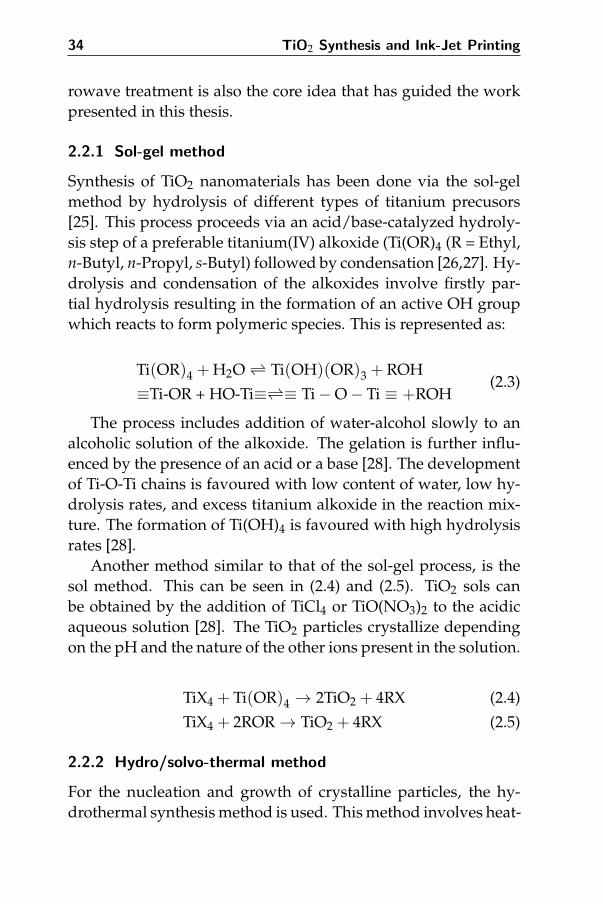
Synthesis of TiO2 nanomaterials has been done via the sol-gelmethod by hydrolysis of different types of titanium precusors[25]. This process proceeds via an acid/base-catalyzed hydroly-sis step of a preferable titanium(IV) alkoxide (Ti(OR)4 (R = Ethyl,n-Butyl, n-Propyl, s-Butyl) followed by condensation [26,27]. Hy-drolysis and condensation of the alkoxides involve firstly par-tial hydrolysis resulting in the formation of an active OH groupwhich reacts to form polymeric species. This is represented as:
Ti(OR)4 + H2O ⇀↽ Ti(OH)(OR)3 + ROH
≡Ti-OR + HO-Ti≡⇀↽≡ Ti−O− Ti ≡ +ROH(2.3)
The process includes addition of water-alcohol slowly to analcoholic solution of the alkoxide. The gelation is further influ-enced by the presence of an acid or a base [28]. The developmentof Ti-O-Ti chains is favoured with low content of water, low hy-drolysis rates, and excess titanium alkoxide in the reaction mix-ture. The formation of Ti(OH)4 is favoured with high hydrolysisrates [28].
Another method similar to that of the sol-gel process, is thesol method. This can be seen in (2.4) and (2.5). TiO2 sols canbe obtained by the addition of TiCl4 or TiO(NO3)2 to the acidicaqueous solution [28]. The TiO2 particles crystallize dependingon the pH and the nature of the other ions present in the solution.
TiX4 + Ti(OR)4 → 2TiO2 + 4RX (2.4)
TiX4 + 2ROR→ TiO2 + 4RX (2.5)
2.2.2 Hydro/solvo-thermal method
For the nucleation and growth of crystalline particles, the hy-drothermal synthesis method is used. This method involves heat-

2.2 Synthesis of nanoparticles 35
ing the reactants in water at high pressures and temperatures. Itis carried out in vessels, called autoclaves. These autoclaves areteflon-lined cylinders which are sealed or connected to an exter-nal pressure control. The water inside this autoclave acts as apressure-transmitting medium and as a solvent. The chemicalindustry uses various types of autoclaves in manufacturing dyesand in other chemical reactions requiring high pressures. In bac-teriology, medicine and food industry, instruments, equipments,supplies, and culture media are sterilized by superheated steamin an autoclave since at high temperatures and under moist con-ditions, bacteria are destroyed more rapidly.
For the metal oxide particle growth, the autoclave filled withmetal ion containing aqueous solution is placed inside a furnaceat a temperature range between 100◦C and 240◦C. The temper-ature can be elevated above the boiling point of water, reach-ing the pressure of vapor saturation. The temperature and theamount of solution added to the autoclave largely determine theinternal pressure produced [24]. In an autoclave, the tempera-ture difference between the lower hotter part of the autoclave(place for charge dissolution) and upper colder part which is thegrowth zone, results in a solubility gradient to ensure the trans-port of materials from the bottom to the top crystallization zone,generating overheated and overcooled flows. The solution be-comes supersaturated in the upper part as a result of decreasingtemperature. Therefore the crystallization process starts. Whenthe autoclave is placed in a furnace, the heat is transferred fromthe walls of the autoclave through the center, resulting in a tem-perature difference throughout the solution. It should be notedthat the applied temperatures in a hydrothermal synthesis arestill lower in comparison with solid state reactions.
TiO2 nanoparticles can be obtained by hydrothermal treat-ment of peptized precipitates of a titanium precursor with water[29]. The precipitates can be prepared by adding an isopropanolsolution of titanium butoxide to deionized water and peptizationat 70◦C for 1 h in the presence of tetraalkylammonium hydrox-ides (peptizer). After hydrothermal treatment at 240◦C for 2 h,
36 TiO2 Synthesis and Ink-Jet Printing
TiO2 nanopowders can be obtained. In another example, TiO2nanoparticles are prepared by hydrothermal reaction of titaniumalkoxide in an acidic (nitric acid) ethanol-water solution at 240◦Cfor 4 h. [30].
Next to nanoparticles, also titania nanorods, nanowires andnanotubes were synthesized by the hydrothermal method [31–33]. Zhang et al. [34] obtained TiO2 nanorods by treating a diluteTiCl4 solution at 333-423 K for 12 h in the presence of acid or inor-ganic salts. Nanotube powders were produced from nanopartic-ulate anatase precursors chemically treated with NaOH solutionsand subsequently with dilute HCl solutions at high temperatures(over 100◦C), resulting in the production of crystalline nanotubesdispersed on the substrate [35].
In the solvothermal method, the solvent is organic. Therefore,the temperature can be elevated much higher, since a variety oforganic solvents with high boiling points eg. toluene and benzylalcohol [36] can be chosen. The solvothermal method normallyhas a better control over size, shape distributions and the crys-tallinity of TiO2 nanoparticles. Also nanotubes, -wires and -rodscan be synthesized using the solvothermal method [24].
2.2.3 Microwave-assisted hydrothermal method
Traditional heating methods such as conventional furnaces useexternal heat source, which is a slow and inefficient way of trans-ferring heat to the autoclave used for solvo/hydrothermal treat-ments. This is because of the different thermal conductances ofthe different materials that have to be crossed. When using a con-ventional furnace, the reaction vessel will have a higher tempera-ture than the reaction mixture inside the vessel, so a temperaturegradient will be created within the sample (Fig. 2.4). This willbe the case just until enough time has passed, so that thermalequilibrium is obtained. This can take several hours, which is adistinct disadvantage of hydrothermal synthesis. Furthermore,in conventional heating, the hot reaction vessel can cause local-ized overheating, which in turn can lead to product degradation

2.2 Synthesis of nanoparticles 37
Figure 2.4: Microwave heating versus conventinal heating [37].
when heated for longer periods [19, 21].To overcome these disadvantages, inherent to conventional
hydrothermal heating, the used synthesis method in this workwas shifted to microwave-hydrothermal heating. When usingmicrowave dielectric heating, the energy is introduced into thechemical reactor remotely and there is no direct contact betweenthe energy source and the reaction mixture. Microwave radia-tion passes through the walls of the vessel heating the contentsdirectly by taking advantage of the ability of some liquids andsolids to transform electromagnetic radiation into heat.
Because microwave heating directly heats the liquid insidethe vessel (surroundings), these surroundings are only heateddue to the hot reaction mixture inside. This microwave method isindependent of the thermal conductance of the reaction vessel aslong as they are made from different materials that are transpar-ent for microwaves, such as teflon, quartz or borosilicate glass.
It is claimed that the microwave-hydrothermal process mighthave the ability to dramatically enhance the kinetics of crystal-lization. Microwave irradiation has no influence on the activa-tion energy of a given reaction, however it provides extra energyto overcome this energy barrier and thus complete the reactionmore quickly than conventional heating [38–40].
The heating rate is one of the most important aspects of mi-

38 TiO2 Synthesis and Ink-Jet Printing
crowave energy. Microwaves transfer energy in 10−9 s with eachcycle of electromagnetic energy. The kinetic molecular relaxationfrom this energy is approximately 10−5 s. This means that the en-ergy transfers faster than molecules can relax, which results in anon-equilibrium state and high instantaneous temperatures thataffect the kinetics of the system. This enhances the reaction rateand the product yields as well.
Essentially, heating by using microwaves (electromagnetic ra-diation with a frequency between the range of 300 to 300000 MHz)is based on two mechanisms:
1. Dipolar re-orientation: molecules with a dipolar structure(e.g. water) oscillate in the fluctuating microwave field. Thisoscillation results in molecular motion which causes frictionand therefore heat.
2. Ionic conductance: molecules with an ionic structure (e.g.salts) align in the electromagnetic field. This alignment alsocauses molecular motion which results in friction and there-fore heat.
Microwaves have wavelengths in the range 1m - 1mm. Theenergy of these microwave phonons is low in comparison withthe energy necessary to break chemical bonds (typically in thearea of 80 - 120 kcal/mole or 335 - 502 kJ/mole). Microwave irra-diation will not alter the chemical structure in a reaction mixture,it will only have an influence on the molecular rotation of the dif-ferent molecules present in the reaction mixture. Therefore, sol-vents play a very important role in microwave synthesis. Mostreactions take place in solution, thus the choice of solvent canbe a crucial factor in the reaction outcome. One of the most im-portant characteristics of a solvent is its polarity. As previouslymentioned, dipolar re-orientation is one of the mechanisms thatcontrol microwave heating. The other mechanism is ionic con-ductance [41].
Microwaves can couple directly with the molecules that arepresent in the reaction mixture. The more polar a reaction mix-
2.2 Synthesis of nanoparticles 39
ture is, the greater its ability to couple with the microwave en-ergy. The electric field changes very fast (4,9 . 109 times per sec-ond at 2,45 GHz), creating a phase separation between the ori-entation of the field and that of the dipole. This difference inphase causes an energy loss of the dipole by molecular frictionand molecular collisions, which leads to dielectric heating.
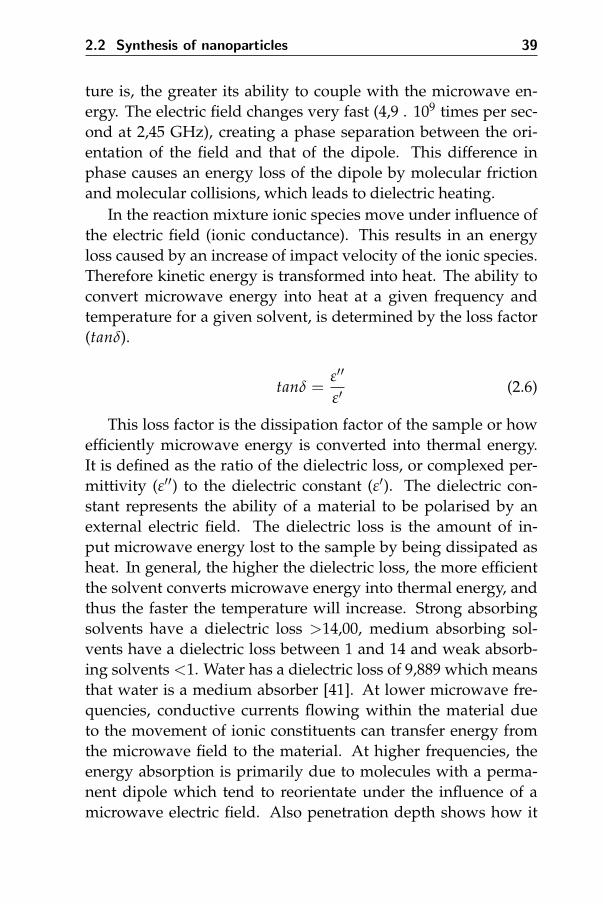
In the reaction mixture ionic species move under influence ofthe electric field (ionic conductance). This results in an energyloss caused by an increase of impact velocity of the ionic species.Therefore kinetic energy is transformed into heat. The ability toconvert microwave energy into heat at a given frequency andtemperature for a given solvent, is determined by the loss factor(tanδ).
tanδ =ε′′
ε′(2.6)
This loss factor is the dissipation factor of the sample or howefficiently microwave energy is converted into thermal energy.It is defined as the ratio of the dielectric loss, or complexed per-mittivity (ε′′) to the dielectric constant (ε′). The dielectric con-stant represents the ability of a material to be polarised by anexternal electric field. The dielectric loss is the amount of in-put microwave energy lost to the sample by being dissipated asheat. In general, the higher the dielectric loss, the more efficientthe solvent converts microwave energy into thermal energy, andthus the faster the temperature will increase. Strong absorbingsolvents have a dielectric loss >14,00, medium absorbing sol-vents have a dielectric loss between 1 and 14 and weak absorb-ing solvents <1. Water has a dielectric loss of 9,889 which meansthat water is a medium absorber [41]. At lower microwave fre-quencies, conductive currents flowing within the material dueto the movement of ionic constituents can transfer energy fromthe microwave field to the material. At higher frequencies, theenergy absorption is primarily due to molecules with a perma-nent dipole which tend to reorientate under the influence of amicrowave electric field. Also penetration depth shows how it

40 TiO2 Synthesis and Ink-Jet Printing
depends on the dielectric properties of the material. The pene-tration depth is used to denote the depth at which power densityhas decreased to 37% of its initial value at the surface [41]. Waterhas a penetration depth of 1.4 cm at 25◦C and 5.7 cm at 95◦C [41].
In the synthesis, suitable molecular precursors (organometal-lic compounds, metal salts, metal-ligand complexes, etc.) are in-troduced to react or decompose in a solution that contains coordi-nating solvents, ligands and/or surfactants, additives under con-trolled atmosphere and chosen temperature and pressure. Thesize and geometrical control is achieved by suitable coordinatingsolvents and surfactants which act as reactivity moderators andstabilizing agents [40, 43–46]. Throughout the microwave irridi-ation, as the solution chemical potential exceeds a certain thresh-old required to guarantee the thermodynamic stability of the tini-est particles, all the nanocrystals will evolve to large dimensions,with the overall size distribution narrowing or broadening overtime. At the end, Ostwald ripening may occur at longer reac-tion times, leading to dissolution of nanocrystals smaller thanthe critical size, providing monomers to keep the growth of the
Figure 2.5: Schematic illustration of size control in microwaveassisted nanocrystal synthesis [42].
2.2 Synthesis of nanoparticles 41
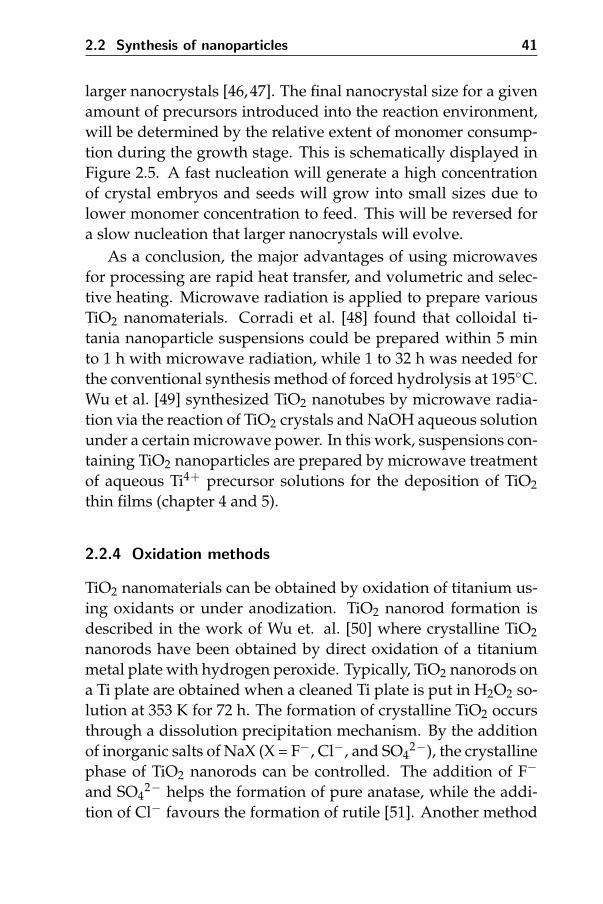
larger nanocrystals [46,47]. The final nanocrystal size for a givenamount of precursors introduced into the reaction environment,will be determined by the relative extent of monomer consump-tion during the growth stage. This is schematically displayed inFigure 2.5. A fast nucleation will generate a high concentrationof crystal embryos and seeds will grow into small sizes due tolower monomer concentration to feed. This will be reversed fora slow nucleation that larger nanocrystals will evolve.
As a conclusion, the major advantages of using microwavesfor processing are rapid heat transfer, and volumetric and selec-tive heating. Microwave radiation is applied to prepare variousTiO2 nanomaterials. Corradi et al. [48] found that colloidal ti-tania nanoparticle suspensions could be prepared within 5 minto 1 h with microwave radiation, while 1 to 32 h was needed forthe conventional synthesis method of forced hydrolysis at 195◦C.Wu et al. [49] synthesized TiO2 nanotubes by microwave radia-tion via the reaction of TiO2 crystals and NaOH aqueous solutionunder a certain microwave power. In this work, suspensions con-taining TiO2 nanoparticles are prepared by microwave treatmentof aqueous Ti4+ precursor solutions for the deposition of TiO2thin films (chapter 4 and 5).
2.2.4 Oxidation methods
TiO2 nanomaterials can be obtained by oxidation of titanium us-ing oxidants or under anodization. TiO2 nanorod formation isdescribed in the work of Wu et. al. [50] where crystalline TiO2nanorods have been obtained by direct oxidation of a titaniummetal plate with hydrogen peroxide. Typically, TiO2 nanorods ona Ti plate are obtained when a cleaned Ti plate is put in H2O2 so-lution at 353 K for 72 h. The formation of crystalline TiO2 occursthrough a dissolution precipitation mechanism. By the additionof inorganic salts of NaX (X = F−, Cl−, and SO4
2−), the crystallinephase of TiO2 nanorods can be controlled. The addition of F−
and SO42− helps the formation of pure anatase, while the addi-
tion of Cl− favours the formation of rutile [51]. Another method
42 TiO2 Synthesis and Ink-Jet Printing
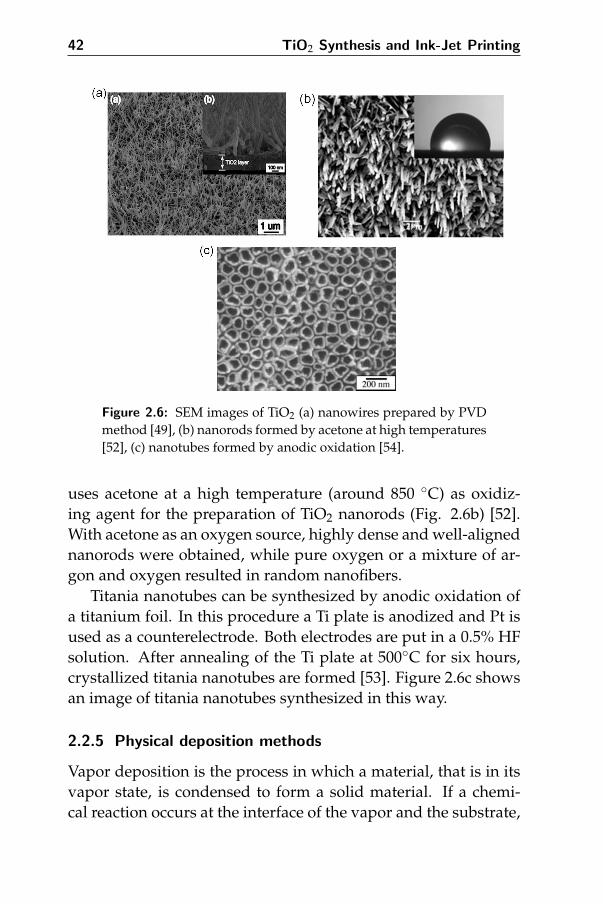
Figure 2.6: SEM images of TiO2 (a) nanowires prepared by PVDmethod [49], (b) nanorods formed by acetone at high temperatures[52], (c) nanotubes formed by anodic oxidation [54].
uses acetone at a high temperature (around 850 ◦C) as oxidiz-ing agent for the preparation of TiO2 nanorods (Fig. 2.6b) [52].With acetone as an oxygen source, highly dense and well-alignednanorods were obtained, while pure oxygen or a mixture of ar-gon and oxygen resulted in random nanofibers.
Titania nanotubes can be synthesized by anodic oxidation ofa titanium foil. In this procedure a Ti plate is anodized and Pt isused as a counterelectrode. Both electrodes are put in a 0.5% HFsolution. After annealing of the Ti plate at 500◦C for six hours,crystallized titania nanotubes are formed [53]. Figure 2.6c showsan image of titania nanotubes synthesized in this way.
2.2.5 Physical deposition methods
Vapor deposition is the process in which a material, that is in itsvapor state, is condensed to form a solid material. If a chemi-cal reaction occurs at the interface of the vapor and the substrate,

2.3 Ink-jet printing 43
this process is called chemical vapor deposition (CVD). Other-wise, it is called physical vapor deposition (PVD). PVD methodsinclude thermal deposition, ion plating, ion implantation, sput-tering, laser vaporization, and laser surface alloying [24].
These techniques can be used to produce various nanomate-rials. In this way titania films, as well as nanoparticles were syn-thesized by pyrolysis of titanium(IV)isopropoxide in a He/O2 at-mosphere (CVD) [55]. This CVD technique is widely used for thepreparation of titania thin film coatings for self-cleaning appli-cations. TiO2 nanowires (Fig. 2.6a) have been synthesized bya PVD method [49]. These nanowires were grown onto an Au-doped titania/silicon substrate at 850◦C by thermal evaporation.The nanowires had diameters of 60-100 nm and lengths of 1-2µm.
Electrodeposition is commonly used to deposit metallic coat-ings on a substrate by reduction at a cathode. The substrate thatneeds to be coated is the cathode, which is immersed in a solu-tion containing a metal salt. These metallic ions will then reduceat the cathode, converting to its metallic form [24]. The electrode-position method, with the use of an alumina assisted membrane(AAM) as a template, can be used to form titania nanowires. Theelectrodeposition is carried out in a 0.2 M TiCl3 solution (pH = 2),by depositing titanium into the pores of the AAM. By heating thedeposited template at 500◦C for 4 h and removing the template,pure anatase TiO2 nanowires can be obtained [56].
2.3 Ink-jet printing
Ink-jet printing is a non-contact deposition technique in whichdroplets of the substance to deposit, or more commonly an inkcontaining that substance, are dispensed onto a substrate. Thisapproach is characterised by low material wastage (with respectto the functional component of the ink), as droplets are either dis-pensed only when required or unwanted droplets are recovered,and compatibility with standard domestic, commercial or indus-trial environments (usually without the need for a controlled at-

44 TiO2 Synthesis and Ink-Jet Printing
mosphere) [57–64]. This approach can be implemented using awide range of technologies, which are usually divided into twocategories: drop on demand (DOD) and continuous ink-jet (CIJ)printing.
CIJ is the older technique, best suited to high-speed, low res-olution printing. In this method, a continuous stream of dropletsis produced by disrupting a column of fluid with piezoelectric(or occasionally ultrasonic) actuators [58]. Droplets are chargedso that they can be diverged by an electric field, either onto thesubstrate or into an ink recovery and recirculation system [65].Commercial systems typically have only one nozzle or a few withlow density, and automatically refill the ink with the appropriatesolvents to avoid evaporation. The technique is mostly used forlow-quality marking applications. The relative bulk of the print-head (due to the charging plates and recirculation components),limits on ink formulation and the need for large volumes of ink,make CIJ unsuitable for most materials applications [66].
DOD allows more flexibility with ink and system design andmore control over droplet placement, and so it is the preferredtechnique for high-resolution graphics and materials ink-jet print-ing [58, 61]. It is also much more convenient since small ink vol-umes can be used while remaining scalable, although still themaximum printing speeds are lower than for CIJ [66, 67]. Themost common means of generating a droplet are thermal, piezo-electric and electromagnetic.
In thermal ink-jet or bubble-jet printing, rapid local heating inthe ink chamber is used to produce a bubble to force the dropletejection. This technique gives some limits on ink formulation:solutions undergoing gelation, solidification or rapid changes inviscosity with temperature are likely to coat the heater or blockthe nozzle, and the heating element would be vulnerable to elec-trical short circuit or chemical attack with some inks [68]. Formaterials deposition, the electromagnetic and piezoelectric ap-proaches are therefore preferred.
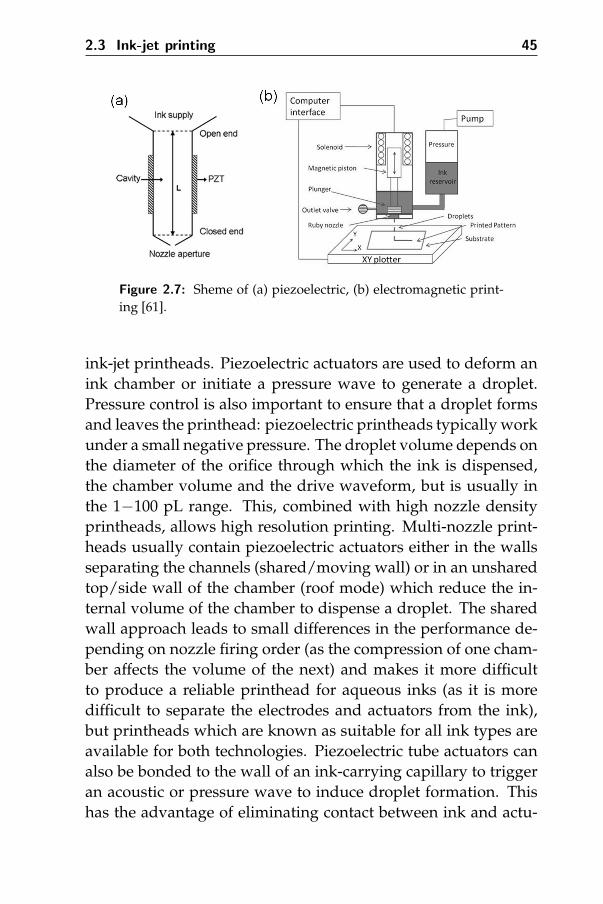
Piezoelectric droplet formation (Fig. 2.7a) is the DOD tech-nique used in domestic ink-jet printers and in most industrial
2.3 Ink-jet printing 45
Figure 2.7: Sheme of (a) piezoelectric, (b) electromagnetic print-ing [61].
ink-jet printheads. Piezoelectric actuators are used to deform anink chamber or initiate a pressure wave to generate a droplet.Pressure control is also important to ensure that a droplet formsand leaves the printhead: piezoelectric printheads typically workunder a small negative pressure. The droplet volume depends onthe diameter of the orifice through which the ink is dispensed,the chamber volume and the drive waveform, but is usually inthe 1−100 pL range. This, combined with high nozzle densityprintheads, allows high resolution printing. Multi-nozzle print-heads usually contain piezoelectric actuators either in the wallsseparating the channels (shared/moving wall) or in an unsharedtop/side wall of the chamber (roof mode) which reduce the in-ternal volume of the chamber to dispense a droplet. The sharedwall approach leads to small differences in the performance de-pending on nozzle firing order (as the compression of one cham-ber affects the volume of the next) and makes it more difficultto produce a reliable printhead for aqueous inks (as it is moredifficult to separate the electrodes and actuators from the ink),but printheads which are known as suitable for all ink types areavailable for both technologies. Piezoelectric tube actuators canalso be bonded to the wall of an ink-carrying capillary to triggeran acoustic or pressure wave to induce droplet formation. Thishas the advantage of eliminating contact between ink and actu-
46 TiO2 Synthesis and Ink-Jet Printing
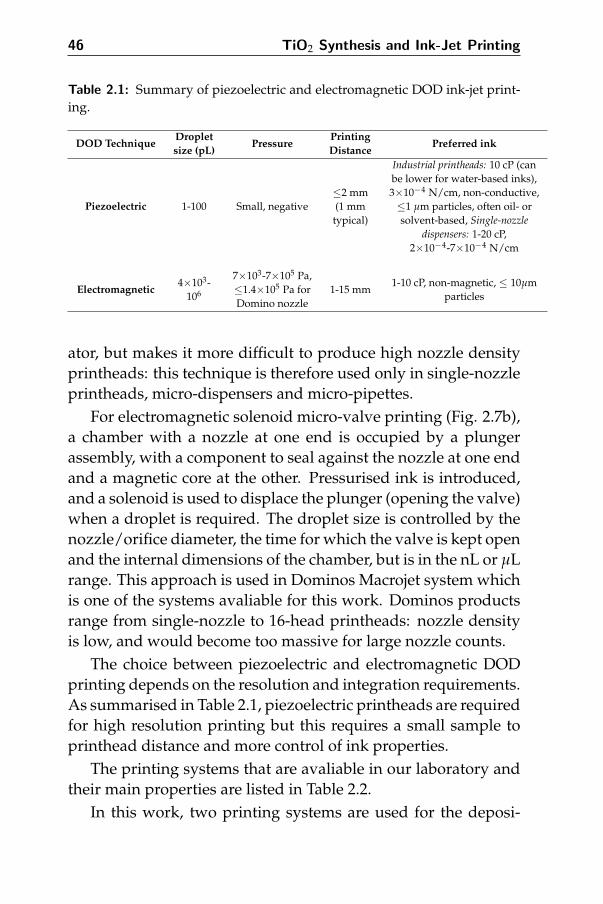
Table 2.1: Summary of piezoelectric and electromagnetic DOD ink-jet print-ing.
DOD TechniqueDropletsize (pL)
PressurePrintingDistance
Preferred ink
Piezoelectric 1-100 Small, negative≤2 mm(1 mmtypical)
Industrial printheads: 10 cP (canbe lower for water-based inks),3×10−4 N/cm, non-conductive,≤1 µm particles, often oil- orsolvent-based, Single-nozzle
dispensers: 1-20 cP,2×10−4-7×10⁻⁴ N/cm
Electromagnetic4×103-
106
7×10³-7×10⁵ Pa,≤1.4×10⁵ Pa forDomino nozzle
1-15 mm1-10 cP, non-magnetic, ≤ 10µm
particles
ator, but makes it more difficult to produce high nozzle densityprintheads: this technique is therefore used only in single-nozzleprintheads, micro-dispensers and micro-pipettes.
For electromagnetic solenoid micro-valve printing (Fig. 2.7b),a chamber with a nozzle at one end is occupied by a plungerassembly, with a component to seal against the nozzle at one endand a magnetic core at the other. Pressurised ink is introduced,and a solenoid is used to displace the plunger (opening the valve)when a droplet is required. The droplet size is controlled by thenozzle/orifice diameter, the time for which the valve is kept openand the internal dimensions of the chamber, but is in the nL or µLrange. This approach is used in Dominos Macrojet system whichis one of the systems avaliable for this work. Dominos productsrange from single-nozzle to 16-head printheads: nozzle densityis low, and would become too massive for large nozzle counts.
The choice between piezoelectric and electromagnetic DODprinting depends on the resolution and integration requirements.As summarised in Table 2.1, piezoelectric printheads are requiredfor high resolution printing but this requires a small sample toprinthead distance and more control of ink properties.
The printing systems that are avaliable in our laboratory andtheir main properties are listed in Table 2.2.
In this work, two printing systems are used for the deposi-

2.3 Ink-jet printing 47
Table 2.2: Overview of ink-jet printing heads and nozzles (piezoelectric, elec-tromagnetic) avaliable in our laboratory.
Company TechnologyDrop
size (pL)Freq.(kHz)
Orificedaimeter
(µ)
Nozzlesper
headKey features
DimatixPiezoelectric,roof mode
1, 10 40 23 16jet
straightness,robustness
MicrofabPiezoelectric,
tubeactuator
10-200 40 30 1
chemicalinertness,
wide viscosityrange
Domino Electromagnetic 10000 1 90 1
High speedprinting,moderateresolution
tion of the solutions and sols. The first one is a single DominoMacrojet electromagnetic nozzle with 90 µm diameter jewel ori-fice, modified in the University of Cambridge and mounted on aRoland x-y plotter. This kind of nozzle can dispense highly vis-cous (1−10 cP), non-magnetic inks, and produces≥1 nL dropletsup to 1 kHz. The second system is the piezoelectric driven Di-matix printer DMP-2831 (Fig. 2.8a). It can dispense inks witha viscosity up to 10 cP, containing ≤1 µm particles. It permitstesting with very small (1 mL) volumes of ink at jetting frequen-cies up to 40 kHz. For printing, the sols were filled into dispos-able cartridges which have 16 piezoelectric nozzles at the bottom,and placed on the plotter. The system provides excellent sub-strate handling and user-friendliness, simplifies tuning for newinks with integrated optics for drop visualization and waveformcontrol, and gives possibility for improvement (1 pL ink volume,high frequency). This printer is equipped with a built-in camerafor drop watching. The applied voltage waveform causes de-formation of the fluid chamber membrane, resulting in a pres-sure wave. There are several standard waveforms provided formodel inks or common solvents. The standard waveform for thisprinter consists of three segments each with adjustable settings: a
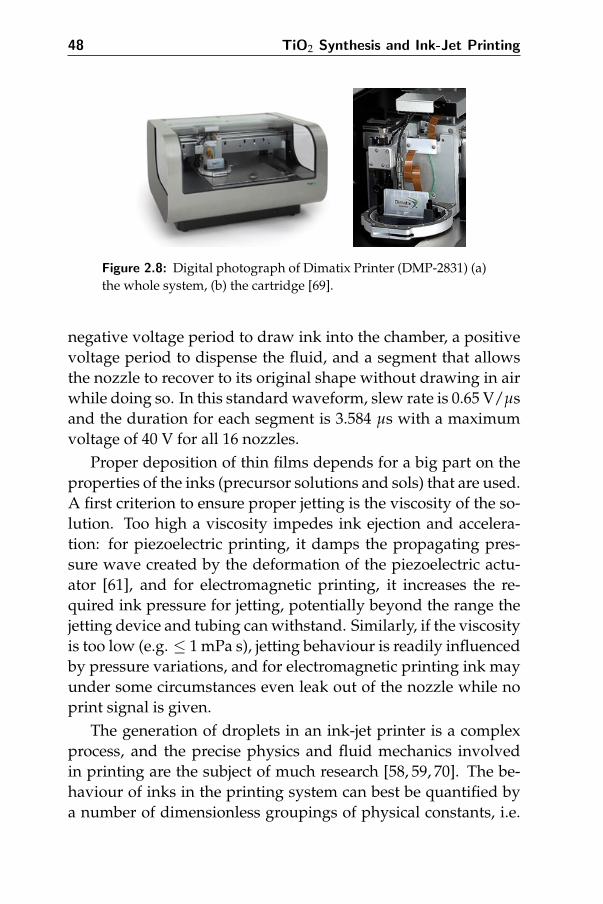
48 TiO2 Synthesis and Ink-Jet Printing
Figure 2.8: Digital photograph of Dimatix Printer (DMP-2831) (a)the whole system, (b) the cartridge [69].
negative voltage period to draw ink into the chamber, a positivevoltage period to dispense the fluid, and a segment that allowsthe nozzle to recover to its original shape without drawing in airwhile doing so. In this standard waveform, slew rate is 0.65 V/µsand the duration for each segment is 3.584 µs with a maximumvoltage of 40 V for all 16 nozzles.
Proper deposition of thin films depends for a big part on theproperties of the inks (precursor solutions and sols) that are used.A first criterion to ensure proper jetting is the viscosity of the so-lution. Too high a viscosity impedes ink ejection and accelera-tion: for piezoelectric printing, it damps the propagating pres-sure wave created by the deformation of the piezoelectric actu-ator [61], and for electromagnetic printing, it increases the re-quired ink pressure for jetting, potentially beyond the range thejetting device and tubing can withstand. Similarly, if the viscosityis too low (e.g. ≤ 1 mPa s), jetting behaviour is readily influencedby pressure variations, and for electromagnetic printing ink mayunder some circumstances even leak out of the nozzle while noprint signal is given.
The generation of droplets in an ink-jet printer is a complexprocess, and the precise physics and fluid mechanics involvedin printing are the subject of much research [58, 59, 70]. The be-haviour of inks in the printing system can best be quantified bya number of dimensionless groupings of physical constants, i.e.

2.3 Ink-jet printing 49
the Reynolds (Re), Weber (We) and Ohnesorge (Oh) numbers:
Re =νrρ
η
We =ν2rρ
θ
Oh =
√We
Re=
η√(θρr)
(2.7)
where θ (J m−2), ρ (kg m−3), η (Pa s) and ν (m/s) are the inksurface tension, density, viscosity and velocity respectively andr (m) is the radius of the orifice of the nozzle [58–61, 70]. TheReynolds number is a ratio of internal and viscous forces and theWeber number shows the ratio between internal and surface ten-sion forces. The inverse value of the Ohnesorge number is a char-acteristic dimensionless number which is independent of dropletvelocity. Often it is written that Oh−1 should be ≥2 for properjetting properties. In Derby’s study [58], it was proposed that itshould be 1≤Oh−1≤10. If the ratio is too low, viscous forces be-come more dominant, preventing ink drops from being ejectedfrom the nozzle; conversely, if the ratio is too high the possibilityfor satellite droplet formation becomes high. Practically, even ifthe ratio is higher than 10, the ink is reliably printable as long asthe satellites merge with the main droplet in flight.
The next step in the printing optimization is the study of theinteraction between droplets and substrate upon impact, spread-ing and merging of droplets to form a continuous coating on thesusbstrate. Therefore, the wetting behaviour of the ink and thewettability of the substrate have to be investigated.
The ink-jet printing tests took place in collabration with Uni-versity of Cambridge, and in-situ testing of the droplets can beperformed which allows to follow the ink behaviour. In Fig. 2.9an example of this can be observed [63]. From the figure, it canbe seen that initially, the drops form a liquid column which trans-forms into the actual droplet and an elongated tail. Here, break-ing up of this tail from the droplet leads to the formation of a
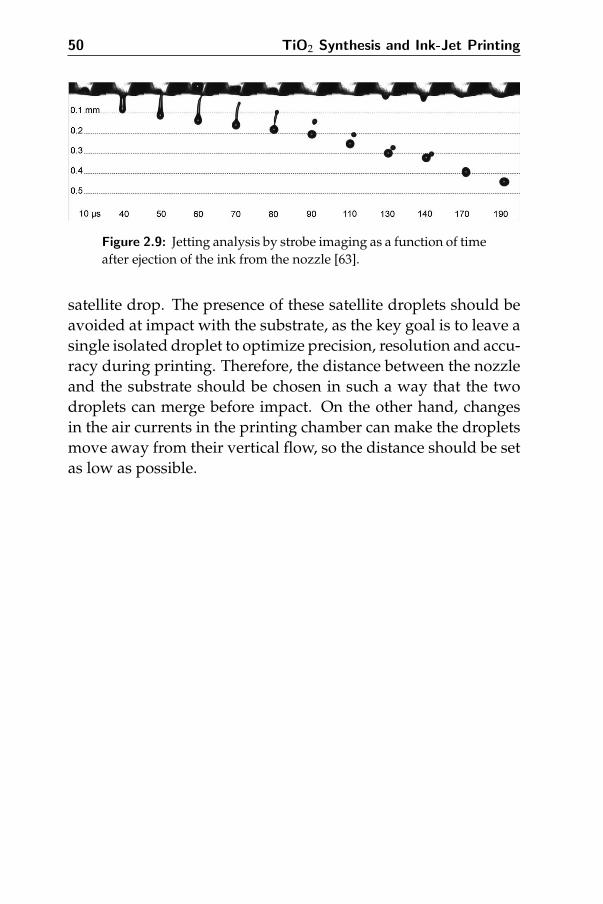
50 TiO2 Synthesis and Ink-Jet Printing
Figure 2.9: Jetting analysis by strobe imaging as a function of timeafter ejection of the ink from the nozzle [63].
satellite drop. The presence of these satellite droplets should beavoided at impact with the substrate, as the key goal is to leave asingle isolated droplet to optimize precision, resolution and accu-racy during printing. Therefore, the distance between the nozzleand the substrate should be chosen in such a way that the twodroplets can merge before impact. On the other hand, changesin the air currents in the printing chamber can make the dropletsmove away from their vertical flow, so the distance should be setas low as possible.
2.3 References 51
References
[1] Roy, R., Journal of the American Ceramic Society 1969, 52, 344.
[2] Schmidt, H., Journal of Non-Crystalline Solids 1988, 100, 51.
[3] Brinker, C. J. and Scherer, G. W., Sol-gel Science: The Physicsand Chemistry of Sol-gel Processing, Academic Press, London1990.
[4] Livage, J. and Sanchez, C., Journal of Non-Crystalline Solids1992, 145, 11.
[5] Kakihana, M., Journal of Sol-Gel Science and Technology 1996,6, 7.
[6] Thomas, I. M., Optical Newsletter 1986, 12, 12.
[7] Mendoza, N.; Paraguay-Delgado, F.; and Hu, H., Solar En-ergy 2012, 86, 997.
[8] Martell, A. E. and Smith, R. M., Critical Stability Constants,Plenum Press, New York 1974.
[9] Fasaki, I.; Siamos, K.; Arin, M.; Lommens, P.; Van Driessche,I.; Hopkins, S. C.; Glowacki, B. A.; and Arabatzis, I., AppliedCatalysis A: General 2012, 411412, 60.
[10] Pottier, A. e. a., Journal of Materials Chemistry 2011, 11, 1116.
[11] Biswas, P. and Wu, C. Y., Journal of Air Waste Manage. Assoc.2005, 55.
[12] Xia, Y. N.; Yang, P. D.; Sun, Y. G.; Wu, Y. Y.; Mayers, B.; Gates,B.; Yin, Y. D.; Kim, F.; and Yan, Y. Q., Advanced Materials 2003,15, 353.
[13] Fernandez-Garcia, M.; Martinez-Arias, A.; Hanson, J. C.;and Rodriguez, J. A., Chemical Reviews 2004, 104, 4063.
[14] Feynman, R., There’s Plenty of Room at the Bottom,www.zyvex.com/nanotech/feynman.html, Caltech Insti-tute Archives 1959.
52 TiO2 Synthesis and Ink-Jet Printing
[15] Xia, Y. N.; Rogers, J. A.; Paul, K. E.; and Whitesides, G. M.,Chemical Reviews 1999, 99, 1823.
[16] Martin, C. R., Science 1994, 266, 1961.
[17] Limmer, S. J.; Seraji, S.; Forbess, M. J.; Wu, Y.; Chou, T. P.;Nguyen, C.; and Cao, G. Z., Advanced Materials 2001, 13,1269.
[18] Yang, P. D.; Zhao, D. Y.; Margolese, D. I.; Chmelka, B. F.; andStucky, G. D., Chemistry of Materials 1999, 11, 2813.
[19] Chemseddine, A. and Moritz, T., European Journal of Inor-ganic Chemistry 1999, 235.
[20] O’Brien, S.; Brus, L.; and Murray, C. B., Journal of the Ameri-can Chemical Society 2001, 123, 12085.
[21] Sugimoto, T.; Zhou, X. P.; and Muramatsu, A., Journal of Col-loid and Interface Science 2003, 259, 43.
[22] Cushing, B. L.; Kolesnichenko, V. L.; and O’Connor, C. J.,Chem. Rev. 2004, 104, 3893.
[23] Kwon, S. G. and Hyeon, T., Accounts of Chemical Research2008, 41, 1696.
[24] Chen, X. and Mao, S. S., Chemical Reviews 2007, 107, 2891.
[25] Chemseddine, A. and Moritz, T., European Journal of Inor-ganic Chemistry 1999, 235.
[26] Hench, L. L. and Ulrich, D. P., Ultrastructure Processing ofCeramics, Glasses and Composites, John Wiley, New York 1984.
[27] Yoldas, B. E., Journal of Materials Science 1986, 21, 1087.
[28] Wold, A. and Dwight, K., Solid State Chemistry: Synthesis,Structure, and Properties of Selected Oxides and Sulfides, Chap-manHall, Inc., New York 1993.
[29] Yang, J.; Mei, S.; and Ferreira, J. M. F., Materials Science En-gineering C 2001, 15, 183.

2.3 References 53
[30] Chae, S. Y.; Park, M. K.; Lee, S. K.; Kim, T. Y.; Kim, S. K.; andLee, W. I., Chemistry of Materials 2003, 15, 3326.
[31] Armstrong, A. R.; Armstrong, G.; Canales, J.; Garcia, R.; andBruce, P. G., Advanced Materials 2005, 17, 862.
[32] Bavykin, D. V.; Friedrich, J. M.; and Walsh, F. C., AdvancedMaterials 2006, 18, 2807.
[33] Yang, X. F.; Konishi, H.; Xu, H. F.; and Wu, M. M., EuropeanJournal of Inorganic Chemistry 2006, 2229.
[34] Zhang, Q. and Gao, L., Langmuir 2003, 19, 967.
[35] Kasuga, T.; Hiramatsu, M.; Hoson, A.; Sekino, T.; and Ni-ihara, K., Langmuir 1998, 14, 3160.
[36] Niederberger, M.; Garnweitner, G.; Buha, J.; Polleux, J.; Ba,J.; and Pinna, N., Journal of Sol-Gel Science Technology 2006,40, 259.
[37] www.biotage.com.
[38] Niederberger, M.; Bartl, M. H.; and Stucky, G. D., Chemistryof Materials 2002, 14, 4364.
[39] Polleux, J.; Pinna, N.; Antonietti, M.; and Niederberger, M.,Advanced Materials 2004, 16, 436.
[40] Pinna, N. and Niederberger, M., Angewandte Chemie-International Edition 2008, 47, 5292.
[41] CEM Corporation, L., Software - principles of microwavesynthesis.
[42] Baghbanzadeh, M.; Carbone, L.; Cozzoli, P. D.; and Kappe,C. O., Angewandte Chemie-International Edition 2011, 50,11312.
[43] Casavola, M.; Buonsanti, R.; Caputo, G.; and Cozzoli, P. D.,European Journal of Inorganic Chemistry 2008, 837.

54 TiO2 Synthesis and Ink-Jet Printing
[44] Niederberger, M., Accounts of Chemical Research 2007, 40, 793.
[45] Cozzoli, P. D.; Pellegrino, T.; and Manna, L., Chemical SocietyReviews 2006, 35, 1195.
[46] Xia, Y. N.; Xiong, Y. J.; Lim, B.; and Skrabalak, S. E., Ange-wandte Chemie-International Edition 2009, 48, 60.
[47] Park, J.; Joo, J.; Kwon, S. G.; Jang, Y.; and Hyeon, T., Ange-wandte Chemie-International Edition 2007, 46, 4630.
[48] Corradi, A. B.; Bondioli, F.; Focher, B.; Ferrari, A. M.; Grippo,C.; Mariani, E.; and Villa, C., Journal of American Ceramic So-ciety 2005, 88, 2639.
[49] Wu, X.; Jiang, Q. Z.; Ma, Z. F.; Fu, M.; and Shangguan, W. F.,Solid State Commun. 2005, 136, 513.
[50] Wu, J. M., Journal of Crystal Growth 2004, 269, 347.
[51] Wu, J. M.; Hayakawa, S.; Tsuru, K.; and Osaka, A., ScriptaMaterialia 2002, 46, 101.
[52] Peng, X. S. and Chen, A. C., Journal of Materials Chemistry2004, 14, 2542.
[53] Macak, J. M. and Schmuki, P., Electrochimica Acta 2006, 52,1258.
[54] Varghese, O. K.; Gong, D. W.; Paulose, M.; Ong, K. G.;Dickey, E. C.; and Grimes, C. A., Advanced Materials 2003,15, 624.
[55] Seifried, S.; Winterer, M.; and Hahn, H., Chemical Vapor De-position 2000, 6, 239.
[56] Lei, Y.; Zhang, L. D.; and Fan, J. C., Chemical Physics Letters2001, 338, 231.
[57] Calvert, P., Chemistry of Materials 2001, 13, 3299.
2.3 References 55
[58] Derby, B., Annual Review of Materials Research, volume vol 40of Annual Review of Materials Research, Annual Reviews, PaloAlto 2010, pp. 395–414.
[59] Noguera, R.; Lejeune, M.; and Chartier, T., Journal of the Eu-ropean Ceramic Society 2005, 25, 2055.
[60] Singh, M.; Haverinen, H. M.; Dhagat, P.; and Jabbour, G. E.,Advanced Materials 2010, 22, 673.
[61] Tekin, E.; Smith, P. J.; and Schubert, U. S., Soft Matter 2008, 4,703.
[62] Yoshimura, M. and Gallage, R., Journal of Solid State Electro-chemistry 2008, 12, 775.
[63] Feys, J.; Vermeir, P.; Lommens, P.; Hopkins, S. C.; Granados,X.; Glowacki, B. A.; Backer, M.; Reick, E.; Ricard, S.; andHolzapfel, B., J. Mat. Chem. 2012, 22, 3717.
[64] Tomov, R. I.; Krauz, M.; Jewulski, J.; Hopkins, S. C.; Kluc-zowski, J. R.; Glowacka, D. M.; and Glowacki, B. A., Journalof Power Sources 2010, 195, 7160.
[65] Mei, J.; Lovell, M.; and Mickle, M., Electronics PackagingManufacturing 2005, 28, 265.
[66] Martin, G. D.; Hoath, S. D.; and Hutchings, I. M., Journal ofPhysics Conference Series 2007, 105.
[67] Famili, A.; Palkar, S. A.; and Baldy, W. J., Physics of Fluids2011, 23, 1.
[68] Le, H. P., Journal of Imaging Science and Technology 1998, 42,49.
[69] http://www.fujifilmusa.com.
[70] Derby, B.; Reis, N.; Seerden, K. A. M.; Grant, P. S.; and Evans,J. R. G., Solid Freeform and Additive Fabrication, volume 625 ofMaterials Research Society Symposium Proceedings, MaterialsResearch Society, Warrendale 2000, pp. 195–201.

56 TiO2 Synthesis and Ink-Jet Printing
3Ink-Jet Printing from TiO2 Aqueous
Solutions
Stable, aqueous TiO2 solutions were prepared by a solution chem-istry route at near neutral pH, using environmentally friendlychemicals. The hydrolysis of the titanium alkoxide precursorwas controlled by adding non-toxic complexing agents prior towater addition. Solution parameters were adapted to obtain op-timal gelation conditions for further processing as thin films bychemical solution deposition. Ink-jet printing was chosen as thedeposition technique and the rheology of the inks was optimisedtowards good jettability. After printing solutions on glass sub-strates, sintering was done to obtain transparent TiO2 layers. Theeffect of synthesis conditions, thermal treatment on phase forma-tion and surface morphology of the coatings were investigated.

58 Ink-Jet Printing from TiO2 Aqueous Solutions
This chapter is adapted from the published article: ”M. Arin,P. Lommens, N. Avci, S. C. Hopkins, K. De Buysser, I. M. Ara-batzis, I. Fasaki, D. Poelman, I. Van Driessche, Ink-jet printing ofphotocatalytically active TiO2 thin films from water based precursorsolutions, Journal of the European Ceramic Society 2011, 31 (6),1067-1074”
3.1 Introduction
TiO2 films prepared by chemical solution deposition methods areattracting much attention, because of the relatively simple pro-duction of large area, high purity thin films at low cost and highscability [1–4]. At this time, most of the sol-gel chemistry liter-ature on TiO2 focuses on controlled hydrolysis in alcoholic me-dia [5–8]. However, industrial demands encourage the devel-opment of water based precursor designs. The difficulty lies inthe high reactivity of titanium alkoxide towards H2O. We wantto avoid this hydrolysis and the resultant precipitation by block-ing the hydrolysis reaction in pure aqueous media by using com-plexing ligands as stabilizing agents. For this we have chosentriethanolamine (TEA) and citric acid (CA) which are used in cos-metics and food industry respectively and thus non-toxic. So farthere are limited number of studies on aqueous TiO2 solutionsstarting from alkoxides. These are mostly prepared by solutionchemistry routes suited for spin coating where Ti4+ ions are sta-bilized at low pH levels (around 1-2) [5–10]. These low pH lev-els are unfavorable, since they complicate further industrial han-dling, can damage the substrate, and might influence phase for-mation. Furthermore, when using ink-jet printing, the solutionscan cause corrosion attack on printing parts. In Truijen’s stud-ies [11, 12], Ti4+ ions can only be stabilized at neutral pH levelsin a water based solution using a citratoperoxo method wherehighly corrosive H2O2 is used for stabilization besides citric acid.
Here, we focus on fast, economically synthesized, and com-pletely environmentally friendly solutions by eliminating toxicorganics as much as possible. To apply these precursor solutions

3.2 Synthesis of aqueous TiO2 precursor solutions 59
onto the substrate, we have shifted from the commonly used dipcoating and spin coating techniques to ink-jet printing. In thisway, completely covered surfaces can be generated with less ma-terial waste and convenient control of the coating. This ink-jetprinting based method, as explained in Chapter 2, is in line toindustrial needs for robust, high volume and precise depositionof inks [13].
In this chapter, we focused on preparing water based stableTiO2 precursors at near neutral pH and with simple complexingagents, ink-jet printing the solutions on glass substrates, and sin-tering at temperatures between 500◦C and 650◦C, to transformthe wet printed layers to the final transparent, thin, and denseTiO2 layers.
3.2 Synthesis of aqueous TiO2 precursor solutions
3.2.1 Preparation
Aqueous TiO2 precursor solutions were prepared using tetrabutylorthotitanate as the titanium source (TnBT), citric acid (CA) andtriethanolamine (TEA) as complexing agents. Small amounts ofethanol (EtOH) (Absolute, Panreac) were used to dissolve themetal alkoxide and help to control the hydrolysis during wateraddition. TnBT (≥ 97.0%) was purchased from Fluka, CA (99.5%)and TEA (99 + %) were purchased from Acros Organics. All ma-terials were used without further purification.
We have prepared two different precursor solutions in 50 mlquantities, with CA and TEA as complexing agents, in order toinhibit hydrolysis of titanium alkoxide, and water as the primarysolvent.
Ti-CA solution - TnBT was diluted in EtOH in a molar ratioof Ti4+:EtOH = 1:7, and CA was added (2:1 molar ratio to Ti4+)under stirring, at 60◦C. After complete dissolution of CA, the so-lution was cooled to room temperature and H2O (in 82:1 molarratio to Ti4+), mixed with EtOH (0.5:1 molar ratio to Ti4+), wasadded dropwise to the solution in order to obtain a final Ti4+
concentration of 0.4M.
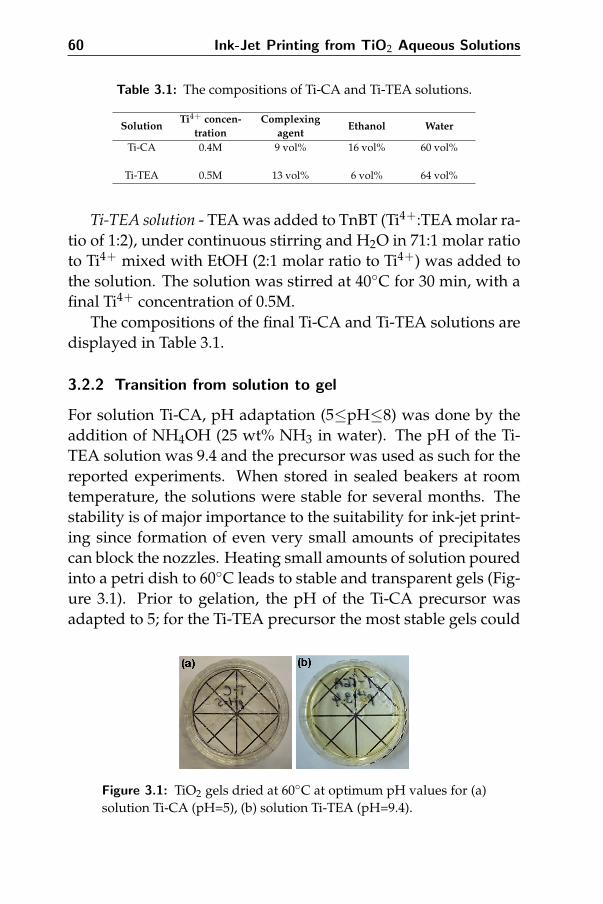
60 Ink-Jet Printing from TiO2 Aqueous Solutions
Table 3.1: The compositions of Ti-CA and Ti-TEA solutions.
SolutionTi4+ concen-
trationComplexing
agentEthanol Water
Ti-CA 0.4M 9 vol% 16 vol% 60 vol%
Ti-TEA 0.5M 13 vol% 6 vol% 64 vol%
Ti-TEA solution - TEA was added to TnBT (Ti4+:TEA molar ra-tio of 1:2), under continuous stirring and H2O in 71:1 molar ratioto Ti4+ mixed with EtOH (2:1 molar ratio to Ti4+) was added tothe solution. The solution was stirred at 40◦C for 30 min, with afinal Ti4+ concentration of 0.5M.
The compositions of the final Ti-CA and Ti-TEA solutions aredisplayed in Table 3.1.
3.2.2 Transition from solution to gel
For solution Ti-CA, pH adaptation (5≤pH≤8) was done by theaddition of NH4OH (25 wt% NH3 in water). The pH of the Ti-TEA solution was 9.4 and the precursor was used as such for thereported experiments. When stored in sealed beakers at roomtemperature, the solutions were stable for several months. Thestability is of major importance to the suitability for ink-jet print-ing since formation of even very small amounts of precipitatescan block the nozzles. Heating small amounts of solution pouredinto a petri dish to 60◦C leads to stable and transparent gels (Fig-ure 3.1). Prior to gelation, the pH of the Ti-CA precursor wasadapted to 5; for the Ti-TEA precursor the most stable gels could
Figure 3.1: TiO2 gels dried at 60◦C at optimum pH values for (a)solution Ti-CA (pH=5), (b) solution Ti-TEA (pH=9.4).

3.2 Synthesis of aqueous TiO2 precursor solutions 61
be obtained when working at a pH value around 9. The complex-ing ability and the influence of pH levels on the gel formation aredescribed in section 2.1.
3.2.3 Thermal treatment
Thermal analysis of the precursor gels was performed in order todeduce the heat treatment parameters for the formation of TiO2crystallites in the two different gels. For both gels, a continu-ous mass loss in several overlapping steps was found up to atemperature of≈520◦C. The mass losses before 200◦C are relatedto the evaporation of water, ethanol, and ammonia. For gel Ti-CA (Figure 3.2a), an exothermic peak around 540◦C is associatedwith the decomposition of the citric acid complex [14]. For bothgraphs, the peak between 270◦C and 350◦C can be attributed todecomposition of butoxide chains. For gel Ti-TEA (Figure 3.2b),the exothermic peak around 500◦C relates to the decompositionof the Ti-TEA complex. From the DTA graph, lower peak inten-sities can be observed for the Ti-CA gel compared to the Ti-TEAgel. This can be related to higher hydrolysis rates since the metalion concentration is lower for Ti-CA(0.4M) compared to Ti-TEA(0.5M), and also to the difference in pH levels for both gels. Thelower residual weight of Ti-CA (15 wt% at 550◦C) is due to thehigher water content in Ti-CA compared to Ti-TEA. We can con-clude that the TiO2 content in Ti-TEA is higher than in the Ti-CA
Figure 3.2: TGA-DTA spectra obtained for (a) Ti-CA gel , (b) Ti-TEA gel.
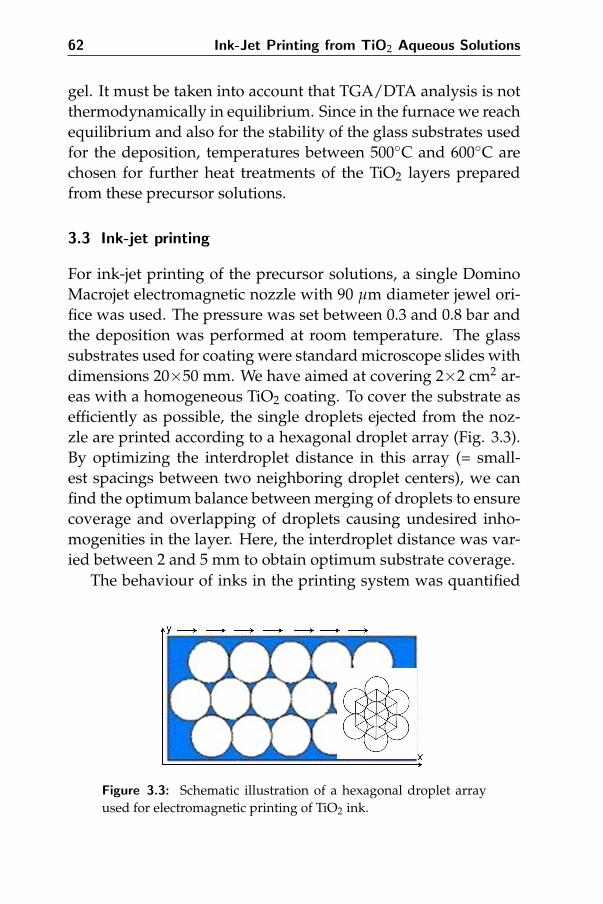
62 Ink-Jet Printing from TiO2 Aqueous Solutions
gel. It must be taken into account that TGA/DTA analysis is notthermodynamically in equilibrium. Since in the furnace we reachequilibrium and also for the stability of the glass substrates usedfor the deposition, temperatures between 500◦C and 600◦C arechosen for further heat treatments of the TiO2 layers preparedfrom these precursor solutions.
3.3 Ink-jet printing
For ink-jet printing of the precursor solutions, a single DominoMacrojet electromagnetic nozzle with 90 µm diameter jewel ori-fice was used. The pressure was set between 0.3 and 0.8 bar andthe deposition was performed at room temperature. The glasssubstrates used for coating were standard microscope slides withdimensions 20×50 mm. We have aimed at covering 2×2 cm2 ar-eas with a homogeneous TiO2 coating. To cover the substrate asefficiently as possible, the single droplets ejected from the noz-zle are printed according to a hexagonal droplet array (Fig. 3.3).By optimizing the interdroplet distance in this array (= small-est spacings between two neighboring droplet centers), we canfind the optimum balance between merging of droplets to ensurecoverage and overlapping of droplets causing undesired inho-mogenities in the layer. Here, the interdroplet distance was var-ied between 2 and 5 mm to obtain optimum substrate coverage.
The behaviour of inks in the printing system was quantified
Figure 3.3: Schematic illustration of a hexagonal droplet arrayused for electromagnetic printing of TiO2 ink.
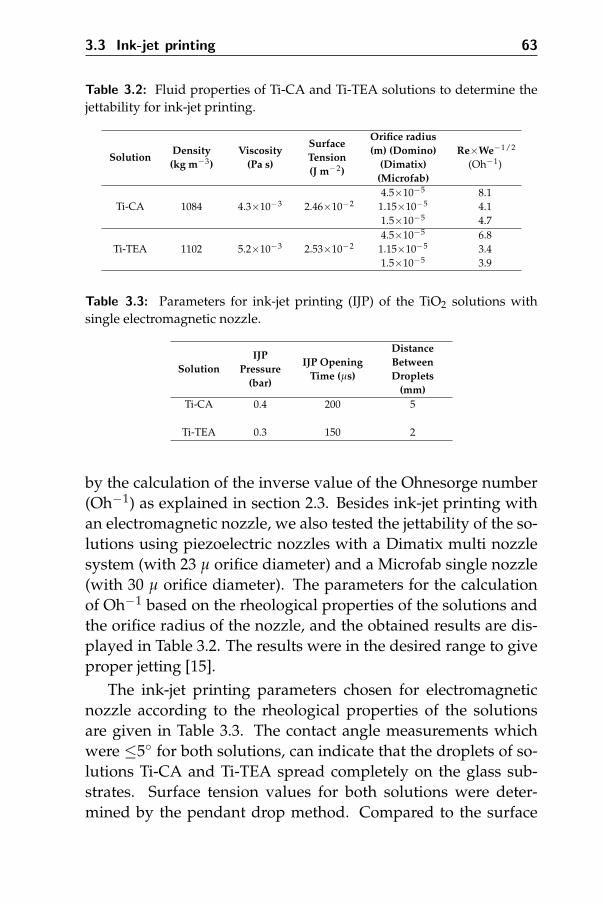
3.3 Ink-jet printing 63
Table 3.2: Fluid properties of Ti-CA and Ti-TEA solutions to determine thejettability for ink-jet printing.
SolutionDensity(kg m−3)
Viscosity(Pa s)
SurfaceTension(J m−2)
Orifice radius(m) (Domino)
(Dimatix)(Microfab)
Re×We−1/2
(Oh−1)
4.5×10⁻⁵ 8.1Ti-CA 1084 4.3×10⁻³ 2.46×10⁻² 1.15×10⁻⁵ 4.1
1.5×10⁻⁵ 4.74.5×10−5 6.8
Ti-TEA 1102 5.2×10⁻³ 2.53×10⁻² 1.15×10⁻⁵ 3.41.5×10−5 3.9
Table 3.3: Parameters for ink-jet printing (IJP) of the TiO2 solutions withsingle electromagnetic nozzle.
SolutionIJP
Pressure(bar)
IJP OpeningTime (µs)
DistanceBetweenDroplets
(mm)Ti-CA 0.4 200 5
Ti-TEA 0.3 150 2
by the calculation of the inverse value of the Ohnesorge number(Oh−1) as explained in section 2.3. Besides ink-jet printing withan electromagnetic nozzle, we also tested the jettability of the so-lutions using piezoelectric nozzles with a Dimatix multi nozzlesystem (with 23 µ orifice diameter) and a Microfab single nozzle(with 30 µ orifice diameter). The parameters for the calculationof Oh−1 based on the rheological properties of the solutions andthe orifice radius of the nozzle, and the obtained results are dis-played in Table 3.2. The results were in the desired range to giveproper jetting [15].
The ink-jet printing parameters chosen for electromagneticnozzle according to the rheological properties of the solutionsare given in Table 3.3. The contact angle measurements whichwere ≤5◦ for both solutions, can indicate that the droplets of so-lutions Ti-CA and Ti-TEA spread completely on the glass sub-strates. Surface tension values for both solutions were deter-mined by the pendant drop method. Compared to the surface

64 Ink-Jet Printing from TiO2 Aqueous Solutions
Table 3.4: Parameters of ink-jet printing (IJP) with piezoelectric nozzles.
SolutionIJP
System
IJPVoltage
(V)
DistanceBetweenDroplets
(mm)Ti-CA Dimatix 22 0.04
Microfab 18 0.11Ti-TEA Dimatix 24 0.06
Microfab 25 0.12
tension of water, which is 72 mN/m, our solutions have a lowersurface tension as 24.6 mN/m for Ti-CA and 25.3 mN/m for Ti-TEA, which explains why the droplets spread easily to form acomplete layer on the substrate. This is also explained in chaptersection 2.3. For each solution, the opening time determined thesize of each droplet printed on the substrate and was kept con-stant at an optimized value. Both solutions could be printed suc-cessfully on glass substrates without the addition of any wettingagent. Good spreading, merging and adherence of the dropletson the glass surfaces was achieved. A lower ink supply pres-sure needed to be used in order to print good layers for solutionTi-TEA in comparison with solution Ti-CA, as the viscosity of so-lution Ti-TEA (5.2 cP) is higher than that of solution Ti-CA (4.3cP).
By optimizing the droplet parameters which are displayed inTable 3.4, we did trials for printing the precursor solutions usingMicrofab and Dimatix systems on microscope glass substrates.Merging, adherence and good spreading of the droplets, and con-tinuous layers on the glass surfaces were achieved. The layerscan be seen in the optical microscopy pictures after drying andsintering at 500◦C (Fig 3.4).
Further characterization was done on the layers which wereink-jet printed using a single electromagnetic nozzle, since theywere the most smooth and homogeneous after ink-jet printing.

3.4 Characterization of the layers 65
Figure 3.4: Printed and sintered layers from Ti-CA solution using(a) Microfab single nozzle, (b) Dimatix multi nozzle system.
Figure 3.5: TiO2 layers on glass obtained by electromagneticprinting and subsequent sintering at 500◦C of (a) solution Ti-CA,(b) solution Ti-TEA.
3.4 Characterization of the layers
After electromagnetic printing and drying, the films were heatedin an O2 atmosphere between 500◦C and 600◦C. The transpar-ent and colorless sintered films are shown in Fig. 3.5. As seenin the figure, geometric figures are printed to illustrate the trans-parency.
3.4.1 Crystallographic characterization
Both powders obtained by sintering the prepared solutions andfilms were analyzed by XRD to identify the phases present (Fig.3.6). In order to determine the phase transition temperature, thepowders and films were additionally sintered at 650◦C. We foundthat all TiO2 powders and films are crystalline. At 500◦C, pureanatase phase is formed for both powders and films (Fig. 3.6a,3.6b), while at 650◦C both Ti-TEA and Ti-CA powders showed a
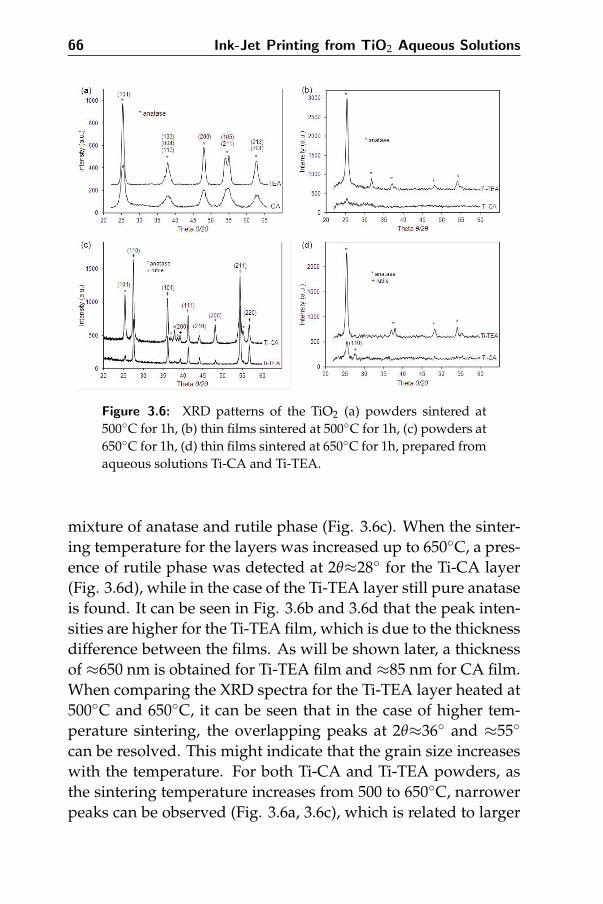
66 Ink-Jet Printing from TiO2 Aqueous Solutions
Figure 3.6: XRD patterns of the TiO2 (a) powders sintered at500◦C for 1h, (b) thin films sintered at 500◦C for 1h, (c) powders at650◦C for 1h, (d) thin films sintered at 650◦C for 1h, prepared fromaqueous solutions Ti-CA and Ti-TEA.
mixture of anatase and rutile phase (Fig. 3.6c). When the sinter-ing temperature for the layers was increased up to 650◦C, a pres-ence of rutile phase was detected at 2θ≈28◦ for the Ti-CA layer(Fig. 3.6d), while in the case of the Ti-TEA layer still pure anataseis found. It can be seen in Fig. 3.6b and 3.6d that the peak inten-sities are higher for the Ti-TEA film, which is due to the thicknessdifference between the films. As will be shown later, a thicknessof ≈650 nm is obtained for Ti-TEA film and ≈85 nm for CA film.When comparing the XRD spectra for the Ti-TEA layer heated at500◦C and 650◦C, it can be seen that in the case of higher tem-perature sintering, the overlapping peaks at 2θ≈36◦ and ≈55◦
can be resolved. This might indicate that the grain size increaseswith the temperature. For both Ti-CA and Ti-TEA powders, asthe sintering temperature increases from 500 to 650◦C, narrowerpeaks can be observed (Fig. 3.6a, 3.6c), which is related to larger

3.4 Characterization of the layers 67
Figure 3.7: SEM micrographs of surfaces of different TiO2 filmson glass prepared from solution Ti-CA sintered for 1h at (a)500◦C,(b) 600◦C and from solution Ti-TEA sintered for 1 h at (c) 500◦C,(d) 600◦C.
crystallite sizes at higher sintering temperature.
3.4.2 Morphology
SEM analysis was performed on the final TiO2 layers under lowvacuum to study the influence of the precursor formulation andsintering temperature on the morphology of the printed layers(Fig. 3.7). In the case of the layer from solution Ti-CA, largerand more elongated grains were present in between more roundshaped grains, and their concentration and size seemed to in-crease further with temperature. The TiO2 layers obtained fromsolution Ti-TEA exhibited a smoother and porous surface. Thesurface roughness of both films appeared to increase with tem-perature.
In order to determine the grain size and roughness of thefilms, AFM measurements were performed, and the results were

68 Ink-Jet Printing from TiO2 Aqueous Solutions
Figure 3.8: AFM topography maps of Ti-CA films sintered at (a)500◦C, (b) 600◦C and Ti-TEA films sintered at (c) 500◦C, (d) 600◦C
analyzed using the WSxM 4.0 software program [16] (Fig. 3.8).For TiO2 films sintered at 500◦C (Fig. 3.8a, 3.8c), the grain sizewas estimated at 90-100 nm for Ti-CA and 45-50 nm for Ti-TEAfilms. The RMS surface roughness measured on an area of 5.0µm × 5.0 µm, was 6.6 nm for the Ti-CA film and 2.5 nm forthe Ti-TEA film. When the sintering temperature was increasedto 600◦C, the grain size increased (3.8b, 3.8d), and the surfaceroughness rose to 7.6 nm for the Ti-CA film and 3.9 nm for theTi-TEA film.
3.4.3 Transparency and thickness
UV-Vis spectroscopy was used to examine the transparency ofthe films (Fig. 3.9). As a reference, commercial self-cleaning win-dow glass from Saint-Gobain (SGG Bioclean [17]) and uncoatedmicroscope glass slide were used. For the Ti-CA film, the trans-
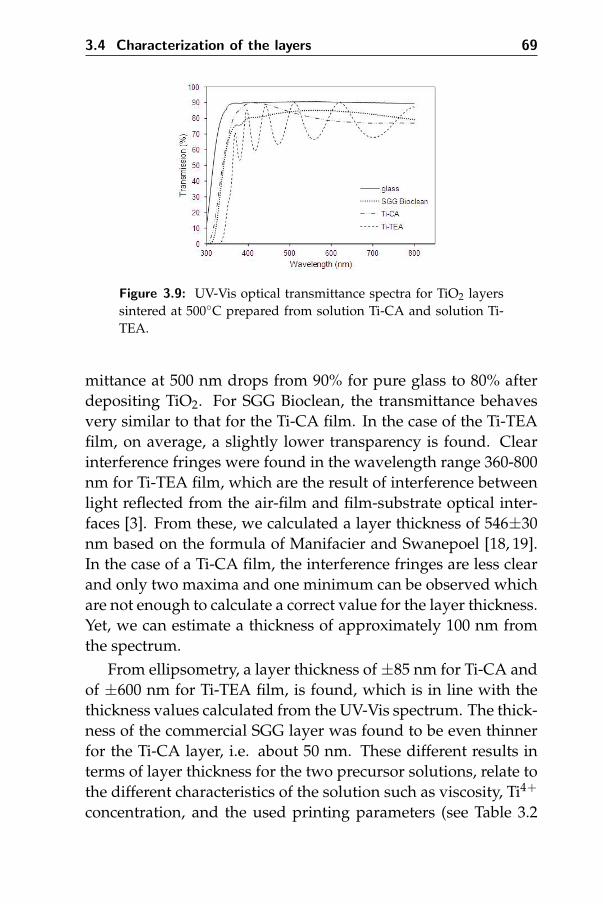
3.4 Characterization of the layers 69
Figure 3.9: UV-Vis optical transmittance spectra for TiO2 layerssintered at 500◦C prepared from solution Ti-CA and solution Ti-TEA.
mittance at 500 nm drops from 90% for pure glass to 80% afterdepositing TiO2. For SGG Bioclean, the transmittance behavesvery similar to that for the Ti-CA film. In the case of the Ti-TEAfilm, on average, a slightly lower transparency is found. Clearinterference fringes were found in the wavelength range 360-800nm for Ti-TEA film, which are the result of interference betweenlight reflected from the air-film and film-substrate optical inter-faces [3]. From these, we calculated a layer thickness of 546±30nm based on the formula of Manifacier and Swanepoel [18, 19].In the case of a Ti-CA film, the interference fringes are less clearand only two maxima and one minimum can be observed whichare not enough to calculate a correct value for the layer thickness.Yet, we can estimate a thickness of approximately 100 nm fromthe spectrum.
From ellipsometry, a layer thickness of ±85 nm for Ti-CA andof ±600 nm for Ti-TEA film, is found, which is in line with thethickness values calculated from the UV-Vis spectrum. The thick-ness of the commercial SGG layer was found to be even thinnerfor the Ti-CA layer, i.e. about 50 nm. These different results interms of layer thickness for the two precursor solutions, relate tothe different characteristics of the solution such as viscosity, Ti4+
concentration, and the used printing parameters (see Table 3.2

70 Ink-Jet Printing from TiO2 Aqueous Solutions
and 3.3). In the case of Ti-TEA, a much larger volume of precur-sor solution per area can be printed due to reasonable differencesin rheology, wetting and spreading behavior. The refractive in-dex found from ellipsometry is 1.95 for the Ti-CA film and 2.01for the Ti-TEA film at a wavelength of 632.80 nm. The values liein the range reported previously for thin, sol-gel derived, TiO2films [10], but are smaller than the value reported for bulk TiO2(≈2.54) [20] which can be related to the defects in the layers anda certain degree of porosity.
3.5 Conclusions 71
3.5 Conclusions
We have studied the preparation of TiO2 films by a chemical solu-tion deposition method using water as the primary solvent andnon-toxic substances such as citric acid and triethanolamine asstabilizing agents. These aqueous and environmentally friendlyTiO2 solutions can be deposited on glass substrates by ink-jetprinting, which is a new technique allowing cheap and fast de-position and avoiding material waste. After sintering the printedlayers between 500◦C and 600◦C, transparent TiO2 layers are ob-tained. The effect of synthesis conditions, complexing agent, pHand jettability of the solutions, phase formation and surface mor-phology of the coatings was investigated. Pure anatase phasetitania is observed in the coatings when heated to 600◦C. WhenTEA is used as complexing agent, the grain size is smaller and thesurface roughness is lower than for CA based layer. In the case ofTi-TEA, thicker layers can be produced due to differences in rhe-ology and adaptation of the printing parameters. Surface rough-ness and porosity increase with sintering temperature. From thisstudy we conclude that homogeneous, transparent, and thin TiO2layers can be obtained by combining aqueous chemical solutiondeposition route with ink-jet printing, eliminating the use of ex-pensive techniques as chemical vapor deposition, thermal meth-ods, and sputtering.
In chapter 6, the photocatalytic activity of these prepared lay-ers is further discussed.

72 Ink-Jet Printing from TiO2 Aqueous Solutions
References
[1] Yamamoto, S.; Sumita, T.; Sugiharuto; Miyashita, A.; andNaramoto, H., Thin Solid Films 2001, 401, 88.
[2] Watanabe, A.; Tsuchiya, T.; and Imai, Y., Thin Solid Films2002, 406, 132.
[3] Addamo, M.; Augugliaro, V.; Di Paola, A.; Garcia-Lopez,E.; Loddo, V.; Marci, G.; and Palmisano, L., Thin Solid Films2008, 516, 3802.
[4] Ohya, T.; Ito, M.; Yamada, K.; Ban, T.; Ohya, Y.; and Taka-hashi, Y., Journal of Sol-Gel Science and Technology 2004, 30,71.
[5] Guillard, C.; Beaugiraud, B.; Dutriez, C.; Herrmann, J. M.;Jaffrezic, H.; Jaffrezic-Renault, N.; and Lacroix, M., AppliedCatalysis B-Environmental 2002, 39, 331.
[6] Djaoued, Y.; Badilescu, S.; Ashrit, P. V.; Bersani, D.; Lottici,P. P.; and Robichaud, J., Journal of Sol-Gel Science and Technol-ogy 2002, 24, 255.
[7] Legrand-Buscema, C.; Malibert, C.; and Bach, S., Thin SolidFilms 2002, 418, 79.
[8] Kuznetsova, I. N.; Blaskov, V.; and Znaidi, L., Materials Sci-ence and Engineering B-Solid State Materials for Advanced Tech-nology 2007, 137, 31.
[9] Ohya, T.; Nakayama, A.; Shibata, Y.; Ban, T.; Ohya, Y.; andTakahashi, Y., Journal of Sol-Gel Science and Technology 2003,26, 799.
[10] Sheng, Y. G.; Liang, L. P.; Xu, Y.; Wu, D.; and Sun, Y. H.,Optical Materials 2008, 30, 1310.
[11] Truijen, I.; Van Bael, M. K.; Van den Rul, H.; D’Haen, J.; andMullens, J., Journal of Sol-Gel Science and Technology 2007, 41,43.
3.5 References 73
[12] Truijen, I.; Van Bael, M. K.; Van den Rul, H.; D’Haen, J.; andMullens, J., Journal of Sol-Gel Science and Technology 2007, 43,291.
[13] Yoshimura, M. and Gallage, R., Journal of Solid State Electro-chemistry 2008, 12, 775.
[14] Hardy, A.; Van Werde, K.; Vanhoyland, G.; Van Bael, M. K.;Mullens, J.; and Van Poucke, L. C., Thermochimica Acta 2003,397, 143.
[15] Feys, J.; Vermeir, P.; Lommens, P.; Hopkins, S. C.; Granados,X.; Glowacki, B. A.; Backer, M.; Reick, E.; Ricard, S.; andHolzapfel, B., Journal of Materials Chemistry 2012, 22, 3717.
[16] Horcas, I.; Fernandez, R.; Gomez-Rodriguez, J. M.;Colchero, J.; Gomez-Herrero, J.; and Baro, A. M., Review ofScientific Instruments 2007, 78, 8.
[17] Saint Gobain Glass France (socit anonyme) Les Miroirs, F.,18 avenue d’Alsace F-92400 Courbevoie.
[18] Swanepoel, R., Journal of Physics E-Scientific Instruments1983, 16, 1214.
[19] Manifacier, J. C.; Gasiot, J.; and Fillard, J. P., Journal of PhysicsE-Scientific Instruments 1976, 9, 1002.
[20] Nishide, T.; Sato, M.; and Hara, H., Journal of Materials Sci-ence 2000, 35, 465.

74 Ink-Jet Printing from TiO2 Aqueous Solutions

4Synthesis of Nanoparticle Containing
Suspensions
In this chapter, we present new routes for the synthesis of stablesuspensions containing TiO2 nanoparticles. They consist of thebottom-up hydrothermal synthesis from Ti4+ aqueous precursorsolutions using titanium propoxide with different ligands such asethylenediaminetetraacetic acid, triethanolamine, tetraethylam-monium hydroxide, etc. Microwave assisted hydrothermal syn-thesis is selected for the nanoparticle growth, since it providesa more efficient way of heating compared to conventional hy-drothermal synthesis. The influence of the ligands, pH, reactiontemperature and time on the particle size and crystallinity wasinvestigated and discussed.
76 Synthesis of Nanoparticle Containing Suspensions
This chapter is adapted from the published article: ”M. Arin,P. Lommens, S. C. Hopkins, G. Pollefeyt, J. Van der Eycken, S.Ricart, X. Granados, B. A. Glowacki, I. Van Driessche, Deposi-tion of photocatalytically active TiO2 films by ink-jet printing of TiO2nanoparticle suspensions obtained from microwave-assisted hydrother-mal synthesis, Nanotechnology 2012, 23 (16), 10”; and submittedarticle: ”M. Arin, G. Pollefeyt, K. De Buysser, I. Van Driessche, P.Lommens, Low Temperature Deposition of TiO2 layers from nanopar-ticle containing suspensions synthesized by microwave hydrothermaltreatment, in press, Journal of Sol-Gel Science and Technology2013”.
4.1 Introduction
In the previous chapter, we have demonstrated the preparationof thin and transparent TiO2 films from aqueous Ti4+ precur-sor solutions in which hydrolysis and the resultant precipitationwere avoided by blocking the hydrolysis reaction in pure aque-ous media using complexing ligands as stabilizing agents.Yet, toconvert these kinds of precursors to active TiO2 films, sintering attemperatures above 450◦C is still necessary. To decrease the en-ergy input and allow coatings on heat sensitive substrates such aspolymers, it is important to reduce the conversion temperature.
When using nanoparticle containing precursor suspensions,the conversion temperature can be reduced, since the desiredphase is already present and only the removal of the solvent andother chemicals is necessary to create the final, crystalline layer.Many reports discuss the synthesis of TiO2 nanoparticles throughsol-gel methods via acid catalyzed hydrolysis of titanium alkox-ide and condensation [1–3], and postsynthetic treatments. Asexplained in section 2.1, sol-gel synthesis for the preparation ofnanoparticles is a versatile technique which has the potential formass production, and it has been studied as to improve chem-istry for nanoparticle synthesis [4, 5]. In most of the studies thesol-gel method is used with a low content of water and low hy-drolysis rates, and high temperature annealing is always required
4.1 Introduction 77
to induce nanoparticle crystallization. This can lead to undesiredgrain growth and agglomeration [6]. Hydro/solvothermal meth-ods allow to perform reactions in aqueous/organic solutions, attemperatures above the boiling point [7–9]. Most of these reac-tions have durations between 12 and 24 hours, which drasticallyreduces their industrial relevance [10–12]. By using microwaveassisted hydrothermal treatment, heating is more efficient, lead-ing to much shorter reaaction times [13–16] (see section 2.2.3).
In most of the studies, microwave treatment is used in or-der to obtain TiO2 nanopowders rather than stable suspensionsdirectly. In Wilson’s studies [17, 18], the powders are collectedfrom colloidal TiO2 sols that are prepared by hydrolysis of ti-tanium isopropoxide using nitric acid as peptizing agent; alsoKomarneni [19] and Corradi [13] use titanium tetrachloride andcontrolled hydrolysis as diluted with or without acid. In orderto prepare TiO2 suspensions, organic solvents with high boilingpoints and high dielectric loss factors were used in microwavereaction as alternatives to the aqueous systems [20–22].
In contradiction to these studies, in the present work, we usea solution chemistry route to prepare Ti4+ solutions and usingmicrowave synthesis, we obtain stable suspensions containingTiO2 nanoparticles suited for thin film deposition. The study ofGressel-Michel [14] also ends with a stable TiO2 colloidal sus-pension which is directly synthesized by microwave heating oftitanium tetrachloride in acidified water. However in our work,the precursor solutions to be used for microwave treatment areprepared from titanium alkoxide with complexing agent, usingwater as the primary solvent, and pH levels close to neutral. It isimportant to obtain sols with pH around neutral levels so duringfurther deposition procedure to prevent corrosion on the nozzleof the ink-jet printer (chapter 5). In order to obtain TiO2 nanopar-ticle containing sols suited to be used as an ink for the ink-jetprinting of thin TiO2 films, the influence of different ligands andpH levels on the synthesis and final nanoparticle morphologyafter microwave treatment, acids and bases on precursor stabil-ity, microwave (MW) synthesis and nanoparticle properties were

78 Synthesis of Nanoparticle Containing Suspensions
evaluated.
4.2 Aqueous TiO2 suspensions
4.2.1 Solution synthesis
Aqueous TiO2 precursor solutions were prepared using titaniumpropoxide (TIP) (Sigma-Aldrich,≥97.0%) as the Ti4+ source, withethylenediaminetetraacetic acid (EDTA) (Acros Organics, 99.5%),diethylenetriaminepentaacetic acid (DTPA), iminodiacetic acid -(IDA) as complexing agents, and triethanolamine (TEA) (Acros,99+%), ethylenediamine (EDA), ethanolamine (EA), diethanol-amine (DEA), and tetraethylammonium hydroxide (TEAOH) (Ac-ros, 99+%) as bases. Ethylene glycol (EG) (Sigma Aldrich,≥97.0%)was added in order to increase the viscosity. Small amounts ofethanol (EtOH) (absolute, Panreac) were used to dissolve the metalalkoxide to help control hydrolysis during water addition. Allmaterials were used without further purification.
In order to obtain nanoparticle containing sols by bottom-upsynthesis, we started by preparing different aqueous Ti4+ pre-cursor solutions. Titanium propoxide (TIP) (Sigma-Aldrich,≥97.0%) was dissolved in EtOH (absolute, Panreac) in a 3.8:1 mo-lar ratio to Ti4+. Complexing agent (ca) was added (0.5:1 molarratio ca/Ti4+) to this solution with a base in 1 vol% of the totalmixture. EDTA, DTPA or IDA was used as complexing agent;TEA, EDA, EA or DEA was added as the base. The bases wereadded to the solution to increase the pH to neutral thus induc-ing dissolution of the complexing agent [23]. After stirring for1h, H2O was added rapidly in a 100:1 molar ratio to Ti4+. Im-mediate hydrolysis occurred where precipitates were observedand the solution got completely clear after stirring around 10 h.Choosing EDTA as the complexing agent and TEA as the base,a clear Ti-E solution was obtained with a final Ti4+ concentrationof 0.4 M. Solution Ti-TEAOH was prepared by dissolving TIP inEtOH in the same molar ratio. EDTA was added to this mixturein 0.5:1 EDTA/Ti4+ molar ratio. After stirring for 1h, H2O in a100:1 molar ratio to Ti4+ (mixed with TEAOH in molar ratio 3.8:1

4.2 Aqueous TiO2 suspensions 79
to Ti4+) was added and after hydrolysis, in 3-4 h a clear solutionis obtained with a final Ti4+ concentration of 0.3 M. Solution Ti-E+EG was identical to solution Ti-E, except for the addition of EGto the final precursor solution in a 10 wt% range.
4.2.2 Analysis of precursor solutions
For precursor formulation, polydentate ligands were added ascomplexing agents to the Ti4+ precursor solutions in order toprevent hydrolysis. During MW synthesis, the same chelatingmolecules might have an influence on the particle growth andstabilization. To understand the complexation effect on the syn-thesis, different polydentate ligands such as EDTA, DTPA andIDA were tested for precursor solution formulation. After dis-solving TIP in EtOH in a 3.8:1 molar ratio to Ti4+, EDTA, DTPAor IDA were added in molar ratio of 0.5:1 ca/Ti4+. All complex-ing agents are weak acids containing N-donor sites. They cancoordinate to the metal ion through maximum six, eight or threedonor sites respectively, surrounding the ion and forming a sta-ble complex. They can also get absorbed on the TiO2 particlessurface, preventing agglomeration through sterical or charge sta-bilization [24, 25]. The complexing abilities of these different lig-ands with Ti4+ ions can be compared according to the relevantcomplex formation constants. For Ti-EDTA complexes a log Kvarying from 18 to 21 is reported in literature based on the mea-surements conditions, while for Ti-DTPA complexes larger stabil-ity constants, log K = 23.05 to 23.38 are reported [26]. For IDA, nostability constants could be found in literature, yet based on themolecular structure of the different chemicals and the number offunctional groups able to coordinate to the metal ions, which is3 for IDA vs. 6 for EDTA and 8 for DTPA, it is clear that Ti-IDAcomplexes will be the weakest of three tested in this work [27].
As the second step in the precursor synthesis, after the addi-tion of EDTA, a base such as TEA, EDA, EA or DEA was addedin 1 vol% of the total mixture, to deprotonate the carboxylic func-tional groups of the complexing agents thus inducing dissolution

80 Synthesis of Nanoparticle Containing Suspensions
by raising the pH level to 5. At 25◦C, the pKa values of EDA, EA,DEA and TEA are 10.1, 9.9, 8.9 and 7.8 respectively [26]. The ad-dition of EDA, EA or DEA led to precipitation after the water ad-dition unlike TEA which was sufficient to obtain a clear solutionin combination with all complexing agents. TEA, with its highernumber of ethanol groups, clearly is acting as an additional com-plexing agent, probably not through the N-donor which is stillprotonated at these pH levels. With EDA, EA and DEA, muchhigher volume fractions need to be added in order to prevent hy-drolysis. These solutions were not used for further testing sincereduction of the organic content in the precursors is of high im-portance when working at reduced temperatures for further heattreatment.
Eliminating the carboxylic acids and using solely TEA as acomplexing ligand led to a precursor solution without any signof precipitation prior to MW treatment. However complete gela-tion occurred during the microwave treatment of this precursorstarting from 80◦C, avoiding the formation of a stable suspen-sion.
Although TEA was giving the best result as an additional basefor the synthesis of the precursor solution, it was found that afterlayer deposition and thermal treatment, most TEA bases layerssuffer from yellowish color effects unless the thermal treatmentprocedures reaches temperatures of 350◦C, leading to burn out ofthe compound. Therefore, it was replaced with tetraethylammo-nium hydroxide (TEAOH) which was added to the mixture in amolar ratio 3.8:1 to Ti4+. It has been studied that TEAOH can beused as peptizing agent for the synthesis of anatase nanoparti-cles [28]. Unlike TEA, it has no complexing effect on Ti4+ [9].The use of TEAOH as peptizing agent without any complex-ing ligand such as EDTA, resulted in a precursor with a pH of12. Trying to decrease the pH level of the solution and the solbefore and after microwave treatment ended up with precipita-tions. This prevented further use since high alkaline levels couldcause corrosion during ink-jet printing. Thus, for further use inink-jet printing, TEAOH was used with EDTA in precursor solu-

4.2 Aqueous TiO2 suspensions 81
tion synthesis.Based on these results, for microwave treatment, we contin-
ued with two types of aqueous precursor solutions: Ti-E usingEDTA, DTPA or IDA as the complexing ligand with the addi-tion of TEA as base and Ti-TEAOH in which the TEA is replacedwith TEAOH. The pH of the Ti-E solution was 5.2 and for theTi-TEAOH solution it was 6.5. From literature it is clear that thepH of the reaction solution is the most critical parameter in theMW reaction influencing crystal phase and morphology of the fi-nal particles [29]. Therefore, the pH level of the Ti-E precursorwas altered to acidic and alkaline by the addition of HNO3 andNH4OH. With the precursor containing EDTA as the complexingagent, we could vary the pH between 4.4 and 8.4 without hav-ing any precipitation; however, with DTPA or IDA altering pHled to precipitation. In the case of DTPA, this is against expec-tations, since the Ti-complexes are expected to be stronger andthus less sensitive to hydrolysis. For Ti-TEAOH solution, the pHcouldn’t be altered since the addition of even one drop of HNO3or NH4OH lead to completely hydrolyzed solution. This can bedue to the fact that TEAOH doesn’t complex the Ti4+ ions ef-ficiently and illustrates the importance of TEA as stabilizer inaqueous precursor systems for TiO2. Also in order to increasethe stabilizing of the particles during microwave treatment andincrease the viscosity, ethylene glycol (EG) was added into the re-action matrix of the solution Ti-E in a 10 wt% range and SolutionTi-E+EG was obtained.
4.2.3 Analysis of nanoparticle inks
Microwave assisted hydrothermal treatment of the solutions wasperformed with different synthesis parameters (Table 4.1). ForTi-E at different pH levels, microwave irradiation up to 140◦Ccould be applied before precipitation started to occur. For Ti-TEAOH, the microwave treatment temperature couldn’t exceed100◦C. This can be related to low stabilizing effect of TEAOH.Since using different complexing agents such as IDA or DTPA
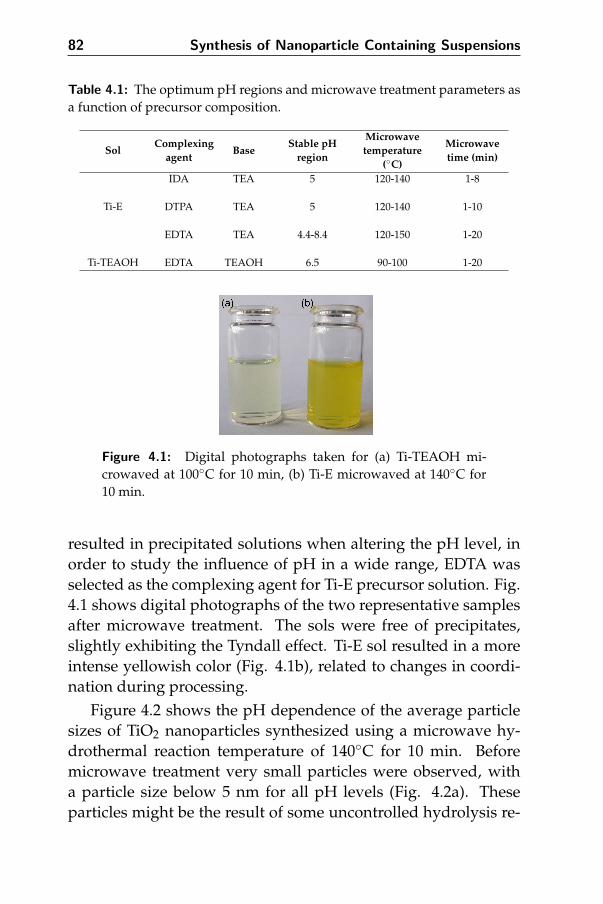
82 Synthesis of Nanoparticle Containing Suspensions
Table 4.1: The optimum pH regions and microwave treatment parameters asa function of precursor composition.
SolComplexing
agentBase
Stable pHregion
Microwavetemperature
(◦C)
Microwavetime (min)
IDA TEA 5 120-140 1-8
Ti-E DTPA TEA 5 120-140 1-10
EDTA TEA 4.4-8.4 120-150 1-20
Ti-TEAOH EDTA TEAOH 6.5 90-100 1-20
Figure 4.1: Digital photographs taken for (a) Ti-TEAOH mi-crowaved at 100◦C for 10 min, (b) Ti-E microwaved at 140◦C for10 min.
resulted in precipitated solutions when altering the pH level, inorder to study the influence of pH in a wide range, EDTA wasselected as the complexing agent for Ti-E precursor solution. Fig.4.1 shows digital photographs of the two representative samplesafter microwave treatment. The sols were free of precipitates,slightly exhibiting the Tyndall effect. Ti-E sol resulted in a moreintense yellowish color (Fig. 4.1b), related to changes in coordi-nation during processing.
Figure 4.2 shows the pH dependence of the average particlesizes of TiO2 nanoparticles synthesized using a microwave hy-drothermal reaction temperature of 140◦C for 10 min. Beforemicrowave treatment very small particles were observed, witha particle size below 5 nm for all pH levels (Fig. 4.2a). Theseparticles might be the result of some uncontrolled hydrolysis re-

4.2 Aqueous TiO2 suspensions 83
Figure 4.2: Size distribution curves obtained from DLS measure-ments for (a) Ti-E precursor solution (b) Ti-E sol after microwavetreatment at 140◦C for 10 min at different pH values.
actions during precursor formulation [30]. The average diameterof these small particles tends to increase with the reaction pH,which suggests that they are indeed hydroxide species since ahigher hydroxide concentration leads to higher hydrolysis. Asobserved in Fig. 4.2b, after microwave treatment at 140◦C for10 minutes, nanoparticles varying from 24 to 42 nm in diameter(based on the intensity average plots) were obtained dependingon the pH. Upon MW irradiation of samples with a pH of 4.4 to6.7, the growth of nanoparticles can be observed and the largestparticles are obtained at a pH of 5.2. At alkaline pH (8.4) almostno particle growth is observed. At pH levels above 8.4, turbidsols are being obtained. These results are in line with the study ofSugimoto [31] where the yield for the conversion of hydrolyzed

84 Synthesis of Nanoparticle Containing Suspensions
Ti(OH)x to crystalline titania in water at 100◦C is followed as afunction of pH levels. In this study, it is clearly found that at pHlevels of 8 or more almost no TiO2 is being formed, while conver-sion reaches a maximum at a pH of 2. This is probably related tothe concentration of Ti(OH)3
+ species in solution. A similar trendin the dependence of the particle size on the reaction solution pHhas been observed by Jolivet et al [32]. They found that when ag-ing anatase titania nanoparticles from hydrolyzed TiCl4 in aque-ous media at pH values between 2 and 6, the largest particles areobtained at the pH values which are closest to the point of zerocharge for anatase titania (pH = 5.3), which is also the case here.These observations are attributed to changes in electrostatic sur-face charge density, where stabilization of the nanoparticles byincreased surface charging protects them against further growththrough e.g. Ostwald ripening or agglomeration.
In Figure 4.3a, the influence of microwave treatment time onthe particle size is shown. In the case of the Ti-E precursor withpH = 4.4, an increase in the MW irradiation time from 0 to 15min, leads to the disappearance of the small hydrolyzed speciespresent in the precursor and generates particles with a diameterincreasing from 5 to 29 nm after 15 minutes. Zeta potential mea-surement for this final Ti-E suspension, shows a negative valueof -72 mV, indicating that the particles carry a negative chargewhich is large enough to stabilize them in the aqueous solution.This confirms the high stability of the nanoparticles inside theTi-E sol [33]. The zeta potential values for industrial grade bulkTiO2 at neutral pH level is found to be around -25 mV [34].
Similar trends trends in nanoparticle growth during MW treat-ment can be seen for the Ti-TEAOH sol in Figure 4.3b. The max-imum microwave temperature for this solution couldn’t exceed100◦C, since precipitations resulting from uncontrolled hydroly-sis started to occur after this temperature. During 0 and 10 min-utes MW time, the particles grow to an avarage particle diameterof 40 nm. Maximum microwave dwell time for this sol was 10min.
For some experiments, the sols were destabilized and the pre-
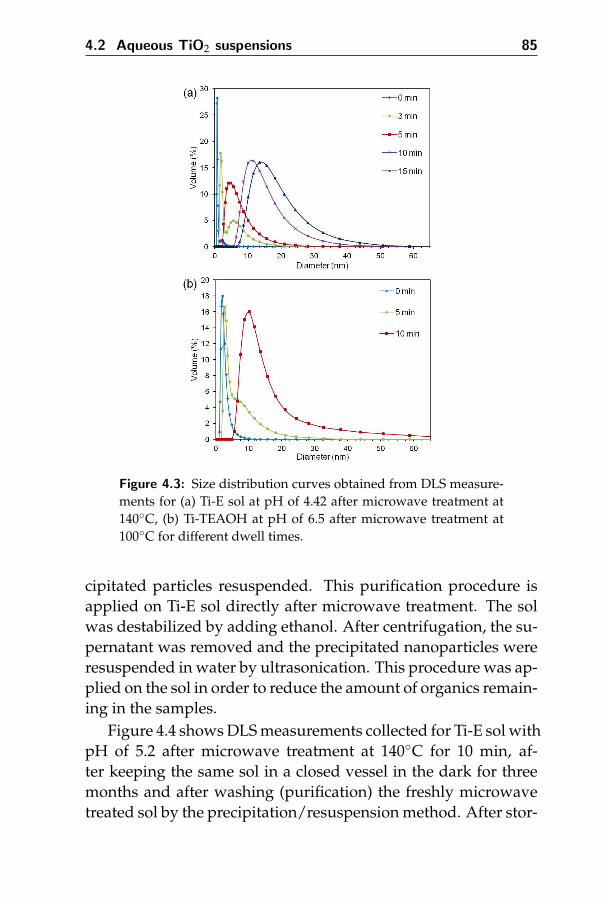
4.2 Aqueous TiO2 suspensions 85
Figure 4.3: Size distribution curves obtained from DLS measure-ments for (a) Ti-E sol at pH of 4.42 after microwave treatment at140◦C, (b) Ti-TEAOH at pH of 6.5 after microwave treatment at100◦C for different dwell times.
cipitated particles resuspended. This purification procedure isapplied on Ti-E sol directly after microwave treatment. The solwas destabilized by adding ethanol. After centrifugation, the su-pernatant was removed and the precipitated nanoparticles wereresuspended in water by ultrasonication. This procedure was ap-plied on the sol in order to reduce the amount of organics remain-ing in the samples.
Figure 4.4 shows DLS measurements collected for Ti-E sol withpH of 5.2 after microwave treatment at 140◦C for 10 min, af-ter keeping the same sol in a closed vessel in the dark for threemonths and after washing (purification) the freshly microwavetreated sol by the precipitation/resuspension method. After stor-
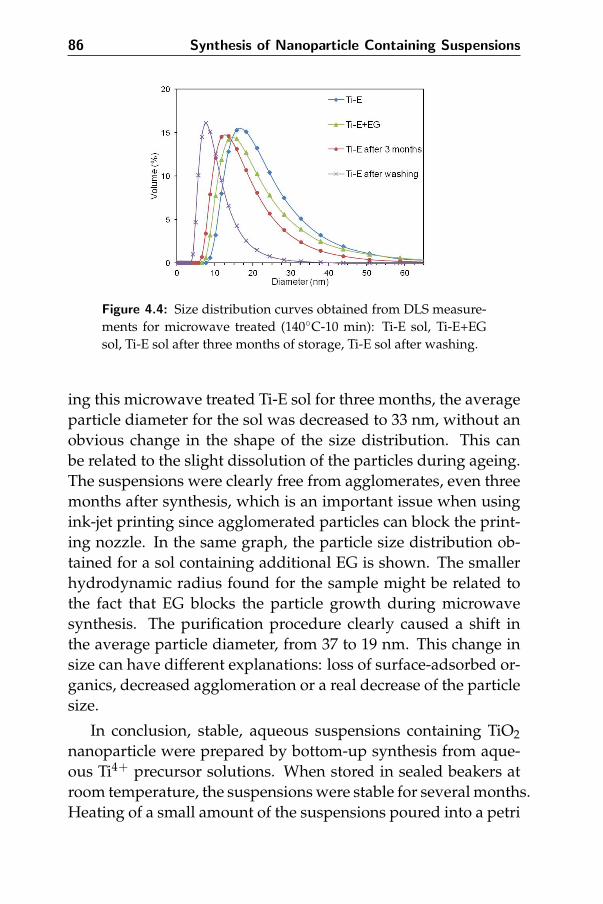
86 Synthesis of Nanoparticle Containing Suspensions
Figure 4.4: Size distribution curves obtained from DLS measure-ments for microwave treated (140◦C-10 min): Ti-E sol, Ti-E+EGsol, Ti-E sol after three months of storage, Ti-E sol after washing.
ing this microwave treated Ti-E sol for three months, the averageparticle diameter for the sol was decreased to 33 nm, without anobvious change in the shape of the size distribution. This canbe related to the slight dissolution of the particles during ageing.The suspensions were clearly free from agglomerates, even threemonths after synthesis, which is an important issue when usingink-jet printing since agglomerated particles can block the print-ing nozzle. In the same graph, the particle size distribution ob-tained for a sol containing additional EG is shown. The smallerhydrodynamic radius found for the sample might be related tothe fact that EG blocks the particle growth during microwavesynthesis. The purification procedure clearly caused a shift inthe average particle diameter, from 37 to 19 nm. This change insize can have different explanations: loss of surface-adsorbed or-ganics, decreased agglomeration or a real decrease of the particlesize.
In conclusion, stable, aqueous suspensions containing TiO2nanoparticle were prepared by bottom-up synthesis from aque-ous Ti4+ precursor solutions. When stored in sealed beakers atroom temperature, the suspensions were stable for several months.Heating of a small amount of the suspensions poured into a petri
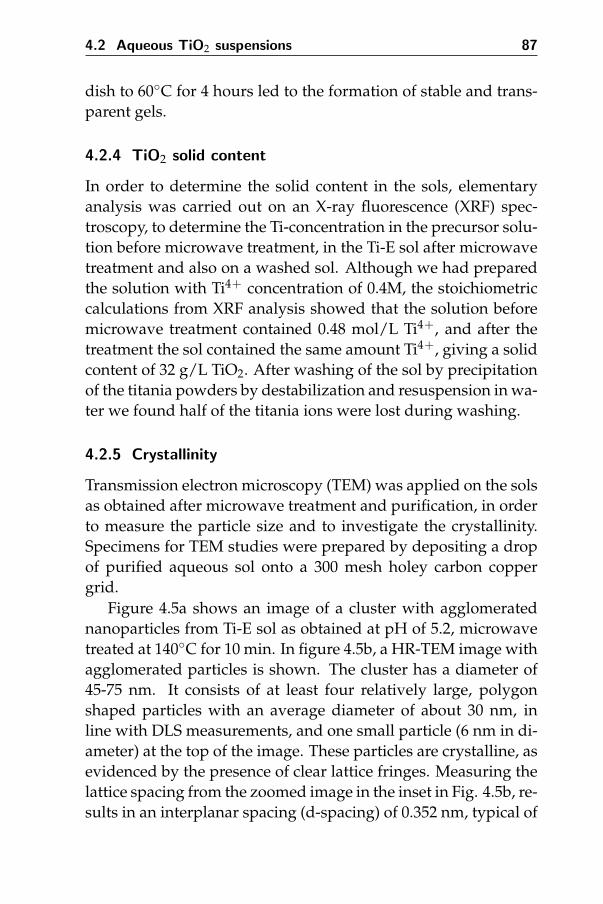
4.2 Aqueous TiO2 suspensions 87
dish to 60◦C for 4 hours led to the formation of stable and trans-parent gels.
4.2.4 TiO2 solid content
In order to determine the solid content in the sols, elementaryanalysis was carried out on an X-ray fluorescence (XRF) spec-troscopy, to determine the Ti-concentration in the precursor solu-tion before microwave treatment, in the Ti-E sol after microwavetreatment and also on a washed sol. Although we had preparedthe solution with Ti4+ concentration of 0.4M, the stoichiometriccalculations from XRF analysis showed that the solution beforemicrowave treatment contained 0.48 mol/L Ti4+, and after thetreatment the sol contained the same amount Ti4+, giving a solidcontent of 32 g/L TiO2. After washing of the sol by precipitationof the titania powders by destabilization and resuspension in wa-ter we found half of the titania ions were lost during washing.
4.2.5 Crystallinity
Transmission electron microscopy (TEM) was applied on the solsas obtained after microwave treatment and purification, in orderto measure the particle size and to investigate the crystallinity.Specimens for TEM studies were prepared by depositing a dropof purified aqueous sol onto a 300 mesh holey carbon coppergrid.
Figure 4.5a shows an image of a cluster with agglomeratednanoparticles from Ti-E sol as obtained at pH of 5.2, microwavetreated at 140◦C for 10 min. In figure 4.5b, a HR-TEM image withagglomerated particles is shown. The cluster has a diameter of45-75 nm. It consists of at least four relatively large, polygonshaped particles with an average diameter of about 30 nm, inline with DLS measurements, and one small particle (6 nm in di-ameter) at the top of the image. These particles are crystalline, asevidenced by the presence of clear lattice fringes. Measuring thelattice spacing from the zoomed image in the inset in Fig. 4.5b, re-sults in an interplanar spacing (d-spacing) of 0.352 nm, typical of

88 Synthesis of Nanoparticle Containing Suspensions
Figure 4.5: TEM image of TiO2 nanoparticles inside Ti-E sol (mi-crowaved at 140◦C for 10 min) showing (a) a cluster of agglomer-ated particles, (b) lattice fringes on the same cluster, (c), selected-area electron diffraction pattern (SAED).
the (101) plane in anatase phase titania [35–37]. The fringes cor-responding to this lattice plane were the most prominent in allimages being collected. However, inter-planar spacings for the(120) and (111) planes of brookite are too similar to unambigu-ously distinguish between brookite and anatase from HR-TEMimages alone. These results were further confirmed by collectinga SAED pattern for figure 4.5a. As can be seen from figure 4.5c,the pattern shows discrete spots indicative of the presence of sin-gle crystal nanocrystalline material. By drawing circles throughall the most intense spots, the corresponding inter-planar spac-ings could be extracted i.e. 0.355nm, 0.238 nm, 0.188 nm and0.169 nm. These are in good agreement with the expected spac-ings for the (101), (004), (200), (211) anatase planes [38].

4.2 Aqueous TiO2 suspensions 89
Figure 4.6: TEM images collected for the Ti-E sol at pH 4.4 mi-crowaved at 140◦C for (a) 10 min, (b) 20 min.
Figure 4.6 shows the image of nanoparticles obtained fromthe Ti-E suspension at lower pH level. A part of the imagednanoparticles were crystalline, as evidenced by the presence ofclear lattice fringes (Fig. 4.6a). Measuring the lattice spacingfrom the zoomed image in the inset, also results in (101) planein anatase phase titania. The fringes corresponding to this lat-tice plane were the most prominent in all images being collected.Depending on the synthesis conditions, nanoparticles exhibitedirregular shapes with a particle size around 10 nm. By increasingmicrowave time from 10 to 20 min, bigger particles with more ir-regular shapes can be observed (Fig. 4.6b). For Ti-TEAOH sol itwas very hard to obtain sharp images which is related to the highvolume fraction of amorphous phase present in the sol, which isdiscussed further.
In addition to TEM analysis, we also performed XRD analysison the obtained powders in order to analyze the crystallinity ofthe as-synthesized nanoparticles and the influence of heat treat-ment. During the purification process after the supernatant isremoved, the precipitated powders are collected and dried in thefurnace. By using XRD and Rietveld analysis, we determined thecrystal structure and quantified the amorphous fraction presentin the microwaved samples, as shown in Figure 4.7. For the pow-ders destabilized from Ti-E precursor microwaved at 140◦C for10-15 min, wide anatase reflections are seen at 2θ=25.3◦, 37.8◦,

90 Synthesis of Nanoparticle Containing Suspensions
Figure 4.7: XRD patterns collected for TiO2 powders destabilizedfrom Ti-E precursor at pH 4.4 after microwaving at 140◦C for (a)10 min, (b) 15min.
48◦ and 54◦. Yet, there is a significant background related to thepresence of a large amorphous fraction. When the microwavetreatment time is increased from 10 min to 15 minutes, there is aslight increase in the intensity of the peaks.
Washed powders obtained from the Ti-E+EG sol (microwavetreated at 140◦C for 10 min) were dried at 60◦C and further heatedtreated up to 500◦C under air. For dried, as-obtained samples, wefind poorly-defined and very broad anatase reflections at 2θ=25.3◦,37.8◦, 48◦ and 54◦ (Figure 4.8). Calcination of these samples at350◦C and 500◦C increases the crystallinity with obvious, sharpreflections related to the anatase phase. The decreasing peakwidth with increasing temperature is obviously related to the in-crease in grain growth of the crystalline material.
A 10 wt% ZnO internal standard was added to the dried TiO2sols after purification and XRD analysis was performed on thedried powders. Topas Academic V4.1 software was used for Ri-etveld refinement [39]. By adding a known weight fraction ofa crystal internal standard to the mixture, weight fractions forother phases in the specimen can be calculated using the com-position and cell parameters of the phases [40]. By using thisinternal standard we could calculate that the crystalline fraction
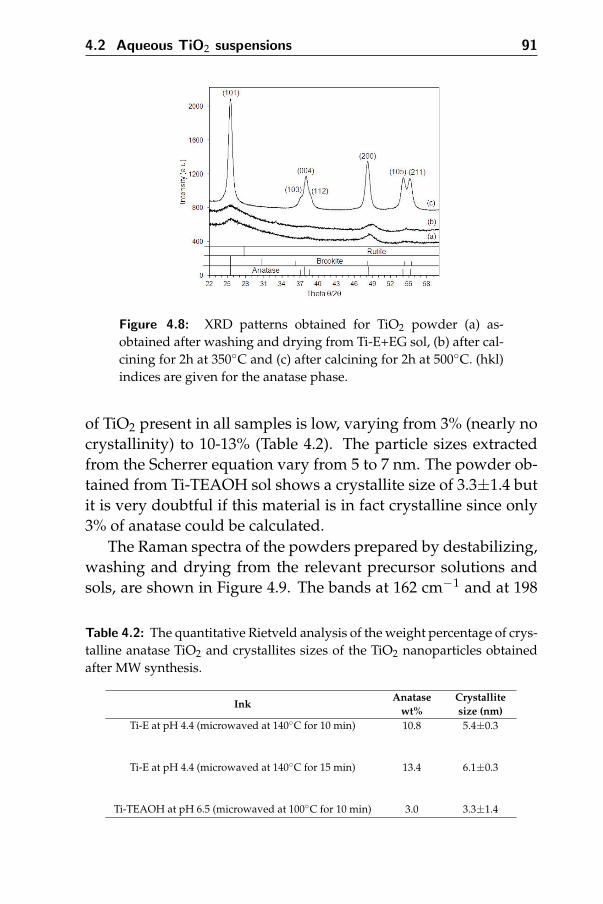
4.2 Aqueous TiO2 suspensions 91
Figure 4.8: XRD patterns obtained for TiO2 powder (a) as-obtained after washing and drying from Ti-E+EG sol, (b) after cal-cining for 2h at 350◦C and (c) after calcining for 2h at 500◦C. (hkl)indices are given for the anatase phase.
of TiO2 present in all samples is low, varying from 3% (nearly nocrystallinity) to 10-13% (Table 4.2). The particle sizes extractedfrom the Scherrer equation vary from 5 to 7 nm. The powder ob-tained from Ti-TEAOH sol shows a crystallite size of 3.3±1.4 butit is very doubtful if this material is in fact crystalline since only3% of anatase could be calculated.
The Raman spectra of the powders prepared by destabilizing,washing and drying from the relevant precursor solutions andsols, are shown in Figure 4.9. The bands at 162 cm−1 and at 198
Table 4.2: The quantitative Rietveld analysis of the weight percentage of crys-talline anatase TiO2 and crystallites sizes of the TiO2 nanoparticles obtainedafter MW synthesis.
InkAnatase
wt%Crystallitesize (nm)
Ti-E at pH 4.4 (microwaved at 140◦C for 10 min) 10.8 5.4±0.3
Ti-E at pH 4.4 (microwaved at 140◦C for 15 min) 13.4 6.1±0.3
Ti-TEAOH at pH 6.5 (microwaved at 100◦C for 10 min) 3.0 3.3±1.4
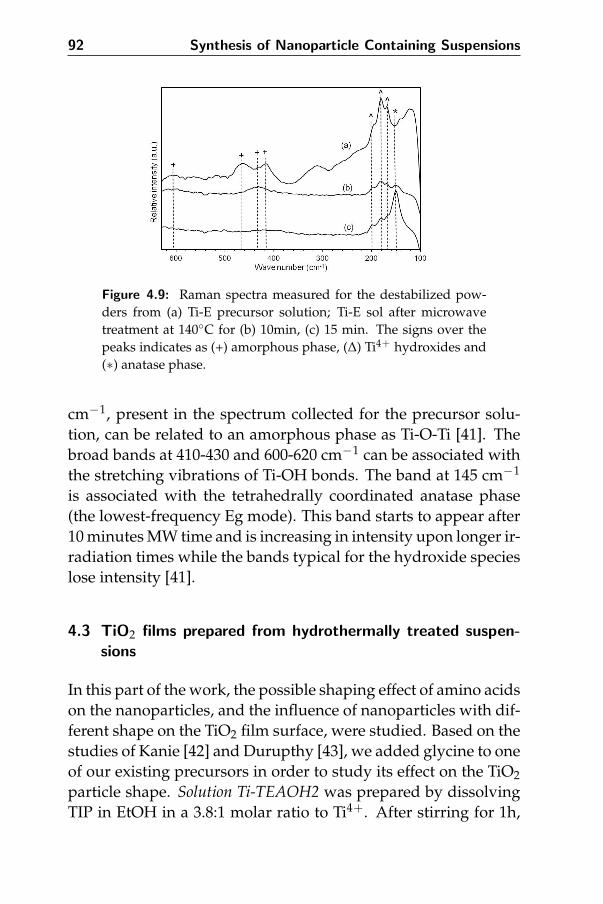
92 Synthesis of Nanoparticle Containing Suspensions
Figure 4.9: Raman spectra measured for the destabilized pow-ders from (a) Ti-E precursor solution; Ti-E sol after microwavetreatment at 140◦C for (b) 10min, (c) 15 min. The signs over thepeaks indicates as (+) amorphous phase, (∆) Ti4+ hydroxides and(∗) anatase phase.
cm−1, present in the spectrum collected for the precursor solu-tion, can be related to an amorphous phase as Ti-O-Ti [41]. Thebroad bands at 410-430 and 600-620 cm−1 can be associated withthe stretching vibrations of Ti-OH bonds. The band at 145 cm−1
is associated with the tetrahedrally coordinated anatase phase(the lowest-frequency Eg mode). This band starts to appear after10 minutes MW time and is increasing in intensity upon longer ir-radiation times while the bands typical for the hydroxide specieslose intensity [41].
4.3 TiO2 films prepared from hydrothermally treated suspen-sions
In this part of the work, the possible shaping effect of amino acidson the nanoparticles, and the influence of nanoparticles with dif-ferent shape on the TiO2 film surface, were studied. Based on thestudies of Kanie [42] and Durupthy [43], we added glycine to oneof our existing precursors in order to study its effect on the TiO2particle shape. Solution Ti-TEAOH2 was prepared by dissolvingTIP in EtOH in a 3.8:1 molar ratio to Ti4+. After stirring for 1h,

4.3 TiO2 films prepared from hydrothermally treated suspensions93
H2O in a 100:1 molar ratio to Ti4+ (mixed with TEAOH in mo-lar ratio 3.8:1 to Ti4+) was added and after hydrolysis, in 3-4 ha clear solution is obtained with a final Ti4+ concentration of 0.3M. Glycine was added to the solution in molar ratio 0,2:1 to Ti4+.The solutions were microwave treated at different time intervalsand temperatures, yet always leading to uncontrollable particlegrowth. This might be related to the decomposition of glycine inthe MW furnace. Therefore, we decided to test conventional hy-drothermal treatment, since it was also used by Kanie et. al. [42]in their original work. Ti-TEAOH2 solutions without and withglycine were hydrothermally treated in an autoclave in a mufflefurnace at 100◦C for 4h.
From DLS measurements we found that the obtained sols con-tained monodisperse particles with an average size of 16 nm forTi-TEAOH2 sol without glycine and 95 nm with glycine. TEMmeasurements on both sols (Fig. 4.10) show the influence of aminoacid on the particle size and shape. Irregular, slightly elongatedparticles with a size around 10 nm can be observed for the solwithout glycine. However for the sol containing glycine, needleshaped particles with much higher diameters can be seen, whichis in line with DLS results. The SAED pattern collected for im-age 4.10a shows discrete spots indicative of the presence of sin-gle crystal nanocrystalline material. These are in good agreement
Figure 4.10: TEM images collected for the hydrothermally treated(a) Ti-TEAOH2 sol without glycine, (b) Ti-TEAOH2 sol withglycine.
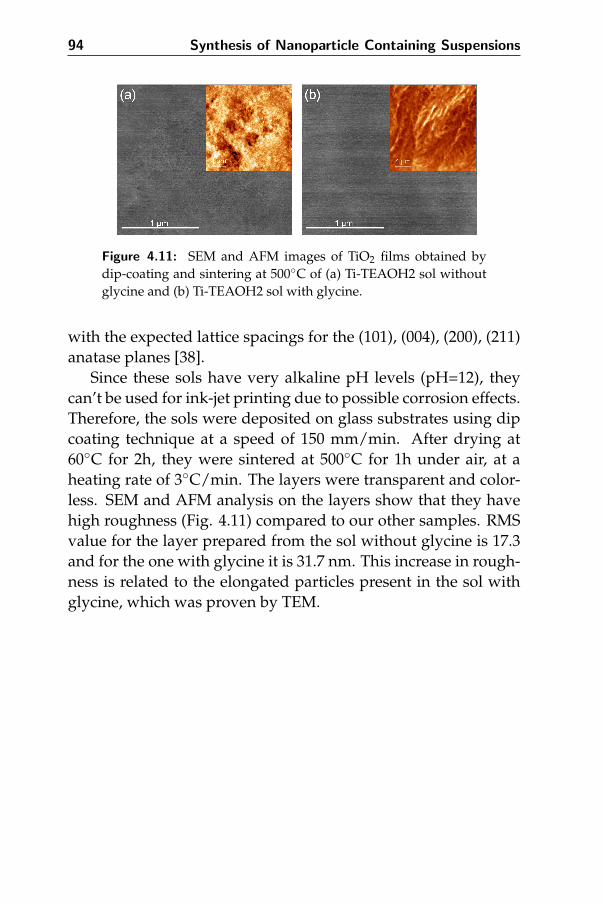
94 Synthesis of Nanoparticle Containing Suspensions
Figure 4.11: SEM and AFM images of TiO2 films obtained bydip-coating and sintering at 500◦C of (a) Ti-TEAOH2 sol withoutglycine and (b) Ti-TEAOH2 sol with glycine.
with the expected lattice spacings for the (101), (004), (200), (211)anatase planes [38].
Since these sols have very alkaline pH levels (pH=12), theycan’t be used for ink-jet printing due to possible corrosion effects.Therefore, the sols were deposited on glass substrates using dipcoating technique at a speed of 150 mm/min. After drying at60◦C for 2h, they were sintered at 500◦C for 1h under air, at aheating rate of 3◦C/min. The layers were transparent and color-less. SEM and AFM analysis on the layers show that they havehigh roughness (Fig. 4.11) compared to our other samples. RMSvalue for the layer prepared from the sol without glycine is 17.3and for the one with glycine it is 31.7 nm. This increase in rough-ness is related to the elongated particles present in the sol withglycine, which was proven by TEM.
4.4 Conclusions 95
4.4 Conclusions
TiO2 nanoparticle containing aqueous sols suitable for the depo-sition using ink-jet printing, have been prepared using bottom-up synthesis of aqueous Ti4+ precursor solutions. These solu-tions were obtained by solution chemistry synthesis using wateras the primary solvent and non-toxic substances such as ethylene-diaminetetraacetic acid, tetraethylammonium hydroxide and tri-ethanolamine as stabilizing agents. The influences of differentparameters such as complexing agents, pH levels, use of acidsand base on the behavior of the precursor solutions were dis-cussed. For the growth of nanoparticles, microwave assisted hy-drothermal synthesis was applied on the precursors. By shiftingfrom classical hydrothermal to microwave assisted hydrothermalsynthesis, we can reduce the complete synthesis time from over24 hours to 5 minutes, creating new possibilities for industrialuse of these kinds of synthesis approaches. The influence of dif-ferent microwave temperature and time intervals were investi-gated and discussed in the point of particle size and crystallinity.It is revealed that by choosing the right synthesis parameters, itis possible to prepare sols that contain nanoparticles with the de-sired diameter ranges, in a controlled way.
The next step is the deposition of the sols onto glass substratesusing ink-jet printing technique. For this, the rheology of the solsare discussed related to jettability, and they are printed on thesubstrates in order to obtain TiO2 films, as discussed in the fol-lowing chapter.
96 Synthesis of Nanoparticle Containing Suspensions
References
[1] Bessekhouad, Y.; Robert, D.; and Weber, J. V., Journal of Pho-tochemistry and Photobiology a-Chemistry 2003, 157, 47.
[2] Oskam, G.; Nellore, A.; Penn, R. L.; and Searson, P. C., Jour-nal of Physical Chemistry B 2003, 107, 1734.
[3] Sugimoto, T., Advances in Colloid and Interface Science 1987,28, 65.
[4] Li, X. S.; Fryxell, G. E.; Birnbaum, J. C.; and Wang, C. M.,Langmuir 2004, 20, 9095.
[5] Yu, J. C.; Ho, W. K.; Yu, J. G.; Hark, S. K.; and Iu, K., Langmuir2003, 19, 3889.
[6] Cozzoli, P. D.; Kornowski, A.; and Weller, H., Journal of theAmerican Chemical Society 2003, 125, 14539.
[7] Kasuga, T.; Hiramatsu, M.; Hoson, A.; Sekino, T.; and Ni-ihara, K., Langmuir 1998, 14, 3160.
[8] Wang, X.; Zhuang, J.; Peng, Q.; and Li, Y. D., Nature 2005,437, 121.
[9] Yang, J.; Mei, S.; and Ferreira, J. M. F., Journal of the AmericanCeramic Society 2000, 83, 1361.
[10] Chen, X. and Mao, S. S., Chemical Reviews 2007, 107, 2891.
[11] Ovenstone, J. and Yanagisawa, K., Chemistry of Materials1999, 11, 2770.
[12] Wang, C. C. and Ying, J. Y., Chemistry of Materials 1999, 11,3113.
[13] Corradi, A. B.; Bondioli, F.; Focher, B.; Ferrari, A. M.; Grippo,C.; Mariani, E.; and Villa, C., Journal of the American CeramicSociety 2005, 88, 2639.

4.4 References 97
[14] Gressel-Michel, E.; Chaumont, D.; and Stuerga, D., Journal ofColloid and Interface Science 2005, 285, 674.
[15] Wu, X.; Jiang, Q. Z.; Ma, Z. F.; Fu, M.; and Shangguan, W. F.,Solid State Communications 2005, 136, 513.
[16] Bilecka, I. and Niederberger, M., CHIMIA International Jour-nal for Chemistry 2009, 63, 581.
[17] Wilson, G. J.; Will, G. D.; Frost, R. L.; and Montgomery, S. A.,Journal of Materials Chemistry 2002, 12, 1787.
[18] Wilson, G. J.; Matijasevich, A. S.; Mitchell, D. R. G.; Schulz,J. C.; and Will, G. D., Langmuir 2006, 22, 2016.
[19] Komarneni, S.; Rajha, R. K.; and Katsuki, H., Materials Chem-istry and Physics 1999, 61, 50.
[20] Bilecka, I. and Niederberger, M., Nanoscale 2010, 2, 1358.
[21] Niederberger, M.; Bartl, M. H.; and Stucky, G. D., Chemistryof Materials 2002, 14, 4364.
[22] Pinna, N. and Niederberger, M., Angewandte Chemie-International Edition 2008, 47, 5292.
[23] Thuy, T. T.; Hoste, S.; Herman, G. G.; Van de Velde, N.;De Buysser, K.; and Van Driessche, I., Journal of Sol-Gel Sci-ence and Technology 2009, 51, 112.
[24] Christy, P. D.; Melikechi, N.; Jothi, N. S. N.; Suganthi, A.R. B.; and Sagayaraj, P., Journal of Nanoparticle Research 2010,12, 2875.
[25] Wada, S.; Chikamori, H.; Noma, T.; and Suzuki, T., Journal ofMaterials Science Letters 2000, 19, 1855.
[26] Martell, A. E. and Smith, R. M., Critical Stability Constants,Plenum Press, New York 1974.
[27] Malik, W. U.; Tuli, G. D.; and Madan, R. D., Selected Topicsin Inorganic Chemistry, S. Chand, New Delhi, 7 edition 2001,pp. 332–374.

98 Synthesis of Nanoparticle Containing Suspensions
[28] Yang, J.; Mei, S.; and Ferreira, J. M. F., Journal of the EuropeanCeramic Society 2004, 24, 335.
[29] Baghbanzadeh, M.; Carbone, L.; Cozzoli, P. D.; and Kappe,C. O., Angewandte Chemie-International Edition 2011, 50,11312.
[30] Hayashi, H.; Noguchi, T.; Islam, N. M.; Hakuta, Y.; Imai, Y.;and Ueno, N., Journal of Crystal Growth 2010, 312, 3613.
[31] Sugimoto, T.; Zhou, X.; and Muramatsu, A., Journal of Colloidand Interface Science 2002, 252, 339.
[32] Jolivet, J. P.; Froidefond, C.; Pottier, A.; Chaneac, C.; Cas-saignon, S.; Tronc, E.; and Euzen, P., Jounal of Materials Chem-istry 2004, 14, 3281.
[33] BlancoLopez, M. C.; Rand, B.; and Riley, F. L., Journal of theEuropean Ceramic Society 1997, 17, 281.
[34] Valant, J. and Drobne, D., Protoplasma 2012, 249, 835.
[35] Burnside, S. D.; Shklover, V.; Barbe, C.; Comte, P.; Arendse,F.; Brooks, K.; and Gratzel, M., Chemistry of Materials 1998,10, 2419.
[36] Jun, Y. W.; Casula, M. F.; Sim, J. H.; Kim, S. Y.; Cheon, J.;and Alivisatos, A. P., Journal of the American Chemical Society2003, 125, 15981.
[37] Shklover, V.; Nazeeruddin, M. K.; Zakeeruddin, S. M.;Barbe, C.; Kay, A.; Haibach, T.; Steurer, W.; Hermann, R.;Nissen, H. U.; and Gratzel, M., Chemistry of Materials 1997,9, 430.
[38] Li, X. L.; Peng, Q.; Yi, J. X.; Wang, X.; and Li, Y. D., Chemistry-a European Journal 2006, 12, 2383.
[39] Coelho, A. A., Topas-academic, version 4.1 2007.
[40] Bish, D. L. and Howard, S. A., Journal of Applied Crystallogra-phy 1988, 21, 86.

4.4 References 99
[41] Ivanda, M.; Music, S.; Popovic, S.; and Gotic, M., Journal ofMolecular Structure 1999, 481, 645.
[42] Kanie, K. and Sugimoto, T., Chemical Communications 2004,14, 1584.
[43] Durupthy, O.; Bill, J.; and Aldinger, F., Crystal Growth Design2007, 7, 2696.

100 Synthesis of Nanoparticle Containing Suspensions

5Ink-Jet Printing of TiO2 Nanoparticle
Suspensions
In this chapter, we present an ink-jet printing approach suited forthe deposition of transparent TiO2 coatings from aqueous sus-pensions. The most promising titania nanoparticle containingsols from chapter 4, with regard to chemical stability, particle sizeand crystallinity were selected and further investigated based onrheology and jettability. After optimization of the ink-jet param-eters, the wet layers were heated at temperatures between 100◦Cand 500◦C to create transparent titanium oxide layers. The influ-ence of the heat treatment temperature on the film roughness andthickness was studied. This processing at reduced temperaturescan widen the application range of these functional layers to heatsensitive substrates such as polymers.

102 Ink-Jet Printing of TiO2 Nanoparticle Suspensions
This chapter is adapted from the published article: ”M. Arin,P. Lommens, S. C. Hopkins, G. Pollefeyt, J. Van der Eycken, S.Ricart, X. Granados, B. A. Glowacki, I. Van Driessche, Deposi-tion of photocatalytically active TiO2 films by ink-jet printing of TiO2nanoparticle suspensions obtained from microwave-assisted hydrother-mal synthesis, Nanotechnology 2012, 23 (16), 10”; and submittedarticle: ”M. Arin, G. Pollefeyt, K. De Buysser, I. Van Driessche, P.Lommens, Low Temperature Deposition of TiO2 layers from nanopar-ticle containing suspensions synthesized by microwave hydrothermaltreatment, in press, Journal of Sol-Gel Science and Technology2013”.
5.1 Introduction
In Chapter 4, we described the synthesis of aqueous TiO2 sus-pensions containing nanoparticles for the deposition of films atlow temperatures. The nanoparticles were obtained by bottom-up synthesis using microwave-assisted hydrothermal treatment.
In this chapter, we present a low-temperature method usingthese obtained aqueous suspensions containing TiO2 nanoparti-cles for producing TiO2 coatings by ink-jet printing. The TiO2suspensions used in this work are chosen according to the resultsobtained from the previous chapter. The selected suspensions arethe ones prepared by microwave treatment of aqueous precursorsolutions using titanium propoxide with different ligands such asethylenediaminetetraacetic acid, triethanolamine and tetraethy-lammonium hydroxide. This synthesis route is completely differ-ent from most typical sol-gel based approaches where hydrolyzedand/or peptized Ti-alkoxide precursors are hydrothermally trea-ted in autoclaves to create nanoparticles at higher temperaturesand pressures [1–5]. To further increase the efficiency of the coat-ing procedure, we shifted from the commonly used dip coatingand spin coating techniques to ink-jet printing to apply the coat-ings on glass substrates. The rheology of the selected sols wasfurther investigated to predict the jettability for the deposition.Electromagnetic and piezoelectric driven ink-jet printing set-ups

5.2 Aqueous TiO2 Suspensions 103
were tested to deposit the inks on glass substrates.The ink-jet printing process results in simplicity, low cost, less
material waste, and scalability to large area manufacturing, andconvenient control of the thickness of the coatings. Thin andtransparent TiO2 films were obtained by applying low tempera-ture heat treatments, and characterized on the basis of morphol-ogy.
5.2 Aqueous TiO2 Suspensions
The selected sols are Ti-E+EG at pH of 5.2 microwave treated at140◦C for 10 min, Ti-E at pH of 4.4 microwave treated at 140◦Cfor 15 min and Ti-TEAOH microwave treated at 100◦C for 10 min.The sols contained nanoparticles with an average particle diam-eter of 43 nm, 29 nm and 40 nm (as found by DLS measurementsbased on the numbered average plots using intensity) respec-tively. When stored in sealed beakers at room temperature, thesols were stable for several months. As an example, Ti-E+EG pre-cursor solution and sol after microwave treatment are displayedin Fig. 5.1. Heating of a small amount of the sol poured into apetri dish to 60◦C for 4 hours led to the formation of stable and
Figure 5.1: Digital photographs taken for (a) solution Ti-E+EGprior to microwave treatment, (b) after microwave treatment at140◦C for 10 min, (c) gel obtained after drying the sol at 60◦C, (d)heat-treated (at 150◦C) TiO2 layer on glass obtained by Dimatixpiezo-electric printing of the Ti-E+EG ink, where the sample isplaced on a paper on which geometric figures were printed to il-lustrate its transparency.
104 Ink-Jet Printing of TiO2 Nanoparticle Suspensions
transparent gels (Fig. 5.1c).Stability of the precursor suspensions against agglomeration
is important since larger clusters of particles can cause blockingof the ink-jet printheads. It has been reported that if the size ofthe particles is greater than 5% of the orifice diameter, jetting sta-bility may be impaired [6]. In Perelaer’s study [7], no cloggingproblems were observed printing even larger particles. In ourstudies with different inks, printing devices and concentrations,we have found it a practically useful rule of thumb that the parti-cle size for printable suspension inks should not exceed one fifti-eth of the diameter of the nozzle opening.
5.2.1 Rheological parameters for jettability
In order to turn the as-prepared sols into high quality coatingsby ink-jet printing, we also needed to ensure that the rheology ofthe sol/ink fulfills the criteria for ink-jet printing.
A first criterion to ensure proper jetting is the viscosity of thesolution. We find that after microwave synthesis, the sols have aviscosity of 3.5 cP, 2.8 cP and 3.1 cP for Ti-E+EG, Ti-E and Ti-TEAOH respectively. The values are within the specificationsof the two different nozzles used i.e. an electromagnetic anda piezoelectric printhead, although ideally for high-resolutionpiezoelectric printing the viscosity should be a bit higher. Detailson the printing equipments can be found in section 2.3
The inverse Ohnesorge numbers for the sols were calculatedfor ideal jettability as explained in section 2.3. For proper jettingproperties, the inverse value of the Ohnesorge number (Oh−1)should be≥2 [8,9] and 1≤Oh−1≤10 as proposed in Derby’s study[10]. In table 5.1 we show the different numbers calculated forthe Ti-E+EG, Ti-E and Ti-TEAOH sols. Ti-E+EG sol was testedfor both elecromagnetic and piezoelectric nozzles, and the othersols were only used in piezoelectric printer. So the the calcula-tions were done according to this. For piezoelectric and electro-magnetic printing, the inverse Ohnesorge numbers are approxi-mately in the target range as seen in table 5.1.

5.3 Ink-jet printing 105
Table 5.1: Fluid properties of nanoparticle containing sols to determine thejettability for ink-jet printing.
SolDensity(kg m−3)
Viscosity(Pa s)
SurfaceTension(J m−2)
Orifice radius(m) (Domino,
Dimatix)Oh−1
Ti-E+EG 1184 3.5×10⁻³ 1.7×10⁻² 4.5×10−5,1.15×10−5 8.6, 4.4
Ti-E 1184 2.8×10⁻³ 6.1×10⁻² -, 1.15×10⁻⁵ -, 10.3
Ti-TEAOH 1192 3.1×10⁻³ 2.2×10⁻² -, 1.15×10⁻⁵ -, 5.6
Next to jettability, another important rheological parameter isthe wetting behavior of the ink. It is important to obtain a suffi-cient low contact angle in order to ensure droplets to merge onthe substrate. For this, surface tension and contact angle mea-surements were done. Compared to the surface tension of water,which is 72 mN/m, Ti-E+EG sol with 17 mN/M, Ti-E sol with61 mN/m and Ti-TEOAH sol with 22 mN/m had lower surfacetension values, which explains why the droplets spread easily toform a complete layer on the substrate. Contact angle values asmeasured on glass substrates were close to the value of waterwhich is in the limit ≤5◦.
5.3 Ink-jet printing
In this work, we aimed at covering the entire surface area of theglass substrate with a homogeneous TiO2 coating by generatingdroplets of the sols from the nozzle moving linearly in a rasterpattern. All ink-jet depositions were performed at room temper-ature. The glass substrates used for coating were standard micro-scope slides with dimensions 20×50 mm. In this work, we aimedat covering a 2×2 cm2 area with a homogeneous TiO2 coating.
A first series of printing tests were performed using an elec-tromagnetic Domino nozzle with 90 µm orifice. A drop visual-ization study was performed in order to examine drop formationprocess, confirm reliable jetting, and to establish the preferredpressure and opening time. The evolution of the droplet shape
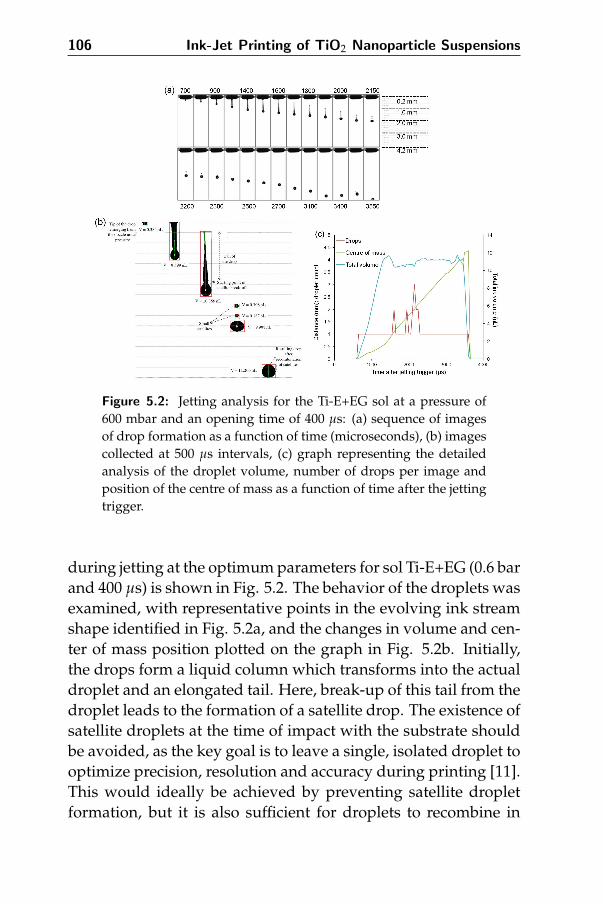
106 Ink-Jet Printing of TiO2 Nanoparticle Suspensions
Figure 5.2: Jetting analysis for the Ti-E+EG sol at a pressure of600 mbar and an opening time of 400 µs: (a) sequence of imagesof drop formation as a function of time (microseconds), (b) imagescollected at 500 µs intervals, (c) graph representing the detailedanalysis of the droplet volume, number of drops per image andposition of the centre of mass as a function of time after the jettingtrigger.
during jetting at the optimum parameters for sol Ti-E+EG (0.6 barand 400 µs) is shown in Fig. 5.2. The behavior of the droplets wasexamined, with representative points in the evolving ink streamshape identified in Fig. 5.2a, and the changes in volume and cen-ter of mass position plotted on the graph in Fig. 5.2b. Initially,the drops form a liquid column which transforms into the actualdroplet and an elongated tail. Here, break-up of this tail from thedroplet leads to the formation of a satellite drop. The existence ofsatellite droplets at the time of impact with the substrate shouldbe avoided, as the key goal is to leave a single, isolated droplet tooptimize precision, resolution and accuracy during printing [11].This would ideally be achieved by preventing satellite dropletformation, but it is also sufficient for droplets to recombine in
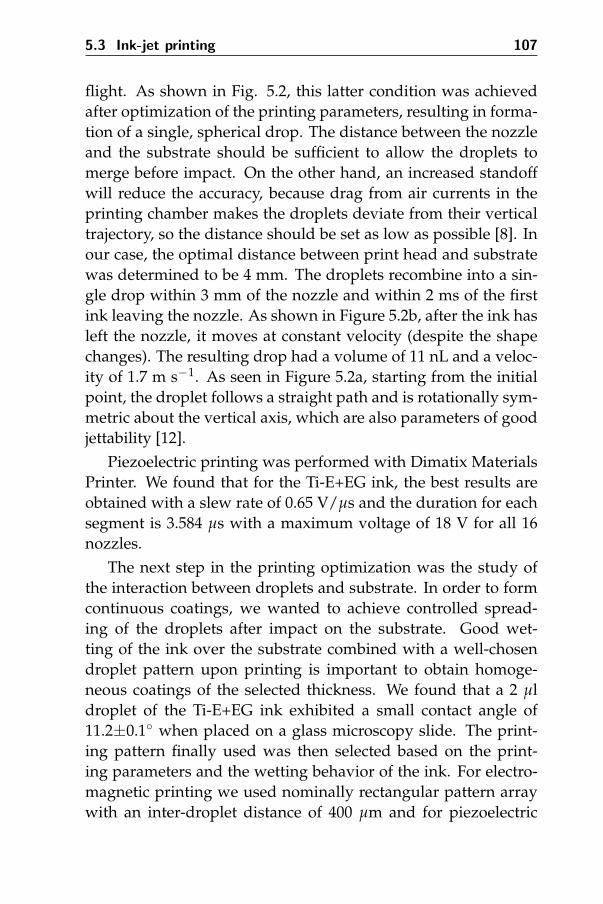
5.3 Ink-jet printing 107
flight. As shown in Fig. 5.2, this latter condition was achievedafter optimization of the printing parameters, resulting in forma-tion of a single, spherical drop. The distance between the nozzleand the substrate should be sufficient to allow the droplets tomerge before impact. On the other hand, an increased standoffwill reduce the accuracy, because drag from air currents in theprinting chamber makes the droplets deviate from their verticaltrajectory, so the distance should be set as low as possible [8]. Inour case, the optimal distance between print head and substratewas determined to be 4 mm. The droplets recombine into a sin-gle drop within 3 mm of the nozzle and within 2 ms of the firstink leaving the nozzle. As shown in Figure 5.2b, after the ink hasleft the nozzle, it moves at constant velocity (despite the shapechanges). The resulting drop had a volume of 11 nL and a veloc-ity of 1.7 m s−1. As seen in Figure 5.2a, starting from the initialpoint, the droplet follows a straight path and is rotationally sym-metric about the vertical axis, which are also parameters of goodjettability [12].
Piezoelectric printing was performed with Dimatix MaterialsPrinter. We found that for the Ti-E+EG ink, the best results areobtained with a slew rate of 0.65 V/µs and the duration for eachsegment is 3.584 µs with a maximum voltage of 18 V for all 16nozzles.
The next step in the printing optimization was the study ofthe interaction between droplets and substrate. In order to formcontinuous coatings, we wanted to achieve controlled spread-ing of the droplets after impact on the substrate. Good wet-ting of the ink over the substrate combined with a well-chosendroplet pattern upon printing is important to obtain homoge-neous coatings of the selected thickness. We found that a 2 µldroplet of the Ti-E+EG ink exhibited a small contact angle of11.2±0.1◦ when placed on a glass microscopy slide. The print-ing pattern finally used was then selected based on the print-ing parameters and the wetting behavior of the ink. For electro-magnetic printing we used nominally rectangular pattern arraywith an inter-droplet distance of 400 µm and for piezoelectric
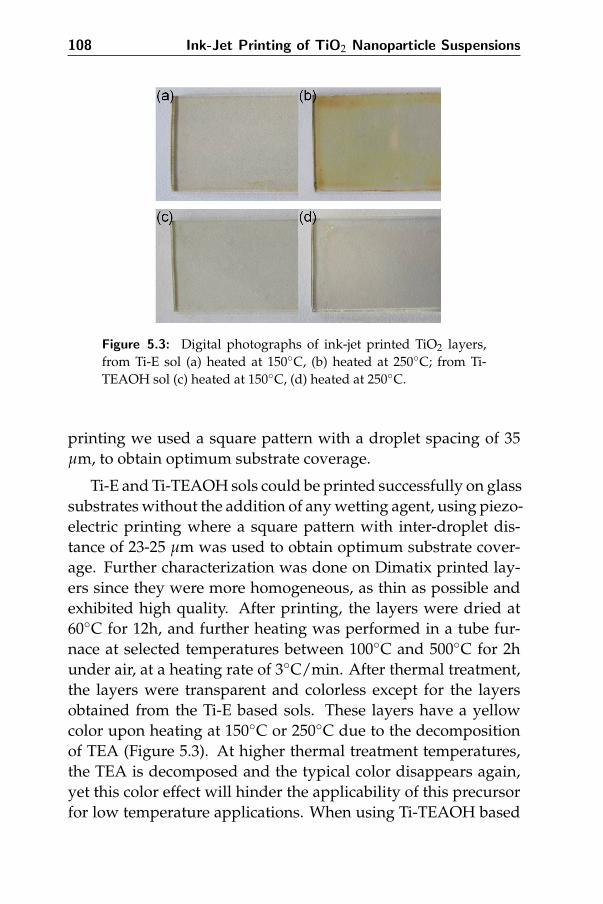
108 Ink-Jet Printing of TiO2 Nanoparticle Suspensions
Figure 5.3: Digital photographs of ink-jet printed TiO2 layers,from Ti-E sol (a) heated at 150◦C, (b) heated at 250◦C; from Ti-TEAOH sol (c) heated at 150◦C, (d) heated at 250◦C.
printing we used a square pattern with a droplet spacing of 35µm, to obtain optimum substrate coverage.
Ti-E and Ti-TEAOH sols could be printed successfully on glasssubstrates without the addition of any wetting agent, using piezo-electric printing where a square pattern with inter-droplet dis-tance of 23-25 µm was used to obtain optimum substrate cover-age. Further characterization was done on Dimatix printed lay-ers since they were more homogeneous, as thin as possible andexhibited high quality. After printing, the layers were dried at60◦C for 12h, and further heating was performed in a tube fur-nace at selected temperatures between 100◦C and 500◦C for 2hunder air, at a heating rate of 3◦C/min. After thermal treatment,the layers were transparent and colorless except for the layersobtained from the Ti-E based sols. These layers have a yellowcolor upon heating at 150◦C or 250◦C due to the decompositionof TEA (Figure 5.3). At higher thermal treatment temperatures,the TEA is decomposed and the typical color disappears again,yet this color effect will hinder the applicability of this precursorfor low temperature applications. When using Ti-TEAOH based

5.4 Layer characterization 109
sols, the final layers do not exhibit this colorization effect.
5.4 Layer characterization
5.4.1 Thickness and morphology
FIB-SEM cross-sectional analysis was performed on a series ofpiezoelectric printed layers obtained from different nanoparti-cle sols and heated at temperatures varying between 250◦C and500◦C (Figure 5.4) to quantify the thickness of the coatings. Forlayers heated below 250◦C, the remaining volume fraction of or-ganic species was still large and therefore, it was not possibleto analyze the layers by FIB-SEM. Figure 5.4a shows a cross-sectional view for a sample printed from Ti-E+EG ink heatedat 250◦C. The TiO2 layer was 130-160 nm thick and containeda small number of pores with a diameter of about 10-20 nm andsome larger defects probably related to local wetting problems.When the heating temperature was increased up to 350◦C, thelayer thickness decreased to 90-110 nm. Also the layer heatedat 500◦C had the thickness around 90-100 nm. The decrease inthickness observed as a function of heating temperature is relatedto the loss of organics. As seen in Figure 5.4, increase of the heat-ing temperature leads to a decrease in the number of pores andprinting defects.
Figure 5.4: FIB-SEM cross-sectional micrographs of TiO2 filmsprinted on glass with the multi-nozzle, piezoelectric Dimatix setupusing Ti-E+EG ink, showing the thickness of the layers after heat-ing for 2h at (a) 250◦C and (b) 350◦C.
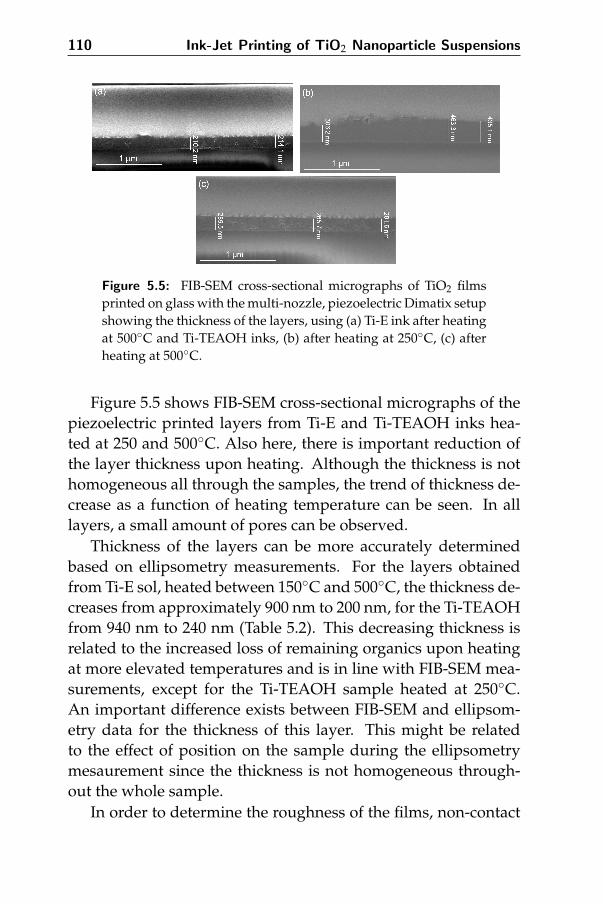
110 Ink-Jet Printing of TiO2 Nanoparticle Suspensions
Figure 5.5: FIB-SEM cross-sectional micrographs of TiO2 filmsprinted on glass with the multi-nozzle, piezoelectric Dimatix setupshowing the thickness of the layers, using (a) Ti-E ink after heatingat 500◦C and Ti-TEAOH inks, (b) after heating at 250◦C, (c) afterheating at 500◦C.
Figure 5.5 shows FIB-SEM cross-sectional micrographs of thepiezoelectric printed layers from Ti-E and Ti-TEAOH inks hea-ted at 250 and 500◦C. Also here, there is important reduction ofthe layer thickness upon heating. Although the thickness is nothomogeneous all through the samples, the trend of thickness de-crease as a function of heating temperature can be seen. In alllayers, a small amount of pores can be observed.
Thickness of the layers can be more accurately determinedbased on ellipsometry measurements. For the layers obtainedfrom Ti-E sol, heated between 150◦C and 500◦C, the thickness de-creases from approximately 900 nm to 200 nm, for the Ti-TEAOHfrom 940 nm to 240 nm (Table 5.2). This decreasing thickness isrelated to the increased loss of remaining organics upon heatingat more elevated temperatures and is in line with FIB-SEM mea-surements, except for the Ti-TEAOH sample heated at 250◦C.An important difference exists between FIB-SEM and ellipsom-etry data for the thickness of this layer. This might be relatedto the effect of position on the sample during the ellipsometrymesaurement since the thickness is not homogeneous through-out the whole sample.
In order to determine the roughness of the films, non-contact

5.4 Layer characterization 111
Table 5.2: Thickness values from ellipsometry measurements of the TiO2films prepared from aqueous nanoparticle containing sols and heated at dif-ferent temperatures.
Sol Heating temp. (◦C) Thickness (nm)Ti-E 150 900Ti-E 250 490Ti-E 350 230Ti-E 500 220
Ti-TEAOH 150 940Ti-TEAOH 250 640Ti-TEAOH 350 290Ti-TEAOH 500 240
Figure 5.6: AFM topography images of TiO2 films obtained bypiezoelectric printing of Ti-E+EG sol, heated at (a) 100◦C, (b)200◦C and (c) 300◦C.
mode AFM measurements were performed (Fig. 5.6). We an-alyzed different samples, all obtained by piezoelectric printingof a Ti-E+EG sol, microwaved at 140◦C for 10 min, and heatedat temperatures between 100◦C and 300◦C. Since sample rough-ness is an important parameter when comparing photocatalyticactivities of different samples, we determined for each samplethe RMS surface roughness on an area of 5.0 µm×5.0 µm. For asample heated at 100◦C, we found an RMS value of 3.6 nm; in-creasing the temperature up to 200◦C and 300◦C led to a decreaseof the RMS roughness to 2.1 and to 1.5 nm respectively.
SEM and AFM measurements were also performed on thelayers printed from Ti-E and Ti-TEAOH inks heated at 250◦C,350◦C and 500◦C. The micrographs (Fig. 5.7), show that the lay-ers prepared from the Ti-E ink have a more dense and smoothsurface than the layers prepared from Ti-TEAOH inks. It is ob-
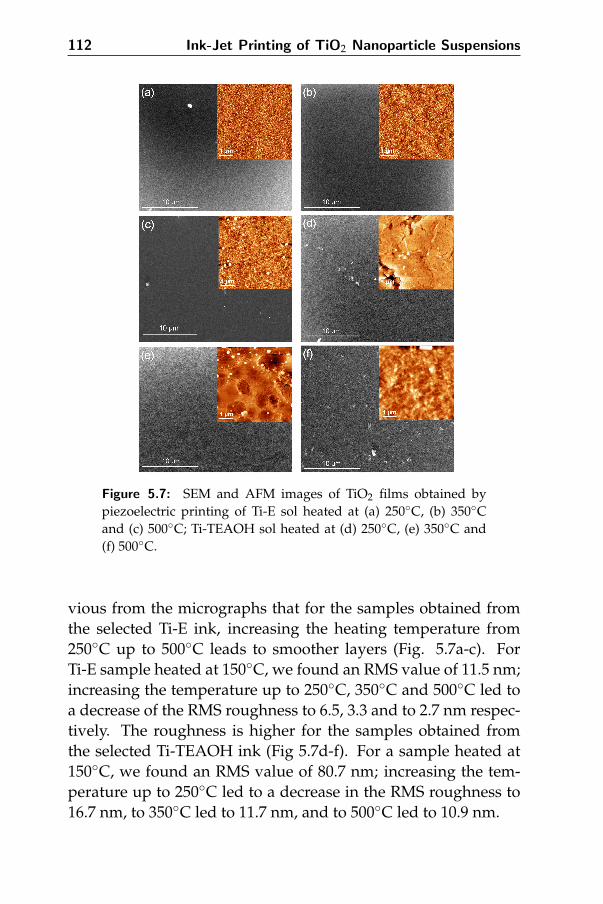
112 Ink-Jet Printing of TiO2 Nanoparticle Suspensions
Figure 5.7: SEM and AFM images of TiO2 films obtained bypiezoelectric printing of Ti-E sol heated at (a) 250◦C, (b) 350◦Cand (c) 500◦C; Ti-TEAOH sol heated at (d) 250◦C, (e) 350◦C and(f) 500◦C.
vious from the micrographs that for the samples obtained fromthe selected Ti-E ink, increasing the heating temperature from250◦C up to 500◦C leads to smoother layers (Fig. 5.7a-c). ForTi-E sample heated at 150◦C, we found an RMS value of 11.5 nm;increasing the temperature up to 250◦C, 350◦C and 500◦C led toa decrease of the RMS roughness to 6.5, 3.3 and to 2.7 nm respec-tively. The roughness is higher for the samples obtained fromthe selected Ti-TEAOH ink (Fig 5.7d-f). For a sample heated at150◦C, we found an RMS value of 80.7 nm; increasing the tem-perature up to 250◦C led to a decrease in the RMS roughness to16.7 nm, to 350◦C led to 11.7 nm, and to 500◦C led to 10.9 nm.
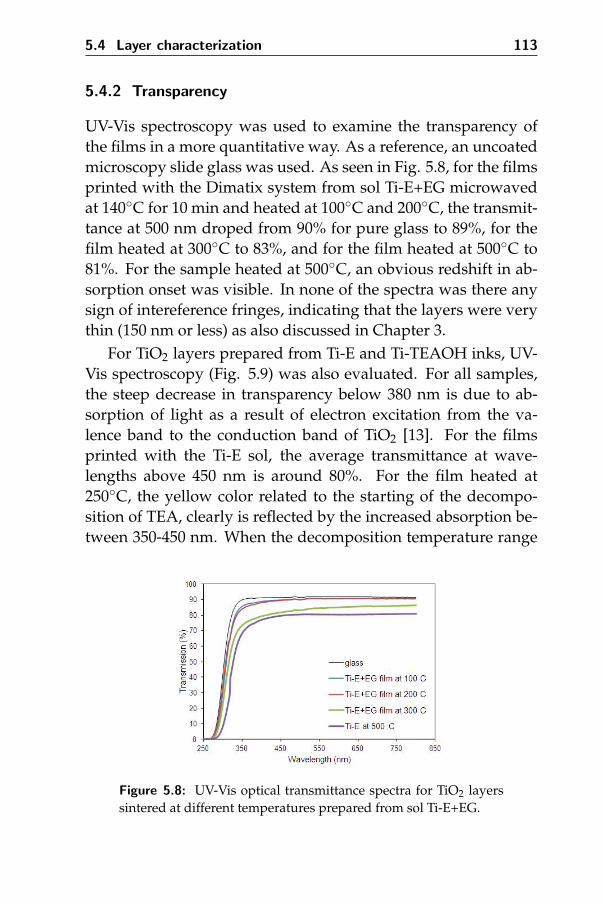
5.4 Layer characterization 113
5.4.2 Transparency
UV-Vis spectroscopy was used to examine the transparency ofthe films in a more quantitative way. As a reference, an uncoatedmicroscopy slide glass was used. As seen in Fig. 5.8, for the filmsprinted with the Dimatix system from sol Ti-E+EG microwavedat 140◦C for 10 min and heated at 100◦C and 200◦C, the transmit-tance at 500 nm droped from 90% for pure glass to 89%, for thefilm heated at 300◦C to 83%, and for the film heated at 500◦C to81%. For the sample heated at 500◦C, an obvious redshift in ab-sorption onset was visible. In none of the spectra was there anysign of intereference fringes, indicating that the layers were verythin (150 nm or less) as also discussed in Chapter 3.
For TiO2 layers prepared from Ti-E and Ti-TEAOH inks, UV-Vis spectroscopy (Fig. 5.9) was also evaluated. For all samples,the steep decrease in transparency below 380 nm is due to ab-sorption of light as a result of electron excitation from the va-lence band to the conduction band of TiO2 [13]. For the filmsprinted with the Ti-E sol, the average transmittance at wave-lengths above 450 nm is around 80%. For the film heated at250◦C, the yellow color related to the starting of the decompo-sition of TEA, clearly is reflected by the increased absorption be-tween 350-450 nm. When the decomposition temperature range
Figure 5.8: UV-Vis optical transmittance spectra for TiO2 layerssintered at different temperatures prepared from sol Ti-E+EG.

114 Ink-Jet Printing of TiO2 Nanoparticle Suspensions
Figure 5.9: UV-Vis optical transmittance spectra for TiO2 layerssintered at different temperatures prepared from (a) Ti-E sol, (b)Ti-TEAOH sol.
of TEA is passed, at 350◦C, the transmittance in this region startsto rise again. For the films printed with Ti-TEAOH sol and heatedat 150◦C and 250◦C, the transmittance is around 30% and 50%respectively (Fig. 5.9b). This loss in transparency is related toopaque nature of the films and the scattering effects related tothe defective nature of the coatings. As the heating temperatureincreases up to 350◦C and 500◦C, this effect disappears and trans-mittance again reached 75%. This result is in line with the RMSdata collected from AFM measurements, where the roughnessis estimated to be 80 nm for a sample heated at 150◦C while itdecreases down to 6 nm for the sample heated at 500◦C, whichmeans the dimensions of the scattering defects are too small toscatter light within the measuring range relevant to the spectrapresented on top.
5.4 Layer characterization 115
The wavy fluctuation of the transmittance curve over the en-tire 300-800 nm spectral region is due to interference effects whichare mainly determined by the thickness of the thin film and therefractive index of the material and substrate. This thickness dif-ference is already proved by ellipsometry measurement values.
116 Ink-Jet Printing of TiO2 Nanoparticle Suspensions
5.5 Conclusions
Transparent TiO2 films have been obtained by ink-jet printing ofaqueous TiO2 nanoparticle suspensions prepared by bottom-upsynthesis and low temperature heating. In chapter 4, we devel-oped a microwave assisted hydrothermal route for the prepara-tion of colloidal suspensions containing titania nanoparticles ofappropriate size. The suspensions obtained after synthesis weremainly aqueous, presented long time stability and could be usedwithout further processing for ink-jet printing.
In this chapter, we showed that the combination of ink-jetprinting deposition with fast ink synthesis using microwave as-sistance, allowed functional, high quality TiO2 layers on glasssubstrates. The ink-jet printed layers were heated at low tem-peratures in order to obtain feasible TiO2 thin films. The maxi-mum temperatures involved in the thermal treatment could bereduced to as low as 150◦C, creating the possibility to use thisprotocol also for heat sensitive substrates such as wood or poly-mers. The layers were characterized and compared for surfacemorphology, transparency, and thickness.
This work clearly shows that TiO2 layers prepared by combin-ing nanoparticle bottom-up synthesis with ink-jet printing can bea suitable alternative to current self-cleaning glasses coated byTiO2 using expensive techniques.
The photocatalytic activity and durability of the layers are fur-ther discussed in chapter 6 and 7.
5.5 References 117
References
[1] Chen, X. B., Chinese Journal of Catalysis 2009, 30, 839.
[2] Cozzoli, P. D.; Kornowski, A.; and Weller, H., Journal of theAmerican Chemical Society 2003, 125, 14539.
[3] Oskam, G.; Nellore, A.; Penn, R. L.; and Searson, P. C., Jour-nal of Physical Chemistry B 2003, 107, 1734.
[4] Scolan, E. and Sanchez, C., Chemistry of Materials 1998, 10,3217.
[5] Wang, X.; Zhuang, J.; Peng, Q.; and Li, Y. D., Nature 2005,437, 121.
[6] http://www.microfab.com/equipment/technotes/technote9902.pdf.
[7] Perelaer, J.; Smith, P. J.; Hendriks, C. E.; van den Berg, A.M. J.; and Schubert, U. S., Soft Matter 2008, 4, 1072.
[8] Calvert, P., Chemistry of Materials 2001, 13, 3299.
[9] Tekin, E.; Smith, P. J.; and Schubert, U. S., Soft Matter 2008, 4,703.
[10] Derby, B., Annual Review of Materials Research 2010, vol 40,395.
[11] Dong, H. M.; Carr, W. W.; and Morris, J. F., Physics of Fluids2006, 18, 16.
[12] Wang, X.; Carr, W. W.; Bucknall, D. G.; and Morris, J. F.,International Journal of Multiphase Flow 2012, 38, 17.
[13] Yu, J. C.; Yu, J. G.; and Zhao, J. C., Applied Catalysis B-Environmental 2002, 36, 31.

118 Ink-Jet Printing of TiO2 Nanoparticle Suspensions

6Photocatalytic Activity of TiO2 Layers
In this chapter, we present the results of photocatalytic activitytests applied on different TiO2 films on glass prepared as de-scribed in chapters 3 and 5. The influence of the heat treatmenttemperature, the thickness, roughness, crystallinity of the layerson the photocatalytic behaviour of the samples are compared.
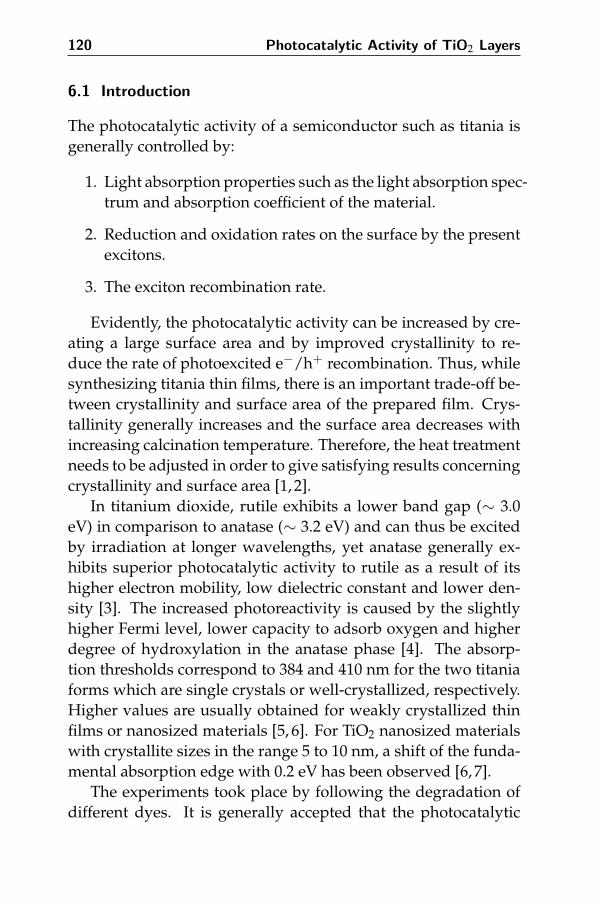
120 Photocatalytic Activity of TiO2 Layers
6.1 Introduction
The photocatalytic activity of a semiconductor such as titania isgenerally controlled by:
1. Light absorption properties such as the light absorption spec-trum and absorption coefficient of the material.
2. Reduction and oxidation rates on the surface by the presentexcitons.
3. The exciton recombination rate.
Evidently, the photocatalytic activity can be increased by cre-ating a large surface area and by improved crystallinity to re-duce the rate of photoexcited e−/h+ recombination. Thus, whilesynthesizing titania thin films, there is an important trade-off be-tween crystallinity and surface area of the prepared film. Crys-tallinity generally increases and the surface area decreases withincreasing calcination temperature. Therefore, the heat treatmentneeds to be adjusted in order to give satisfying results concerningcrystallinity and surface area [1, 2].
In titanium dioxide, rutile exhibits a lower band gap (∼ 3.0eV) in comparison to anatase (∼ 3.2 eV) and can thus be excitedby irradiation at longer wavelengths, yet anatase generally ex-hibits superior photocatalytic activity to rutile as a result of itshigher electron mobility, low dielectric constant and lower den-sity [3]. The increased photoreactivity is caused by the slightlyhigher Fermi level, lower capacity to adsorb oxygen and higherdegree of hydroxylation in the anatase phase [4]. The absorp-tion thresholds correspond to 384 and 410 nm for the two titaniaforms which are single crystals or well-crystallized, respectively.Higher values are usually obtained for weakly crystallized thinfilms or nanosized materials [5, 6]. For TiO2 nanosized materialswith crystallite sizes in the range 5 to 10 nm, a shift of the funda-mental absorption edge with 0.2 eV has been observed [6, 7].
The experiments took place by following the degradation ofdifferent dyes. It is generally accepted that the photocatalytic

6.2 Photocatalytic Activity of TiO2 Layers 121
process follows a pseudo first-order kinetic mechanism, as de-scribed by the following equation: [8, 9]
ln(CC0
) = −kt (6.1)
where C is the concentration ((mg L−1) of the dye after pho-tocatalysis time t (min), C0 is the initial dye concentration, and k(min−1) is the rate constant of the reaction.
6.2 Photocatalytic Activity of TiO2 Layers
6.2.1 TiO2 layers from aqueous precursor solutions
The first tests took place in Nanophos SA, Greece on the samplesprepared from TiO2 aqueous solutions as described in chapter 3.Detailed information about the setup can be found in AppendixB, section B7. The photocatalytic decomposition of methyl or-ange is studied as a function of time by measuring the changein the absorbance of a solution or the dye in contact with TiO2under UV illumination. The selection of methyl orange as spe-cific azo-dye is firstly based on the fact that it is easy to follow itsdegradation through spectrophotometry [10]. Finally, methyl or-ange is preferred over methylene blue because it does not exhibitabsorption bands near the irradiation wavelength of the lamps,which excludes the occurrence of side reactions [11,12] where thedecomposition of the dye is promoted by exciting the moleculesprior to transfer of electrons to the TiO2 layer.
In order to compare photocatalytic behaviour, the general pro-perties of the prepared TiO2 films are given in Table 6.1.
To evaluate the photocatalytic activity of the two TiO2 filmssintered at 500◦C, we compared them with a reference samplefilm of Degussa P25 made by doctor blade coating [13] and a sam-ple of commercially available SGG Bioclean prepared by CVDtechnique [14]. The doctor blade sample typically consists of athick layer (≈1 µm), of a non-transparent slurry, while the SGGsample is formed of a transparent coating of≈50 nm. The graph-ical representation for uncoated microscope glass slide (UNC-G)
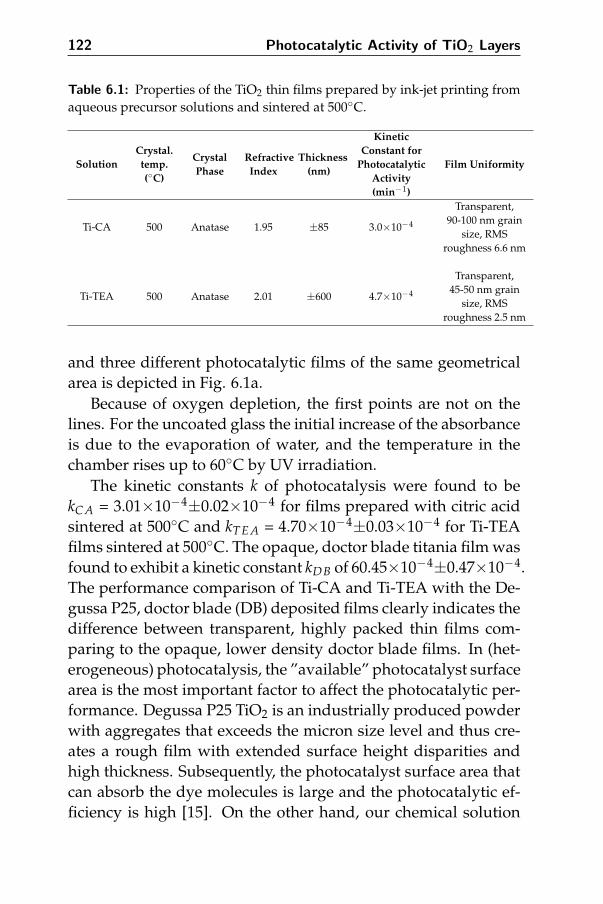
122 Photocatalytic Activity of TiO2 Layers
Table 6.1: Properties of the TiO2 thin films prepared by ink-jet printing fromaqueous precursor solutions and sintered at 500◦C.
SolutionCrystal.temp.(◦C)
CrystalPhase
RefractiveIndex
Thickness(nm)
KineticConstant for
PhotocatalyticActivity(min−1)
Film Uniformity
Ti-CA 500 Anatase 1.95 ±85 3.0×10⁻⁴
Transparent,90-100 nm grain
size, RMSroughness 6.6 nm
Ti-TEA 500 Anatase 2.01 ±600 4.7×10⁻⁴
Transparent,45-50 nm grain
size, RMSroughness 2.5 nm
and three different photocatalytic films of the same geometricalarea is depicted in Fig. 6.1a.
Because of oxygen depletion, the first points are not on thelines. For the uncoated glass the initial increase of the absorbanceis due to the evaporation of water, and the temperature in thechamber rises up to 60◦C by UV irradiation.
The kinetic constants k of photocatalysis were found to bekC A = 3.01×10⁻⁴±0.02×10⁻⁴ for films prepared with citric acidsintered at 500◦C and kTE A = 4.70×10⁻⁴±0.03×10⁻⁴ for Ti-TEAfilms sintered at 500◦C. The opaque, doctor blade titania film wasfound to exhibit a kinetic constant kDB of 60.45×10⁻⁴±0.47×10⁻⁴.The performance comparison of Ti-CA and Ti-TEA with the De-gussa P25, doctor blade (DB) deposited films clearly indicates thedifference between transparent, highly packed thin films com-paring to the opaque, lower density doctor blade films. In (het-erogeneous) photocatalysis, the ”available” photocatalyst surfacearea is the most important factor to affect the photocatalytic per-formance. Degussa P25 TiO2 is an industrially produced powderwith aggregates that exceeds the micron size level and thus cre-ates a rough film with extended surface height disparities andhigh thickness. Subsequently, the photocatalyst surface area thatcan absorb the dye molecules is large and the photocatalytic ef-ficiency is high [15]. On the other hand, our chemical solution
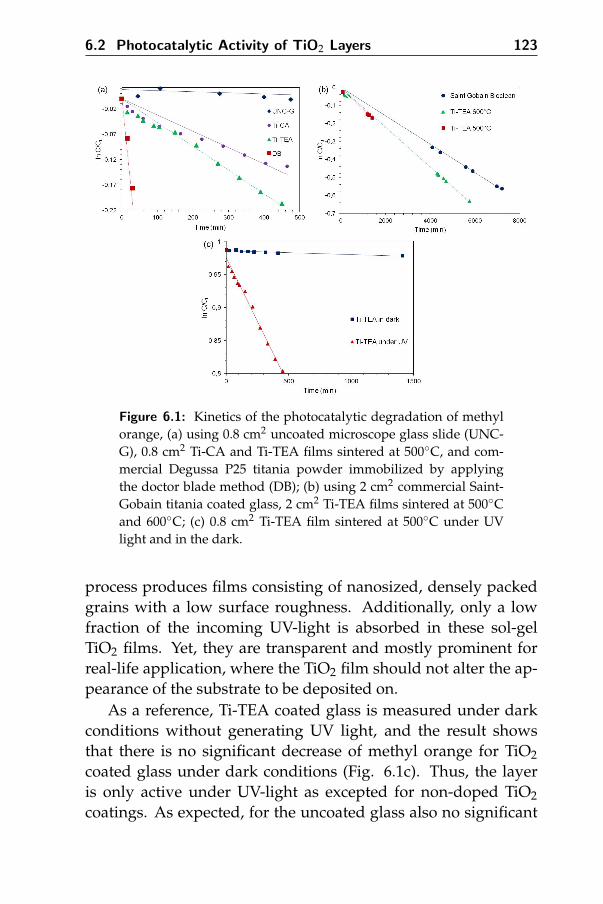
6.2 Photocatalytic Activity of TiO2 Layers 123
Figure 6.1: Kinetics of the photocatalytic degradation of methylorange, (a) using 0.8 cm2 uncoated microscope glass slide (UNC-G), 0.8 cm2 Ti-CA and Ti-TEA films sintered at 500◦C, and com-mercial Degussa P25 titania powder immobilized by applyingthe doctor blade method (DB); (b) using 2 cm2 commercial Saint-Gobain titania coated glass, 2 cm2 Ti-TEA films sintered at 500◦Cand 600◦C; (c) 0.8 cm2 Ti-TEA film sintered at 500◦C under UVlight and in the dark.
process produces films consisting of nanosized, densely packedgrains with a low surface roughness. Additionally, only a lowfraction of the incoming UV-light is absorbed in these sol-gelTiO2 films. Yet, they are transparent and mostly prominent forreal-life application, where the TiO2 film should not alter the ap-pearance of the substrate to be deposited on.
As a reference, Ti-TEA coated glass is measured under darkconditions without generating UV light, and the result showsthat there is no significant decrease of methyl orange for TiO2coated glass under dark conditions (Fig. 6.1c). Thus, the layeris only active under UV-light as excepted for non-doped TiO2coatings. As expected, for the uncoated glass also no significant

124 Photocatalytic Activity of TiO2 Layers
decrease of methyl orange is observed when irradiated with UV-light.
The difference in photocatalytic efficiency for the Ti-CA andTi-TEA films is mainly related to the effect of thickness. Fromthe UV-Vis transmittance spectra (chapter 3), it can be clearlyseen that at 360 nm, the wavelength used for UV illumination,the transmittance of the Ti-TEA layer (41%) is much lower thanfor the Ti-CA layer (77%). From this difference in absorption be-tween the two layers, one expects an increased efficiency for theTi-TEA compared to Ti-CA layer. It is generally accepted that in-creased thickness of titania films supports better photocatalyticefficiency [16–18]. Yet, we also found from SEM and AFM thatthe Ti-TEA film exhibits a lower roughness and smaller grain sizethan the Ti-CA films. Smaller grain size (45-50 nm) and a poroussurface mean higher active surface and thus better photocatalyticactivity. This might suggest that from a morphological point ofview, Ti-CA films could be more active than Ti-TEA.
In Fig. 6.1b, we show a comparison between the prepared Ti-TEA thin film sintered between 500◦C and 600◦C and a commer-cial SGG Bioclean Saint-Gobain glass. Both Ti-TEA films showa higher activity for the decomposition of methyl orange whichmight be related to a large difference in thickness between the ac-tive layers. Ti-TEA layers are ≥500 nm thick while typically, theTiO2 layer obtained by chemical vapour deposition is only 50 nmthick.
6.2.2 TiO2 layers from aqueous nanoparticle containing sols
The second group of samples were tested in our department fol-lowing the degradation of methylene blue under UV illumina-tion according to an international standard, ISO 10678:2010(E).The samples were prepared from TiO2 sols as described in chap-ter 4 and 5. Detailed information about the photoctalytic setupcan be found in Appendix B, section B7.
In order to compare photocatalytic behavours, the general pro-perties of prepared TiO2 films are given in Table 6.2.
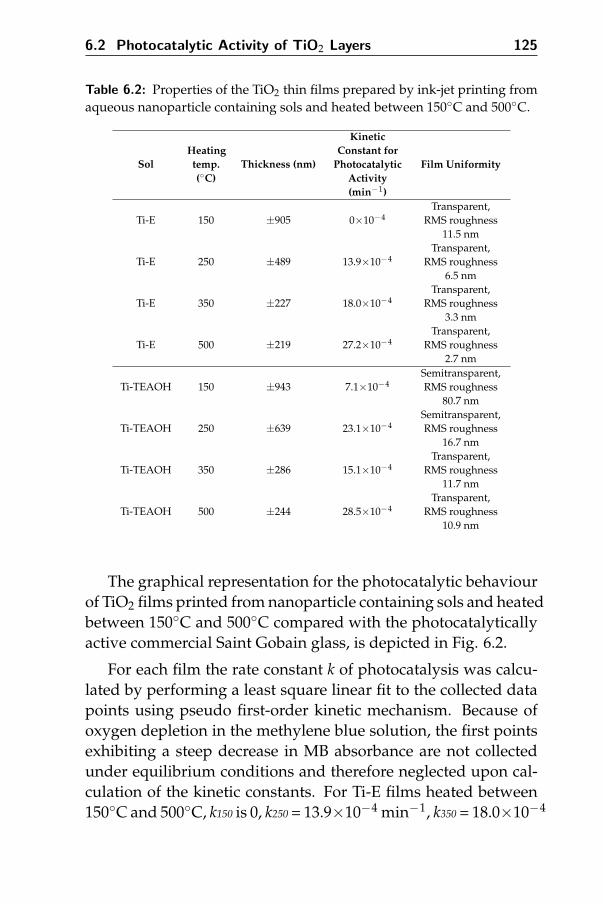
6.2 Photocatalytic Activity of TiO2 Layers 125
Table 6.2: Properties of the TiO2 thin films prepared by ink-jet printing fromaqueous nanoparticle containing sols and heated between 150◦C and 500◦C.
SolHeatingtemp.(◦C)
Thickness (nm)
KineticConstant for
PhotocatalyticActivity(min−1)
Film Uniformity
Ti-E 150 ±905 0×10−4Transparent,
RMS roughness11.5 nm
Ti-E 250 ±489 13.9×10⁻⁴Transparent,
RMS roughness6.5 nm
Ti-E 350 ±227 18.0×10⁻⁴Transparent,
RMS roughness3.3 nm
Ti-E 500 ±219 27.2×10⁻⁴Transparent,
RMS roughness2.7 nm
Ti-TEAOH 150 ±943 7.1×10⁻⁴Semitransparent,RMS roughness
80.7 nm
Ti-TEAOH 250 ±639 23.1×10⁻⁴Semitransparent,RMS roughness
16.7 nm
Ti-TEAOH 350 ±286 15.1×10⁻⁴Transparent,
RMS roughness11.7 nm
Ti-TEAOH 500 ±244 28.5×10⁻⁴Transparent,
RMS roughness10.9 nm
The graphical representation for the photocatalytic behaviourof TiO2 films printed from nanoparticle containing sols and heatedbetween 150◦C and 500◦C compared with the photocatalyticallyactive commercial Saint Gobain glass, is depicted in Fig. 6.2.
For each film the rate constant k of photocatalysis was calcu-lated by performing a least square linear fit to the collected datapoints using pseudo first-order kinetic mechanism. Because ofoxygen depletion in the methylene blue solution, the first pointsexhibiting a steep decrease in MB absorbance are not collectedunder equilibrium conditions and therefore neglected upon cal-culation of the kinetic constants. For Ti-E films heated between150◦C and 500◦C, k150 is 0, k250 = 13.9×10⁻⁴ min−1, k350 = 18.0×10⁻⁴
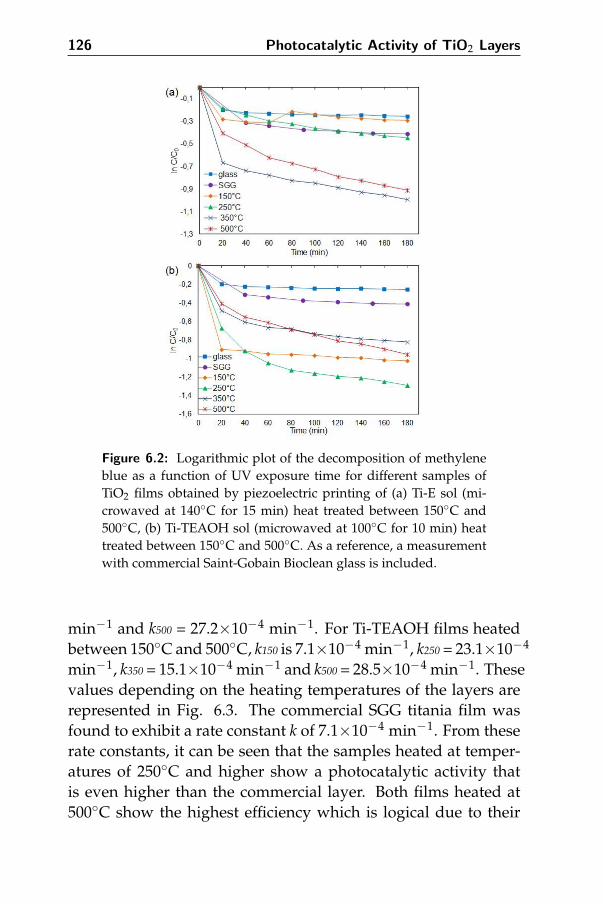
126 Photocatalytic Activity of TiO2 Layers
Figure 6.2: Logarithmic plot of the decomposition of methyleneblue as a function of UV exposure time for different samples ofTiO2 films obtained by piezoelectric printing of (a) Ti-E sol (mi-crowaved at 140◦C for 15 min) heat treated between 150◦C and500◦C, (b) Ti-TEAOH sol (microwaved at 100◦C for 10 min) heattreated between 150◦C and 500◦C. As a reference, a measurementwith commercial Saint-Gobain Bioclean glass is included.
min−1 and k500 = 27.2×10⁻⁴ min−1. For Ti-TEAOH films heatedbetween 150◦C and 500◦C, k150 is 7.1×10⁻⁴ min−1, k250 = 23.1×10⁻⁴
min−1, k350 = 15.1×10⁻⁴ min−1 and k500 = 28.5×10⁻⁴ min−1. Thesevalues depending on the heating temperatures of the layers arerepresented in Fig. 6.3. The commercial SGG titania film wasfound to exhibit a rate constant k of 7.1×10⁻⁴ min−1. From theserate constants, it can be seen that the samples heated at temper-atures of 250◦C and higher show a photocatalytic activity thatis even higher than the commercial layer. Both films heated at500◦C show the highest efficiency which is logical due to their
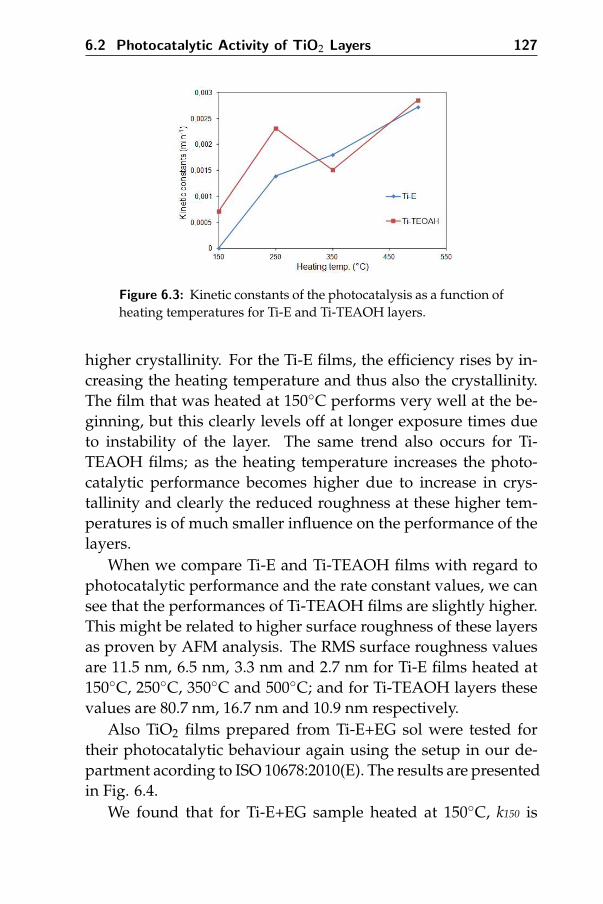
6.2 Photocatalytic Activity of TiO2 Layers 127
Figure 6.3: Kinetic constants of the photocatalysis as a function ofheating temperatures for Ti-E and Ti-TEAOH layers.
higher crystallinity. For the Ti-E films, the efficiency rises by in-creasing the heating temperature and thus also the crystallinity.The film that was heated at 150◦C performs very well at the be-ginning, but this clearly levels off at longer exposure times dueto instability of the layer. The same trend also occurs for Ti-TEAOH films; as the heating temperature increases the photo-catalytic performance becomes higher due to increase in crys-tallinity and clearly the reduced roughness at these higher tem-peratures is of much smaller influence on the performance of thelayers.
When we compare Ti-E and Ti-TEAOH films with regard tophotocatalytic performance and the rate constant values, we cansee that the performances of Ti-TEAOH films are slightly higher.This might be related to higher surface roughness of these layersas proven by AFM analysis. The RMS surface roughness valuesare 11.5 nm, 6.5 nm, 3.3 nm and 2.7 nm for Ti-E films heated at150◦C, 250◦C, 350◦C and 500◦C; and for Ti-TEAOH layers thesevalues are 80.7 nm, 16.7 nm and 10.9 nm respectively.
Also TiO2 films prepared from Ti-E+EG sol were tested fortheir photocatalytic behaviour again using the setup in our de-partment acording to ISO 10678:2010(E). The results are presentedin Fig. 6.4.
We found that for Ti-E+EG sample heated at 150◦C, k150 is
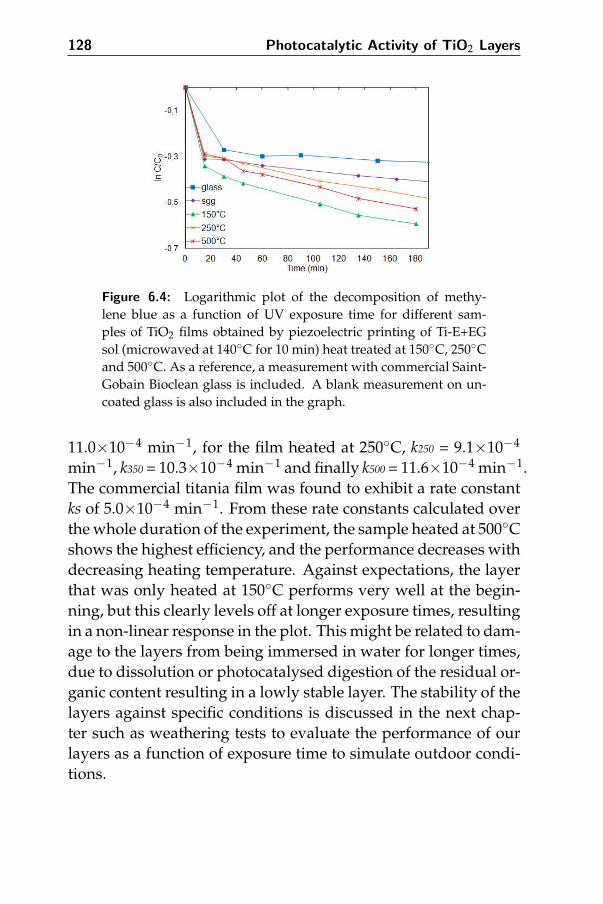
128 Photocatalytic Activity of TiO2 Layers
Figure 6.4: Logarithmic plot of the decomposition of methy-lene blue as a function of UV exposure time for different sam-ples of TiO2 films obtained by piezoelectric printing of Ti-E+EGsol (microwaved at 140◦C for 10 min) heat treated at 150◦C, 250◦Cand 500◦C. As a reference, a measurement with commercial Saint-Gobain Bioclean glass is included. A blank measurement on un-coated glass is also included in the graph.
11.0×10⁻⁴ min−1, for the film heated at 250◦C, k250 = 9.1×10⁻⁴
min−1, k350 = 10.3×10⁻⁴ min−1 and finally k500 = 11.6×10⁻⁴ min−1.The commercial titania film was found to exhibit a rate constantks of 5.0×10⁻⁴ min−1. From these rate constants calculated overthe whole duration of the experiment, the sample heated at 500◦Cshows the highest efficiency, and the performance decreases withdecreasing heating temperature. Against expectations, the layerthat was only heated at 150◦C performs very well at the begin-ning, but this clearly levels off at longer exposure times, resultingin a non-linear response in the plot. This might be related to dam-age to the layers from being immersed in water for longer times,due to dissolution or photocatalysed digestion of the residual or-ganic content resulting in a lowly stable layer. The stability of thelayers against specific conditions is discussed in the next chap-ter such as weathering tests to evaluate the performance of ourlayers as a function of exposure time to simulate outdoor condi-tions.

6.3 Conclusion 129
6.3 Conclusion
This work clearly shows that TiO2 layers prepared by combin-ing aqueous solution chemistry and nanoparticle bottom-up syn-thesis with ink-jet printing can be a suitable alternative to cur-rent photocatalytically active self-cleaning glasses coated by TiO2using expensive techniques. The prepared films are tested un-der UV exposure following the degradation of methyl orangeand methylene blue dyes, and compared to each other for theirphotcatalytic behaviours as well as with the commercial layers.The films prepared from solutions and sintered at 500◦C showhigher photocatalytic activity than commercially avaliable selfcleaning Saint-Gobain glass. The films prepared from nanopar-ticle containing sols and heated at lower temperatures startingfrom 250◦C even behave more active than the commercial layer.Changes in specific surface and thus roughness, density, crys-tallinity differences, organic content and surface morphology ob-viously play important roles in the photocatalytic activity. Thelayer thickness influences the maximum amount of UV-light thatcan be absorbed. From AFM we could clearly detect a signifi-cant decrease of the surface roughness as a function of tempera-ture, based on which we expect a decreased activity for the sam-ples treated at the highest temperatures. Yet, on the other hand,their crystallinity (decreasing amorphous volume fraction) willcertainly be higher, and the organic content is reduced to the min-imum after heating at 500◦C.

130 Photocatalytic Activity of TiO2 Layers
References
[1] Yu, J. G.; Zhao, X. J.; and Zhao, Q. N., Materials Chemistryand Physics 2001, 69, 25.
[2] You, X. F.; Chen, F.; and Zhang, J. L., Journal of Sol-Gel Scienceand Technology 2005, 34, 181.
[3] Carp, O.; Huisman, C. L.; and Reller, A., Progress in SolidState Chemistry 2004, 32, 33.
[4] Tanaka, K.; Capule, M. F. V.; and Hisanaga, T., ChemicalPhysics Letters 1991, 187, 73.
[5] Halley, J. W.; Kozlowski, M.; Michalewicz, M.; Smyrl, W.;and Tit, N., Surface Science 1991, 256, 397.
[6] Reddy, K. M.; Reddy, C. V. G.; and Manorama, S. V., Journalof Solid State Chemistry 2001, 158, 180.
[7] Kumar, P. M.; Badrinarayanan, S.; and Sastry, M., Thin SolidFilms 2000, 358, 122.
[8] Alekabi, H. and Serpone, N., Journal of Physical Chemistry1988, 92, 5726.
[9] Cozzoli, P. D.; Comparelli, R.; Fanizza, E.; Curri, M. L.;Agostiano, A.; and Laub, D., Journal of the American Chem-ical Society 2004, 126, 3868.
[10] Chung, K. T. and Cerniglia, C. E., Mutation Research 1992,277, 201.
[11] Kiriakidou, F.; Kondarides, D. I.; and Verykios, X. E., Cataly-sis Today 1999, 54, 119.
[12] Zhang, F. L.; Zhao, J. C.; Shen, T.; Hidaka, H.; Pelizzetti, E.;and Serpone, N., Applied Catalysis B-Environmental 1998, 15,147.

6.3 References 131
[13] Arabatzis, I. M.; Antonaraki, S.; Stergiopoulos, T.; Hiskia,A.; Papaconstantinou, E.; Bernard, M. C.; and Falaras, P.,Journal of Photochemistry and Photobiology a-Chemistry 2002,149, 237.
[14] Saint gobain glass france (socit anonyme) les miroirs, 18 av-enue d’alsace f-92400 courbevoie, france.
[15] Mills, A.; Lepre, A.; Elliott, N.; Bhopal, S.; Parkin, I. P.; andO’Neill, S. A., Journal of Photochemistry and Photobiology a-Chemistry 2003, 160, 213.
[16] Tada, H. and Tanaka, M., Langmuir 1997, 13, 360.
[17] Yu, J. G.; Zhao, X. J.; and Zhao, Q. N., Journal of MaterialsScience Letters 2000, 19, 1015.
[18] Legrini, O.; Oliveros, E.; and Braun, A. M., Chemical Reviews1993, 93, 671.
[19] Ge, L. and Xu, M. X., Journal of Sol-Gel Science and Technology2007, 43, 1.

132 Photocatalytic Activity of TiO2 Layers

7Durability and Efficiency of Ink-Jet
printed TiO2 Coatings
In this chapter, we focus on the outdoor testing of photocatalytic,transparent TiO2 layers produced by ink-jet printing of aqueousnanoparticle containing sols followed by low temprature heattretments, as explained in the previous chapters. This type of tita-nia layers are being used in outdoor conditions for self-cleaningand antibacterial coatings. This means that they need to exhibitgood durability and long term performance. Yet, reducing thethermal treatment temperatures might have a negative effect onthese parameters. This chapter presents simulated weathering,antibacterial and corrosion tests on the processed films, makingit possible to assess their performance under real life conditions.

134 Durability and Efficiency of Ink-Jet printed TiO2 Coatings
7.1 Introduction
The report of Fujishima and Honda [1] on the possible use of TiO2as a photoelectrode to decompose water to oxygen and hydrogeninduced a tremendous research interest in the material. By now,a large amount of papers and patents discuss the use of titaniafor the decomposition of environmental pollutants in water andair [2–4], photoelectrodes for solar cells, water splitting etc. [5–7].As explained in chapters 1 and 2, irradiation of TiO2 with (solar)UV-light with an energy reaching the band gap of TiO2 (3,2 eV),creates free electron and holes in the material. These can migrateto the surface of the TiO2, where they can interact with adsorbedspecies resulting finally in the photocatalytic decomposition oforganic molecules. A combination of its transparency in the visi-ble light range and this efficient photocatalytic behavior leads tothe development of the commercially most relevant applicationsof TiO2 : self-cleaning, antifogging, superhydrophilic surfaces aswell as antibacterial coatings [8–13].
Over the last years, a lot of research was dedicated to the opti-mization of those TiO2 based self-cleaning films, in terms of pro-cessing/chemistry as well as material development by function-alization, doping etc. [14–16].
In the previous chapters, we have been able to show how theuse of smart chemistry allows functional titanina coatings to bedeposited from environmentally friendly, aqueous precursors atstrongly reduced temperatures. This approach combines the ad-vantage of energy efficient processing with the possibility to de-posit TiO2 coatings on heat sensitive substrates like polymers.Our coatings show similar or improved photocatalytic, structuraland optical properties compared to commercially available filmsand state-of-the-art sol-gel based layers [17]. Given the relativeinfancy of the ink-jet based technology for this type of coatingsand, in addition, the fact that also commercial layers have onlybeen available recently, the durability with respect to outdoorconditions is not yet studied in much detail. Moreover, our pho-tocatalytic films can be produced at strongly low temperatures,
7.1 Introduction 135
which might reduce their durability and resistance to continu-ous rincing with water e.g. Throughout the processing and useof these films with self-cleaning properties, they are typically ex-posed to a number of environmental conditions, including hu-midity, rain water, and acid solutions.
Therefore, in this chapter, we want to test the durability of ourchemical solution deposited films, and study possible changesin photocatalytic performance, transparency, optical effects andstructure, related to their exposure to model weathering condi-tions. Where appropriate, we also want to relate this to the dura-bility of commercial coatings. We start with focusing on the an-tibacterial properties of the layers by following the photokillingactivity of E.coli on TiO2 films as a function of heat treatment.Photocatalytic reactions on the surface of TiO2 should effect theformation of intact E.coli cells and demonstrate a decrease inthe colony formation. In the second part of the tests, in orderto present the decomposition of organic material on the layersby photocatalytic reactions, oil drops were applied on the lay-ers and the decomposition under UV illumination was followeddigitally on daily bases. Finally, accelerated artificial weatheringtests were applied on the layers, thereby simulating real outdoorconditions such as sunlight and rain for long duration. We testedlayers heat treated at temperatures between 150◦C and 500◦C,in order to evaluate down to which temperature functional anddurable coatings can be obtained. The results were evaluatedafter 5 weeks of artificial weathering of the layers, by observa-tions from scanning electron (SEM) and atomic force microscopy(AFM) as well as laboratory environment photocatalytic tests andUV-Vis analysis. As a final test, the chemical resistance of one ofthe layers in a corrosive environment was followed. Batch corro-sion experiments were performed in highly corrosive and acidicsolutions of FeCl3. Similar solutions are used in sewage treat-ment for industrial applications, to remove contaminants fromwastewater. This can open a way towards the application of TiO2in waste water treatment. The results are evaluated by optical ob-servations and weight loss measurements after certain time inter-

136 Durability and Efficiency of Ink-Jet printed TiO2 Coatings
vals of aging with FeCl3.For the experiments, Ti-E layers prepared by ink-jet printing
of nanoparticle containing sols as explained in chapters 4 and5, are chosen since they have high transparency, photocatalyticactivity and can be processed at temperatures between 100◦C and500◦C.
7.2 Anti-Bacterial Test
Photokilling of bacteria on the TiO2 films was evaluated by de-veloping E.coli cells on the layers and counting the colony for-mation after UV illumination for certain periods of time. Theprocedure used was as follows :
7.2.1 Test Setup
The different TiO2 coated glass samples are submersed in biore-actors filled with Ringer’s solution, TiO2 coated side up. Thissolution is prepared by dissolving commercial Ringer’s solutiontablets (Sigma-Aldrich) in deionized water. After inoculation ofthe bioreactors with intact E.coli colonies of different starting con-centrations, the coated sides of the glass substrates are irradiatedunder UV-light (1mW/cm2) for 200 min. The real set-up is dis-played in Figure 7.1. As a reference, an uncoated glass substratewas used. Aliquots of the Ringer’s solution are sampled every50 minutes. Agar is prepared with deonized water at a pH of 6.8with the addition of cefsulodin (Takeda) which is an antibiotic
Figure 7.1: Digital photograph of antibacterial test set-up.

7.2 Anti-Bacterial Test 137
Figure 7.2: Schematic drawing of sampling for antibacterial test.
Figure 7.3: Digital photographs of (a) storing of petri dishes con-taining E.coli sample, (b) growth of E.coli in petri dishes.
that inhibits the growth of common enteric bacteria, and pouredonto petri dishes which are covered carefully to prevent contami-nation. The purpose of the Agar is to provide a solid surface con-taining medium for the growth of bacteria. The sampled aliquotsare further diluted (1:10, 1:100,) with Ringer’s solution and fi-nally applied on the sterile Agar support for incubation. Theprocess is displayed in Figure 7.2. After plating, the petri disheswere stacked and stored in drying furnace at 37◦C (Fig. 7.3a. Thenumber of residual active E.coli was counted after 24h and 48hincubation on agar petri-dishes (Fig. 7.3b).

138 Durability and Efficiency of Ink-Jet printed TiO2 Coatings
7.2.2 Results
We have shown in the previous chapter that the photocatalyticperformance of the TiO2 coatings prepared by our nanoparticleink approach is dependent on the temperature at which theyare thermally treated. Samples heated to temperatures above350◦C exhibit a performance that is comparable to or even bet-ter than that of commercial self-cleaning glass, while at 250◦C wefound more reduced values and at 150◦C, the layer got damagedquickly and no long term testing was possible. Fig. 7.4 showsthe effect of different TiO2 coatings on the colony formation ofintact E.coli cells. As explained in detail in the experimental sec-tion, the TiO2 samples are immersed in bioreactors containingE.coli in Ringer’s solution and illuminated with UV-light to startthe photocatalytic destruction of the bacteria. Each 50 minutes,aliquots from this solution are sampled, diluted and incubatedon Agar plates for 24 or 48 h. Figure 7.4 is a typical graph show-ing the colony forming units of E.coli after incubation as a func-tion of exposure time of the Ringer’s solution to a UV-irradiated
Figure 7.4: Normalized number of colony forming units (CFU)counted after 48 h of incubation on agar petri dishes for testingwith a E.coli colony concentration of +/- 1.3 106 E.coli/ml in biore-actors with TiO2 layers heated at 100◦C and 200◦C; and with alower colony concentration of +/- 1.3 105 E.coli/ml for TiO2 lay-ers heated at 350◦C and 500◦C.
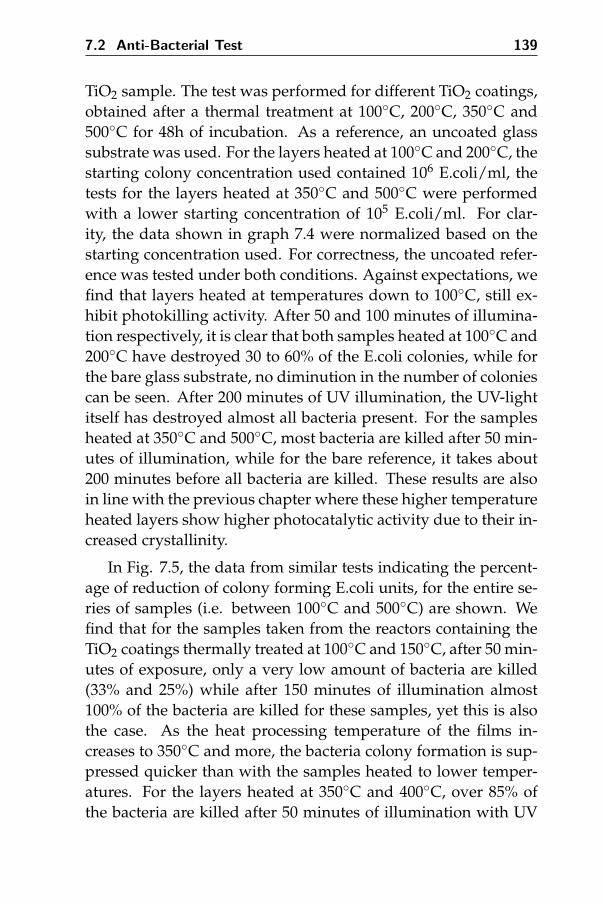
7.2 Anti-Bacterial Test 139
TiO2 sample. The test was performed for different TiO2 coatings,obtained after a thermal treatment at 100◦C, 200◦C, 350◦C and500◦C for 48h of incubation. As a reference, an uncoated glasssubstrate was used. For the layers heated at 100◦C and 200◦C, thestarting colony concentration used contained 106 E.coli/ml, thetests for the layers heated at 350◦C and 500◦C were performedwith a lower starting concentration of 105 E.coli/ml. For clar-ity, the data shown in graph 7.4 were normalized based on thestarting concentration used. For correctness, the uncoated refer-ence was tested under both conditions. Against expectations, wefind that layers heated at temperatures down to 100◦C, still ex-hibit photokilling activity. After 50 and 100 minutes of illumina-tion respectively, it is clear that both samples heated at 100◦C and200◦C have destroyed 30 to 60% of the E.coli colonies, while forthe bare glass substrate, no diminution in the number of coloniescan be seen. After 200 minutes of UV illumination, the UV-lightitself has destroyed almost all bacteria present. For the samplesheated at 350◦C and 500◦C, most bacteria are killed after 50 min-utes of illumination, while for the bare reference, it takes about200 minutes before all bacteria are killed. These results are alsoin line with the previous chapter where these higher temperatureheated layers show higher photocatalytic activity due to their in-creased crystallinity.
In Fig. 7.5, the data from similar tests indicating the percent-age of reduction of colony forming E.coli units, for the entire se-ries of samples (i.e. between 100◦C and 500◦C) are shown. Wefind that for the samples taken from the reactors containing theTiO2 coatings thermally treated at 100◦C and 150◦C, after 50 min-utes of exposure, only a very low amount of bacteria are killed(33% and 25%) while after 150 minutes of illumination almost100% of the bacteria are killed for these samples, yet this is alsothe case. As the heat processing temperature of the films in-creases to 350◦C and more, the bacteria colony formation is sup-pressed quicker than with the samples heated to lower temper-atures. For the layers heated at 350◦C and 400◦C, over 85% ofthe bacteria are killed after 50 minutes of illumination with UV
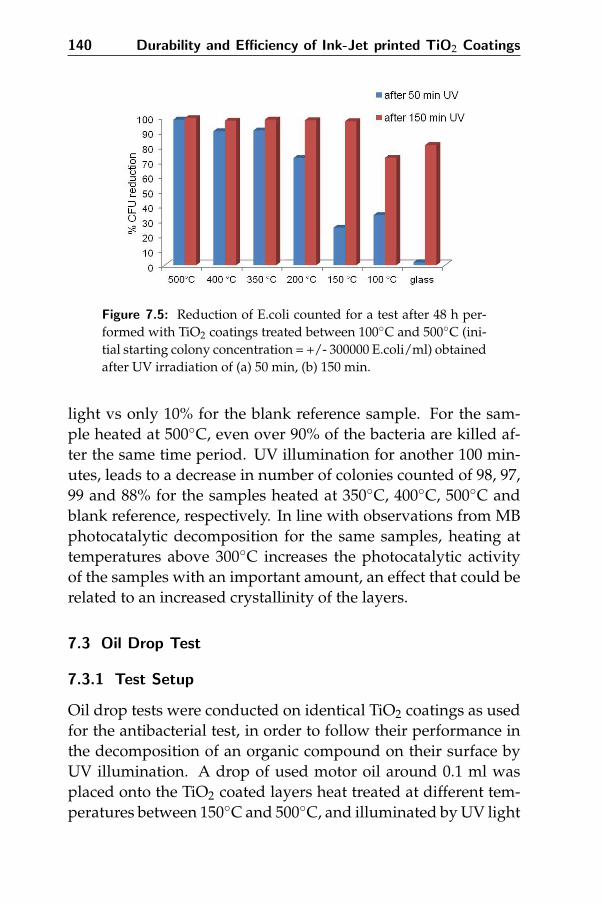
140 Durability and Efficiency of Ink-Jet printed TiO2 Coatings
Figure 7.5: Reduction of E.coli counted for a test after 48 h per-formed with TiO2 coatings treated between 100◦C and 500◦C (ini-tial starting colony concentration = +/- 300000 E.coli/ml) obtainedafter UV irradiation of (a) 50 min, (b) 150 min.
light vs only 10% for the blank reference sample. For the sam-ple heated at 500◦C, even over 90% of the bacteria are killed af-ter the same time period. UV illumination for another 100 min-utes, leads to a decrease in number of colonies counted of 98, 97,99 and 88% for the samples heated at 350◦C, 400◦C, 500◦C andblank reference, respectively. In line with observations from MBphotocatalytic decomposition for the same samples, heating attemperatures above 300◦C increases the photocatalytic activityof the samples with an important amount, an effect that could berelated to an increased crystallinity of the layers.
7.3 Oil Drop Test
7.3.1 Test Setup
Oil drop tests were conducted on identical TiO2 coatings as usedfor the antibacterial test, in order to follow their performance inthe decomposition of an organic compound on their surface byUV illumination. A drop of used motor oil around 0.1 ml wasplaced onto the TiO2 coated layers heat treated at different tem-peratures between 150◦C and 500◦C, and illuminated by UV light

7.3 Oil Drop Test 141
for 3 days. The samples were placed under a Vilber Lourmat VL-315BLB blacklight blue fluorescent light tube with a maximumemission at 365 nm and a power output of 10 W/m2. Every 24h of UV irradiation, digital photographs of the layers were takento investigate the status of the drops on the surface, over a totalperiod of three days. As a reference, commercial Bioclean self-cleaning glass from Saint-Gobain was used.
7.3.2 Results
The behaviors of the oil droplets when placed on the TiO2 lay-ers heat-treated at varying temperatures before (Fig. 7.6) and af-ter (Fig. 7.7) UV illumination are shown. No obvious changein shape, colour etc of the droplet could be observed for the un-coated glass substrate nor for the coated layer heated at 150◦Cwhich probably again can be related to the low crystallinity of theTiO2 obtained at 150◦C. For the commercial Saint Gobain layer,there is a slight decomposition of the oil, resembling the dropbehavior on the prepared TiO2 layer heated at 250◦C, where ob-vious spreading of the droplet can be observed. The oil is de-composed on the layers heated at 350◦C and 500◦C after 3 daysof UV illumination. This high decomposition rate is related tothe higher crystallinity of the layers and illustrates once more the
Figure 7.6: Digital photographs of TiO2 layers with an oil dropbefore UV illumination (a) uncoated glass, (b) commercial SGG;ink-jet printed layers heated at (c) 150◦C, (d) 250◦C, (e) 350◦C, (f)500◦C.

142 Durability and Efficiency of Ink-Jet printed TiO2 Coatings
Figure 7.7: Digital photographs of TiO2 layers with the oil dropafter 3 days of UV illumination (a) uncoated glass, (b) commercialSGG; prepared layers heated at (c) 150◦C, (d) 250◦C, (e) 350◦C, (f)500◦C.
efficient photocatalytic activity of the prepared titania layers, asseen before from the antibacterial tests shown in this chapter andfrom the methylene blue decomposition testing explained in theprevious chapter.
7.4 Artificial Weathering
7.4.1 Test Setup
The samples were cut into test specimens (2×3 cm2) and weath-ered in an Atlas UV2000 device using deionized water spray witha pH of 7 and UV-A light (UV) (Fig. 7.8). The samples were aged
Figure 7.8: Digital photograph of Atlas UV2000 equipment usedfor accelerated weathering test.

7.4 Artificial Weathering 143
for 5 weeks using 24 h cycles. In one cycle, UV-A light with anemission peak at 340 nm was used for 23 h combined with 1 hof darkness. During the same cycle, the spraying followed a sys-tem of 4h spray - 2h dry - 10h spray - 2h dry - 5h spray - 1hdry. One day of artificial weathering in Atlas UV2000 using theweathering cycle above is comparable to ≈10.5 days of outdoorweathering [18].
7.4.2 Results
As discussed in the introduction, the most important applica-tions for transparent, photocatalytic layers are self-cleaning coat-ings for outdoor applications. TiO2 needs to be activated by UV-light, which is abundantly present in the solar light spectrum.Yet, the influence of outdoor weather conditions such as rain,dust, sun, moist etc remains largely a matter of trial-and-error.Especially when using novel synthesis approaches at reducedthermal processing temperatures, one can expect problems re-lated to adherence, durability etc. For the ink-jet printed lay-ers discussed in this work, e.g. triethanolamine is used to sta-bilize the Ti4+ precursor in water. This highly viscous and coor-dinating alcoholamine is only decomposing at elevated temper-atures, starting from 250◦C. This means that in some samples,relative large amounts of organics are still present in the TiO2layers which might have an effect on their long term stability,certainly when immersed in or rinsed by a liquid. We found al-ready from photocatalytic testing that immersion of TiO2 sam-ples that are only processed at 150◦C in a methylene blue solu-tion causes complete dissolution of the functional coating after 3h. Therefore, it is very important to study the stability of the ink-jet printed TiO2 coatings under real life weathering conditions.We applied a method that simulated approximately 1 year of realoutside weathering in one day.
In Fig. 7.9, the surface morphology of the layers, processed attemperatures between 200◦C and 500◦C before and after weath-ering for 5 weeks is shown. From these SEM pictures, some traces
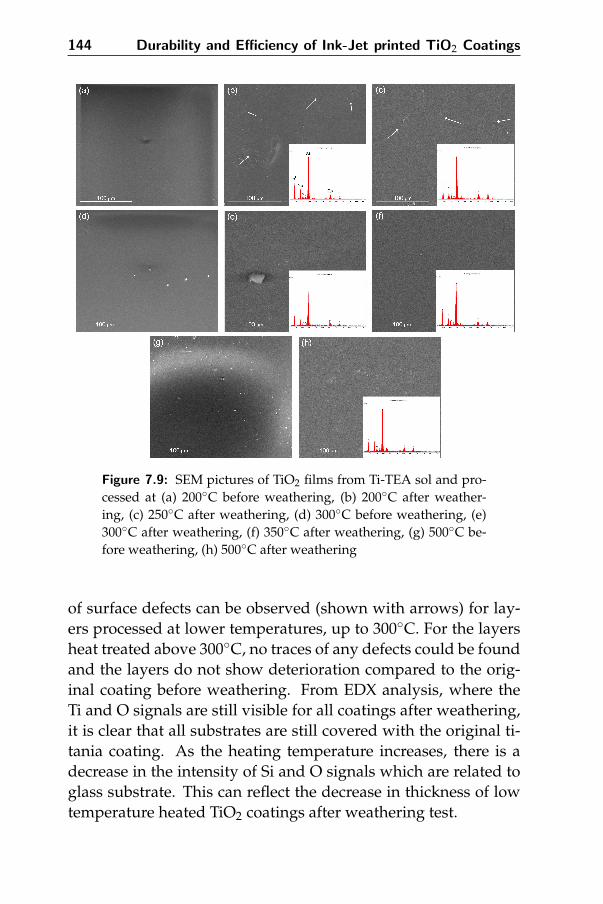
144 Durability and Efficiency of Ink-Jet printed TiO2 Coatings
Figure 7.9: SEM pictures of TiO2 films from Ti-TEA sol and pro-cessed at (a) 200◦C before weathering, (b) 200◦C after weather-ing, (c) 250◦C after weathering, (d) 300◦C before weathering, (e)300◦C after weathering, (f) 350◦C after weathering, (g) 500◦C be-fore weathering, (h) 500◦C after weathering
of surface defects can be observed (shown with arrows) for lay-ers processed at lower temperatures, up to 300◦C. For the layersheat treated above 300◦C, no traces of any defects could be foundand the layers do not show deterioration compared to the orig-inal coating before weathering. From EDX analysis, where theTi and O signals are still visible for all coatings after weathering,it is clear that all substrates are still covered with the original ti-tania coating. As the heating temperature increases, there is adecrease in the intensity of Si and O signals which are related toglass substrate. This can reflect the decrease in thickness of lowtemperature heated TiO2 coatings after weathering test.
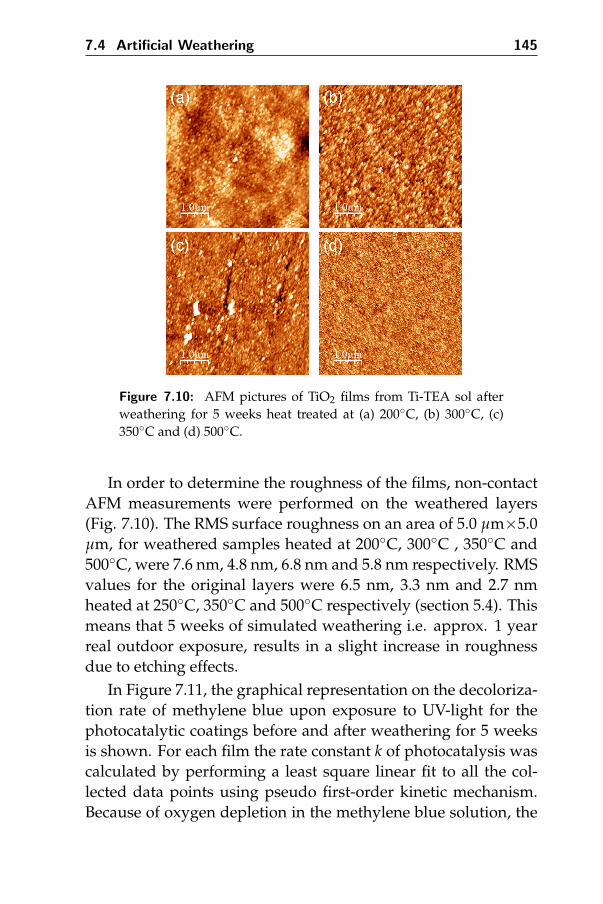
7.4 Artificial Weathering 145
Figure 7.10: AFM pictures of TiO2 films from Ti-TEA sol afterweathering for 5 weeks heat treated at (a) 200◦C, (b) 300◦C, (c)350◦C and (d) 500◦C.
In order to determine the roughness of the films, non-contactAFM measurements were performed on the weathered layers(Fig. 7.10). The RMS surface roughness on an area of 5.0 µm×5.0µm, for weathered samples heated at 200◦C, 300◦C , 350◦C and500◦C, were 7.6 nm, 4.8 nm, 6.8 nm and 5.8 nm respectively. RMSvalues for the original layers were 6.5 nm, 3.3 nm and 2.7 nmheated at 250◦C, 350◦C and 500◦C respectively (section 5.4). Thismeans that 5 weeks of simulated weathering i.e. approx. 1 yearreal outdoor exposure, results in a slight increase in roughnessdue to etching effects.
In Figure 7.11, the graphical representation on the decoloriza-tion rate of methylene blue upon exposure to UV-light for thephotocatalytic coatings before and after weathering for 5 weeksis shown. For each film the rate constant k of photocatalysis wascalculated by performing a least square linear fit to all the col-lected data points using pseudo first-order kinetic mechanism.Because of oxygen depletion in the methylene blue solution, the
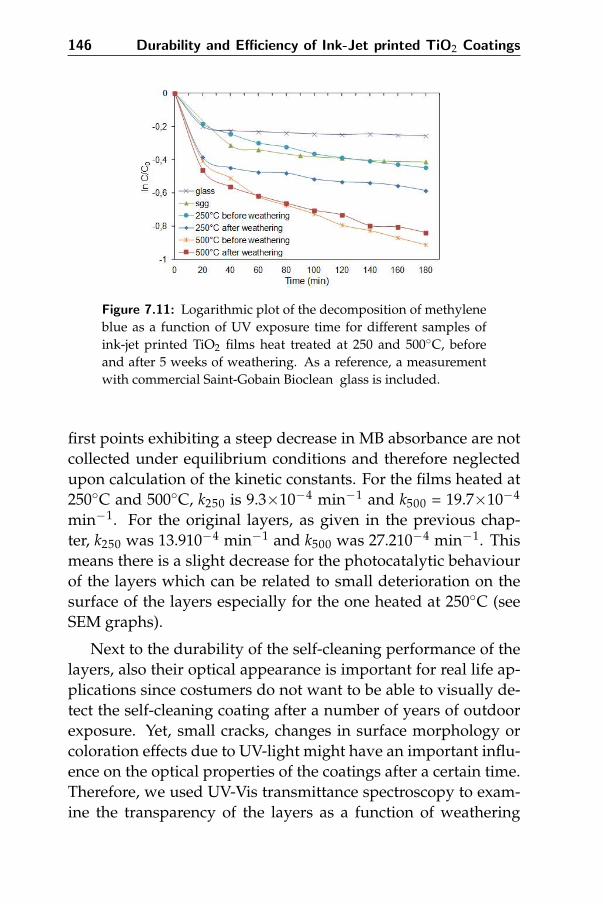
146 Durability and Efficiency of Ink-Jet printed TiO2 Coatings
Figure 7.11: Logarithmic plot of the decomposition of methyleneblue as a function of UV exposure time for different samples ofink-jet printed TiO2 films heat treated at 250 and 500◦C, beforeand after 5 weeks of weathering. As a reference, a measurementwith commercial Saint-Gobain Bioclean glass is included.
first points exhibiting a steep decrease in MB absorbance are notcollected under equilibrium conditions and therefore neglectedupon calculation of the kinetic constants. For the films heated at250◦C and 500◦C, k250 is 9.3×10⁻⁴ min−1 and k500 = 19.7×10⁻⁴
min−1. For the original layers, as given in the previous chap-ter, k250 was 13.910−4 min−1 and k500 was 27.210−4 min−1. Thismeans there is a slight decrease for the photocatalytic behaviourof the layers which can be related to small deterioration on thesurface of the layers especially for the one heated at 250◦C (seeSEM graphs).
Next to the durability of the self-cleaning performance of thelayers, also their optical appearance is important for real life ap-plications since costumers do not want to be able to visually de-tect the self-cleaning coating after a number of years of outdoorexposure. Yet, small cracks, changes in surface morphology orcoloration effects due to UV-light might have an important influ-ence on the optical properties of the coatings after a certain time.Therefore, we used UV-Vis transmittance spectroscopy to exam-ine the transparency of the layers as a function of weathering
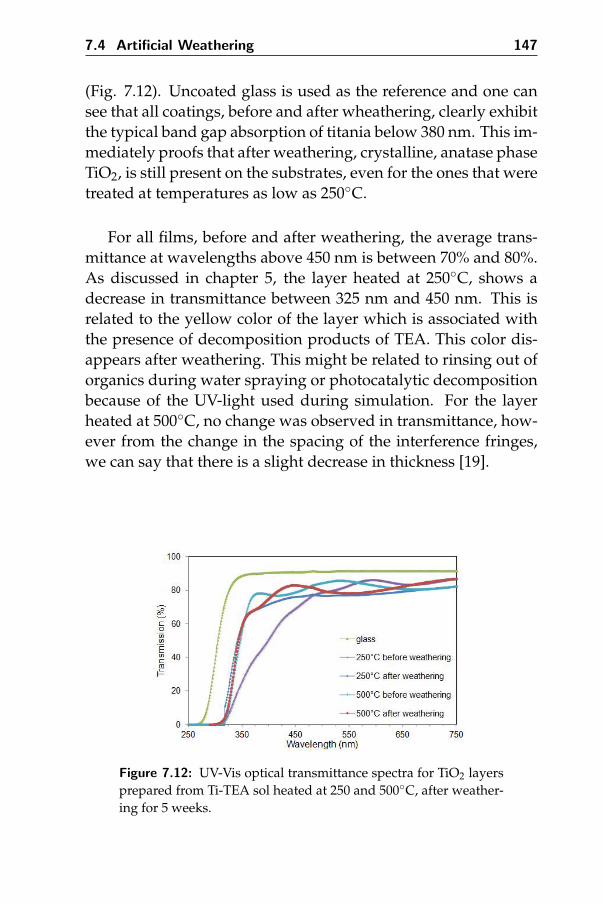
7.4 Artificial Weathering 147
(Fig. 7.12). Uncoated glass is used as the reference and one cansee that all coatings, before and after wheathering, clearly exhibitthe typical band gap absorption of titania below 380 nm. This im-mediately proofs that after weathering, crystalline, anatase phaseTiO2, is still present on the substrates, even for the ones that weretreated at temperatures as low as 250◦C.
For all films, before and after weathering, the average trans-mittance at wavelengths above 450 nm is between 70% and 80%.As discussed in chapter 5, the layer heated at 250◦C, shows adecrease in transmittance between 325 nm and 450 nm. This isrelated to the yellow color of the layer which is associated withthe presence of decomposition products of TEA. This color dis-appears after weathering. This might be related to rinsing out oforganics during water spraying or photocatalytic decompositionbecause of the UV-light used during simulation. For the layerheated at 500◦C, no change was observed in transmittance, how-ever from the change in the spacing of the interference fringes,we can say that there is a slight decrease in thickness [19].
Figure 7.12: UV-Vis optical transmittance spectra for TiO2 layersprepared from Ti-TEA sol heated at 250 and 500◦C, after weather-ing for 5 weeks.

148 Durability and Efficiency of Ink-Jet printed TiO2 Coatings
7.5 Chemical Resistance
7.5.1 Test Setup
In order to study the sensitivity of our titania layers towards cor-rosion, An accelerated corrosion testing was applied on the TiO2layer heated at 300◦C in order to investigate its stability resis-tance in acid environments. The sample was aged for 346 h in 80ml of highly corrosive and acidic FeCl3 with a pH of 3.14 at 20◦C.The weight loss was investigated and microscopic examinationwas done on the samples.
7.5.2 Results
TiO2 layer heated at 300◦C sample was chosen since the layersheated above 200◦C show higher photo efficiency and durabilityas tested so far. After 45h of exposure, the first traces of chemicalattack of the surface can be seen using optical microscopy (Fig.7.13). After 116h, we can clearly observe cracks. The measuredweight loss on the sample showed that after 116 h of testing, therewas only a slight decrease in weight from 878.73 mg to 878.55mg. These observations lead to the conclusion that only minor
Figure 7.13: Digital photographs of TiO2 layer heated at 300◦C,(a) before corrosion test; after corrosion test for (b) 1 h, (c) 45 h, (d)116 h.

7.5 Chemical Resistance 149
deterioration is seen after substantial periods of corrosive attackand a large amount of the TiO2 layer remains intact.
150 Durability and Efficiency of Ink-Jet printed TiO2 Coatings
7.6 Conclusions
In this chapter, we have evaluated the durability of transpar-ent and photocatalytic TiO2 thin films, prepared by the synthesisroute presented in this work. First, the efficiency of these layersin the photocatalytic suppression of bacterial growth was tested.Here, it is clear that the layers heated at more elevated temper-atures and thus exhibiting the highest crystallinity give the bestresults in the prevention of E.Coli colony growth under UV ex-posure. A simple test where used engine oil is dripped on thelayers and the breakdown of this pollution by the TiO2 films ac-tivated by UV-light shows that the performance of our layers,even those produced at reduced temperatures, is better than thatof commercial self-cleaning glass.
Since self-cleaning titania coatings need UV-light activationin order to be functional, they are mainly developed for outdoorapplications including moist, rain, erosion by wind and particles,sun, heat and cold etc. The reduction of the thermal treatmenttemperatures of our deposition approach might create problemsof durability under these conditions. In this chapter we show thatafter applying artificial weathering conditions for 5 weeks, whichis comparable to outdoor exposure of approx. one year, we findthat even the layers heated at temperature of 250◦C is still pho-tocatalytically active, although it is clear that the layers heated athigher temperatures preserve their performance better. We findthat the influence from the weathering simulations on the opticalproperties of the layers and their surface morphology remainslimited. In addition to these durability tests, the chemical resis-tance against corrosive environments was also tested. These testsshow ink-jet printed titania films, processed at moderate temper-atures, are able to compete with the current stat-of-the-art com-mercial films and that the films can resist outdoor conditions, atleast for the tested period of one year and withstand corrosiveattack for several days.
7.6 References 151
References
[1] Fujishima, A. and Honda, K., Nature 1972, 238, 37.
[2] Gelover, S.; Gomez, L. A.; Reyes, K.; and Leal, M. T., WaterResearch 2006, 40, 32743280.
[3] M., H. J.; Duchamp, C.; Karkmaz, M.; Hoai, B. T.; Lachheb,H.; Puzenat, E.; and Guillard, C., Journal of Hazardous Mate-rials 2007, 146, 624629.
[4] Sunada, K.; Watanabe, T.; and Hashimoto, K., Journal of Pho-tochemistry and Photobiology A: Chemistry 2003, 156, 227.
[5] Fujishima, A.; Rao, T.; and Tryk, D., Journal of Photochemistryand Photobiology c-Photochemistry Reviews 2000, 1, 1.
[6] Herrmann, J. M.; Guillard, C.; and Pichat, P., Catalysis Today1993, 17, 7.
[7] Legrini, O.; Oliveros, E.; and Braun, A. M., Chemical Reviews1993, 93, 671.
[8] Kikuchi, Y.; Sunada, K.; Iyoda, T.; Hashimoto, K.; andFujishima, A., Journal of Photochemistry and Photobiology A:Chemistry 1997, 106, 51.
[9] Ramirez, A. M.; Demeestere, K.; De Belie, N.; Mantyla, T.;and Levanen, E., Building and Environment 2010, 45, 832.
[10] Mellott, N. P.; Durucan, C.; Pantano, C. G.; and Guglielmi,M., Thin Solid Films 2006, 502, 112.
[11] Sunada, K.; Kikuchi, Y.; Hashimoto, K.; and Fujishima, A.,Environmental Science Technology 1998, 32, 726.
[12] Wei, C.; Lin, W.-Y.; Zainal, Z.; Williams, N. E.; Zhu, K.;Kruzic, A. P.; Smith, R. L.; and Rajeshwar, K., Environmen-tal Science Technology 1994, 28, 934.

152 Durability and Efficiency of Ink-Jet printed TiO2 Coatings
[13] Huang, Z.; Maness, P.-C.; Blake, D. M.; Wolfrum, E. J.;Smolinski, S. L.; and Jacoby, W. A., Journal of Photochemistryand Photobiology A: Chemistry 2000, 130, 163.
[14] Romeas, V.; Pichat, P.; Guillard, C.; Chopin, T.; and Lehaut,C., Industrial Engineering Chemistry Research 1999, 38, 3878.
[15] Minabe, T.; Tryk, D. A.; Sawunyama, P.; Kikuchi, Y.;Hashimoto, K.; and Fujishima, A., Journal of Photochemistryand Photobiology A: Chemistry 2000, 137, 53.
[16] Medina-Valtierra, J. M.; Reyes, C. F.; Ortiz, J. R.; and Mar-tinez, G. C., Industrial Engineering Chemistry Research 2009,48, 598.
[17] Saint-Gobain Glass UK Ltd, Weeland Road, EggboroughEast Riding of Yorkshire DN14 0FD.
[18] De Windt, I.; Van den Bulcke, J.; and Van Acker, J., Pro-ceedings of the 41th annual meeting of the International ResearchGroup on Wood Protection, Stockholm, Sweden 2010.
[19] Poelman, D. and Smet, P. F., Journal of Physics D: AppliedPhysics 2003, 36, 1850.

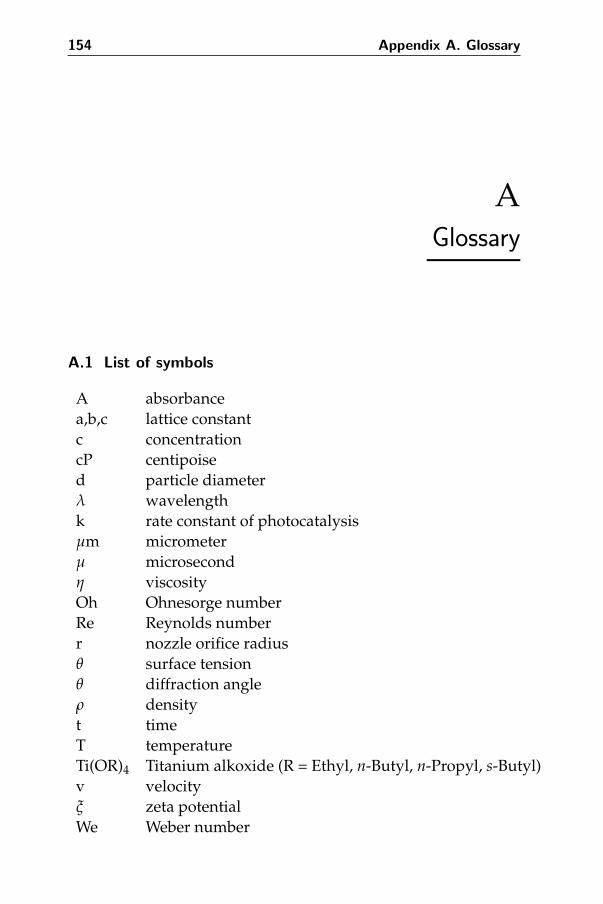
154 Appendix A. Glossary
AGlossary
A.1 List of symbols
A absorbancea,b,c lattice constantc concentrationcP centipoised particle diameterλ wavelengthk rate constant of photocatalysisµm micrometerµ microsecondη viscosityOh Ohnesorge numberRe Reynolds numberr nozzle orifice radiusθ surface tensionθ diffraction angleρ densityt timeT temperatureTi(OR)4 Titanium alkoxide (R = Ethyl, n-Butyl, n-Propyl, s-Butyl)v velocityξ zeta potentialWe Weber number
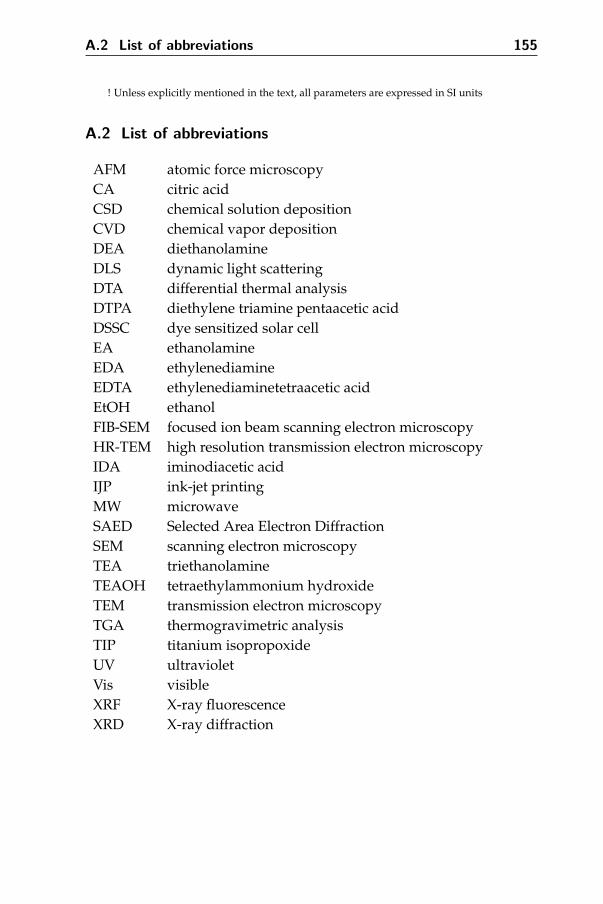
A.2 List of abbreviations 155
! Unless explicitly mentioned in the text, all parameters are expressed in SI units
A.2 List of abbreviations
AFM atomic force microscopyCA citric acidCSD chemical solution depositionCVD chemical vapor depositionDEA diethanolamineDLS dynamic light scatteringDTA differential thermal analysisDTPA diethylene triamine pentaacetic acidDSSC dye sensitized solar cellEA ethanolamineEDA ethylenediamineEDTA ethylenediaminetetraacetic acidEtOH ethanolFIB-SEM focused ion beam scanning electron microscopyHR-TEM high resolution transmission electron microscopyIDA iminodiacetic acidIJP ink-jet printingMW microwaveSAED Selected Area Electron DiffractionSEM scanning electron microscopyTEA triethanolamineTEAOH tetraethylammonium hydroxideTEM transmission electron microscopyTGA thermogravimetric analysisTIP titanium isopropoxideUV ultravioletVis visibleXRF X-ray fluorescenceXRD X-ray diffraction


BInstrumentation
B.1 Rheology
The viscosity of the solutions was determined using a Brookfield DVEviscometer. The wettability was studied by measuring the contact an-gle of a 10 µl droplet of precursor solution on glass substrates, and thesurface tension by the pendant drop method using an optical tensiome-ter (KSV CAM 200).
B.2 Particle sizing
Dynamic light scattering (DLS) technique was applied using using aMalvern Nano series Zetasizer in order to measure particle sizes andsize distributions in the submicron region. The diameter that is mea-sured in Dynamic Light Scattering is called the hydrodynamic diam-eter and refers to how a particle diffuses within a fluid. The hydro-dynamic diameter is the sphere defined by a molecule rotating in alldirections, plus its hydration layer (Fig. B.1a). Thus the diameter ob-tained by this technique is that of a sphere that has the same transla-tional diffusion coefficient as the particle being measured. The trans-lational diffusion coefficient will depend not only on the size of theparticle ’core’, but also on any surface structure, as well as the concen-tration and type of ions in the medium. During the measurement, thethe time-dependent fluctuations in the scattered light are measured bya fast photon counter. The fluctuations are directly related to the rate
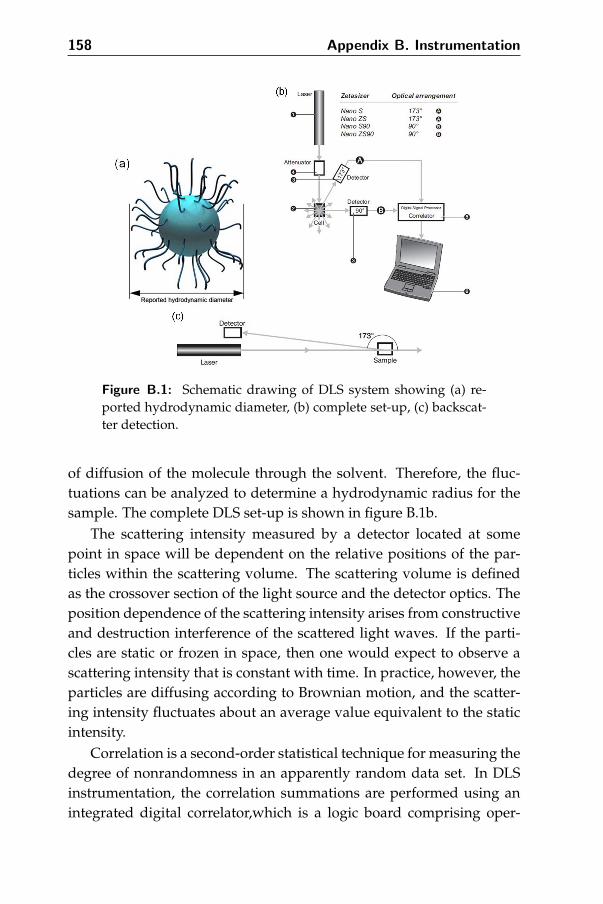
158 Appendix B. Instrumentation
Figure B.1: Schematic drawing of DLS system showing (a) re-ported hydrodynamic diameter, (b) complete set-up, (c) backscat-ter detection.
of diffusion of the molecule through the solvent. Therefore, the fluc-tuations can be analyzed to determine a hydrodynamic radius for thesample. The complete DLS set-up is shown in figure B.1b.
The scattering intensity measured by a detector located at somepoint in space will be dependent on the relative positions of the par-ticles within the scattering volume. The scattering volume is definedas the crossover section of the light source and the detector optics. Theposition dependence of the scattering intensity arises from constructiveand destruction interference of the scattered light waves. If the parti-cles are static or frozen in space, then one would expect to observe ascattering intensity that is constant with time. In practice, however, theparticles are diffusing according to Brownian motion, and the scatter-ing intensity fluctuates about an average value equivalent to the staticintensity.
Correlation is a second-order statistical technique for measuring thedegree of nonrandomness in an apparently random data set. In DLSinstrumentation, the correlation summations are performed using anintegrated digital correlator,which is a logic board comprising oper-

B.2 Particle sizing 159
Figure B.2: Schematic representation of zeta potential.
ational amplifiers that continually add and multiply short time scalefluctuations in the measured scattering intensity to generate the corre-lation curve for the sample.
In this dissertation a Zetasizer Nano ZS detection system is used.The detector is placed at a position of 173◦, this is known as backscat-ter detection and can be seen in figure B.1c. Backscatter detection hasseveral advantages. First of all, because backscatter is being detected,the incident beam doesn’t have to migrate through the entire sample.Therefore multiple scattering, an effect where the scattered light fromone particle is scatterd by other particles in the sample, is avoided.Thus higher concentrations of sample can be measured. An additionaladvantage is that the effect of dust present in the sample is greatly re-duced, because large particles are mainly scattered in the forward di-rection.
In order to assess the charge stability of the disperse systems, zetapotential measurements are used. Zeta potential is measured by apply-ing an electric field across the dispersion. Most particles dispersed inan aqueous system will acquire a surface charge, either by ionization ofsurface groups, or adsorption of charged species, which modify the dis-tribution of the surrounding ions, resulting in a layer around the parti-cle. If the particle moves, this layer moves as part of the particle. Thezeta potential is the potential at the point in this layer where it movespast the bulk solution (slipping plane). The charge at this plane will be

160 Appendix B. Instrumentation
very sensitive to the concentration and type of ions in solution. Parti-cles with a high zeta potential of the same charge sign, either positiveor negative, will repel each other. As this electric potential approacheszero, particles tend to aggregate due to Van der Waals force overcom-ing electrostatic repulsion. For particles that are small enough, and oflow enough density to remain in suspension, a high zeta potential willconfer stability, i.e. the solution or dispersion will resist aggregation. Aschematic representation of a zeta potential measurement is displayedin Figure B.2.
B.3 Elemental analysis
In order to determine the solid content in the sols, elementary analysiswas carried out on an X-ray fluorescence (XRF) spectroscopy (RigakuNeX CG).
B.4 Microwave synthesis
A microwave furnace (CEM Discover) operating at a frequency of 2450MHz was used to perform reactions under air at elevated temperaturesand pressures (Fig. B.3). It was equipped with a single mode cavityin which the pressure can be increased to 20 bar, and with a selectablepower output from 0-300 W. Three ml of the aqueous precursor solu-tion was poured into the 10 ml reaction vessel, which is placed inside
Figure B.3: Digital photograph displaying microwave equip-ment.

B.5 Structural characterization 161
the reactor. The temperature was set between 110◦C and 140◦C and thereactor was exposed for 10 to 15 minutes. As soon as the desired tem-perature and pressure (5-7 bar) were reached, the power output fromthe microwave generator was reduced to 5-10 W to keep the pressureconstant. During the treatment the solution was stirred with a tefloncoated iron oxide bar that reflects the microwave energy. After treat-ment, the system cooled down by directing cooled air onto the vessel.The obtained sols were filtered with a standard 3.1 µm glass microfibresyringe filter.
B.5 Structural characterization
TGA/DTA analysis was performed using TA Instruments SDT with aheating rate of 10◦C/min up to 1100◦C under O2 flow. X-ray diffrac-tion spectra were measured on powders using a Thermo Scientific ArlX’TRA X-ray diffractometer (CuKα = 1.5405 A) with solid state detector,0.02◦ step size, and 1 sec step time. Transmission electron microscopy(TEM) and HR-TEM measurements in this work were performed witha Cs-corrected 2200FS electron microscopy from Jeol. Samples for TEMare prepared by dipping a 300 mesh holey carbon copper grid in a pu-rified (washed and resuspended in water) suspension.
B.6 Thin film analysis
X-ray diffraction analysis on layers was performed on layers using aBruker D8 X-ray diffractometer with Lynxeye line detector, 0.04◦ stepsize, and 2 sec step time, using CuKα radiation. Scanning electron mi-croscopy was performed on the TiO2 thin films to analyze their mor-phology using a SEM (Quanta 200F) from FEI. The film thickness wasmeasured by a spectroscopic ellipsometer (SE, J.A. Woollam Co. Inc.,M-2000FI) where the Cauchy dispersion model was used to fit the op-tical constants. FIB-SEM (FEI Nova 600 Nanolab Dual-Beam FIB) wasused to directly determine the thickness from cross-sectional views andto study the morphology inside the layer. The roughness of the filmswas derived from AFM measurements (Picoplus, Molecular Imaging)where non-contact mode was used. This means the tip of the cantilevervibrates with a very small amplitude at a certain frequency near the
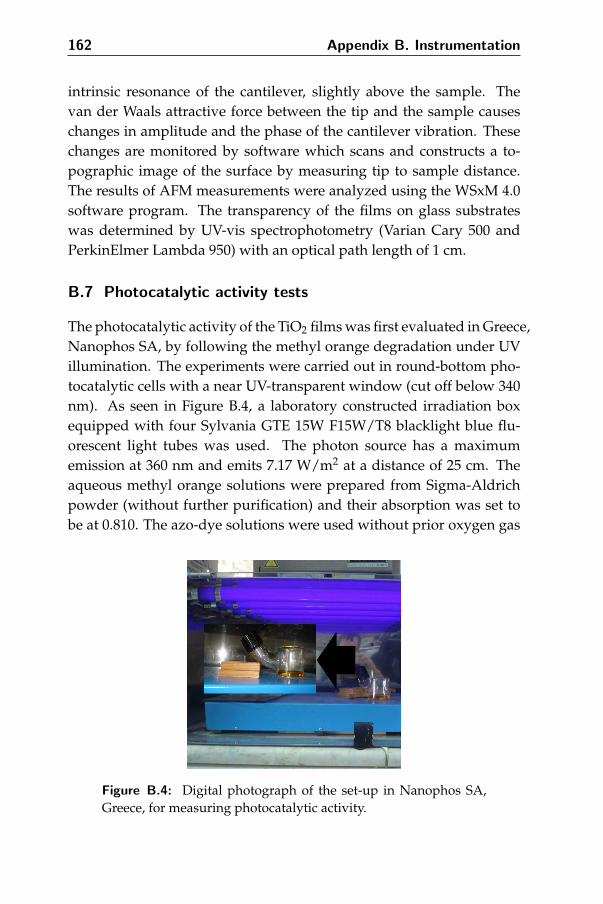
162 Appendix B. Instrumentation
intrinsic resonance of the cantilever, slightly above the sample. Thevan der Waals attractive force between the tip and the sample causeschanges in amplitude and the phase of the cantilever vibration. Thesechanges are monitored by software which scans and constructs a to-pographic image of the surface by measuring tip to sample distance.The results of AFM measurements were analyzed using the WSxM 4.0software program. The transparency of the films on glass substrateswas determined by UV-vis spectrophotometry (Varian Cary 500 andPerkinElmer Lambda 950) with an optical path length of 1 cm.
B.7 Photocatalytic activity tests
The photocatalytic activity of the TiO2 films was first evaluated in Greece,Nanophos SA, by following the methyl orange degradation under UVillumination. The experiments were carried out in round-bottom pho-tocatalytic cells with a near UV-transparent window (cut off below 340nm). As seen in Figure B.4, a laboratory constructed irradiation boxequipped with four Sylvania GTE 15W F15W/T8 blacklight blue flu-orescent light tubes was used. The photon source has a maximumemission at 360 nm and emits 7.17 W/m2 at a distance of 25 cm. Theaqueous methyl orange solutions were prepared from Sigma-Aldrichpowder (without further purification) and their absorption was set tobe at 0.810. The azo-dye solutions were used without prior oxygen gas
Figure B.4: Digital photograph of the set-up in Nanophos SA,Greece, for measuring photocatalytic activity.
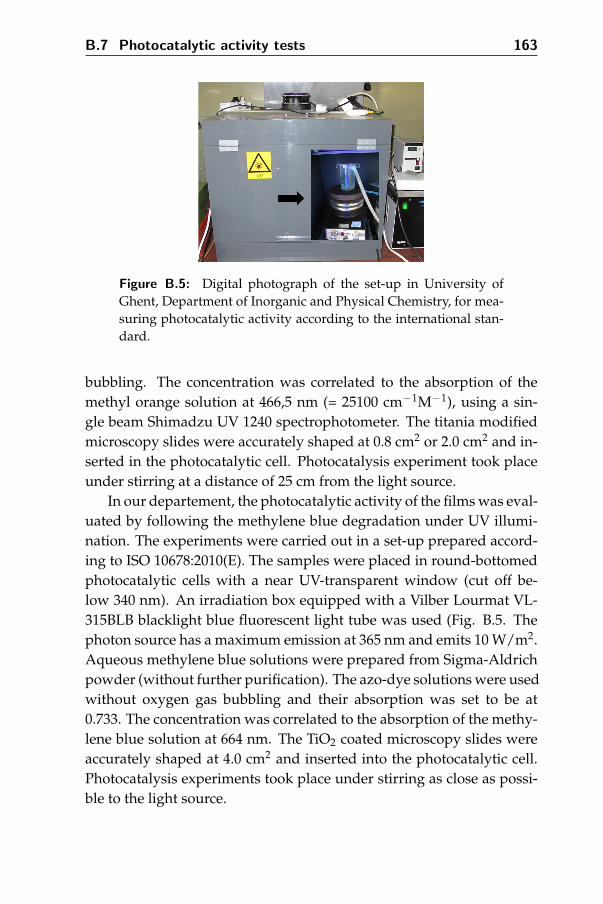
B.7 Photocatalytic activity tests 163
Figure B.5: Digital photograph of the set-up in University ofGhent, Department of Inorganic and Physical Chemistry, for mea-suring photocatalytic activity according to the international stan-dard.
bubbling. The concentration was correlated to the absorption of themethyl orange solution at 466,5 nm (= 25100 cm−1M−1), using a sin-gle beam Shimadzu UV 1240 spectrophotometer. The titania modifiedmicroscopy slides were accurately shaped at 0.8 cm2 or 2.0 cm2 and in-serted in the photocatalytic cell. Photocatalysis experiment took placeunder stirring at a distance of 25 cm from the light source.
In our departement, the photocatalytic activity of the films was eval-uated by following the methylene blue degradation under UV illumi-nation. The experiments were carried out in a set-up prepared accord-ing to ISO 10678:2010(E). The samples were placed in round-bottomedphotocatalytic cells with a near UV-transparent window (cut off be-low 340 nm). An irradiation box equipped with a Vilber Lourmat VL-315BLB blacklight blue fluorescent light tube was used (Fig. B.5. Thephoton source has a maximum emission at 365 nm and emits 10 W/m2.Aqueous methylene blue solutions were prepared from Sigma-Aldrichpowder (without further purification). The azo-dye solutions were usedwithout oxygen gas bubbling and their absorption was set to be at0.733. The concentration was correlated to the absorption of the methy-lene blue solution at 664 nm. The TiO2 coated microscopy slides wereaccurately shaped at 4.0 cm2 and inserted into the photocatalytic cell.Photocatalysis experiments took place under stirring as close as possi-ble to the light source.

Summary
Since its commercial production in the early twentieth century, titaniumdioxide has found a variety of applications in industry and in our dailylife. It has been widely used as a pigment in sunscreens, paints, tooth-paste, etc. After the discovery of its photocatalytic activity, TiO2 hasbecome one of the most promising semiconductors in photocatalyticapplications, given its low cost, chemical stability and non-toxicity. Thephotocatalytic reactivity of TiO2 has brought many promising applica-tions in the areas dealing with energy and environment, ranging fromphotovoltaics and photocatalysis to photo-/electrochromics and sen-sors as well as in the removal of pollutants from water and air. TiO2
has an electronic structure characterized by a wide band gap where noelectrons can reside. For anatase this band gap is 3.2 eV. This meansTiO2 absorbs UV-light and is transparent for visible light. If a photonwith an energy exceeding the band gap interacts with the photocat-alyst, an electron is excited from the valence band to the conductionband leaving a hole behind (i.e. electron vacancy). This photo-excitedelectron-hole pair can diffuse to the surface and takes part in chemi-cal oxidation and reduction reactions with adsorbed water, oxygen andpollutant molecules. Oxidation of water/hydroxide ions by the valenceband hole can produce hydroxyl radicals (•OH), and the conductionband electron can react with molecular oxygen to form the superoxideradical-anion (O2•−). These radicals show strong ability to degrade dif-ferent microorganisms, as well as organic and inorganic pollutants. Asa result, thin TiO2 films can be used to create self-cleaning, antifogging,and superhydrophilic surfaces as well as antibacterial ceramic tiles. Thevisible region transparency is an important factor here since it results

166 Summary
in functional yet ”invisible” coatings.
Many research questions still remain on the deposition of such metaloxide thin films on selected carriers, such as glass and ceramics. Thecurrently used methods, such as chemical vapor deposition (CVD) orsputtering, are relatively expensive due to the high investment costsassociated with the installation of production units that are large areasvacuum conditions cover. More and more the industry gets interestedin TiO2 layers to be deposited from solution-based chemistry (CSD),the so-called ”soft chemistry”. Chemical solution methods are attract-ing much attention, because of the relatively simple production of largearea, high purity films at low cost and high industrial scalibility. In thisrespect, sol-gel technique plays an important role for the stability of theimmobilized TiO2. The general approach to such CSD processes is thefollowing: a precursor (which can be a solution of metal ions, but alsoa suspension containig nanoparticles) is supplied via a deposition tech-nique such as ”spin-coating” or ”dip coating” deposited on a substrate,wherein, after thermal treatment the final functional layer is obtained.In this work, several CSD precursors, suitable for the deposition of ti-tania layers, developed. These were formulated so that they are alsosuitable to be used in ink-jet printers.
One of the recent techniques for CSD is ink-jet printing. This is anon-contact deposition method which can be used to obtain large areacoverage with direct patterning on almost any substrate allowing ver-satile deposition of thin films. Droplets of the precursor solution aregenerated and placed on the substrate according to the selected pattern.In this way, both patterned deposits and completely covered surfacescan be generated with the same equipment and precursors. This resultsin simplicity, low cost, reduced material waste, scalability and conve-nient control of the coating. This ink-jet printing based method is inline to industrial needs for robust, high volume and precise depositionof inks.
The goal of this dissertation consists in producing thin, transpar-ent and photocatalytically active TiO2 films using a new synthesis tech-nique which is based on aqueous precursor solutions or suspensionscombined with ink-jet printing. Industrial demands encourage the de-velopment of water based precursor designs. As the starting precursor,titanium alkoxides are chosen. The difficulty lies in the high reactiv-
167
ity of Ti-alkoxide towards H2O. This hydrolysis and the resultant pre-cipitation can be avoided by blocking the hydrolysis reaction in pureaqueous media, using complexing ligands as stabilizing agents. Thisapproach leads to a first type of precursor: a solution of Ti4+ ions sta-ble in water. In order to decrease the energy input and allow coatingson heat sensitive substrates such as polymers, it is important to re-duce the conversion temperature. In this point of view, nanoparticlecontaining sols have been synthesized using bottom-up, microwave-assisted hydrothermal synthesis. This allows heat treatment tempera-ture to be reduced since the desired crystalline phase is already presentin the precursor (= anatase TiO2 nanoparticles) and only the removalof the solvent and other chemicals is necessary to create the final, crys-talline layer. In all of the precursors, we aim at achieving pH levelsclose to neutral in order to eliminate complication for further industrialhandling, damage on the substrate and printing equipment, etc. Theinnovative part in this work lies in the economical and environmentalsynthesis by (a) using water as primary solvent, (b) eliminating toxicsubstances, (c) applying low temperature heating initiated with the in-troduction of nanoparticles, and (d) ink-jet printing.
The practical part of this work consists of 5 steps. In chapter 3, thefocus is on formulation of water based precursor solutions containingTi4+ without any precipitation and obtaining transparent TiO2 filmson glass substrates by sintering at temperatures up to 650◦C. The so-lutions were prepared using Ti-alkoxide, non-toxic substances such ascitric acid and triethanolamine for stabilizing agents and water as theprimary solvent. These aqueous and environmentally friendly TiO2
solutions were deposited on glass substrates by ink-jet printing. Af-ter sintering the printed layers between 500◦C and 650◦C, transparent,anatase phase TiO2 layers were obtained. We find that the stabilizingagents have an important influence on the morphology of the layers.When tetraethylammonium (TEA) is used, the TiO2 grain size is smallerand the surface roughness is lower than for citric acid (CA) based lay-ers. In the case of Ti-TEA, thicker layers can be produced (500 nm vs100 nm) due to differences in rheology and adaptation of the printingparameters. We were able to prove that homogeneous, transparent,and thin TiO2 layers can be obtained by combining aqueous chemicalsolution deposition route with ink-jet printing, eliminating the use of

168 Summary
expensive techniques.
These first promising results gave the motivation for the develop-ment of a second type titania ink: TiO2 nanoparticle suspensions. Theuse of self-cleaning coatings can be very interesting for materials otherthan ceramics and glass. One could think of polymers suitable forskylights, sunglasses, cell phone screens, billboards, where contami-nation with greasy fingers, organic debris, moss and algae can be aproblem. The solution-based approach described above, however, re-quires a thermal treatment at 500◦C, and thus is not compatible withtemperature-sensitive substrates. If an ink can be made which havealready crystalline anatase titania nanoparticles included, this thermaltreatment temperature can be reduced since the crystalline material isalready present, and only residual solvent, etc., and stabilizers needto be removed. In a typical sol-gel process a colloidal suspension isformed from the hydrolysis and polymerization reactions of the pre-cursors that can be metal salts or metal-organic compounds such asmetal alkoxides. Hydrolysis is often induced by adding small amountsof H2O in alcoholic media. Complete polymerization and loss of sol-vent leads to the transition from the liquid sol into a solid gel state.
In Chapter 4, TiO2 nanoparticle containing aqueous sols, directlysuitable for the ink-jet printing of functional titania coatings, have beenprepared using bottom-up microwave synthesis from aqueous Ti4+ pre-cursor solutions. These solutions were again obtained using water asthe primary solvent and contained non-toxic substances as stabilizingagents which were ethylenediaminetetraacetic acid, tetraethylammo-nium hydroxide and triethanolamine . The influence of different pa-rameters such as complexing agent, pH level, and type of base on thestability of the precursor solutions were studied. Nanoparticle growthin those situations is initiated by microwave assisted hydrothermal syn-thesis. The influence of different microwave temperature and time in-tervals and precursor chemistry such as pH, complexants etc were in-vestigated and discussed in the point of particle size and crystallinity.It is revealed that by choosing the right synthesis parameters, it is pos-sible to prepare sols that contain nanoparticles with a diameter rangingfrom 5 to 42 nm. The most promising nanoparticle containing sols withregard to chemical stability, particle size and crystallinity were selectedand further investigated in terms of rheology and jettability for the de-

169
position using ink-jet printing on glass substrates. The ink-jet printedlayers were heated at temperatures between 150◦C and 500◦C to testthe possibility to reduce the necessary temperature in order to obtainfunctional TiO2 thin films. We find that functional coatings can be ob-tained at temperatures as low as 250◦C.
In chapter 5 we selected the best precursor solution from chapter4, which was prepared using Ti-alkoxide, ethylenediaminetetraaceticacid, triethanolamine and water as the main solvent. We tested it forjettability using different kinds of ink-jet printing systems, electromag-netic or piezoelectric. Low temperature heat treatments are also ap-plied on the layers and they were characterized in order to make com-parison for transparency and stability.
In chapter 6, the photocatalytic activity of the layers was testedand compared with that of commercially available photoactive layers.This study clearly shows that TiO2 layers prepared by combining aque-ous solution and nanoparticle bottom-up synthesis with ink-jet print-ing can be a suitable alternative to current photocatalytically active self-cleaning glasses coated by using expensive techniques such as CVD.The prepared films were tested under UV exposure following the degra-dation of methyl orange and methylene blue dyes. We compared fortheir degradation efficiency with that of commercial layers such as De-gussa P25 coating made by doctor blade and a commercially avail-able Saint-Gobain glass. The films prepared from Ti4+ precursor so-lutions (chapter 3) show higher photocatalytic activity than commer-cially avaliable self cleaning Saint-Gobain glass. The films preparedfrom nanoparticle containing sols and heated at lower temperaturesstarting from 150◦C, are even more active than the commercial layer.Changes in specific surface and thus roughness, density, differences incrystallinity, organic content and surface morphology obviously playimportant roles in photocatalytic activity. The introduction of nanopar-ticles has an important effect in improving the photocatalytic activityof the prepared layers. The use of nanoparticle containing sols allowsthe production of transparent, photocatalytically active TiO2 layers attemperatures as low as 250◦C.
In Chapter 7, the last chapter of this thesis, the obtained layers wereanalyzed in terms of functionality and durability under realistic condi-tions. To this end, a series of four tests were performed. Firstly, the effi-

170 Summary
ciency of the layers for the photocatalytic suppressing bacterial growthwas tested. Here, too, it is clear that the layers with the highest crys-tallinity give the best results in the growth of colonies of E. Coli underUV exposure. A simple test where used engine oil is dripped on thelayers and the breakdown of this pollution is followed under UV light,clearly show that the performance of our layers, even those producedat reduced temperatures, is better than that of commercial self-cleaningglass. The self-cleaning layers produced during this thesis are onlyactivated by UV light and are therefore we focused on outdoor applica-tions where sunlight is present. This also means that these layers at theappropriate weather conditions must not be washed away by the rainor eroded by exposure to wind, dust, sand etc. A risk appears to be lowfor ceramic metal oxide layers, but still is important in the view of thevery thin layer thicknesses which are used herein and particularly withregard to the thermal treatment at reduced temperatures, is a reductionin adhesion between the substrate and layer. Therefore, accelerated ag-ing tests carried out under realistic conditions by cycles of UV light,moisture and temperature can provide a picture of the life of the tita-nia layers outside. We find that even the layers heated at temperaturesof 250◦C are still photocatalytically active after exposure to simulatedoutdoor conditions (1 year), although it is clear that the layers heated athigher temperatures preserve their performance better. In addition tothese durability tests, a series of corrosion tests were also carried out.
The results generated during this thesis forms the basis for an in-novative synthesis strategy for the deposition of photocatalytically ac-tive titania layers. This method is efficient, scalable, energy efficientand environmentally friendly. Combination of microwave synthesis,ink-jet printing and reduced production temperatures, makes this ap-proach economically relevant and a good alternative to the currentlyused physical deposition techniques. Further optimization of the per-formance of these layers may in the future be realized through the de-velopment of a microwave synthesis with higher yields. It is also im-portant to start testing the different precursors developed in this thesis,on other substrates such as polymers, ceramics and metals.
Samenvatting
Titaniumdioxide kent heel wat toepassingen in het alledaagse leven, zowordt het sinds het begin van de vorige eeuw in grote hoeveelhedengebruikt als wit pigment in onder meer verf, papier, tandpasta, cos-metica, voeding etc. Na de ontdekking van het fotokatalytisch gedragvan het materiaal, werd het een van de industrieel meest veelbelovendehalfgeleiders, mede dankzij zijn lage kostprijs, chemische stabiliteit ennon-toxiciteit. Het fotokatalytisch karakter van het materiaal maakt hetgeschikt voor gebruik in de energie- en milieusector. Denk bijvoor-beeld aan zonnecellen, gassensoren, elektrochroom glas en heterogenekatalyse voor de degradatie van lucht- en waterverontreiniging. Tita-nia heeft de typische elektronische structuur van een halfgeleider meteen valentieband, conductieband en een verboden zone waar zich geenelektronen kunnen bevinden. Voor de anatase polymorf van TiO2 is die3.2 eV, wat betekent dat TiO2 UV-licht absorbeert en transparant is voorzichtbaar licht. Wanneer een foton met een energie groter dan die vande verboden zone met het titania in contact komt, dan kan een elek-tron vanuit de valentieband naar de conductieband geexciteerd wor-den en ontstaat een positief elektrongat in de valentieband. Dit foto-geexciteerde elektron-gat paar kan naar het oppervlak van het materi-aal migreren en zo redoxreacties katalyseren. Oxidatie van geadsor-beerde watermolecules of hydroxide ionen door de positieve gaten,in combinatie met de reductie van zuurstof door de elektronen in deconductieband leiden respectievelijk tot de vorming van reactieve hy-droxide radicalen en superoxide anion radicalen. Deze radicalen kun-nen dan zeer gemakkelijk verder reageren met de afbraak van micro-organismen, organische en anorganische vervuiling tot gevolg. Dit

172 Samenvatting
gedrag heeft geleid tot het gebruik van TiO2 in zelfreinigend glas, anti-damp lagen, antibacteriele wandtegels etc. Het feit dat het materiaalenkel geactiveerd wordt door UV-licht en transparant is voor zichtbaarlicht is hier belangrijk, omdat op die manier functionele, maar niet-waarneembare dunne lagen kunnen verkregen worden.
De depositie van dergelijke metaaloxide dunne lagen op geselecteer-de dragers, zoals glas en keramiek, blijft heel wat onderzoek vragen.De huidig toegepaste methodes, zoals CVD of sputteren, blijven vrijduur door de hoge investeringskost die gepaard gaat met de instal-latie van productie-eenheden die grote oppervlaktes bij vacuum om-standigheden kunnen bedekken. Meer en meer bestaat er vanuit de in-dustrie interesse om TiO2 lagen af te zetten vanuit oplossingsgebaseerdechemie (CSD), de zogenaamde ”chimie douce” of ”soft chemistry”. Dezeaanpak maakt flexibele processen onder atmosferische omstandighe-den mogelijk en eventueel zelfs het gebruik van milieuvriendelijke che-micalien en een zo veel mogelijk gereduceerde energievraag. Hierbij issol-gel chemie een belangrijke speler voor een brede range aan metaal-oxide lagen, maar zeker voor functionele titania coatings. De algemeneaanpak bij dergelijke CSD processen is de volgende: een precursor (ditkan een oplossingen van metaalionen zijn, maar ook een suspensie vannanopartikels) wordt via een depositietechniek zoals ”spincoaten” of”dipcoaten” aangebracht op een substraat, waarbij na thermische be-handeling de uiteindelijke functionele laag wordt bekomen. In dit werkwerden verschillende CSD precursoren, geschikt voor de depositie vantitania lagen, ontwikkeld. Deze werden zo geformuleerd dat ze even-eens geschikt zijn om te gebruiken als inkt in ink-jet printers.
Meer en meer wordt ink-jet printen in de industrie niet enkel ge-bruikt voor het bedrukken van materialen met pigmenten, maar ookom materialen zoals polymeren, metalen geleiders en anorganische func-tionele lagen te produceren. Het voordeel van de techniek is de enormeflexibiliteit en schaalbaarheid, die het aanbrengen van coatings op eenbrede varieteit aan substraten toelaat, gecombineerd met een relatieflage investeringskost. Zo kan men bijvoorbeeld met een printer eneen inkt zowel grote oppervlakken bedekken als patronen aanbren-gen. De gebruikte inkten/precursoren zitten in gesloten containers enkomen enkel uit de printer op vraag (DOD of drop-on-demand) wateen enorme reductie in chemisch afval betekent. Ink-jet technologie
173
wordt steeds beter en printkoppen, afgestemd op de specifieke vraagvan de industrie, worden meer en meer ontwikkeld. Binnen deze in-novatieve industrie groeit dus ook steeds meer de nood aan chemischekennis rond inktontwikkeling en testen.
In deze thesis is het de bedoeling om CSD en ink-jet technologiete combineren om dunne, transparante en fotokatalytisch actieve tita-nia lagen te produceren. Dit vraagt de ontwikkeling van nieuwe ink-ten, die bij voorkeur watergebaseerd en zoveel mogelijk milieuvrien-delijk zijn. Dit brengt een aantal problemen met zich mee omdat deTi-precursoren die voorhanden zijn allen zeer hydrolyse gevoelig zijnen dus niet compatibel met een waterig milieu. Zodra watermoleculenin contact komen met de titania precursor gaat hydrolyse optreden endus ongecontroleerde neerslagvorming wat natuurlijk niet wenselijk isvoor een inkt die klontervrij en uiterst stabiel moet zijn om blokkagevan de printkoppen te vermijden. In hoofdstuk 3 wordt beschreven hoeTi-alkoxides kunnen gestabiliseerd worden in water door het aanwen-den van chelaterende reagentia zoals citroenzuur en alcoholamines.Deze laten toe om waterige Ti4+-oplossingen te bereiden met een neu-trale pH. Dit laatste is belangrijk om de industriele handelbaarheid vande inkten te verzekeren en corrosie van de printopstelling te vermij-den. De reologie van de oplossingen werd geoptimaliseerd voor ink-jetprinten en deposities werden uitgevoerd op glas. Thermische behan-deling bij temperaturen van 500 tot 650◦C levert transparante, kristal-lijne, anataas TiO2 coatings op glas met een dikte varierend van 100 tot500 nm. Deze lagen blijken (hoofdstuk 6) een fotokatalytische activiteitte vertonen die minstens even hoog is als die verkregen voor commer-cieel verkrijgbaar zelfreinigend glas (Saint-Gobain Bioclean ).
Deze eerste veelbelovende resultaten gaven de aanzet voor de ont-wikkeling van een tweede type titania inkt: TiO2 nanopartikel sus-pensies. Het gebruik van zelfreinigende coatings kan zeer interessantzijn voor andere materialen dan keramieken en glas. Hierbij kan mendenken aan polymeren geschikt voor lichtkoepels, zonnebrillen, gsmschermen, reclameborden, waar contaminatie met vette vingers, or-ganisch vuil, mossen en algen een probleem kan zijn. De oplossings-gebaseerde aanpak die hierboven beschreven werd, vraagt echter eenthermische nabehandeling bij 500◦C en is dus niet compatibel met tem-peratuurgevoelige substraten. Indien een inkt kan gemaakt worden
174 Samenvatting
die reeds kristallijn anatase titania nanopartikels bevat, dan zou dezethermische nabehandeling sterk in temperatuur kunnen gereduceerdworden, omdat het kristallijne materiaal reeds aanwezig is en enkelnog resten solvent en stabilisatoren e.d. verwijderd moeten worden.In hoofdstuk 4 bespreken we de microgolfgeassisteerde hydrothermalesynthese van TiO2 nanokristal suspensies. Deze syntheses zijn gebaseerdop de principes van sol-gel chemie waarin gecontroleerde hydrolyse encondensatie van Ti-precursoren uiteindelijk leiden tot kristallijne par-tikels na thermische behandeling bij hogere temperaturen. Ook hierwordt gebruik gemaakt van Ti-precursoren, gestabiliseerd in water viaverschillende chelaterende liganden. Om thermische behandeling bijtemperaturen hoger dan het solvent te kunnen toepassen, wordt ge-bruik gemaakt van hydrothermale synthese onder druk. Opwarmenvan het reactiemengsel via de directe koppeling van microgolven isveel efficienter dan werken met conventionele thermische opwarmingen laat toe om binnen enkele minuten bruikbare nanokristallijne sus-pensies te synthetiseren. In dit werk hebben we de invloed van ver-schillende liganden (EDTA, iminodiazijnzuur e.a.), basen (triethanol-amine, diethanolamine, tetramethylammoniumhydroxide e.a.) en an-dere reactieparameters zoals pH, tijd en temperatuur op de deeltjes-grootte en kristalliniteit bestudeerd. Uiteindelijk leidde deze aanpaktot de synthese van een aantal anatase TiO2 suspensies met deeltjes-groottes tussen 5 en 50 nm bij temperaturen van maximaal 140◦C enreactietijden beneden 30 minuten.
In hoofdstuk 5 wordt een selectie van dergelijke suspensies verdergebruikt voor het ink-jet printen van titania dunne lagen. Een uitge-breide analyse van de reologie van de suspensies toont aan dat dezeonmiddellijk na microgolfsynthese bruikbaar zijn voor printtesten metverschillende types printkoppen (elektromagnetische en piezo-elektrische).Geprinte lagen op glas werden aan een thermische behandeling bij steedslagere temperatuur onderworpen : 500, 350, 250, 150◦C. Op deze manierkan vastgesteld worden wat de laagst mogelijke verwerkingstemper-atuur voor iedere suspensie is. Fotokatalytische metingen op deze la-gen (hoofdstuk 6) waarin hun efficientie in het afbreken van een or-ganische kleurstof zoals methyleenblauw wordt geevalueerd, toont aandat lagen behandeld op temperaturen tot 250◦C nog steeds fotokatalysevertonen. Zoals verwacht neemt de efficientie van de lagen wel af met
175
dalende temperatuur wat waarschijnlijk vooral te maken heeft met deafname van de kristallijne fractie in deze lagen. We zien ook dat andereparameters zoals ruwheid, organische restfractie en morfologie een be-langrijke invloed hebben op de finale performantie van de lagen. Dittoont duidelijk aan dat de originele onderzoeksvraag tot een bruikbareverwerkingsstrategie heeft geleid, die in de toekomst verder kan uit-gewerkt worden voor de productie van lagen op polymeren.
In hoofdstuk 7, het laatste hoofdstuk van deze thesis, worden deverkregen lagen geanalyseerd in termen van functionaliteit en duur-zaamheid onder realistische omstandigheden. Daartoe werd een reeksvan vier testen uitgevoerd. Ten eerste werd de efficientie van de lagenvoor het fotokatalytisch onderdrukken van bacteriele groei getest. Ookhier wordt duidelijk dat de lagen met de hoogste kristalliniteit het bestin staat zijn om de groei van kolonies van E. Coli te onderdrukken bijUV-belichting. Eenvoudige tests waarbij motorolie gedruppeld wordtop de lagen en de afbraak van deze vervuiling onder UV-belichtingwordt gevolgd, tonen duidelijk aan dat de performantie van onze la-gen, zelfs deze geproduceerd bij verlaagde temperaturen, beter is dandie van commercieel zelfreinigend glas.
De zelfreinigende lagen geproduceerd tijdens deze thesis wordenenkel geactiveerd door UV-licht en zijn dus vooral gericht op buiten-toepassingen waar zonlicht aanwezig is. Dit betekent ook dat deze la-gen tegen de nodige weersomstandigheden bestand moeten zijn: delagen mogen niet weggespoeld worden door de regen of geerodeerddoor blootstelling aan wind, stof, zand etc. Een risico dat laag lijkt tezijn bij keramische metaaloxide lagen, maar toch belangrijk is geziende zeer dunne laagdiktes die hier gebruikt worden en zeker rekeninghoudend met de thermische behandeling bij sterk verlaagde tempera-turen, is een verminderde hechting tussen substraat en laag. Daaromwerden versnelde verouderingstests uitgevoerd die door cycli van UV-licht, bevochtiging en temperatuur een beeld kunnen geven van de le-vensduur van de titania lagen onder realistische buitenomstandighe-den. We vinden dat zelfs de lagen behandeld bij temperaturen van250◦C nog steeds fotokatalytische activiteit vertonen na blootstellingaan deze gesimuleerde buitenomstandigheden (1 jaar), hoewel duidelijkwordt dat de lagen die bij hogere temperaturen behandeld werden hunperformantie beter behouden. Naast deze duurzaamheidstesten wer-

176 Samenvatting
den ook nog een reeks corrosietesten uitgevoerd.De resultaten gegenereerd tijdens deze thesis vormen de basis voor
een innovatieve synthesestrategie voor de depositie van fotokatalytischactieve titania lagen. Deze methode is efficient, schaalbaar, energiezuinigen milieuvriendelijk. Combinatie van microgolfsynthese, ink-jet printenen verlaagde productietemperaturen maken deze aanpak economischrelevant en een volwaardig alternatief voor de huidige gebruikte fy-sische depositietechnieken. Verdere optimalisatie van de performantievan deze lagen kan in de toekomst gerealiseerd worden door het ont-wikkelen van een microgolfsynthese met hogere rendementen. Verderis het belangrijk om de verschillende precursoren, ontwikkeld in dezethesis, ook te gaan testen op andere substraten zoals polymeren, keramie-ken en metalen.

Publications and presentations
Publications related to this thesis
• Arin M., Lommens P., Avci N., Hopkins S.C., De Buysser K., Ara-batzis I.M., Fasaki I., Poelman D. and Van Driessche, I.Inkjet printing of photocatalytically active TiO2 thin films fromwater based precursor solutions.Journal of the European Ceramic Society, 2011, 31(6), 1067-1074.
• Arin M., Lommens P., Hopkins S.C., Pollefeyt G., Van der EyckenJ., Ricart S., Granados X., Glowacki B.A. and Van Driessche I.Deposition of photocatalytically active TiO2 films by inkjet print-ing of TiO2 nanoparticle suspensions obtained from microwave-assisted hydrothermal synthesis.Nanotechnology, 2012, 23(16).
• Arin M., Pollefeyt G., De Buysser K., Van Driessche, I. and Lom-mens P.Low Temperature Deposition of TiO2 Layers from NanoparticleContaining Suspensions Synthesized by Microwave Hydrother-mal Treatment.in press, Journal of Sol-Gel Science and Technology, 2013.
• Arin M., Lommens P., Van Acker J. and Van Driessche, I.Durability and efficiency of ink-jet printed TiO2 coatings.in preparation.

178 Publications and presentations
Other publications
• Van de Velde N., Arin M., Lommens P., Poelman D. and VanDriessche I.Characterization of the aqueous peroxomethod for the synthesisof transparent TiO2 thin films.Thin Solid Films, 2011, 519(11), 3475-3479.
• Fasaki I., Siamos K., Arin M., Lommens P., Van Driessche I., Hop-kins S.C., Glowacki B.A. and Arabatzis I.Ultrasound assisted preparation of stable water-based nanocrys-talline TiO2 suspensions for photocatalytic applications of inkjet-printed films.Applied Catalysis A-General, 2012, 411, 60-69.
• Kirchner A., Arin M., Lommens P., Granados X., Ricart S., HolzapfelB. and Van Driessche I.Chemical solution deposition of multiferroic La0.7Sr0.3MnO3, BaTiO3
thin films prepared by ink plotting.Journal of Alloys and Compounds, 2012, 516, 16-19.
Oral presentations
• Preparation of TiO2 thin films from aqueous precursors by ink-jetprinting10e Vlaams Jongerencongres van de Chemie (VJC 10), Blanken-berge, March 2010.
• Synthesis of TiO2 thin films by ink-jet printing from water basedsol-gel precursors12th International conference on Modern Materials and Technolo-gies (CIMTEC 2010), Montecatini Terme, Italy, June 2010.
• Synthesis of TiO2 thin films by ink-jet printing from water basedprecursors12th Conference of the European Ceramic Society (ECerS XII),Stockholm, Sweden, June 2011.
• Preparation and characterization of TiO2 thin films by inkjet print-ing from aqueous precursor solutions
179
8th International conference on Nanosciences and Nanotechnolo-gies, Thessaloniki, Greece, July 2011.
• Deposition of Photocatalytically Active TiO2 Thin Films from Aque-ous Precursor Solutions and Nanoparticle Containing SuspensionsBelgium Ceramic Society (BCerS) Meeting, Leuven, Belgium, Febru-ary 2012.
• Deposition of Photocatalytically Active TiO2 Thin Films from Aque-ous Precursor Solutions and Nanoparticle Containing Suspensions9th International conference on Nanosciences and Nanotechnolo-gies, Thessaloniki, Greece, July 2012.
Poster presentations
• Ink-jet printing of TiO2 thin films from water based sol-gel pre-cursorsUGent Doctoraatssymposium Faculteit Wetenschappen, Gent, Bel-gium, April 2009.
• Development of aqueous inks for the printing of transparent, photo-catalytic active TiO2 layersSpring meeting of the Materials Research Society, San Francisco,CA, USA, April 2012.


Acknowledgements
This thesis came into existence with four years of work in the SCRiPTSgroup and marks the end of PhD research in my life which I enjoyedwith the company of several colleagues and friends. Therefore in thislast section I would like to thank those who have helped me and createdmany good memories during these years.
I express my deepest gratitude to my promoter Prof. Dr. Isabel VanDriessche for her guidance, criticism, encouragement, patience and in-sight throughout the research. I am also deeply thankful to my co pro-moter Dr. Petra Lommens for her remarkable advices and scientificinsight as well as for showing me the way to get the most fun out of sci-ence. Isabel and Petra, your constant encouragement, confidence in meand willingness to provide me the freedom to steer the project helpedme immensely in the pursuit of becoming an independent researcher.Thank you for your extremely friendly attitude and openness too.
I am also grateful to all the members of the jury, Prof. Dr. AnnemieAdriaens, Prof. Dr. Isabel Van Driessche, Dr. Petra Lommens, Prof. Dr.Pascal Van Der Voort, Prof. Dr. Dirk Poelman, Prof. Dr. Nele De Belie,Prof. Dr. Joris Van Acker, Dr. Ioannis Arabatzis and Dr. Simon Hop-kins, for their assessment and valuable comments on this dissertation.
The financial support from the European union (FP7-NMP-2007-SMALL-1) through the project EFECTS is gratefully acknowledged. Iwant to thank all the partners, especially to Prof. Bartek A. Glowackiand Dr. Simon Hopkins from University of Cambridge for their greathelp on ink-jet printing; to Dr. Ioannis Arabatzis from NanoPhos SAand Dr. Constantina Andreouli from CERECO for their guidance onsynthesis techniques.

182 Acknowledgements
Dear colleagues and friends as well from S3 department, thank youall for sharing pleasant working atmosphere and fun but sometimestough and miserable moments of lab life with me. SCRIPTS group,Prof. Dr. Klaartje De Buysser, Katrien, Jonas, Pieter, Glenn, Kenny,Mieke, Danny, as well as former colleagues Marcos, Veerle, Vyshnaviand Thuy, it was a pleasure working with you all. Special thanks tomy former thesis student, Joni, for never disappointing me. The be-ginners, Mieke, Heleni Jonathan’s, keep up the good work. I wouldlike to thank Els Bruneel for TGA/DTA measurements and discussions,Olivier Janssens for his SEM pictures and XRD scans, Glenn Pollefeytfor TEM analysis and FIB cross sections, Pierre and Claudine for ad-ministrative help and Pat for all IT assistance. In particular, I wantto express my gratefulness to Danny Vandeput for all his help duringthese 4 years. I will miss our scientific discussions and friendship.
Furthermore, to my special friends in Gent, Ann, Ozlem, Gokce,Raminta, and my dearest one from Paris, Bade, thank you all for yourfriendship, supporting me all the way, making it fun and much easierto handle. Onur, Namik, Olcay, Sila, Can, Burak, and many others, youmade my Gent days filled with joy. Nevertheless, my dear friends inTurkey, thank you all for encouraging me even from far away.
Finally, my dear family, thank you for your love, encouragementand endless belief on me throughout my life. Anne, baba, bana her za-man inandiniz, guvendiniz. Sizin sevginiz ve desteginizle buyudum.Hayatimin her asamasinda oldugu gibi bu doktora yolculugunda dayanimda oldugunuz icin tesekkur ederim. Deniz, my dear brother,thank you for being in my life. You’re my best friend, canim, kanim.I could never end this PhD journey without your support.
Melis Arin
Gent, February 2013