Pennsylvania Environmental CouncilPennsylvania Environmental Council
An OverviewAn Overview
May 8, 2007May 8, 2007

MissionMission
The Pennsylvania Environmental Council The Pennsylvania Environmental Council protects and restores the natural and built protects and restores the natural and built environments through innovation, environments through innovation, collaboration, education and advocacy. collaboration, education and advocacy. PEC believes in the value of partnerships PEC believes in the value of partnerships with the private sector, government, with the private sector, government, communities and individuals to improve communities and individuals to improve the quality of life for all Pennsylvanians.the quality of life for all Pennsylvanians.

PEC in a SnapshotPEC in a Snapshot Diverse Board of DirectorsDiverse Board of Directors Statewide staff of 25 Statewide staff of 25 Five offices and 3 Centers of Five offices and 3 Centers of
ExcellenceExcellence

PEC Tools and ExpertisePEC Tools and Expertise
Four decades of proven successFour decades of proven success A state-wide leader and innovatorA state-wide leader and innovator
• Policy development & AdvocacyPolicy development & Advocacy• Local and regional planningLocal and regional planning• Meeting challenges through Meeting challenges through
collaborationcollaboration• Environmental innovationEnvironmental innovation
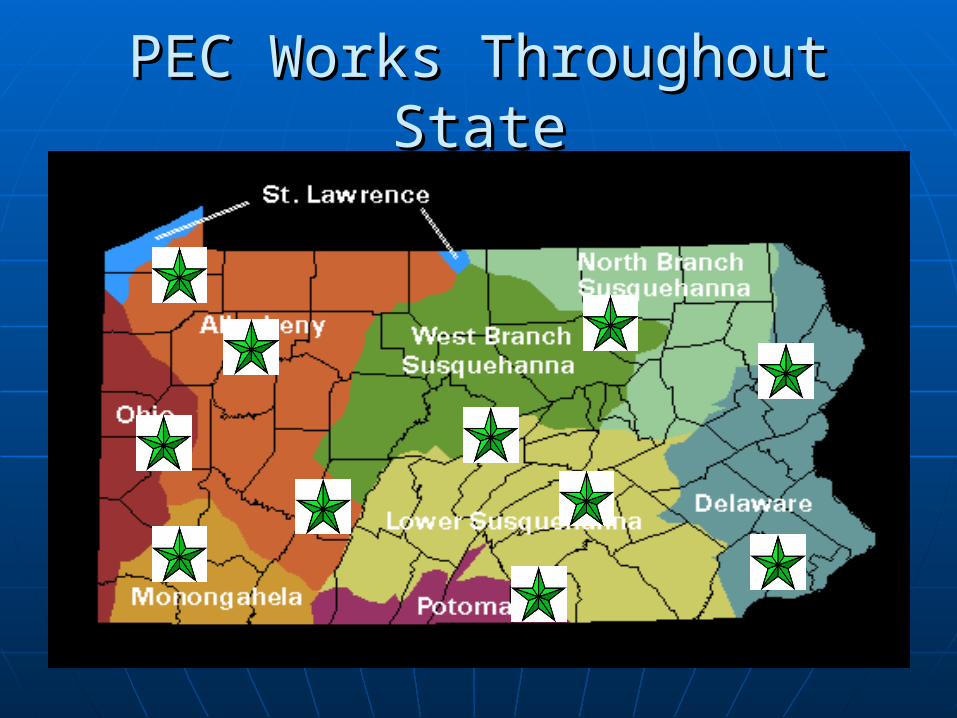
PEC Works Throughout StatePEC Works Throughout State

Use of Market MechanismsUse of Market Mechanisms

PA Green Investment StrategyPA Green Investment Strategy

PEC Work on Climate ChangePEC Work on Climate Change

Work in PA and ElsewhereWork in PA and Elsewhere
PECPEC EESI/CCSEESI/CCS
On the ground On the ground projectsprojects
PA GHG Inventory & PA GHG Inventory & Baseline ForecastsBaseline Forecasts
DCNR Carbon DCNR Carbon Management ProjectManagement Project
Work in Work in
AZ & NM completedAZ & NM completed
NC, SC, MT, & VT, NC, SC, MT, & VT,
PA Climate Change PA Climate Change RoadmapRoadmap
5 other states to 5 other states to beginbegin

Scientific Consensus on Scientific Consensus on Anthropogenic ImpactsAnthropogenic Impacts
Consensus: Consensus: reports by IPCC and the reports by IPCC and the US National Academy of SciencesUS National Academy of Sciences
Climate models: global avg. Climate models: global avg. temp increase by 3-10 degrees temp increase by 3-10 degrees by 2100by 2100
Recent projections by the UCSRecent projections by the UCS
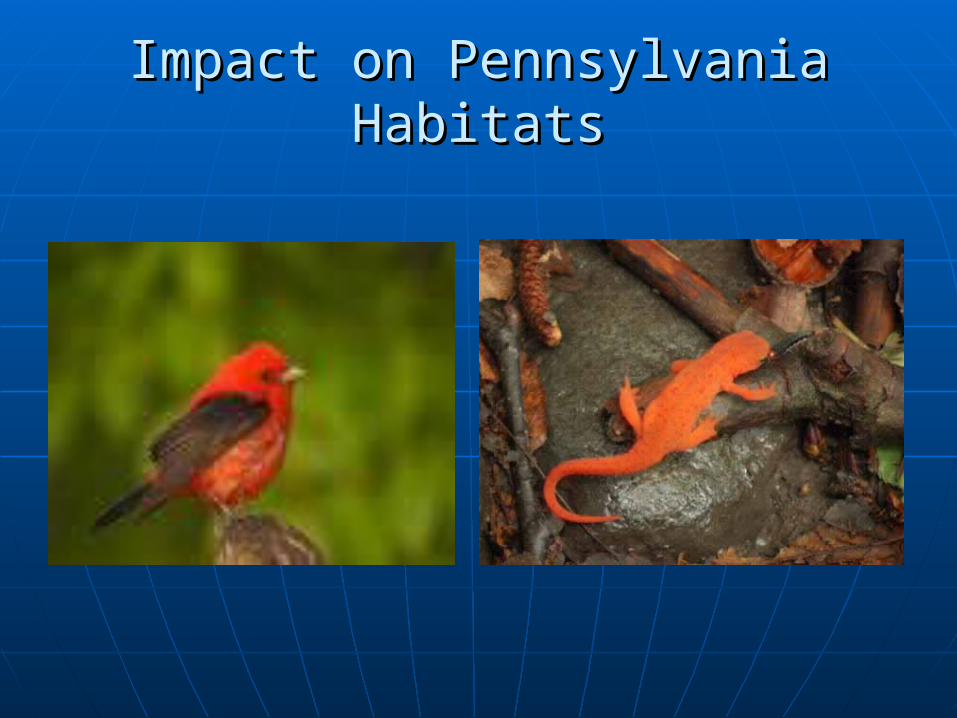
Impact on Pennsylvania HabitatsImpact on Pennsylvania Habitats

How hot will summers “feel” in Pennsylvania?
Summer Heat Index
Source: NECIA / UCS (see: www.climatechoices.org/ne/)
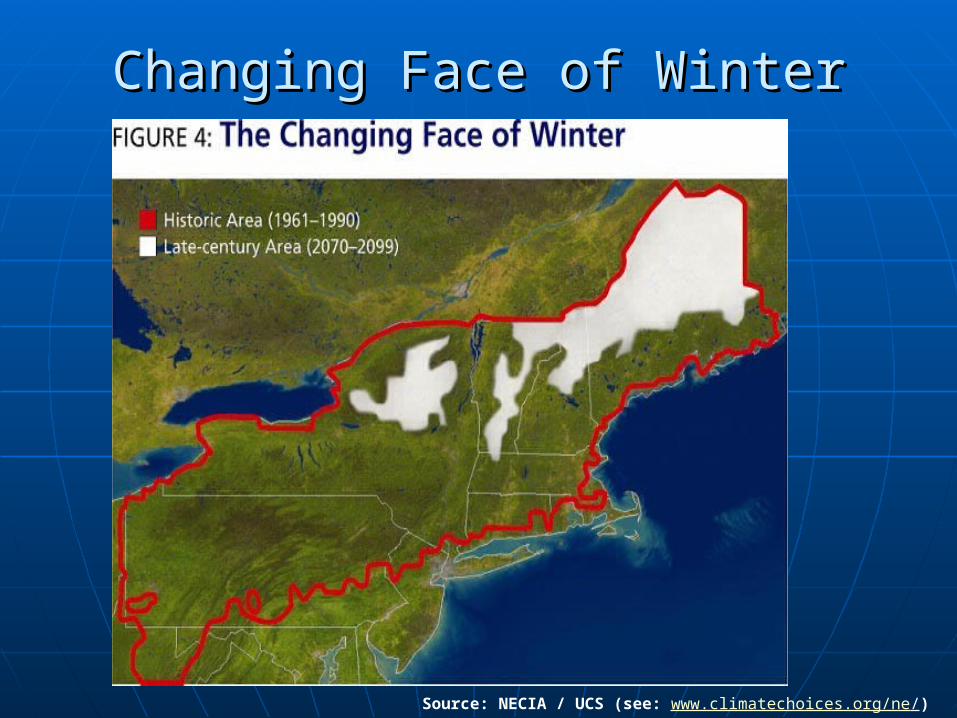
Changing Face of WinterChanging Face of Winter
Source: NECIA / UCS (see: www.climatechoices.org/ne/)
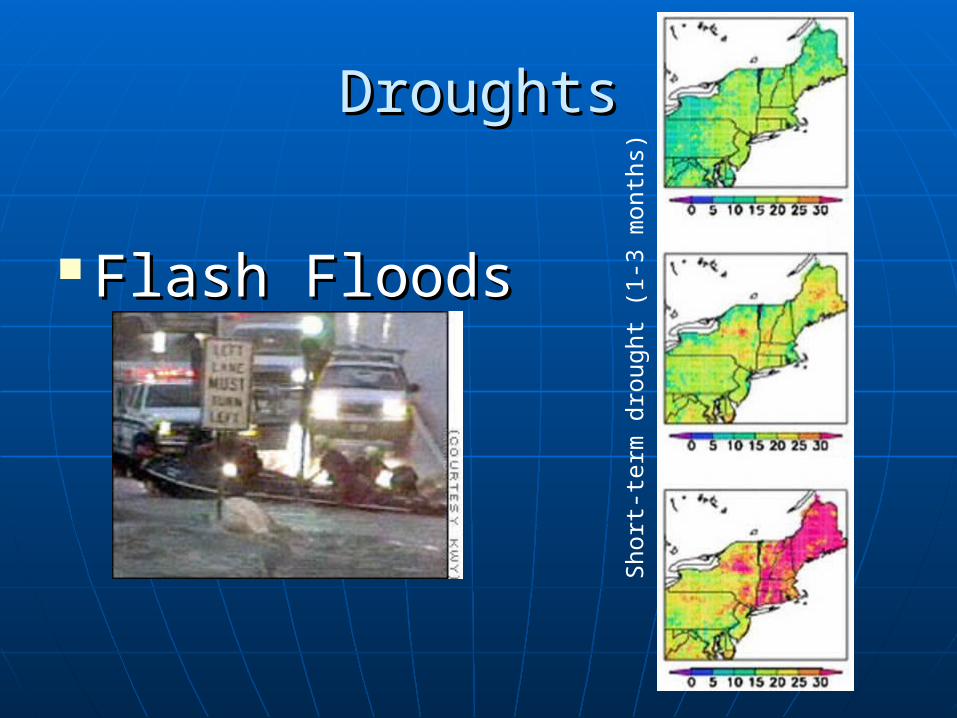
DroughtsDroughts
Flash FloodsFlash Floods
Sho
rt-t
erm
dro
ught
(1-
3 m
onth
s)

Heat Waves and Temperature Heat Waves and Temperature Extremes: Extremes: SE PASE PA

PA Climate Change RoadmapPA Climate Change Roadmap
Ad hoc stakeholder 2 year processAd hoc stakeholder 2 year process Goals: Goals:
• PA GHG emissions inventory and PA GHG emissions inventory and baseline forecastsbaseline forecasts
• Build consensus on policy Build consensus on policy recommendations to reduce those recommendations to reduce those emissionsemissions
• Recommend a “Roadmap” for state Recommend a “Roadmap” for state officials with a goal for 2025officials with a goal for 2025

Greenhouse Gas ExamplesGreenhouse Gas Examples
GHGGHG GHG ImpactGHG Impact SourcesSources
CO2CO2
80% of total80% of total11 Fossil Fuels and Fossil Fuels and
other sourcesother sources
N2ON2O 23x23x Agriculture Agriculture
CH4CH4 296x296x Natural Gas, Natural Gas, coal, landfillscoal, landfills
HFCs/PFCs/SFsHFCs/PFCs/SFs 90x – 10,00090x – 10,000 Fire Fire Suppressants Suppressants and solventsand solvents

PA Climate Change Roadmap PA Climate Change Roadmap Working GroupWorking Group
NGOs:NGOs:
Rodale InstituteRodale Institute PennFuturePennFuture PA Horticultural SocietyPA Horticultural Society PennEnvironmentPennEnvironment Clean Air CouncilClean Air Council The Nature ConservancyThe Nature Conservancy Sustainable Development Sustainable Development
FundFund
Utilities:Utilities: Exelon Corp.Exelon Corp. PPLPPL
Business:Business: Blue Hill CapitalBlue Hill Capital Air Products & ChemicalsAir Products & Chemicals O’Brien & GereO’Brien & Gere
PA DEPPA DEPPA DCNRPA DCNR

Emission CategoriesEmission Categories
residential commercial industrial
Energy generation Agriculture/forestryLand Use/
Transportation

PA GHG Inventory and Reference Case PA GHG Inventory and Reference Case ProjectionsProjections
In 2000, PA emitted 305 MMtCO2eIn 2000, PA emitted 305 MMtCO2e PA generates 1 % of the worldwide PA generates 1 % of the worldwide
greenhouse gasesgreenhouse gases PA is listed as number three in the PA is listed as number three in the
US (behind TX and CA)US (behind TX and CA) PA emissions put us in the same PA emissions put us in the same
category as top 25 countries in worldcategory as top 25 countries in world

2000 GHG Emissions2000 GHG Emissions
Waste2%
Transport23%
Industrial Process
3%
Res/Comm Fuel
Use12%
Fossil Fuel
Industry6%
Non-Fossil Ind. Fuel
Use15%
Electricity37%
Agric.2%
Pennsylvania
Transport26%
Industrial Process
5%
Res/Com Fuel Use
9%
Fossil Fuel Ind. (CH4)
3%
Industrial Fuel Use
14%
Waste4%
Electricity32%
Agric.7%
US

2000 GHG Emissions2000 GHG Emissions
CategoryCategory US %US % PA %PA %ElectricityElectricity 3232 3737TransportationTransportation 2626 2323Non-Fossil Fuel Non-Fossil Fuel use Industryuse Industry
1414 1515
Res/CommercialRes/Commercial 99 1212Waste IndstWaste Indst 44 22AgricultureAgriculture 77 22Fossil Fuel Fossil Fuel IndustryIndustry
33 66
Industr ProcessIndustr Process 55 33

Types of GHG Emissions in PATypes of GHG Emissions in PA
89% - CO2 fossil fuels from power 89% - CO2 fossil fuels from power plants, vehicles, buildings and plants, vehicles, buildings and industryindustry
7% - CH4 from fossil fuel combustion, 7% - CH4 from fossil fuel combustion, oil and gas prod., coal mines, oil and gas prod., coal mines, agriculture, waste managementagriculture, waste management
4% - N20 from industrial processes 4% - N20 from industrial processes and agricultural soils.and agricultural soils.

0
50
100
150
200
250
300
350
400
1990 1995 2000 2005 2010 2015 2020 2025
MM
tCO
2e
Electricity (exports)
Electricity (In-stateconsumption)Fossil Fuel Industry
RCI Fuel Use
Transportation Gasoline
Transportation Diesel
Jet Fuel/Other Transport
Agriculture
ODS Substitutes
Other Ind. Processes
Waste Management
Gross GHG Emissions by Sector, 1990-2025:
Historical and Projected

PA GHG Reference Case ProjectionsPA GHG Reference Case Projections
2010 (current rate of growth) = 335 2010 (current rate of growth) = 335 MMtCO2e/yearMMtCO2e/year
2025 (current rate of growth) = 383 2025 (current rate of growth) = 383 MMtCO2e/yearMMtCO2e/year
Goal: 25% below 2000 emissions of 305 Goal: 25% below 2000 emissions of 305 MMtCO2e = 230 MMtCO2eMMtCO2e = 230 MMtCO2e
To reach goal must reduce emissions by 153 To reach goal must reduce emissions by 153 MMtCO2e based on current projected growthMMtCO2e based on current projected growth

Policy Recommendations: Energy SupplyPolicy Recommendations: Energy Supply
Add Tier 3 energy efficiency component
Increase Tier I AEPS to 25% Create Public
Benefit Fund
Update Efficiency Standards
Carbon offset Coal bed methane

Residential, Commercial & IndustrialResidential, Commercial & Industrial
Benefit fund New Building Standards Retrofit Buildings
Biomass & biofuel Methane collection Education

Transportation & Land UseTransportation & Land Use
Cellulosic Ethanol Tire Efficiency Smart Growth
Reform Commission Clean vehicles Truck idling

Agriculture, Forestry and GeologyAgriculture, Forestry and Geology
No-till farming and other bmps
Afforestation Sequestration
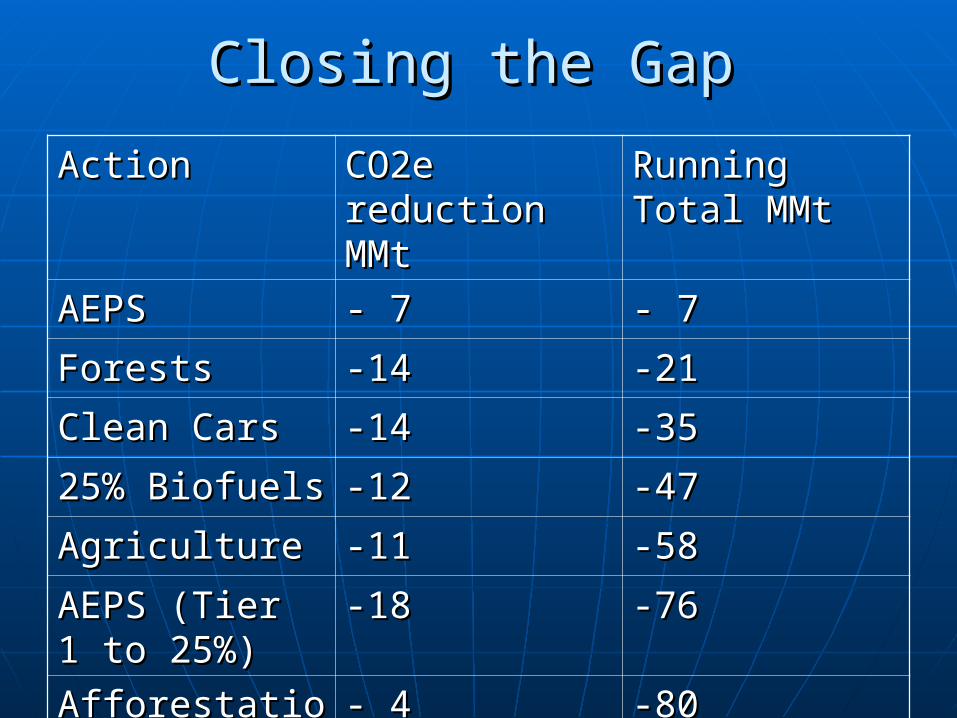
Closing the GapClosing the Gap
ActionAction CO2e CO2e reduction MMtreduction MMt
Running Total Running Total MMtMMt
AEPS AEPS - 7- 7 - 7- 7
ForestsForests -14-14 -21-21
Clean CarsClean Cars -14-14 -35-35
25% Biofuels25% Biofuels -12-12 -47-47
AgricultureAgriculture -11-11 -58-58
AEPS (Tier 1 AEPS (Tier 1 to 25%)to 25%)
-18-18 -76-76
AfforestationAfforestation - 4- 4 -80-80

Need to considerNeed to consider Carbon SequestrationCarbon Sequestration National cap and trade programNational cap and trade program Governor needs to look at how we can Governor needs to look at how we can
close the gapclose the gap
““No state or region has a dominant position in any cleantech No state or region has a dominant position in any cleantech segment yet. And the global pool of cleantech venture segment yet. And the global pool of cleantech venture capital is not a zero-sum game – promising companies will capital is not a zero-sum game – promising companies will always attract new capital. But the seeds are being laid always attract new capital. But the seeds are being laid now to determine which state’s companies will get the now to determine which state’s companies will get the lion’s share of investment, and which states will call the lion’s share of investment, and which states will call the leaders of the cleantech industry their own. The states that leaders of the cleantech industry their own. The states that can best woo entrepreneurs and investors now will have a can best woo entrepreneurs and investors now will have a chance to create self-perpetuating cleantech clusters that chance to create self-perpetuating cleantech clusters that drive dynamic economic growth while also improving the drive dynamic economic growth while also improving the environment...”environment...”

www.pecpa.orgwww.pecpa.org
The Pennsylvania Environmental The Pennsylvania Environmental Council protects and restores the Council protects and restores the natural and built environments natural and built environments
through innovation, collaboration, through innovation, collaboration, education and advocacy. PEC believes education and advocacy. PEC believes in the value of partnerships with the in the value of partnerships with the
private sector, government, private sector, government, communities and individuals to communities and individuals to improve the quality of life for all improve the quality of life for all
Pennsylvanians.Pennsylvanians.
Recommended