ww.sciencedirect.com
i n t e r n a t i o n a l j o u r n a l o f h yd r o g e n e n e r g y x x x ( 2 0 1 6 ) 1e1 0
Available online at w
ScienceDirect
journal homepage: www.elsevier .com/locate/he
Computational fluid dynamics study of PEM fuelcell performance for isothermal and non-uniformtemperature boundary conditions
�Zeljko Penga, Ivan Tolj, Frano Barbir*
Faculty of Electrical Engineering, Mechanical Engineering and Naval Architecture, University of Split, R Boskovica 32,
21000 Split, Croatia
a r t i c l e i n f o
Article history:
Received 19 April 2016
Received in revised form
11 July 2016
Accepted 12 July 2016
Available online xxx
Keywords:
Computational fluid dynamics
Segmented fuel cell
Non-uniform temperature field
Water transport
Thermal conductivity
* Corresponding author.E-mail address: [email protected] (F. Barbir
http://dx.doi.org/10.1016/j.ijhydene.2016.07.00360-3199/© 2016 Hydrogen Energy Publicati
Please cite this article in press as: Penga �Z, enon-uniform temperature boundary conj.ijhydene.2016.07.092
a b s t r a c t
Computational fluid dynamics (CFD) study of segmented proton exchange membrane fuel
cell (PEMFC) performance has been carried out, based on experimental setup and operating
parameters from previous studies. Two different temperature boundary conditions were
considered e isothermal and, a novel, non-uniform temperature profile calculated from
Mollier h-u chart. Implementation of non-uniform terminal temperature boundary con-
ditions resulted in close to 100% relative humidity along the cathode channel, resulting in
improvement of PEMFC performance without the need for external humidification. Model
polarization curve and relative humidity distribution along the cathode channel length are
in good agreement with experimental results. It was found that different current collector
materials, i.e., their thermal conductivity have major influence on temperature, thus on
relative humidity distributions along reactant gas channels. The membrane thickness af-
fects the net water transport across the membrane, thus also has influence on temperature
and relative humidity distribution along the reactant gas channels.
© 2016 Hydrogen Energy Publications LLC. Published by Elsevier Ltd. All rights reserved.
Introduction
Water and heat produced during an electrochemical reaction
inside a fuel cell can be used for internal humidification of
reactant gases, without the need for external humidifiers.
However, if non-humidified ambient air is introduced in an
isothermal fuel cell operating at 60 �C or higher, it would be
heated very quickly which would result in extremely low
relative humidity throughout the cathode channel, thus
causing drying of the polymer in the catalyst layer and the
membrane. This, in turn, would have adverse effects on fuel
cell performance and durability [1]. Tolj et al. [2] proposed and
).92ons LLC. Published by Els
t al., Computational fluidditions, International J
investigated a concept of an imposed variable temperature
profile along the cathode channel which resulted in 100%
relative humidity of reactant gas throughout the most of the
cathode channel without external humidification. Toyota also
relied on internal water and heat management to operate the
fuel cell stack in their Mirai vehicle without external humid-
ification [3].
High relative humidity along the cathode channel results
in higher protonic conductivity of the polymer membrane, as
demonstrated in studies by Zawodzinski et al. [4] and Hinatsu
et al. [5]. However, too much water inside the fuel cell may
result in flooding of the catalyst layer, the gas diffusion layer
and the channel. It would therefore be beneficial to keep
evier Ltd. All rights reserved.
dynamics study of PEM fuel cell performance for isothermal andournal of Hydrogen Energy (2016), http://dx.doi.org/10.1016/
i n t e r n a t i o n a l j o u r n a l o f h y d r o g e n en e r g y x x x ( 2 0 1 6 ) 1e1 02
relative humidity around 100% inside the fuel cell. This is only
possible with adequate internal water and heat management.
Water management means balancing various water fluxes,
namely water generated in the electrochemical reaction on
the cathode side, electro-osmotic drag, i.e., water flux from the
anode to the cathode, and water diffusion through the mem-
brane as a result of water concentration and pressure
gradients.
Electro-osmotic drag is defined as a number of water
molecules NðH2OÞ dragged by a single hydrogen proton pass-
ing through the membrane. Water flux induced by electro-
osmotic drag is always from the anode to the cathode side of
themembrane. There have been numerous studies carried out
over the years to determine the correlation between electro-
osmotic drag coefficient and various operating parameters
for Nafionmembranes [6e16]. Experimental methods used for
electro-osmotic drag coefficient determination were concen-
tration cell [6e8], direct-methanol fuel cell analysis [10],
electrophoretic NMR techniques [11], and streaming poten-
tials [15].
However, results of parameter correlation from different
authors show high level of disagreement, although most of
them follow similar trends when dependency on different
operating conditions is considered. Model predictions from
various authors are considerably different in lowermembrane
water content (l) intervals. Almost every numerically imple-
mented model for determining electro-osmotic drag coeffi-
cient is dependent upon l, which is in defined as a function of
water activity, i.e. relative humidity. However, results from a
study by Jinnouchi et al. [17] showed that electro-osmotic drag
coefficient is not dependent on l, and that it increases only
slightly with increase in operating temperature. For this
reason, further investigation of electro-osmotic drag coeffi-
cient in an operating PEMFC is required.
Water flux resulting from a water concentration gradient
across the membrane is defined as diffusion if the flux direc-
tion is from the anode to the cathode side of the membrane,
and back-diffusion if the flux is in the opposite direction. In
most practical applications, during the flow of an electric
current, only back-diffusion is considered, because water
concentration on the cathode side of the membrane is always
higher. Large number of studies have been carried out in order
to determine diffusion coefficient by different groups of au-
thors [7,12,13,18e25]. Models of water diffusion through the
membrane also show significant disagreements between au-
thors using similar initial operating parameters.
Although most of measurement results show monotonic
dependency of water diffusion on l, some models predict a
relatively large spike in water diffusion for l intervals of 3e4,
which has not been physically explained so far. In work by
Olesen et al. [24] this phenomena was attributed to a purely
mathematical nature of derivation of fraction of natural log-
arithms of water activity versus natural logarithm of mem-
brane water content e because membrane water content
dependency on water activity was assumed to be a third de-
gree polynomial with origin in zero. This is not valid after
PEMFC break-in procedure, because the membrane will retain
a certain amount of water even if the reactants are completely
dry for some period of time. Experimental methods used
during the investigations were nuclear magnetic resonance
Please cite this article in press as: Penga �Z, et al., Computational fluidnon-uniform temperature boundary conditions, International Jj.ijhydene.2016.07.092
[14,18,19], transient sorption kinetics [20,21], steady-state
permeation [12,13,22,23], amongst others [26e29].
Almost every author referenced so far, when considering
membrane water content, has implemented empirical
expression for l derived by Zawodzinski et al. [4]. Zawod-
zinski et al. have carried out experiments at operating tem-
perature of 30 �C, which is unreasonably low when
considering common PEMFC operating temperatures (in
ranges of 60 �Ce80 �C). From this approach, one would sug-
gest that l would be the same for different temperatures
since it has temperature already incorporated in terms of
water vapor saturation pressure, which is used to calculate
water activity, i.e. relative humidity. However, in work of
Hinatsu et al. [5], l has been measured for an operating
temperature of 80 �C. The results of Hinatsu et al. [5] differ
significantly for higher intervals of water activity when
compared to results from Zawodzinski et al. [4], and subse-
quently requires further investigations.
Considering the above mentioned, changing temperature
on boundaries of a CFD model in order to achieve the desired
relative humidity profile along the reactant channels (result-
ing in higher PEMFC efficiency), has a high potential for error.
In order to determine the reliability of the implemented
models for water transport, in this work the CFD model is
validated with local and global operating parameters from
experiments of Tolj et al. [2].
The major outcome of this paper is outlining the fact that
temperature difference between reactant channels and cur-
rent collector terminals is significant, and that improper
definition of higher temperature boundary conditions during
the CFD analysis leads to under-prediction of the polarization
curve at higher current densities.
The common CFD modeling approach is defined by having
a uniform temperature field on anode and cathode terminals,
based on defining a single parameter of operating tempera-
ture. The temperature of an operating PEMFC is higher inside
the reactant channels e compared to the temperature along
terminals, and non-uniformly distributed due to heat release
induced by electrochemical reaction.
Although this is of minor importance for relatively low
current densities and fully humidified reactants, in cases
where higher current density is considered and where
partially humidified reactants are used, this must be consid-
ered. One way of minimizing this error would be to measure
the temperature along the anode and cathode terminals in
more physical points. This would result in a temperature
profile boundary condition and lead to a more realistic
boundary condition setup, as demonstrated in this work.
There are other methods of achieving self-humidification
of an operating cell [30e36], but they are based on devel-
oping new materials for the membrane, catalyst layers and
new types of porous layers, or the necessity for hydrogen
recirculation pump, which results in further increase in the
cost of the already costly membrane-electrode assembly or
the PEM fuel cell system. Thiswork is studying the economical
solution for self-humidification without the necessity for
developing new exotic materials or using additional system
components for achieving self-humidification. It is based on
establishing a temperature gradient along the cathode flow
field, which can be achieved by cooling channels configuration
dynamics study of PEM fuel cell performance for isothermal andournal of Hydrogen Energy (2016), http://dx.doi.org/10.1016/
i n t e r n a t i o n a l j o u r n a l o f h yd r o g e n e n e r g y x x x ( 2 0 1 6 ) 1e1 0 3
and coolant mass flow rate control which is a standard
component of PEM fuel cell stack systems.
Methodology
Experimental setup
In a previous study by Tolj et al. [2], measurements of polari-
zation curves and relative humidity profiles along the cathode
reactant channel were done using 5 single cell fuel cells
(segments) connected electrically in parallel, with counter-
flow setup. The results have been used to calibrate and vali-
date the developed CFD model.
Domains
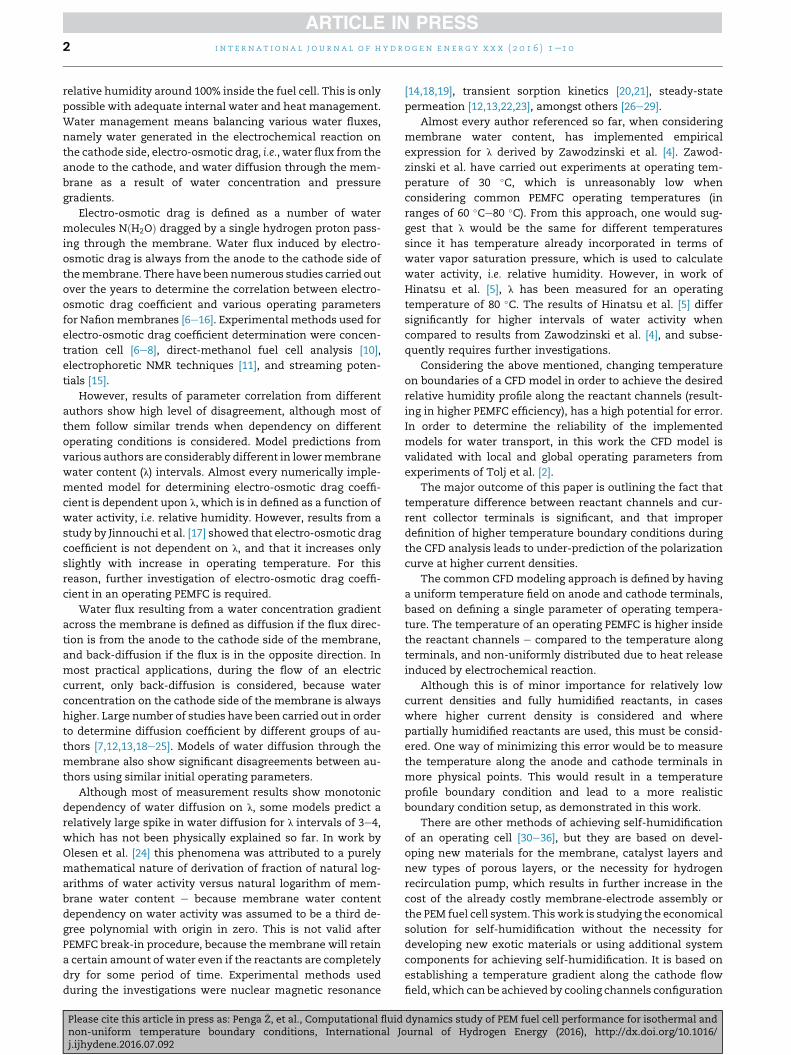
Geometry for the CFD model has been developed from one
single cell used by Tolj et al. [2]. In order to implement
segmented temperature boundary condition, and represent
the experimental setup consisting of five segments, current
collector terminals from anode and cathode have been
divided into five equal parts (segments), Fig. 1.
Mesh
In order to enable study of different physical processes inside
PEMFC, a grid dependency study was carried out for various
mesh configurations by varyingmesh type and number of finite
volumes. Since geometry is simple, and has large difference in
scale size (edge length span from 10 mm e catalyst layer thick-
ness, to0.2meaxial lengthofPEMFC), itwasmostconvenient to
use a structured hexahedral mesh, i.e. Cartesian grid.
During the calculations, convergence monitors have been
defined to track the convergence history of average current
density on the cathode terminals, as well as the average
relative humidity on anode and cathode inlets and outlets. In
order to achieve a grid independent solution, the number of
mesh sub-divisions has been varied considerably. After
Fig. 1 e Numerical domains.
Please cite this article in press as: Penga �Z, et al., Computational fluidnon-uniform temperature boundary conditions, International Jj.ijhydene.2016.07.092
achieving a grid independent solution for an average current
density close to 500 mA cm�2, the relative humidity profile
along the cathode channel length has been compared to
experimental results with good agreement. Total number of
finite volumes was 1.547 million.
A comparison of mesh setup with the one used in work by
Arvay [37] showed a similar number of edge sub-divisions for
all domains besides the reactant channels. In this work, a
higher number of finite volumes in the channels have been
used to give a better representation of the relative humidity
profile along the cathode channel.
Governing equations and boundary conditions
Numerical calculations were carried out using ANSYS Fluent
16.2 PEM Fuel Cell Module. The operating parameters used in
the setup are shown in Table 1. The parameters used for the
model calibration were open-circuit voltage of 0.91 V, imple-
mented from the work of Tolj et al. [2], and the cathode
reference current density for the operating current density of
500 mA cm�2. The resulting value for cathode reference cur-
rent density used during the simulations was 0.0155 Am�2.
The remaining material parameters are kept on the default
values in PEM Fuel Cell Module, because the data was not
provided by the MEA manufacturer. Solution control and
recommended parameters are implemented from the manual
[38]. The novelty of this work is the implementation of
segmented temperature profiles which enables the study of
PEMFC operating parameters for different applied tempera-
ture profiles, i.e. temperature gradients.
The governing equations are based on mass, momentum,
energy and species conservations including appropriate source
terms described in the manual [38]. The type of analysis used
was steady-state and single-phase, including equations for
Joule heating, reaction heating, electrochemistry sources,
Butler-Volmer rate and membrane water transport. Water
transport equations consist of an equation for electro-osmotic
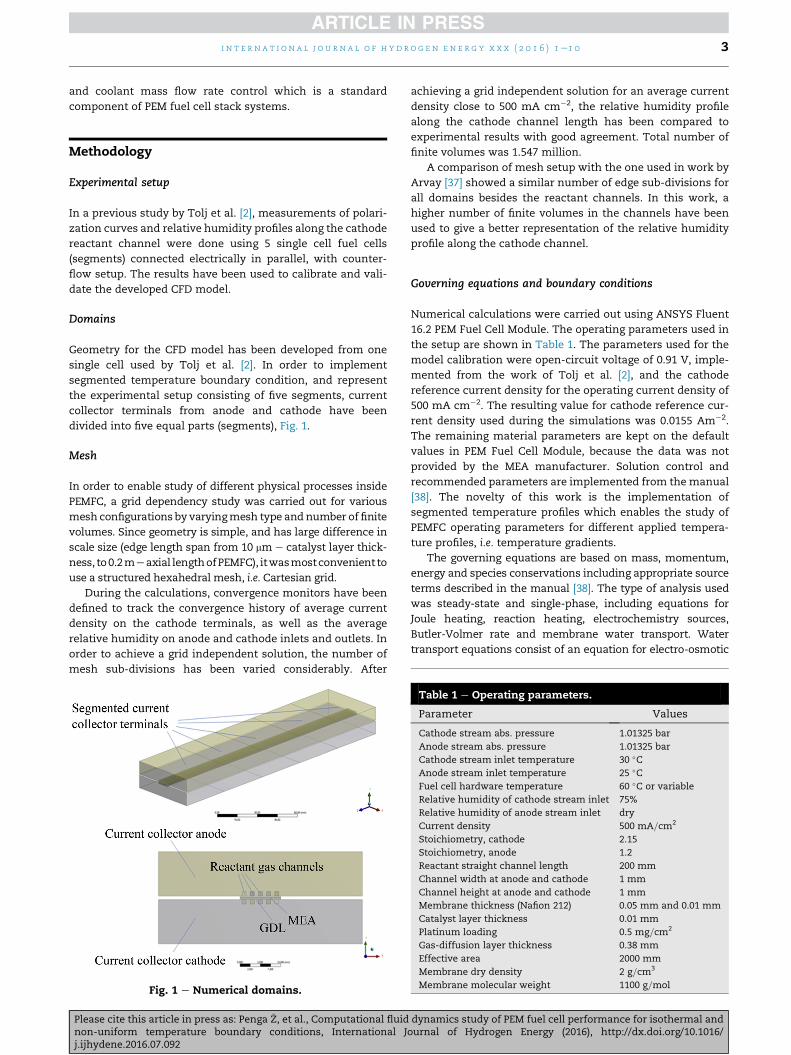
Table 1 e Operating parameters.
Parameter Values
Cathode stream abs. pressure 1.01325 bar
Anode stream abs. pressure 1.01325 bar
Cathode stream inlet temperature 30 �CAnode stream inlet temperature 25 �CFuel cell hardware temperature 60 �C or variable
Relative humidity of cathode stream inlet 75%
Relative humidity of anode stream inlet dry
Current density 500 mA=cm2
Stoichiometry, cathode 2.15
Stoichiometry, anode 1.2
Reactant straight channel length 200 mm
Channel width at anode and cathode 1 mm
Channel height at anode and cathode 1 mm
Membrane thickness (Nafion 212) 0.05 mm and 0.01 mm
Catalyst layer thickness 0.01 mm
Platinum loading 0.5 mg=cm2
Gas-diffusion layer thickness 0.38 mm
Effective area 2000 mm
Membrane dry density 2 g=cm3
Membrane molecular weight 1100 g=mol
dynamics study of PEM fuel cell performance for isothermal andournal of Hydrogen Energy (2016), http://dx.doi.org/10.1016/
i n t e r n a t i o n a l j o u r n a l o f h y d r o g e n en e r g y x x x ( 2 0 1 6 ) 1e1 04
drag coefficient by Springer et al. [26] and diffusion equations
by Motupally et al. [12] for different membrane water content
intervals. The membrane water content equation used in the
software was adopted from Zawodzinski et al. [4].
The governing equations of Fluent PEM fuel cell module
are based on energy, mass, momentum and species conser-
vation including appropriate sink and source terms [refer-
ence]. For steady-state simulations, time dependent
parameters are omitted from the equations. The resulting
equations are:
Continuity
V�rV!� ¼ Smass
Where Smass represents source term for continuity equation.
This term is only applicable for the triple-phase boundary
(catalyst) regions. Inside the gas channels, gas-diffusion
layers and the membrane, the source term Smass is set to
zero.
Momentum
1sð1� sÞV
�rV!
V!� ¼ �Vpþ 1
sð1� sÞV�mVV
!�þ rg þ Smom
Where Smom represents the source term for momentum
equation and applies only for the porous medium. For other
domains, Smom is set to zero.
Species
V�rV!Xi
� ¼ �VðrDiVXiÞ þ Si
where index i represents different speciese oxygen, hydrogen
and water vapor. Si represents the source and sink term for
the species inside the catalyst layers and accounts for the
reactant consumption in anode and cathode catalyst layers
and water generation inside the cathode catalyst layer. In
other domains, Si is set to zero.
Energy
V�rV!T� ¼ V
�keffVT
�þ ST
where ST represents the heat source term for the energy
equation. ST applies only for the cathode catalyst layer, for
other domains it is set to zero.
Water transport through the membrane
Electro-osmotic drag represents thewater flux from the anode
to the cathode side, and is defined by expression
nd ¼ 2:522
l
where nd represents electro-osmotic drag coefficient, and l
represents membrane water content, defined as
l ¼ 0:043þ 17:18a� 39:85a2 þ 36a3 ða<1Þ
Please cite this article in press as: Penga �Z, et al., Computational fluidnon-uniform temperature boundary conditions, International Jj.ijhydene.2016.07.092
l ¼ 14þ 1:4ða� 1Þ ða � 1ÞWhere a represents water activity, defined as
a ¼ pwv
psatþ 2s
Where pwv represents water vapor pressure, and psat repre-
sents water vapor saturation pressure. Since the model is
single phase, the Leverett function term 2s is set to zero.
Back-diffusion flux Jdiffw is defined as
Jdiffw ¼ � rm
MmMH2ODlVl
Where rm andMm represent density and the equivalent weight
of the dry membrane, respectively. The term Dl represents
membrane water diffusivity, defined as
Dl ¼ 3:1� 10�7l�e0:28l � 1
��e�
2346T
�ðl<3Þ
Dl ¼ 4:17e� 10�8l�1þ 161e�l
��e�
2346T
�ðl � 3Þ
Domain boundary conditions
The domain type for all domains is defined as fluid bodies,
except for current collectors which are defined as solid bodies.
In work of Tolj et al. [2] the current collector material was
stainless steel SS316L, therefore this material was selected in
this study as well.
It has been shown that the thermal conductivity of the
current collector material has a significant influence on rela-
tive humidity profile along the channel length. Thermal con-
ductivity affects the heat transfer rate between the reactant
channels which are at higher temperature, and the current
collector terminals, which are on lower temperature. Appli-
cation of current collector materials with low thermal con-
ductivity results in a higher temperature difference between
the channels and terminals. Reduction in heat transfer be-
tween the channels and terminals results in a temperature
gradient and reduced relative humidity profile along the entire
channel length. The temperature along the channel length
determines the water vapor saturation pressure, therefore it
has a direct influence on relative humidity distribution along
the channel, as well as PEMFC efficiency.
Inlet boundary conditions
The mass flow inlet boundary condition is defined for anode
and cathode inlets. The anode inlet hydrogen temperature
was set to 25 �C, with a relative humidity of 0%. Cathode inlet
air temperature was set to 30 �C, with a relative humidity of
75%. The anode mixture of gases consisted of hydrogen and
water vapor (while the mass fraction of water vapor was set
on zero on the anode inlet), the cathode mixture of gases
consisted of nitrogen, oxygen and water vapor.
Outlet boundary conditions
On the anode and cathode reactant channel outlets, the
pressure outlet boundary condition is applied with a zero
dynamics study of PEM fuel cell performance for isothermal andournal of Hydrogen Energy (2016), http://dx.doi.org/10.1016/

Fig. 2 e Effect of different thermal conductivity of current
i n t e r n a t i o n a l j o u r n a l o f h yd r o g e n e n e r g y x x x ( 2 0 1 6 ) 1e1 0 5
gauge pressure and backflow total temperature set according
to the temperature field setup.
Wall boundary conditions
Non-slip boundary conditions were applied to the walls. The
temperature was fixed on segmented terminals of the anode
and cathode current collectors for isothermal and non-
uniform temperature field. The electric potential on the
anode terminals was set to zero. On the cathode terminals
different values of electric potential are defined in order to
extract the polarization curve. The remaining surfaces are
defined as walls by default.
collectors on relative humidity distribution along cathode
channel.
Results and discussionsIsothermal case experimental results for the polarization
curve and relative humidity profile along the cathode channel
are used for model calibration. The calibration consisted of
achieving grid independent solution and defining appropriate
material properties of current collectors.
In the work of Ozden et al. [39], the analysis was done for
similar isothermal setup, with difference from experimental
setup by Tolj et al. [2] by using aluminum as current collector.
In that work, the analysis was done for an electric potential of
0.548 V, resulting in a current density close to 500 mA cm�2.
The simulated operating point has shown good agreement
compared with experimental results of polarization curve
from Tolj et al. [2], while the difference in the relative hu-
midity profile along the cathode channel was notably
contrasted.
The first step during the calibration of the developedmodel
was to compare the operating point and the relative humidity
profile with the results reported in Ref. [39] when aluminum is
used as current collector. It was found that the results are in
good agreement.
Influence of thermal conductivity of current collectors onrelative humidity distribution along the reactant channels
After changing the current collector material properties to
represent stainless steel SS316L, the numerical simulation re-
sults showed even better agreement of relative humidity profile
along the cathode channel when compared with experimental
data fromTolj et al. [2]. It is found that the thermal conductivity
has significant influence on the relative humidity distribution.
Since the thermal conductivity of the current collectormaterial
used by Tolj et al. [2] was not measured experimentally, and
knowing that the thermal conductivity of SS316L ranges from
12 to 17Wm�1 K�1, the best agreement with experimental data
is achieved with a thermal conductivity of 13 Wm�1 K�1, as
shown in Fig. 2. The relative humidity shown in Fig. 2 repre-
sents the area-weighted average values for the cathode chan-
nel cross sections. The values of relative humidity from CFD
simulations are extracted for cross sections defined every 5% of
the channel length.
In order to explain this behavior, several things must be
considered. Aluminum has a higher thermal conductivity
compared to that of stainless steel (200 Wm�1 K�1 for
Please cite this article in press as: Penga �Z, et al., Computational fluidnon-uniform temperature boundary conditions, International Jj.ijhydene.2016.07.092
aluminum, vs. 12e17 Wm�1 K�1 for stainless steel). The rela-
tive humidity for fixed mass flow and pressure depends only
on temperature, since water vapor saturation pressure is only
a function of temperature [40]. For a fixed mass flow and
pressure, increasing the temperature along the reactant
channels results in a reduction of relative humidity profile
along the channel, and vice versa.
If the temperature is fixed on the terminals, it is clear that
higher temperature along the reactant channels must be pri-
marily caused by heat release during electrochemical reactions
inside the cathode catalyst layer. This leads to a conclusion that
in order to determine the relative humidity profile along the
channel length properly during CFD analysis, it is important to
apply realistic boundary conditions for temperature on the
anode and cathode terminals. In order to define realistic tem-
peratures on terminals, they would need to be measured
experimentally. Measuring the terminal temperature is espe-
cially important when current collector materials with low
thermal conductivity are used (e.g. stainless steel, graphite, ti-
tanium). In this work, it is shown that the temperature, for
isothermal boundary condition setup, is higher inside reactant
channels from 3 to 5 K when compared to the terminal tem-
perature for current density close to 500 mA cm�2. The tem-
perature difference between the two further increases with
increase in the operating current density.
Model validation
In order to determining the influence of different temperature
field configurations on PEMFC performance, two fixed temper-
ature fields on anode and cathode terminals are studied (anode
and cathode side have identical configuration). The first was
uniform temperature field, or the so-called isothermal, and the
other was non-uniform temperature field. To determine how
accurately does the model predicts PEMFC performance, the
simulation results were compared with the experimental ones.
The comparison of the results for the polarization curve and
relative humidity profile along the cathode channel length
shows good agreement with the simulation results.
Polarization curvesThe comparison of the simulated operating points with the
associated experimental polarization curves is done for two
dynamics study of PEM fuel cell performance for isothermal andournal of Hydrogen Energy (2016), http://dx.doi.org/10.1016/
i n t e r n a t i o n a l j o u r n a l o f h y d r o g e n en e r g y x x x ( 2 0 1 6 ) 1e1 06
different temperature fields. During the simulation setup,
potentiostatic boundary conditions were applied by defining
electric potential of 0 V on the anode and a fixed electric po-
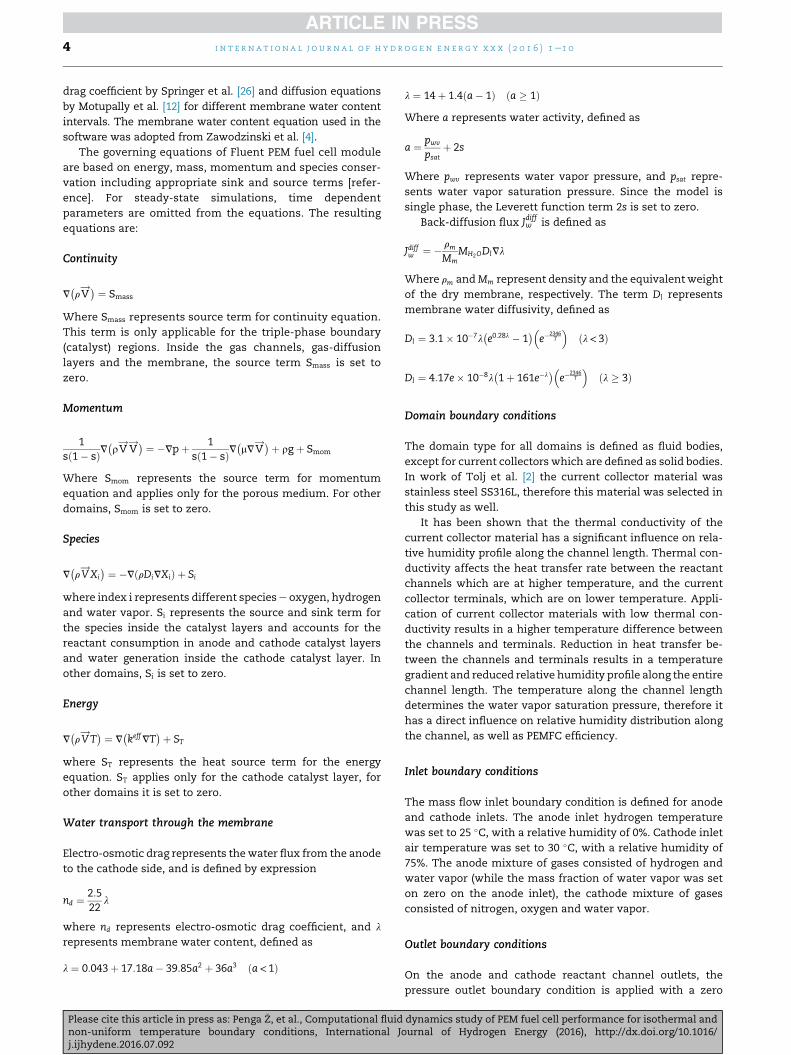
tential for each calculation on the cathode terminals. In Fig. 3,
it can be seen that CFD prediction of polarization curve for
isothermal case for a 50 mmmembrane is very good. At higher
current densities it can be seen that CFD slightly under-
predicts current density when comparing to the experi-
mental results for both temperature fields.
The reason for this is that at higher current densities, more
heat is released during the electrochemical reaction inside the
cathodecatalyst layer.Thisresults inahigher temperaturealong
the reactant channels than that defined on the current collector
terminals. With an increase in temperature, for fixedmass flow
and ambient pressure, the relative humidity is decreased,
resulting indecreasing of themembranewater content (l). Since
the membrane protonic conductivity is proportional to l,
decrease in relative humidity results in a decrease of protonic
conductivity of themembrane, i.e. higher ohmic losses.
The temperature difference between the channels and
current collector terminals is more pronounced in non-
uniform temperature field case, where fixed temperature of
terminals is overall lower (35�Ce59 �C) when compared to
isothermal case. Heat release inside the cathode catalyst layer
in non-uniform temperature field case has a higher relative
influence on PEMFC performance drop at higher current
densities e resulting in increased heat release, since higher
temperature results in lower relative humidity of the reactant
gases. This can be accounted for by slightly lowering terminal
temperature on higher current densities to get desired tem-
perature profile along the channels.
Additionally, for non-uniform temperature field there is a
difference between the temperatures of the anode and cath-
ode reactants along the entire channel length. This is due to
much higher mass flow of air, compared to hydrogen, result-
ing in slower heating of the cathode air. The cathode air tends
to heat up slower than the anode hydrogen, therefore the
temperature along the anode channel is higher. Since heat is
released inside the cathode catalyst layer, it would be ex-
pected that the cathode channel has higher temperature, but
not in this case.
Relative humidity distributionThe relative humidity distribution along the reactant chan-
nels directly influences PEMFC performance. In the work of
Fig. 3 e Polarization curve comparison.
Please cite this article in press as: Penga �Z, et al., Computational fluidnon-uniform temperature boundary conditions, International Jj.ijhydene.2016.07.092
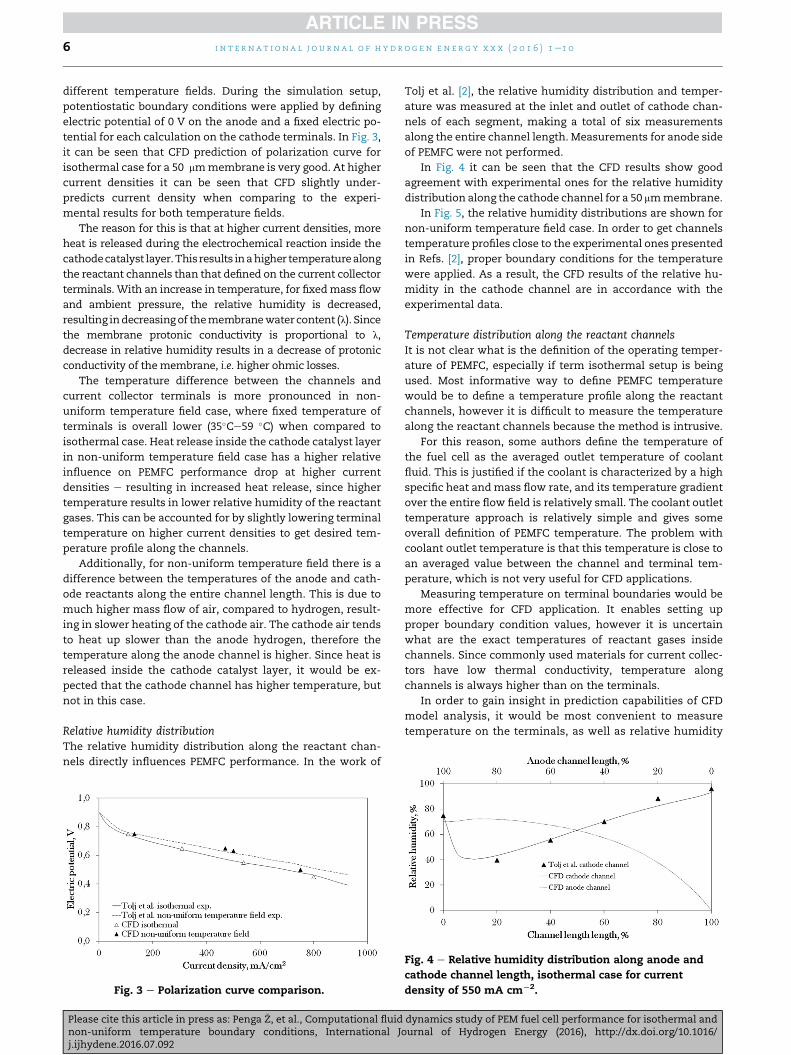
Tolj et al. [2], the relative humidity distribution and temper-
ature was measured at the inlet and outlet of cathode chan-
nels of each segment, making a total of six measurements
along the entire channel length. Measurements for anode side
of PEMFC were not performed.
In Fig. 4 it can be seen that the CFD results show good
agreement with experimental ones for the relative humidity
distribution along the cathode channel for a 50 mmmembrane.
In Fig. 5, the relative humidity distributions are shown for
non-uniform temperature field case. In order to get channels
temperature profiles close to the experimental ones presented
in Refs. [2], proper boundary conditions for the temperature
were applied. As a result, the CFD results of the relative hu-
midity in the cathode channel are in accordance with the
experimental data.
Temperature distribution along the reactant channelsIt is not clear what is the definition of the operating temper-
ature of PEMFC, especially if term isothermal setup is being
used. Most informative way to define PEMFC temperature
would be to define a temperature profile along the reactant
channels, however it is difficult to measure the temperature
along the reactant channels because the method is intrusive.
For this reason, some authors define the temperature of
the fuel cell as the averaged outlet temperature of coolant
fluid. This is justified if the coolant is characterized by a high
specific heat andmass flow rate, and its temperature gradient
over the entire flow field is relatively small. The coolant outlet
temperature approach is relatively simple and gives some
overall definition of PEMFC temperature. The problem with
coolant outlet temperature is that this temperature is close to
an averaged value between the channel and terminal tem-
perature, which is not very useful for CFD applications.
Measuring temperature on terminal boundaries would be
more effective for CFD application. It enables setting up
proper boundary condition values, however it is uncertain
what are the exact temperatures of reactant gases inside
channels. Since commonly used materials for current collec-
tors have low thermal conductivity, temperature along
channels is always higher than on the terminals.
In order to gain insight in prediction capabilities of CFD
model analysis, it would be most convenient to measure
temperature on the terminals, as well as relative humidity
Fig. 4 e Relative humidity distribution along anode and
cathode channel length, isothermal case for current
density of 550 mA cm¡2.
dynamics study of PEM fuel cell performance for isothermal andournal of Hydrogen Energy (2016), http://dx.doi.org/10.1016/
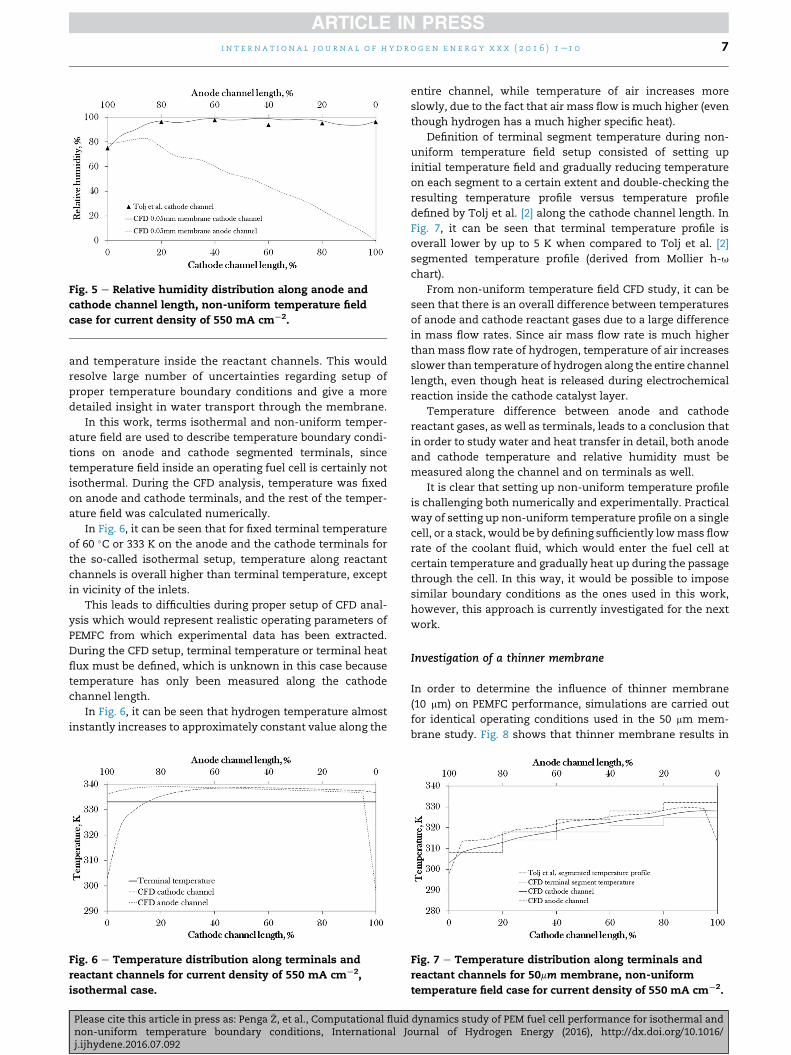
Fig. 5 e Relative humidity distribution along anode and
cathode channel length, non-uniform temperature field
case for current density of 550 mA cm¡2.
i n t e r n a t i o n a l j o u r n a l o f h yd r o g e n e n e r g y x x x ( 2 0 1 6 ) 1e1 0 7
and temperature inside the reactant channels. This would
resolve large number of uncertainties regarding setup of
proper temperature boundary conditions and give a more
detailed insight in water transport through the membrane.
In this work, terms isothermal and non-uniform temper-
ature field are used to describe temperature boundary condi-
tions on anode and cathode segmented terminals, since
temperature field inside an operating fuel cell is certainly not
isothermal. During the CFD analysis, temperature was fixed
on anode and cathode terminals, and the rest of the temper-
ature field was calculated numerically.
In Fig. 6, it can be seen that for fixed terminal temperature
of 60 �C or 333 K on the anode and the cathode terminals for
the so-called isothermal setup, temperature along reactant
channels is overall higher than terminal temperature, except
in vicinity of the inlets.
This leads to difficulties during proper setup of CFD anal-
ysis which would represent realistic operating parameters of
PEMFC from which experimental data has been extracted.
During the CFD setup, terminal temperature or terminal heat
flux must be defined, which is unknown in this case because
temperature has only been measured along the cathode
channel length.
In Fig. 6, it can be seen that hydrogen temperature almost
instantly increases to approximately constant value along the
Fig. 6 e Temperature distribution along terminals and
reactant channels for current density of 550 mA cm¡2,
isothermal case.
Please cite this article in press as: Penga �Z, et al., Computational fluidnon-uniform temperature boundary conditions, International Jj.ijhydene.2016.07.092
entire channel, while temperature of air increases more
slowly, due to the fact that air mass flow is much higher (even
though hydrogen has a much higher specific heat).
Definition of terminal segment temperature during non-
uniform temperature field setup consisted of setting up
initial temperature field and gradually reducing temperature
on each segment to a certain extent and double-checking the
resulting temperature profile versus temperature profile
defined by Tolj et al. [2] along the cathode channel length. In
Fig. 7, it can be seen that terminal temperature profile is
overall lower by up to 5 K when compared to Tolj et al. [2]
segmented temperature profile (derived from Mollier h-u
chart).
From non-uniform temperature field CFD study, it can be
seen that there is an overall difference between temperatures
of anode and cathode reactant gases due to a large difference
in mass flow rates. Since air mass flow rate is much higher
than mass flow rate of hydrogen, temperature of air increases
slower than temperature of hydrogen along the entire channel
length, even though heat is released during electrochemical
reaction inside the cathode catalyst layer.
Temperature difference between anode and cathode
reactant gases, as well as terminals, leads to a conclusion that
in order to study water and heat transfer in detail, both anode
and cathode temperature and relative humidity must be
measured along the channel and on terminals as well.
It is clear that setting up non-uniform temperature profile
is challenging both numerically and experimentally. Practical
way of setting up non-uniform temperature profile on a single
cell, or a stack, would be by defining sufficiently lowmass flow
rate of the coolant fluid, which would enter the fuel cell at
certain temperature and gradually heat up during the passage
through the cell. In this way, it would be possible to impose
similar boundary conditions as the ones used in this work,
however, this approach is currently investigated for the next
work.
Investigation of a thinner membrane
In order to determine the influence of thinner membrane
(10 mm) on PEMFC performance, simulations are carried out
for identical operating conditions used in the 50 mm mem-
brane study. Fig. 8 shows that thinner membrane results in
Fig. 7 e Temperature distribution along terminals and
reactant channels for 50mm membrane, non-uniform
temperature field case for current density of 550 mA cm¡2.
dynamics study of PEM fuel cell performance for isothermal andournal of Hydrogen Energy (2016), http://dx.doi.org/10.1016/
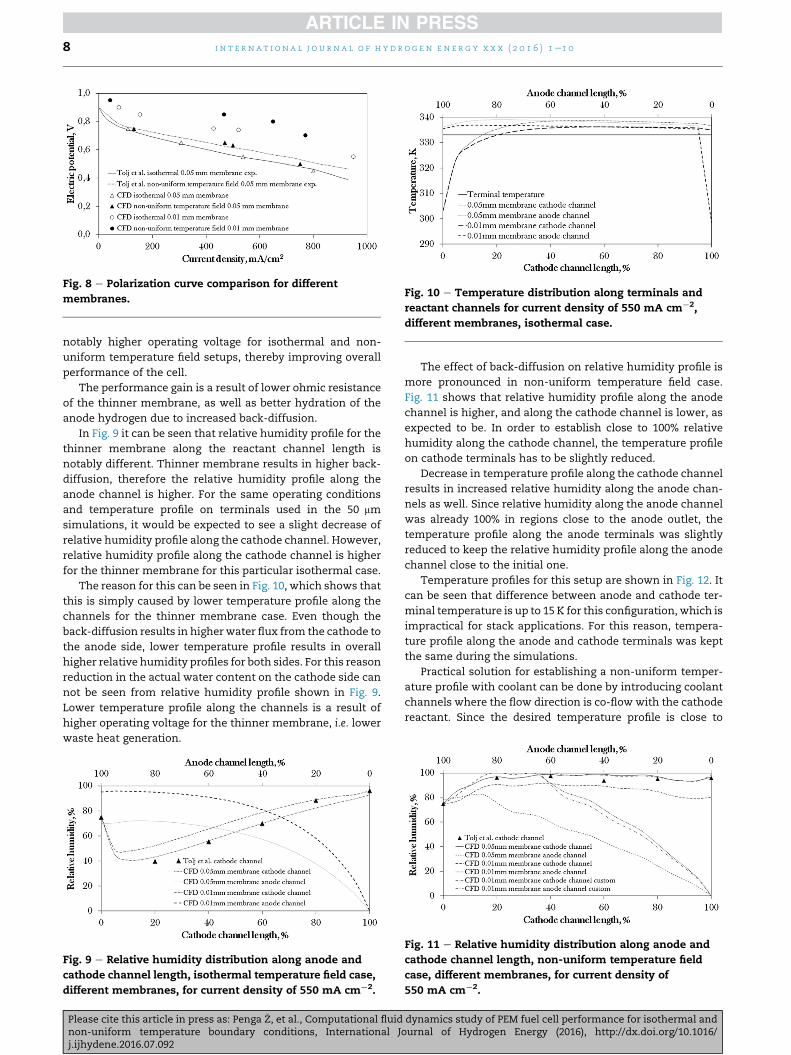
Fig. 8 e Polarization curve comparison for different
membranes.Fig. 10 e Temperature distribution along terminals and
reactant channels for current density of 550 mA cm¡2,
different membranes, isothermal case.
i n t e r n a t i o n a l j o u r n a l o f h y d r o g e n en e r g y x x x ( 2 0 1 6 ) 1e1 08
notably higher operating voltage for isothermal and non-
uniform temperature field setups, thereby improving overall
performance of the cell.
The performance gain is a result of lower ohmic resistance
of the thinner membrane, as well as better hydration of the
anode hydrogen due to increased back-diffusion.
In Fig. 9 it can be seen that relative humidity profile for the
thinner membrane along the reactant channel length is
notably different. Thinner membrane results in higher back-
diffusion, therefore the relative humidity profile along the
anode channel is higher. For the same operating conditions
and temperature profile on terminals used in the 50 mm
simulations, it would be expected to see a slight decrease of
relative humidity profile along the cathode channel. However,
relative humidity profile along the cathode channel is higher
for the thinner membrane for this particular isothermal case.
The reason for this can be seen in Fig. 10, which shows that
this is simply caused by lower temperature profile along the
channels for the thinner membrane case. Even though the
back-diffusion results in higherwater flux from the cathode to
the anode side, lower temperature profile results in overall
higher relative humidity profiles for both sides. For this reason
reduction in the actual water content on the cathode side can
not be seen from relative humidity profile shown in Fig. 9.
Lower temperature profile along the channels is a result of
higher operating voltage for the thinner membrane, i.e. lower
waste heat generation.
Fig. 9 e Relative humidity distribution along anode and
cathode channel length, isothermal temperature field case,
different membranes, for current density of 550 mA cm¡2.
Please cite this article in press as: Penga �Z, et al., Computational fluidnon-uniform temperature boundary conditions, International Jj.ijhydene.2016.07.092
The effect of back-diffusion on relative humidity profile is
more pronounced in non-uniform temperature field case.
Fig. 11 shows that relative humidity profile along the anode
channel is higher, and along the cathode channel is lower, as
expected to be. In order to establish close to 100% relative
humidity along the cathode channel, the temperature profile
on cathode terminals has to be slightly reduced.
Decrease in temperature profile along the cathode channel
results in increased relative humidity along the anode chan-
nels as well. Since relative humidity along the anode channel
was already 100% in regions close to the anode outlet, the
temperature profile along the anode terminals was slightly
reduced to keep the relative humidity profile along the anode
channel close to the initial one.
Temperature profiles for this setup are shown in Fig. 12. It
can be seen that difference between anode and cathode ter-
minal temperature is up to 15 K for this configuration, which is
impractical for stack applications. For this reason, tempera-
ture profile along the anode and cathode terminals was kept
the same during the simulations.
Practical solution for establishing a non-uniform temper-
ature profile with coolant can be done by introducing coolant
channels where the flow direction is co-flow with the cathode
reactant. Since the desired temperature profile is close to
Fig. 11 e Relative humidity distribution along anode and
cathode channel length, non-uniform temperature field
case, different membranes, for current density of
550 mA cm¡2.
dynamics study of PEM fuel cell performance for isothermal andournal of Hydrogen Energy (2016), http://dx.doi.org/10.1016/

Fig. 12 e Temperature distribution along terminals and
reactant channels for 10 mm membrane, non-uniform
temperature field case for current density of 550 mA=cm2.
i n t e r n a t i o n a l j o u r n a l o f h yd r o g e n e n e r g y x x x ( 2 0 1 6 ) 1e1 0 9
linear, it can be achieved with constant mass flow rate of the
coolant, where the slope of the temperature profile, i.e. tem-
perature gradient can be controlled by altering the mass flow
rate of the coolant. This approach could be used in stack
configurations as well, where different temperature profiles
can be established depending on operating conditions,
without the need for external humidification.
Conclusions
The CFD model shows good agreement with experimental
results fromTolj et al. [2] and outlines details which need to be
studied experimentally. The temperature distribution inside
an operating fuel cell is of critical importance when partially
humidified/dry reactants are considered, and needs to be
experimentally studied in more detail.
It is shown that the temperature inside an operating fuel
cell is highly non-uniform, and the temperature inside the
reactant channels is in overall higher than that of the current
collector terminals. In order to have a robust CFD model with
good prediction capacity for various operating parameters, the
temperature must be measured during experiments in more
points, and can not be simply defined as one operating
parameter. The temperature difference between the reactant
channels and terminals increases with the current density,
and CFD model must be calibrated to account for this tem-
perature difference at all times.
Non-uniform temperature field study has shown that there
is an additional difference between the temperature of re-
actants along the anode and cathode channels, due to signif-
icantly higher air mass flow of in the cathode channels. This
results in a lower temperature profile along the cathode
channel compared to that of the anode channel, even though
that heat is being generated inside the cathode catalyst layer.
This further complicates proper temperature field setup on
terminals, since experimental data for temperature was
available only along the cathode channel length.
It is demonstrated that the membrane thickness also in-
fluences the temperature inside reactant channels, dictating
the relative humidity distributions and the PEMFC efficiency.
Using thinner membrane is beneficial for fuel cell operation
Please cite this article in press as: Penga �Z, et al., Computational fluidnon-uniform temperature boundary conditions, International Jj.ijhydene.2016.07.092
without an external humidification, as it results in better hy-
dration of the anode side due to the increased back-diffusion
and lower temperature along the channels (lower ohmic los-
ses of the membrane).
Further studies will includemeasurement of water and tem-
peraturedistributionalongtheanodechannelusingasegmented
fuel cell. The experimental setup will also be used to verify the
results obtained numerically for a thinner (10 mm) membrane.
The performance at various current densities, including the
transients during the load changes, will also be studied.
Acknowledgments
The research leading to these results has received funding
from the Croatian Science Foundation project IP-11-2013-8700
“Water and Heat Management and Durability of PEM Fuel
Cells”. �Z. Penga also acknowledges support he has received
from EU FP7 Programme through Fuel Cells and Hydrogen
Joint Undertaking under grant agreement no 325275 (Project
SAPPHIRE).
Nomenclature
a water activity
CFD Computational fluid dynamics
Di gas diffusion coefficient
Dl membrane water diffusivity
g gravitational acceleration, ms�2
h enthalphy, J
Jdiffw back diffusion flux, kg m�3 s�1
keff thermal conductivity, Wm�1 K�1
Mm equivalent weight of the dry membrane, g mol�1
MH2O molar mass of water, g mol�1
nd electro-osmotic drag coefficient
p pressure, Nm�2
PEMFC proton exchange membrane fuel cell
psat water vapor saturation pressure, Nm�2
pwv partial pressure of water vapor, Nm�2
s liquid water saturation
Si source term for species, kg m�3s�1
Smass source term for continuity equation, kg m�3s�1
Smom source term for momentum equation, kg m�3s�1
ST source term for energy equation, kg m�3s�1
SS stainless steel
T temperature, K
V!
velocity vector
Xi species mass fraction
Greek symbols
l membrane water content
m dynamic viscosity, kg m�1s�1
r density, kg m�3
rm dry membrane density, kg m�3
u absolute humidity, kgH2Okg�1air
dynamics study of PEM fuel cell performance for isothermal andournal of Hydrogen Energy (2016), http://dx.doi.org/10.1016/

i n t e r n a t i o n a l j o u r n a l o f h y d r o g e n en e r g y x x x ( 2 0 1 6 ) 1e1 010
r e f e r e n c e s
[1] Yousfi-Steiner N, Mocoteguy Ph, Candusso D, Hissel D,Hernandez A, Aslaindes A. A review on PEM degradationassociated with water management: impacts, influentfactors and characterization. J Power Sources2008;183:260e74.
[2] Tolj I, Bezmalinovic D, Barbir F. Maintaining desired level ofrelative humidity throughout a fuel cell with spatiallyvariable heat removal rates. J Hydrogen Energy2011;36:13105e13.
[3] Konno N, Mizuno S, Nakaji H, Ishikawa Y. Development ofCompact and high-performance fuel cell stack. SAE Int. J AltPower 2015;4(1):123e9.
[4] Zawodzinski TA, Derouin C, Radzinski S, Sherman RJ,Smith VT, Springer TE, et al. Water uptake by and transportthrough Nafion 117 membranes. J Electrochem Soc1993;140:1041e7.
[5] Hinatsu JT, Mizuhata M, Takenaka H. Water uptake ofperfluorosulfonic acid membranes from liquid water andwater vapor. J Electrochem Soc 1994;141:1493e8.
[6] LaConti AB, Fragala AR, Boyack JR. Electrode materials andprocesses for energy conversion and storage. ElectrochemSoc Proc Ser Princet 1997;77(6):354.
[7] Zawodzinski TA, Springer TE, Davey J, Jestel R, Lopez C,Valerio J, et al. A comparative-study of water-uptake by andtransport through ionomeric fuel-cell membranes. JElectrochem Soc 1993;140(7):1981e5.
[8] Pivovar BS, Smyrl WH, Cussler EL. Nafion, Polystyrenesulfonic acid and polybenzimidazole as direct methanol fuelcell electrolytes. J Electrochem Soc 2005;152:A53e60.
[9] Xie G, Okada T. Water transport behavior in Nafion 117membranes. J Electrochem Soc 1995;142(9):3057e62.
[10] Ren X, Henderson W, Gottesfeld S. Electro-osmotic drag ofwater in ionomeric membranes. J Electrochem Soc1997;144:267e70.
[11] Ise M, Kreuer KD, Maier J. Aspects of the formation andmobility of protonic charge carriers and the stability ofperovskite-type oxides. Solid State Ionics1999;125(1):285e302.
[12] Motupally S, Becker AJ, Weidner JW. Diffusion of waterthrough Nafion 115 membranes. J Electrochem Soc2000;147:3171e7.
[13] Fuller TF, Newman J. Experimental determination of thetransport number of water in Nafion 117 membrane. JElectrochem Soc 1992;139:1332e7.
[14] Zawodzinski TA, Davey J, Valerio J, Gottesfeld S. The watercontent dependence of electro-osmotic drag in proton-conducting polymer electrolytes. Electrochim Acta1995;40(3):297e302.
[15] Weng D, Wainright JS, Landau U, Savinell RF. Electro-osmoticdrag coefficient of water and methanol in polymerelectrolytes at elevated temperatures. J Electrochem Soc1996;143(4):1260e3.
[16] Ye X, Wang CY. Measurement of water transport propertiesthrough membrane-electrode assemblies. J Electrochem Soc2007;154(7):B676e82.
[17] Jinnouchi R, Yamada H, Morimoto Y. Measurement ofelectro-osmotic drag coefficient of Nafion using aconcentration cell. 14th International Conference on theProperties of Steam in Kyoto 2004;32:403e406.
[18] Zelsmann HR, Pineri M, Thomas M, Escoubes M. Water self-diffusion coefficient determination in an ion exchangemembrane by optical measurement. J Appl Polym Sci1990;41(7e8):1673e84.
[19] Gong X, Bandis A, Tao A, Meresi G, Wang Y, Inglefield PT,et al. Self-diffusion of water, ethanol and decafluoropentane
Please cite this article in press as: Penga �Z, et al., Computational fluidnon-uniform temperature boundary conditions, International Jj.ijhydene.2016.07.092
in perfluorosulfonate ionomer by pulse field gradient NMR.Polymer 2001;42:6485e92.
[20] Morris DR, Sun XD. Water sorption and transport propertiesof Nafion 117. J Appl Polym Sci 1993;50:1445e52.
[21] Yeo SC, Eisenberg A. Physical properties and supermolecularstructure of perfluorinated ion-containing (Nafion) polymers.J Appl Polym Sci 1997;21(4):875e98.
[22] Rivin D, Kendrick CE, Gibson PW, Schneider NS. Solubilityand transport behavior of water and alcohols in Nafion.Polymer 2001;42(2):623e35.
[23] Ye X, LeVan MD. Water transport properties of Nafionmembranes. J Membr Sci 2003;221(1):163e73.
[24] Olesen AC, Berning T, Kaer SK. On the diffusion coefficient ofwater in polymer electrolyte membranes. ECS Trans2012;50(2):979e91.
[25] Husar A, Higier A, Liu H. In situ measurement of watertransfer due to different mechanisms in a proton exchangemembrane fuel cell. J Power Sources 2008;183(1):240e6.
[26] Springer TE, Zawodzinski TA, Gottesfeld S. Polymerelectrolyte fuel cell model. J Electrochem Soc1991;138(8):2334e41.
[27] Zhao Q, Majsztrik P, Benziger J. Diffusion and interfacialtransport of water in Nafion. J Phys Chem 2011;115:2717e27.
[28] Nguyen TV, White RE. A water and heat management modelfor proton-exchange-membrane fuel cells. J Electrochem Soc1993;140(8):2178e86.
[29] Vishnyakov A, Ravikovich PI, Neimark AV. Characterizationof micro-and mesoporosity in SBA-15 materials fromadsorption data by the NLDFT method. J Phys Chem2001;B105(29):6817e23.
[30] Breitwieser M, Moroni R, Schock J, Schulz M, Schilinger B,Pfeifer F, et al. Water management in novel direct membranedeposition fuel cells under low humidification. J HydrogenEnergy 2016;41:11412e7.
[31] Kim BJ, Kim MS. Studies on the cathode humidification byexhaust gas recirculation for PEM fuel cell. J Hydrogen Energy2012;37:4290e9.
[32] Su H, Xu L, Zhu H, Wu H, Wu Y, Yang L, et al. Self-humidification of a PEM fuel cell using a novel Pt/SiO2/Canode catalyst. J Hydrogen Energy 2010;35:7874e80.
[33] Staschewski D, Mao ZQ. Hydrogen-air PEMFC operation withextraordinarily low gas pressures and internalhumidification e concept and experimental prototype stack.J Hydrogen Energy 1999;24:543e8.
[34] Hou S, Liao S, Dang D, Zou H, Shu T, Du L. Self-humidifyingmembrane electrode assembly prepared by addingmicrocrystalline cellulose in anode catalyst layer as preservemoisture. J Hydrogen Energy 2014;39:12842e8.
[35] Lee SH, Choi SH, Gopalan SA, Lee KP, Gopalan AI. Preparationof new self-humidifying composite membrane byincorporating graphene and phosphotungstic acid intosulfonated poly(ether ether ketone) film. J Hydrogen Energy2014;39:17162e77.
[36] McKahn D. Influence of gas channel depth in self-humidifiedminiature PEM fuel cells with dead-ended anode. J HydrogenEnergy 2015;40:7168e81.
[37] Arvay A. Proton exchange membrane fuel cell modeling andsimulation using ANSYS Fluent. Arizona State University;2011 [Master Thesis].
[38] ANSYS Inc. ANSYS fluent 12.0 fuel cells module manual.ANSYS, Inc; 2009.
[39] Ozden E, Tolj I, Barbir F. Designing heat exchanger withspatially variable surface area for passive cooling of PEM fuelcell. Appl Therm Eng 2013;51(1e2):1339e44.
[40] Barbir F. PEM fuel cells, 2nd edition: theory and practice.Academic Press; 2012.
dynamics study of PEM fuel cell performance for isothermal andournal of Hydrogen Energy (2016), http://dx.doi.org/10.1016/
Recommended