Peanuts and Rice2014 Farm Bill Education Conference
Kansas City Airport Hilton HotelKansas City, MissouriSeptember 3-4, 2014
Nathan Smith, PhDExtension Economist
Agricultural and Applied Economics

Commodity Programs and Peanuts• The Peanut Program had it’s own subtitle before
2002. A supply control program commonly referred to the Peanut Quota Program was in place going as far back as the 1942.
• Peanuts became a covered commodity in the 2002 Farm Bill when the quota program was repealed.
• Peanut is included in the commodities programs of the 2014 Farm Bill.

Marketing Assistance Loan• Loan Program w/ LDP and MLG remains essentially
the same: • No Sequestration applied to MAL.• Peanut Storage, Handling and Associated Cost
– No change from 2008 Farm Bill
2008 2014Peanut $355/ton $355/tonRiceLong Grain $6.50/cwt $6.50/cwt
Medium Grain $6.50/cwt $6.50/cwt

Payment Limits
• Payment limit per person or legal entity $125,000 for PLC, ARC, and MLG/LDP
• Loan forfeitures do not apply to MLG
• Spousal rule applies doubling to $250,000
• Equal and separate limit for peanuts
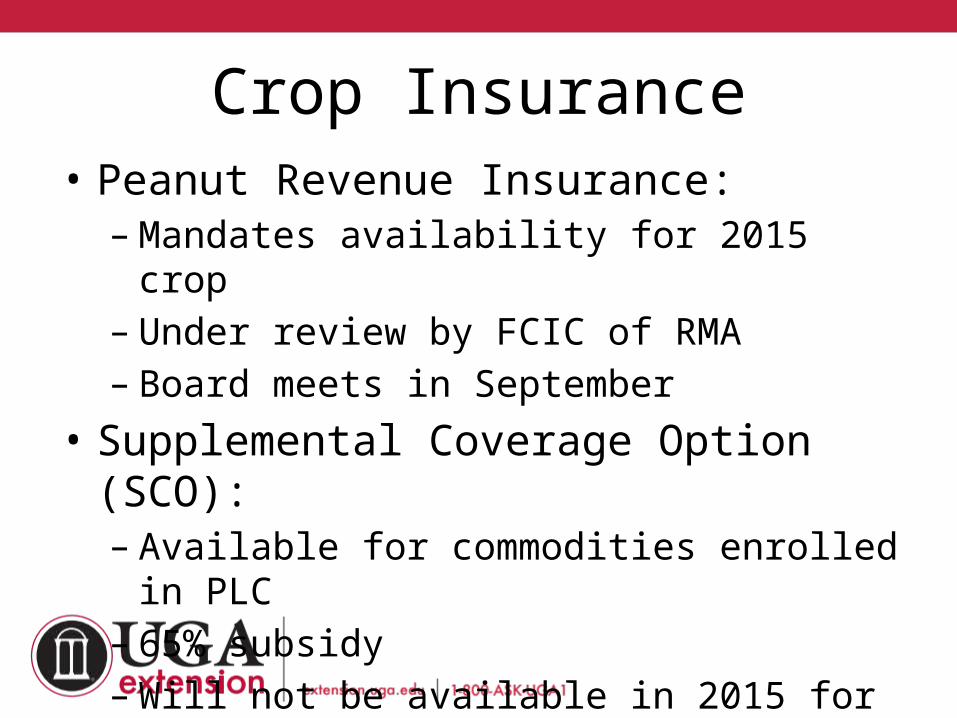
Crop Insurance• Peanut Revenue Insurance:
– Mandates availability for 2015 crop– Under review by FCIC of RMA– Board meets in September
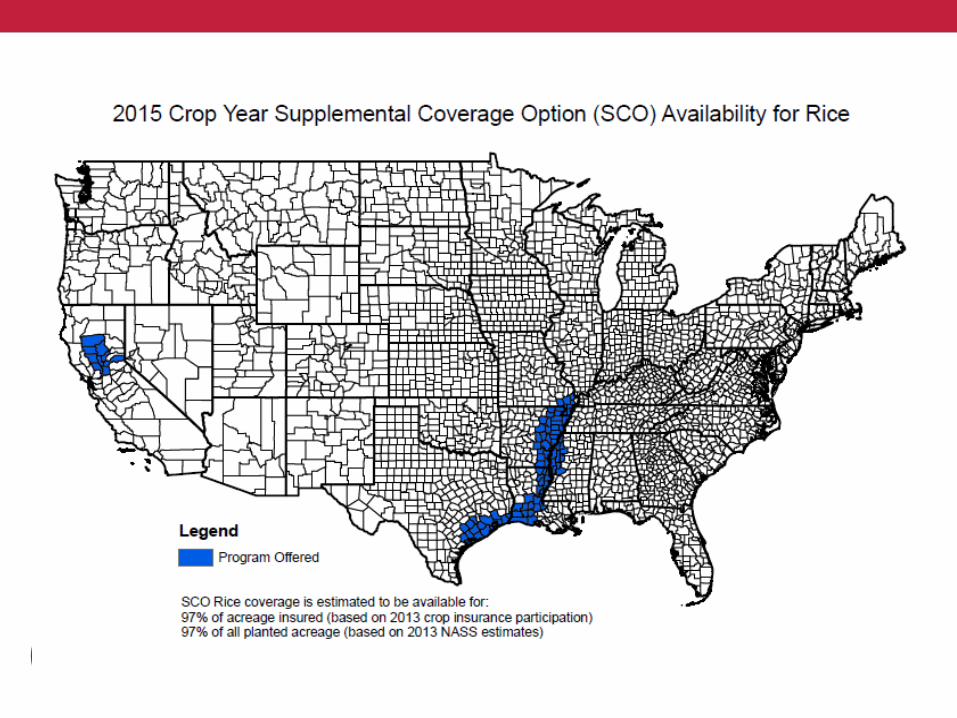
• Supplemental Coverage Option (SCO):– Available for commodities enrolled in PLC– 65% subsidy– Will not be available in 2015 for Peanuts

What Are the Main Decisions for Peanuts and Rice?
1. Covered Commodity Bases: Retain or Reallocate
2. Payment Yield (for PLC): Retain or Update
3. PLC vs ARC-C vs ARC-I (Known as Producer Election)
4. SCO crop insurance (if PLC is chosen)

Base Reallocation Example
100Cotton
50Peanuts
20Corn
20None
10 Wheat
= 200 acres total100 acres cotton/generic base 80 acres other bases
Corn Peanuts Soybeans Wheat2009 0 100 0 02010 90 0 0 02011 170 0 0 02012 0 160 0 0
Average 65 65 0 0
2009-2012 Acres Planted to Covered Commodities
130 Acres Planted (> available bases)
80/130 x 65 = 40 acres allocated to corn80/130 x 65 = 40 acres allocated to peanuts
100Generic
40Peanuts
40Corn
20None
Reallocated Bases Would Be 40Corn
50% 50%
Original Example Courtesy of Dr. Stanley Fletcher, UGA
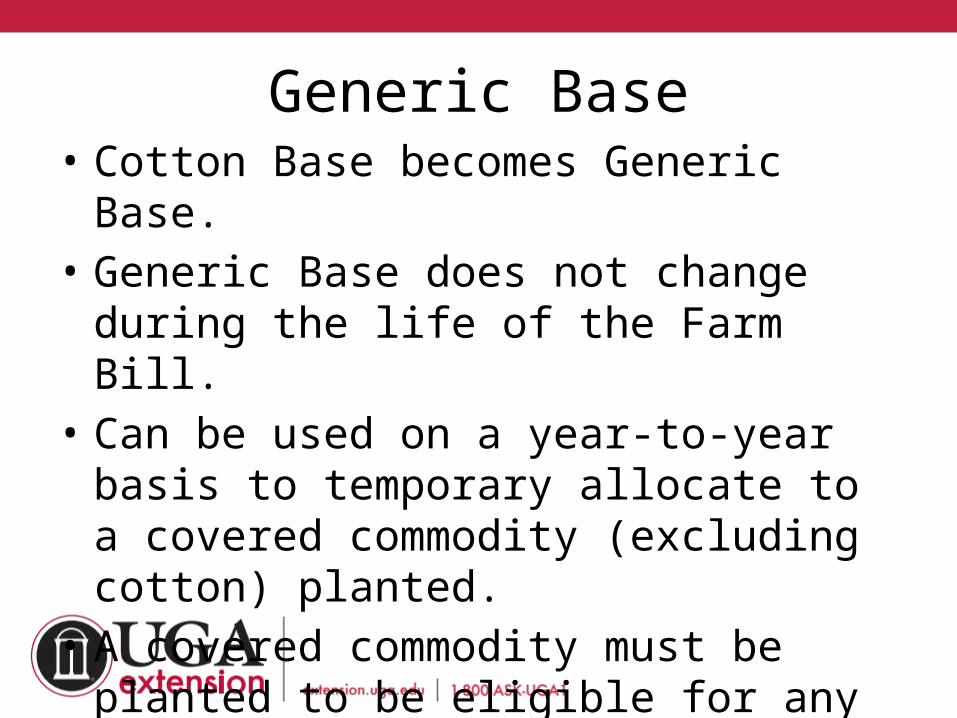
Generic Base• Cotton Base becomes Generic Base.• Generic Base does not change during the life
of the Farm Bill.• Can be used on a year-to-year basis to
temporary allocate to a covered commodity (excluding cotton) planted.
• A covered commodity must be planted to be eligible for any generic base allocation.

Generic Base ExampleUse Previous Reallocated Base Farm Example
In 2014, assume the producer plants: 65 peanut acres 65 corn acres 70 cotton acres200 acres total
130 acres covered commodities > 100 Generic base acres
100Generic
40Peanuts
40Corn
20None = 200 acres
65/130 x 100 = 50 acres assigned to peanuts65/130 x 100 = 50 acres assigned to corn
(40 base + 50 generic) = 90 total peanut base acres(40 base + 50 generic) = 90 total corn base acres
Can have more total base than planted in a year because Crop Base (non-generic) does not have to be planted.
50Peanuts
50Corn

Opportunity to Update Yields• PLC Payment Yield (assumed to be the CCP Yield)• Landowner has 1-time option to update yields on a crop-by-
crop, farm by farm basis.• May retain current yield or update.• 90% of the 2008-2012 average yield per planted acre.
Peanut Example Production Acres Planted Yield Per Acre
2008 760,000 200 3,8002009 410,000 100 4,1002010 500,000 125 4,0002011 352,500 75 4,7002012 1,120,000 224 5,000
5-Yr Average Yield 4,320 90% of Average Yield 3,888

Opportunity to Update Yields
• What if did not plant covered commodity every year?
• Exclude any crop year acreage planted was zero.
Peanut Example Production Acres Planted Yield Per Acre
2008 760,000 200 3,8002009 410,000 100 4,1002010 500,000 125 4,0002011 0 0 -2012 1,120,000 224 5,000
Average Yield 4,225 90% of Average Yield 3,803
Peanut Example Production Acres Planted Yield Per Acre
2008 0 0 -2009 410,000 100 4,1002010 0 0 -2011 0 0 -2012 1,120,000 224 5,000
Average Yield 4,550 90% of Average Yield 4,095

PLC vs ARC-C vs ARC-I
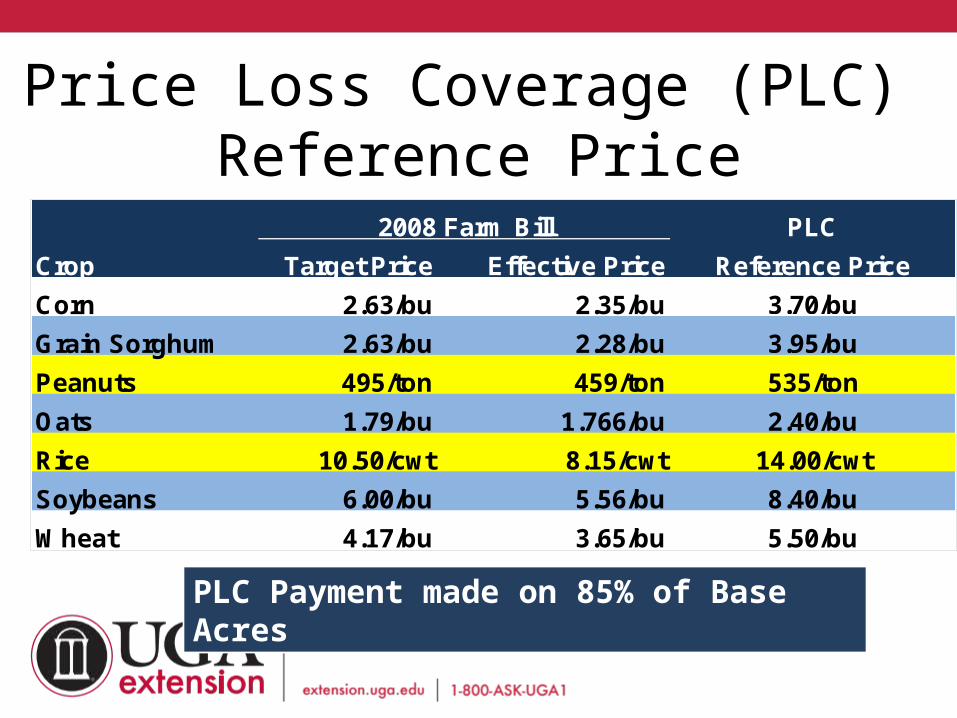
Crop Target Price Effective Price
Corn 2.63/bu 2.35/bu
Grain Sorghum 2.63/bu 2.28/bu
Peanuts 495/ton 459/ton
Oats 1.79/bu 1.766/bu
Rice 10.50/cwt 8.15/cwt
Soybeans 6.00/bu 5.56/bu
Wheat 4.17/bu 3.65/bu
8.40/bu
5.50/bu
PLC
Reference Price
2008 Farm Bill
3.70/bu
3.95/bu
535/ton
2.40/bu
14.00/cwt
Price Loss Coverage (PLC) Reference Price
PLC Payment made on 85% of Base Acres
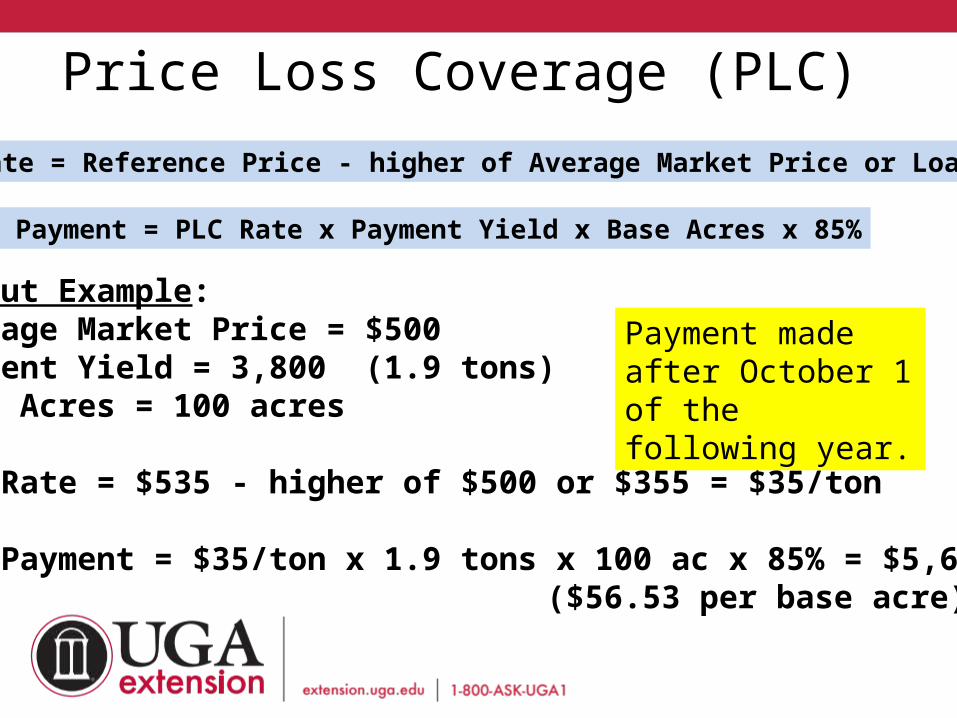
Price Loss Coverage (PLC)
PLC Rate = Reference Price - higher of Average Market Price or Loan Rate
PLC Payment = PLC Rate x Payment Yield x Base Acres x 85%
Peanut Example:Average Market Price = $500 Payment Yield = 3,800 (1.9 tons)Base Acres = 100 acres
PLC Rate = $535 - higher of $500 or $355 = $35/ton
PLC Payment = $35/ton x 1.9 tons x 100 ac x 85% = $5,652.60 ($56.53 per base acre)
Payment made after October 1 of the following year.

NASS Marketing Year Average Price for Peanuts
Year $/Lb $/Ton2013 0.249 498*2012 0.301 6022011 0.318 6362010 0.225 4502009 0.217 4342008 0.23 460
*August 28, 2014

Price Considerations for PLC
• $535 Reference Price applies to 85% of Base acres.• Payment Yield less than Expected/Actual Yield.• National Marketing Year Average Price higher than
contract/cash price for runners.• The more acres planted than base acreage, the lower
the average price per ton.• Payments not received until October 1 or later of the
next year. (i.e. Oct 2015 for 2014 crop).

Overplant/Low Price PLC Example• Georgia State Average Yield
2008-2012 = 3,365 lbs per acre (90%)2012-2013 = 4,505 lbs per acreDifference = 1,140 lbs per acre
• Overplant peanuts$535 - $355 = $180 per ton85% x $180 = $153 per ton
• $153 x 1.6825 tons (3,365 lbs) = $257.43 per base acre• $355 x 2.2525 tons (4,505 lbs) = $799.64 per base acre
• Total per base acre = $1057.07 or $469.29 per ton

ARC-County, Peanut Example5-Year OA County Yield 3,8705-Year OA Market Price $0.252 $504 per tonBenchmark County Revenue $975
86% of Benchmark Revenue $839 ARC Guarantee10% of Benchmark Revenue $98 Maximum ARC Payment
Actual County Yield 4505Higher of MYA Price or Loan Rate $0.1775 $355 per tonActual County Revenue $800
ARC Payment $39
Payment received on 85% of Base Acres,not before October 1 of the following year
• Not going to be an option in most cases for peanut and rice farms due to diverse crop mixes and likelihood of PLC payments.
ARC Individual Coverage
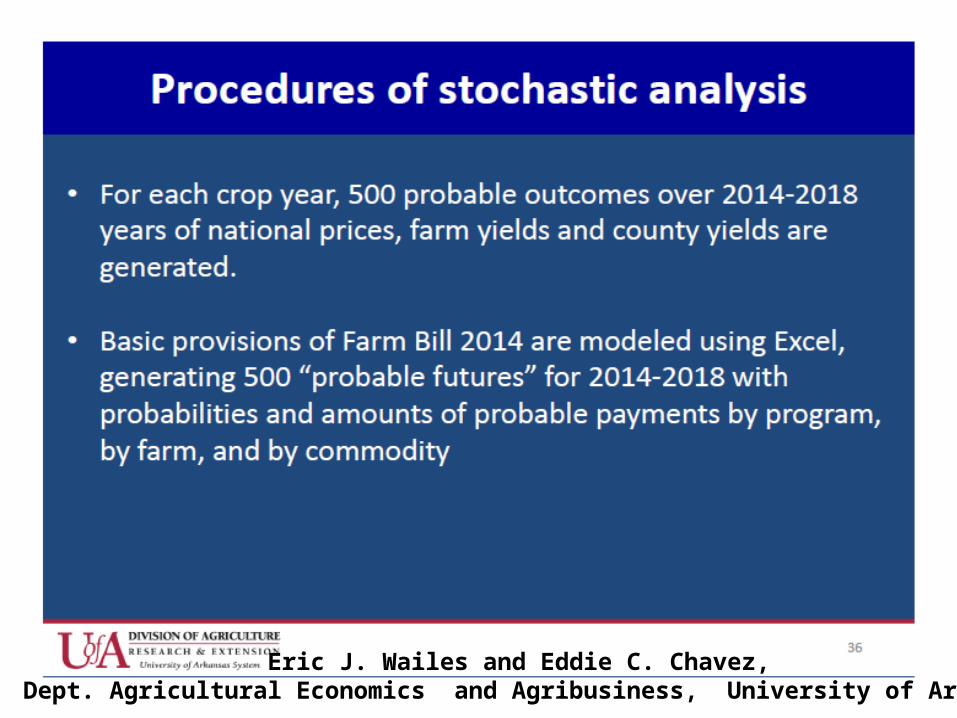
Stochastic Simulation Model of Program and Crop Insurance Decision – Peanut Farm Example
• Stochastic simulation model of net revenue developed by Todd D. Davis, University of Kentucky and John D. Anderson – American Farm Bureau Federation ®
• Irrigated & non-irrigated peanuts for a Worth County, Georgia farm.
• Simulate stochastic farm yield, county yield, crop insurance projected price and marketing-year average price for peanuts for a five-year farm bill.
• Yield and price distributions used to generate distributions of crop revenue, YP indemnities, ARC (C and I), PLC, and SCO payments.
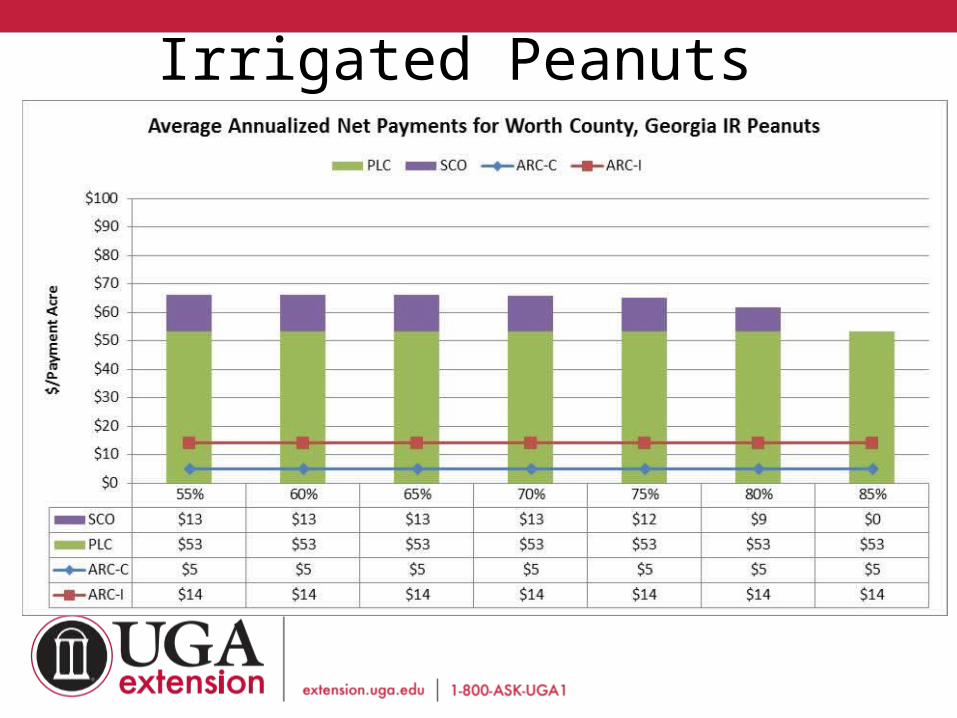
Irrigated Peanuts

Non-Irrigated Peanuts
24
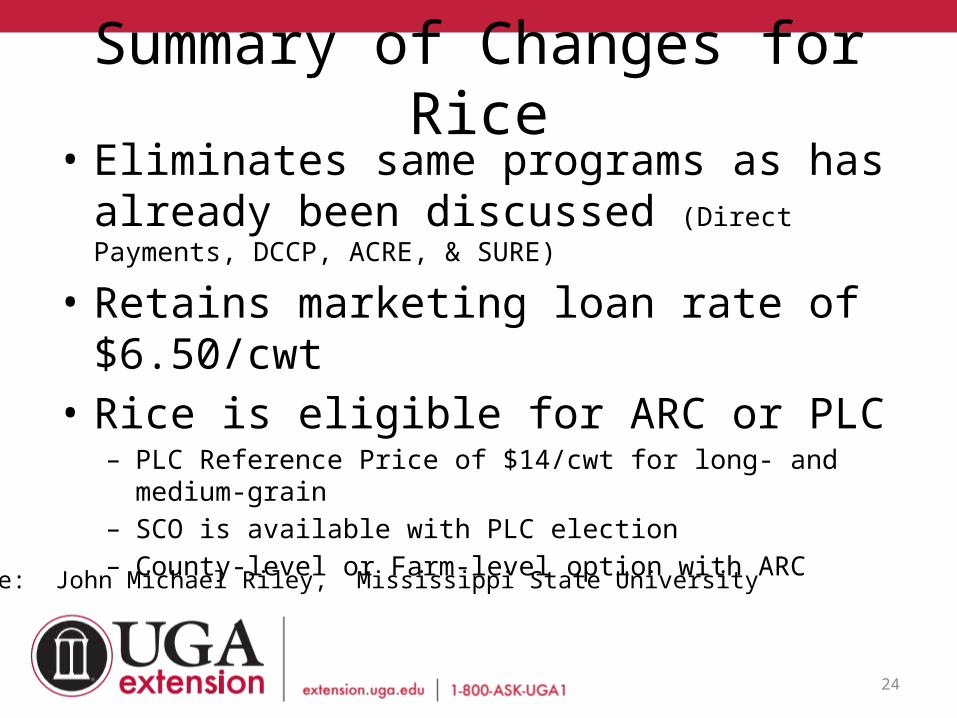
Summary of Changes for Rice• Eliminates same programs as has already been
discussed (Direct Payments, DCCP, ACRE, & SURE)
• Retains marketing loan rate of $6.50/cwt• Rice is eligible for ARC or PLC
– PLC Reference Price of $14/cwt for long- and medium-grain– SCO is available with PLC election– County-level or Farm-level option with ARC
Source: John Michael Riley, Mississippi State University
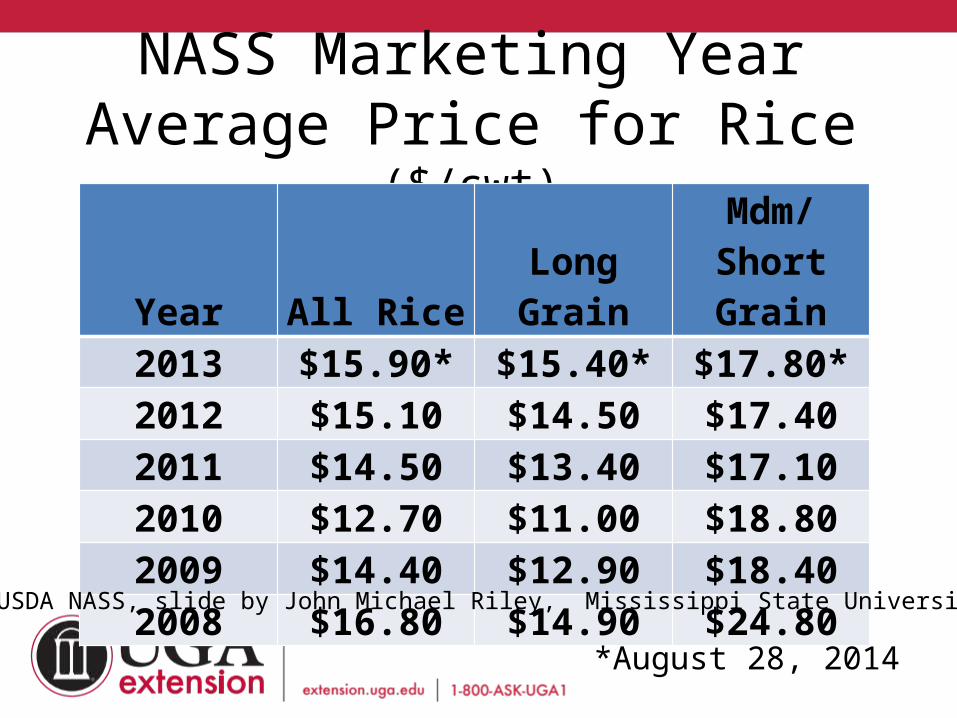
NASS Marketing Year Average Price for Rice ($/cwt)
Year All Rice Long GrainMdm/Short
Grain2013 $15.90* $15.40* $17.80*2012 $15.10 $14.50 $17.402011 $14.50 $13.40 $17.102010 $12.70 $11.00 $18.802009 $14.40 $12.90 $18.402008 $16.80 $14.90 $24.80
*August 28, 2014
Source: USDA NASS, slide by John Michael Riley, Mississippi State University

Rice Price Forecast (all rice, $/cwt)
YearUSDA
(Feb)FAPRI
(Aug)CME Group
(Sep 2)
2014 $15.30 $13.87 $12.51
2015 $15.60 $13.39 $13.025
2016 $15.70 $13.21 n/a
2017 $15.80 $13.17 n/a
2018 $15.90 $13.24 n/a
Source: USDA, FAPRI U. of Missouri, and CME, slide by John Michael Riley, Mississippi State University
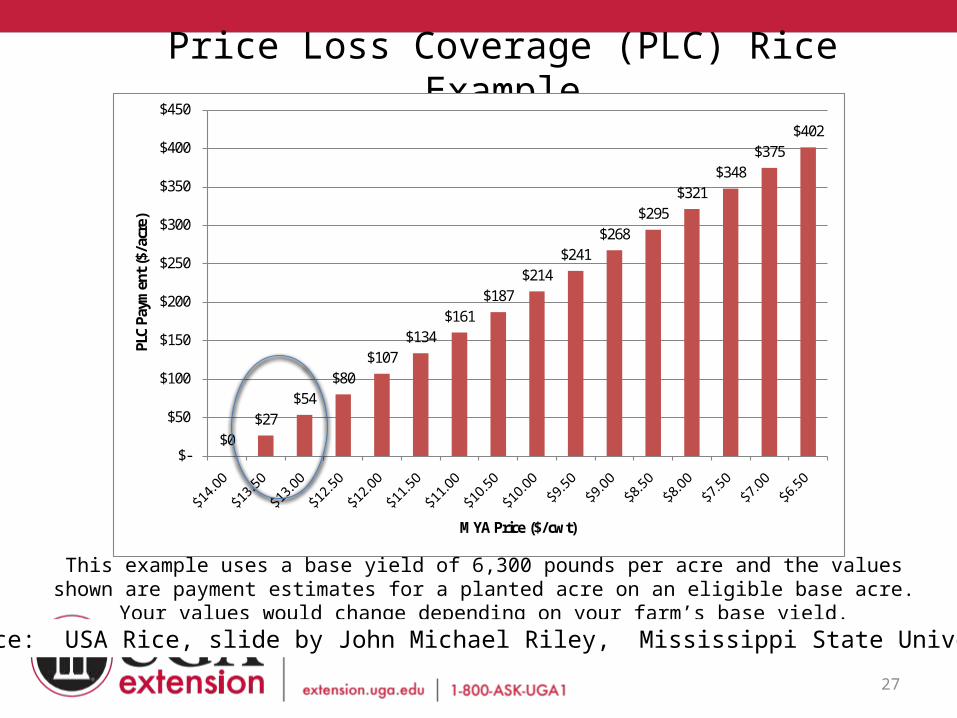
Price Loss Coverage (PLC) Rice Example
27
$0$27
$54$80
$107$134
$161$187
$214$241
$268$295
$321$348
$375$402
$-
$50
$100
$150
$200
$250
$300
$350
$400
$450
PLC
Paym
ent (
$/ac
re)
MYA Price ($/cwt)
This example uses a base yield of 6,300 pounds per acre and the values shown are payment estimates for a planted acre on an eligible base acre. Your values would change depending on your farm’s base yield.
Source: USA Rice, slide by John Michael Riley, Mississippi State University
28
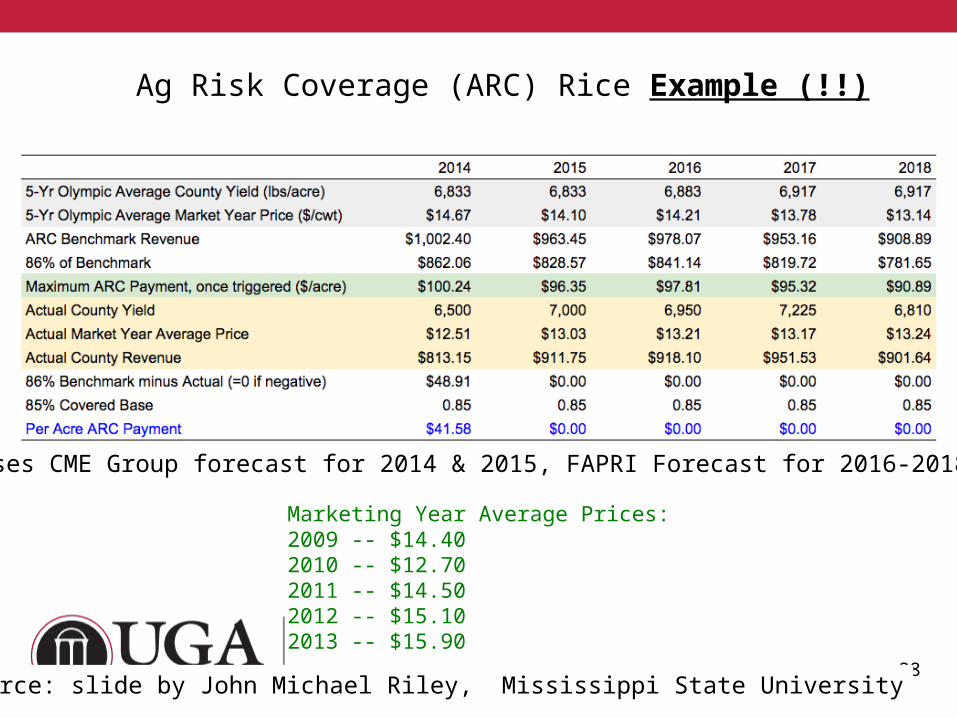
Ag Risk Coverage (ARC) Rice Example (!!)
Marketing Year Average Prices:2009 -- $14.402010 -- $12.702011 -- $14.502012 -- $15.102013 -- $15.90
Note: Uses CME Group forecast for 2014 & 2015, FAPRI Forecast for 2016-2018
Source: slide by John Michael Riley, Mississippi State University

Archie Flanders, University of Arkansas, Northeast Research and Extension Center, Keiser, AR

University of Arkansas Rice Examples• http://www.uaex.edu/farm-ranch/economics-marketing/farm-bill/

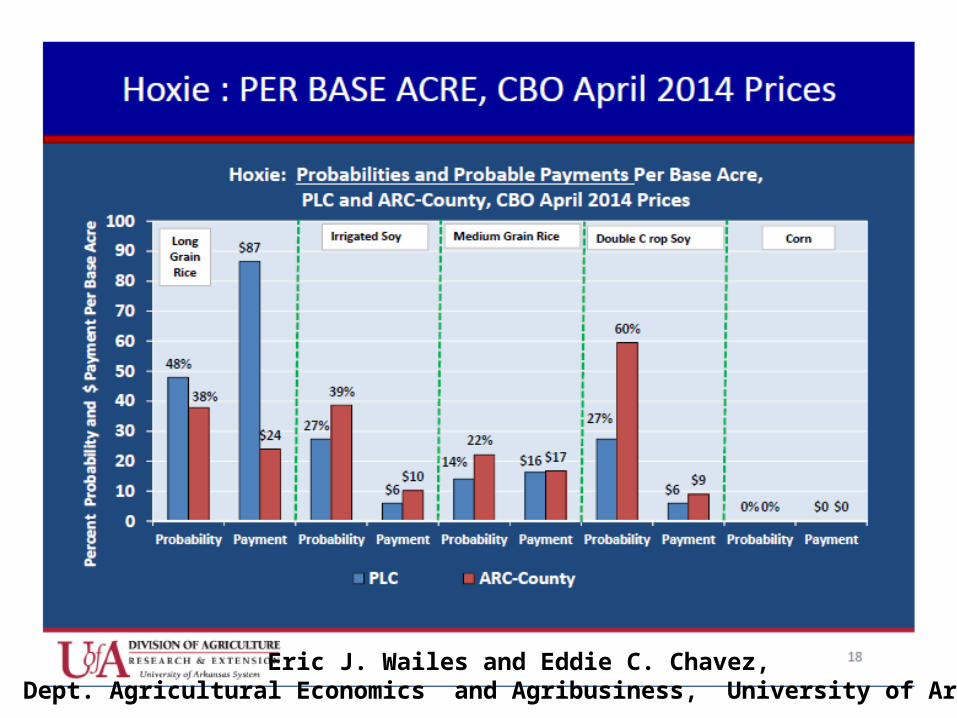
Farm Bill 2014 Overview and Introduction to Impacts on Example Arkansas Farms
Eric J. Wailes and Eddie C. Chavez, Dept. Agricultural Economics and Agribusiness, University of Arkansas
Eric J. Wailes and Eddie C. Chavez, Dept. Agricultural Economics and Agribusiness, University of Arkansas

Eric J. Wailes and Eddie C. Chavez, Dept. Agricultural Economics and Agribusiness, University of Arkansas
Eric J. Wailes and Eddie C. Chavez, Dept. Agricultural Economics and Agribusiness, University of Arkansas
Conclusions• Program decision for peanuts and rice will be pretty
straight forward for most cases. Other crops will be more complicated driven by price outlook and yields.
• Options for reallocating base and updating yield will vary on farm by farm, case by case basis because of dynamics of landowner and tenant relationships and planting shifts.
• Reallocation to more peanut and rice base in areas of increased acreage.
• Growers will be looking for help in making decisions that have long term impact (life of farm bill).

Peanut Implications• Shifts in peanut acreage have occurred since 2002. • Base acreage and planted acres don’t line up in some
states. • Peanuts are grown in rotation with cotton.• Growers will use Generic Base to manage
price/revenue risk in low price years. • Long run, the boom-bust cycle of planting peanuts
may moderate due to sticking to rotations.
Thank YouAcknowledgements:John Michael Riley, University of GeorgiaArchie Flanders, Eric J. Wailes, and Eddie C. Chavez, University of Arkansas
Recommended