1
�
Master Project
Pattern Extraction in Stock Market data
By
Suresh Rajagopal
Bachelors in Engineering (1992), Madras University, India
Master of Business Administration (2012), Regis University, CO, USA
A Master Project report submitted to the Graduate Faculty of the
University of Colorado at Colorado Springs
in paritial fulfillment of the requirements for the degree of
Master of Science in Computer Science
Department of Computer Science
College of Engineering and Applied Science
2016
© Copyright By Suresh Rajagopal 2016 All Rights Reserved
2
This Report for Master of Science degree by
Suresh Rajagopal
has been approved for the
Department of Computer Science by
_____________________________
Dr. Jugal Kalita
_____________________________
Dr. Edward Chow
_____________________________
Dr. Thomas Zwirlein
__________________
Date

3
Table of Contents
Abstract ............................................................................................................................................................................................ 4
1. INTRODUCTION ................................................................................................................................................................... 5
2. RELATED WORK .................................................................................................................................................................. 6
Recurrent neural network approach ......................................................................................................................................... 6 Fast Similarity Search ................................................................................................................................................................. 6 Support Vector Machines ........................................................................................................................................................... 6 Probabilistic approach ................................................................................................................................................................ 7 Multi-resolution symbolic representation of Time series ......................................................................................................... 7 Dynamic Time Warping .............................................................................................................................................................. 8
3. STOCK PATTERNS ............................................................................................................................................................... 9
(a) Head and Shoulders pattern............................................................................................................................................ 10 (b) Inverse Head and Shoulders pattern ............................................................................................................................... 10 (c) Rectangular patterns ....................................................................................................................................................... 10
4. METHODOLOGY ................................................................................................................................................................ 13
Preparation of Data sets ............................................................................................................................................................ 13 Template Pattern Generation ................................................................................................................................................... 14 Normalization ............................................................................................................................................................................ 15 Pattern Search Space ................................................................................................................................................................. 16 Dynamic Time Warping (DTW) ............................................................................................................................................... 17 Data Point Reduction ................................................................................................................................................................ 19
5. EVALUATION ...................................................................................................................................................................... 20
6. IMPLEMENATION .............................................................................................................................................................. 23
7. RESULTS ............................................................................................................................................................................... 26
8. SIMULATION WITH THINKORSWIM RESULT .......................................................................................................... 31
9. CONCLUSION ...................................................................................................................................................................... 34
References ...................................................................................................................................................................................... 36
4
ABSTRACT
In this paper, we propose an approach to recognize predefined patterns in stock-price time
series data to make some investment decisions. The stock-price data for various stocks are
first normalized to match the scale of predefined pattern templates for similarity cost
calculation between input and the template charts. The pattern of interest may form at
different time segments and the search algorithm performs the exhaustive search for the
maximum time frame of one year. The Sliding windows of multiple resolutions (time
segments) are created, and the pattern within the windows are compared with the template
patterns. The cost is computed using the Dynamic Time Warping algorithm, which measures
the similarity between the input and the template charts.
5
1. INTRODUCTION
HIS project focuses on the identification of various predefined patterns in time
series data, an essential function in the technical analysis in stock screening
processes. Stock market professionals use sophisticated and costly tools to perform pattern
identification in the real world. Individual investors usually do not have the acess to such
tools. The objective of this project is to create a usable model to perform pattern recognition
using machine learning algorithms. The model is expected to scan the stock market data and
provide a list of stocks that has the potential to form certain predefined patterns. There has
been a lot of studies by stock market professionals on the price charts [6] , and around 20
time-tested patterns are available for consideration for trading purpose.
Some people argue that the prices of stocks are mostly determined by speculations in the
market [7]. News about the company, market parameters such as political and economic
conditions, and market emotions are some of the common drivers of the price fluctuations
[10] in the stock market. However, the standard patterns are formed based on variations in
the supply and demand of stocks being traded. Identifying the pattern formation upfront
could potentially be a critical step in making the right decision in stock trading. Apart from
applying this pattern extraction for stock trading, the same technique can be applied in any
kind of time series data to understand patterns and behavior of data and thereby aid the
decision making process.
T

6
2. RELATED WORK
Recurrent neural network approach
Kamijo et al. [1] used a neural network approach to extract patterns from the Tokyo Stock
Exchange. Their focus was to extract a list of stocks that had triangular patterns. The back
propagation training procedure was used to train the network to capture features of the
triangle.
Fast Similarity Search
Fast Similarity Search model [2] by Agarawal et al., searches for similarity between time
sequences. Two sequences are considered matching if they are non-overlapping and time-
ordered subsequences are similar. This model scales the amplitude of one of the sequences
by a suitable amount, and its offsets are adjusted appropriately to compare with the other.
Support Vector Machines
Huang et al. [3] forecast the direction of movement of Japan’s stock market using support
vector machines. The direction of the index, either positive or negative, was predicted
based on macro parameters that influence the NIKKEI 225 index. Japan is an export
oriented country and the majority of its exports are to the United States. Macro parameters
that were included as part of the analysis were the short term and long term interest rates,
Consumer Price Index, industrial production, government consumption, private
consumption, Gross National Product and Gross Domestic Product. The experiment also
7
included the S&P 500, the United States stock market index. This paper forecasts the
direction, either positive or negative, using the SVM classification algorithm.
Probabilistic approach
The probabilistic approach is widely used for pattern search in the field of computer
vision. The work of Keogh and Smyth [4] used piecewise linear segmentation and local
features such as peaks, troughs and plateaus of the input sequence and the global
information such as the order of the local features, defined using prior distribution of the
expected tremplate sequence.
Multi-resolution symbolic representation of Time series
Megalooikonomou et al. [8] introduced a new approach to time series called
Multiresolution Vector Quantization (MVQ). According to them, this approach achieves
up to 20% better performance compared to similar techniques such as Dynamic Time
Warping, Euclidean, and Piecewise Aggregate Approximation.
This approach used the Vector Quantization (VQ) techniques [18] to extract the key sub-
sequences that were considered similar and encode the frequency of the occurences of
the key subsequencs in the input time series data. The approach uses multiple resolutioin
to improve accuracy. This used a new distance function and a text based technique which
is fast and linearly scaled for the input compared to the computational complexity
associated with the Euclidean distance of O(n2).
8
Naive approaches to compare the timese series takes polynomial time with respect to the
length of the time series and takes long processing time if the length happens to be long.
Since the MVQ uses the dimensionality reduction approach, it can be the best fit for the time
series of very large lengths.
Dynamic Time Warping
Though Multi Vector quantization approach seems promising for comparing the stock
market charts, the pattern search of multiple resolutions for different time window is
cumbersome. It uses the Generalized Llyod Algorithm (GLA) to convert the time series
subsequence into multiple code words and the codes words are scaled for multiple
resolution. This scaling at the code word level may not be required for this pattern search
problem as the resolution is required at the whole time series subsequence, and not on the
parts of the subsequence.
Also, for this project, the pattern is searched on one year of stock market data, which is
about 252 data pairs and for a stock of approximately 2500, using any naive algorithm for
similarity search, it is with the time complexity is O(252*2500*N), where N is the number
of time windows or resolutions and is less than 252, can be easilty computed by regular
desktop machines.
Dynamic Time Warping (DTW) is a widely used approach with video, audio, graphic
and similar data [9]. DTW is a method to find the optimal match between two time series
data. Dynamic Time Warping is better fit for the comparing two time series data because
of it simplicity and high level of accuracy. Along with the new DTW algorithm for
computing the cost, the multiple resolution and data points reduction to match with the
9
template data points are done as part of pre-processing step. Also, DTW is highly flexible
in computing the similarity because of its abilty to stretch in the temporal axis.
3. STOCK PATTERNS
Pattern analysis in the stock market is an important part of Technical Analysis [16]. There
are many time-tested patterns that are widely used to make short-term and long-term
forecasts (stockcharts.com). The data can be intra day, daily, monthly and the patterns can
cover a period as small as one day or as long as many years. For this project, daily data, up
to one year of the historical stock prices are used for the analysis. The following are some
of the time-tested patterns (stockcharts.com) widely used by the stock market professionals
[17].
x Double Top Reversal
x Double Bottom Reversal
x Head and Shoulders Top (Reversal)
x Head and Shoulders Bottom (Reversal)
x Falling Wedge (Reversal)
x Rising Wedge (Reversal)
x Rounding Bottom (Reversal)
x Triple Top Reversal
x Triple Bottom Reversal
x Bump and Run Reversal (Reversal)
x Flag, Pennant (Continuation)
x Symmetrical Triangle (Continuation)
x Ascending Triangle (Continuation)

10
x Descending Triangle (Continuation)
x Rectangle (Continuation)
x Price Channel (Continuation)
x Measured Move - Bullish (Continuation)
x Measured Move - Bearish (Continuation)
x Cup with Handle (Continuation)
In the above list of stock patterns, the following three most popular patterns are chosen to
be searched as part of this project. These patterns are chosed due to their reliable
performance over the period of time. Per [13], the percentage of meeting the target price
for Inverse Head and Shoulder is 74% and the pattern has the rank of 7 out of 23 patterns.
This pattern has another advantage of breaking out in the positive direction. Per [14], the
percentage of meeting the target price for Head and Shoulder is 55% and ranks first in the
overall performance of other 21 patterns. Per [15], the percentage of meeting the target
price for Rectangle Patterns (Top or Up) is 80% and has the overall performance rank of 6
out of 21 patterns.
(a) Head and Shoulders pattern
(b) Inverse Head and Shoulders pattern
(c) Rectangular patterns
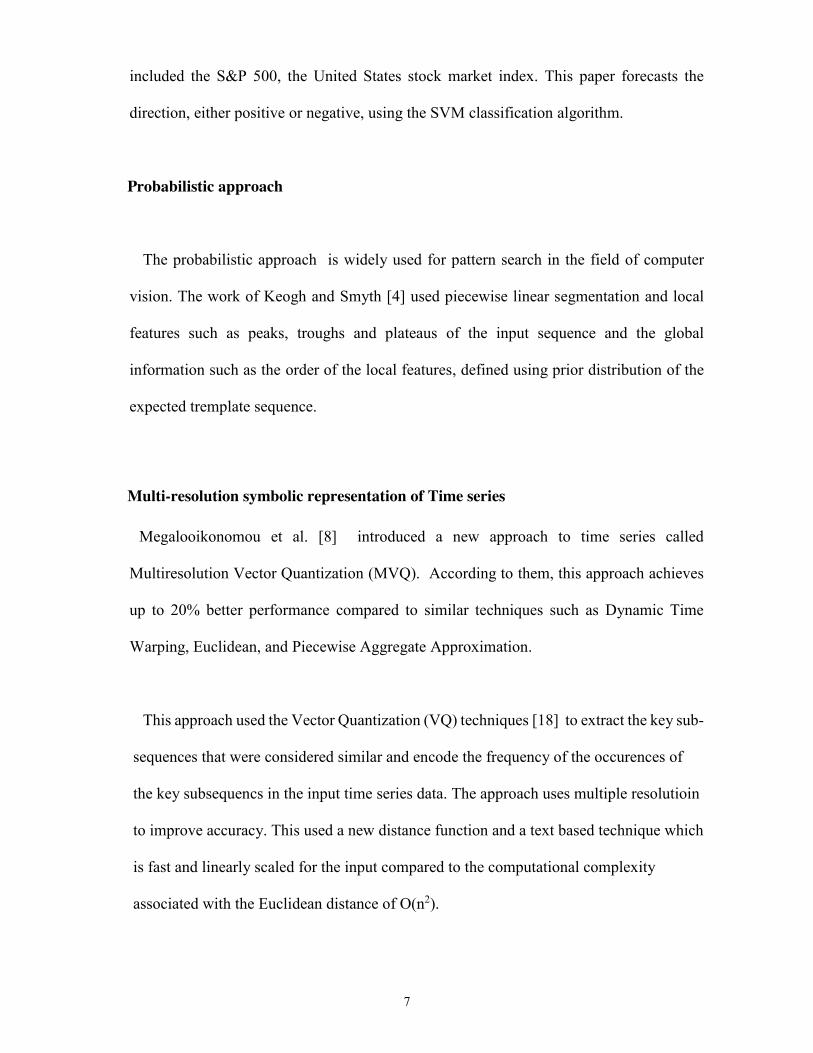
Head and Shoulders: The head and shoulder shape is formed after the uptrend and upon
completion of the uptrend, it marks the reversal as well. The pattern has three successive
peaks: with the middle peak as the highest, which is considered the head, and the other two
side peaks, that are almost of the same sizes, are considered shoulders.
11
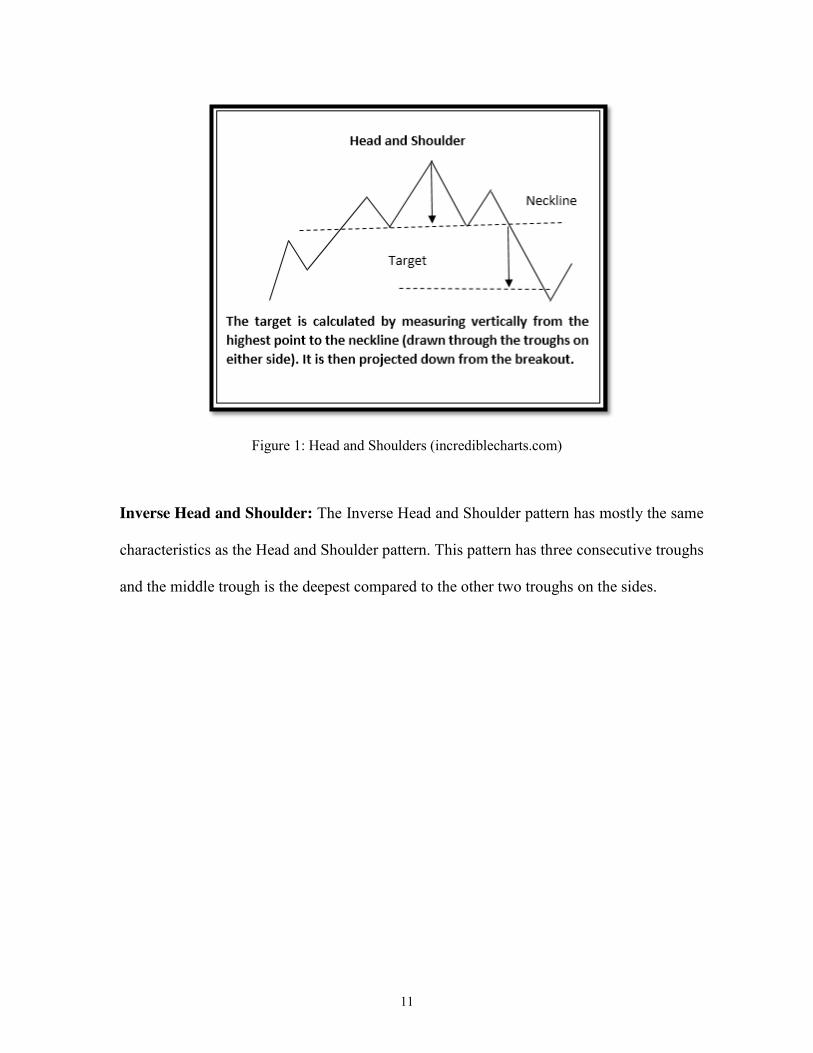
Figure 1: Head and Shoulders (incrediblecharts.com)
Inverse Head and Shoulder: The Inverse Head and Shoulder pattern has mostly the same
characteristics as the Head and Shoulder pattern. This pattern has three consecutive troughs
and the middle trough is the deepest compared to the other two troughs on the sides.

12
s
Figure 2: Inverted Head and Shoulders (incrediblecharts.com):
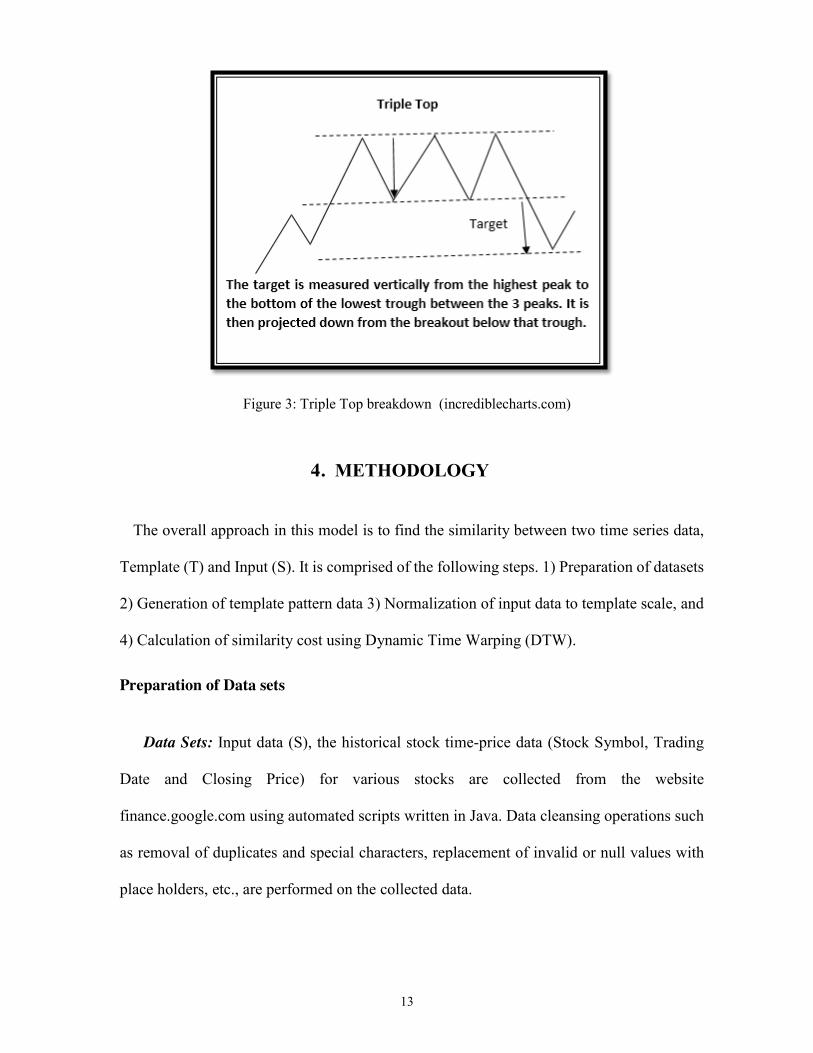
Triple Top Reversal: There are two different patterns in the Triple Pattern category called
Triple Bottom and Triple Top. Triple Top is a bearish pattern and Triple bottom is a bullish
pattern. For our project, we have chosen the Triple Top reversal pattern, and on the
completion of the patern, the trend breaks down in the negative direction. By the end of the
two peaks, it gives the indication of multiple stock patterns such as descending triangle or
rectangle. Sometimes the volume of the chart can give the confirmation on the patterns that
this uptrending will hold. The volume comparision to decide on indidivual patterns are not
included in the scope of this project.
13
Figure 3: Triple Top breakdown (incrediblecharts.com)
4. METHODOLOGY
The overall approach in this model is to find the similarity between two time series data,
Template (T) and Input (S). It is comprised of the following steps. 1) Preparation of datasets
2) Generation of template pattern data 3) Normalization of input data to template scale, and
4) Calculation of similarity cost using Dynamic Time Warping (DTW).
Preparation of Data sets
Data Sets: Input data (S), the historical stock time-price data (Stock Symbol, Trading
Date and Closing Price) for various stocks are collected from the website
finance.google.com using automated scripts written in Java. Data cleansing operations such
as removal of duplicates and special characters, replacement of invalid or null values with
place holders, etc., are performed on the collected data.
14
Though the objective of this project is to find potential patterns for future investments, for
this study, the search space is increased by searching through historical data up to a year,
with the intention to find more True Positives. Historical data can also be used to perform
simulations of investments to analyze how useful the patterns are.
Template Pattern Generation
Template patterns (T) are created manually. The templates for the chosen threen patterns
are created using the Microsoft Excel.
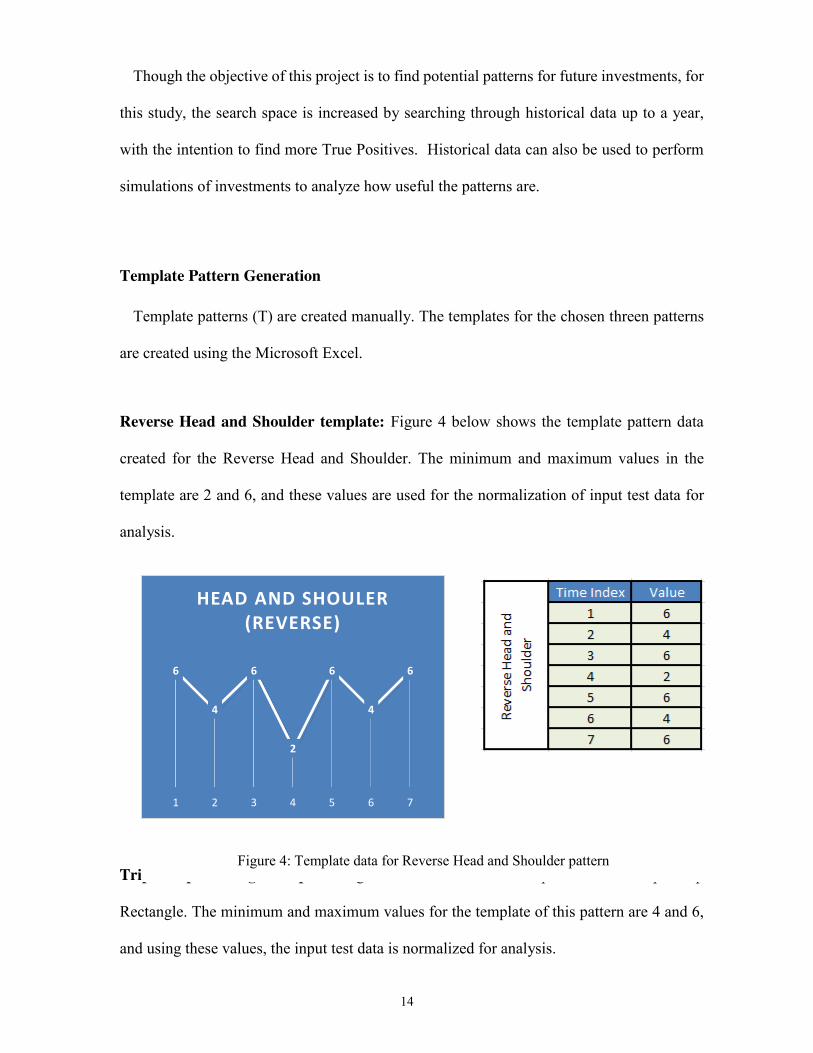
Reverse Head and Shoulder template: Figure 4 below shows the template pattern data
created for the Reverse Head and Shoulder. The minimum and maximum values in the
template are 2 and 6, and these values are used for the normalization of input test data for
analysis.
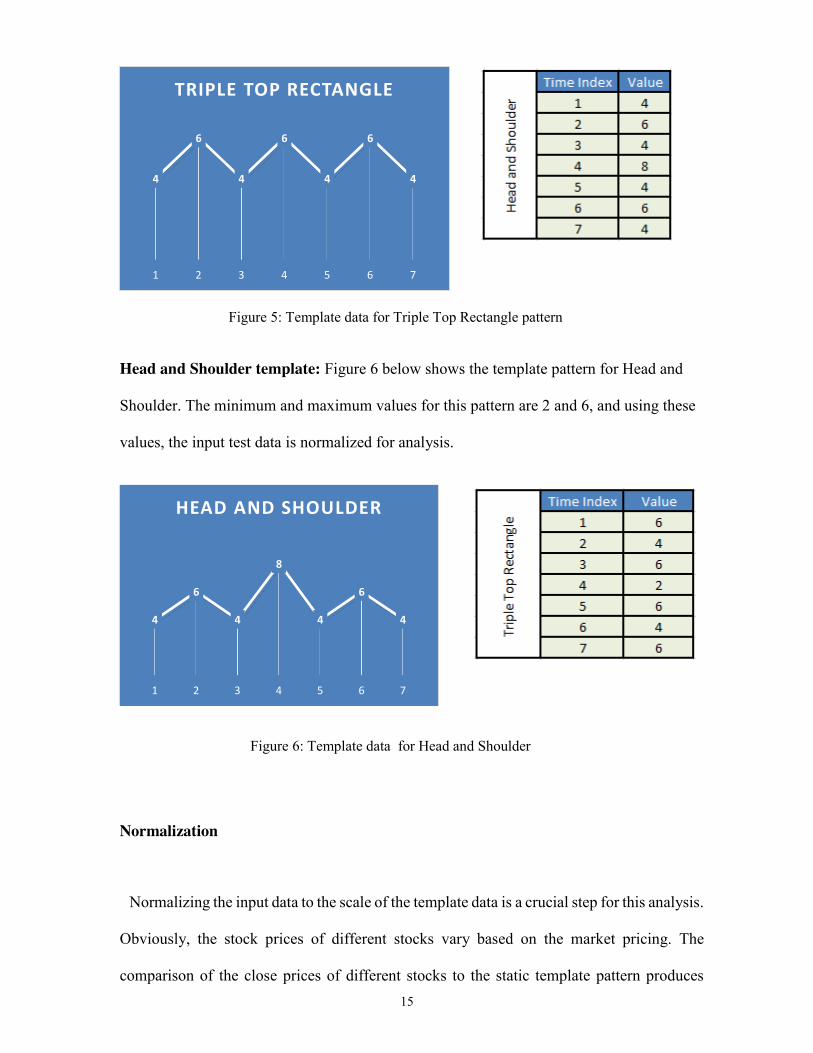
Triple Top Rectangle template: Figure 5 below shows the template data for Triple Top
Rectangle. The minimum and maximum values for the template of this pattern are 4 and 6,
and using these values, the input test data is normalized for analysis.
6
4
6
2
6
4
6
1 2 3 4 5 6 7
HEAD AND SHOULER (REVERSE)
Figure 4: Template data for Reverse Head and Shoulder pattern
15
Head and Shoulder template: Figure 6 below shows the template pattern for Head and
Shoulder. The minimum and maximum values for this pattern are 2 and 6, and using these
values, the input test data is normalized for analysis.
Normalization
Normalizing the input data to the scale of the template data is a crucial step for this analysis.
Obviously, the stock prices of different stocks vary based on the market pricing. The
comparison of the close prices of different stocks to the static template pattern produces
4
6
4
6
4
6
4
1 2 3 4 5 6 7
TRIPLE TOP RECTANGLE
4
6
4
8
4
6
4
1 2 3 4 5 6 7
HEAD AND SHOULDER
Figure 5: Template data for Triple Top Rectangle pattern
Figure 6: Template data for Head and Shoulder
16
inaccurate results. So, one of the preliminary steps for this project is to normalize all the test
data with the minimum and maximum values of the template data for various patterns. The
normalization is done for each time window of the input time-series data using Equation (1).
The input data (S) is split into multiple windows of size (w), and each window is
normalized to match the scale of the template data (T) by using formula (1) below.
𝑋′ = 𝑎 + (𝑋 − 𝑋𝑚𝑖𝑛)(𝑏 − 𝑎)𝑋𝑚𝑎𝑥 − 𝑋𝑚𝑖𝑛
… … … … … … . . (1)
where
𝑋′ = 𝑁𝑜𝑟𝑚𝑎𝑙𝑖𝑧𝑒𝑑 𝑣𝑎𝑙𝑢𝑒 𝑜𝑓 𝑎 𝑝𝑜𝑖𝑛𝑡,
𝑋𝑚𝑖𝑛 = 𝑀𝑖𝑛𝑖𝑚𝑢𝑚 𝑣𝑎𝑙𝑢𝑒 𝑖𝑛 𝑎 𝑤𝑖𝑛𝑑𝑜𝑤 (𝑤),
𝑎 = 𝑀𝑖𝑛𝑖𝑚𝑢𝑚 𝑣𝑎𝑙𝑢𝑒 𝑜𝑓 𝑇𝑒𝑚𝑝𝑙𝑎𝑡𝑒 (𝑇), and
𝑏 = 𝑀𝑎𝑥𝑖𝑚𝑢𝑚 𝑣𝑎𝑙𝑢𝑒 𝑜𝑓 𝑇𝑒𝑚𝑝𝑙𝑎𝑡𝑒 (𝑇).
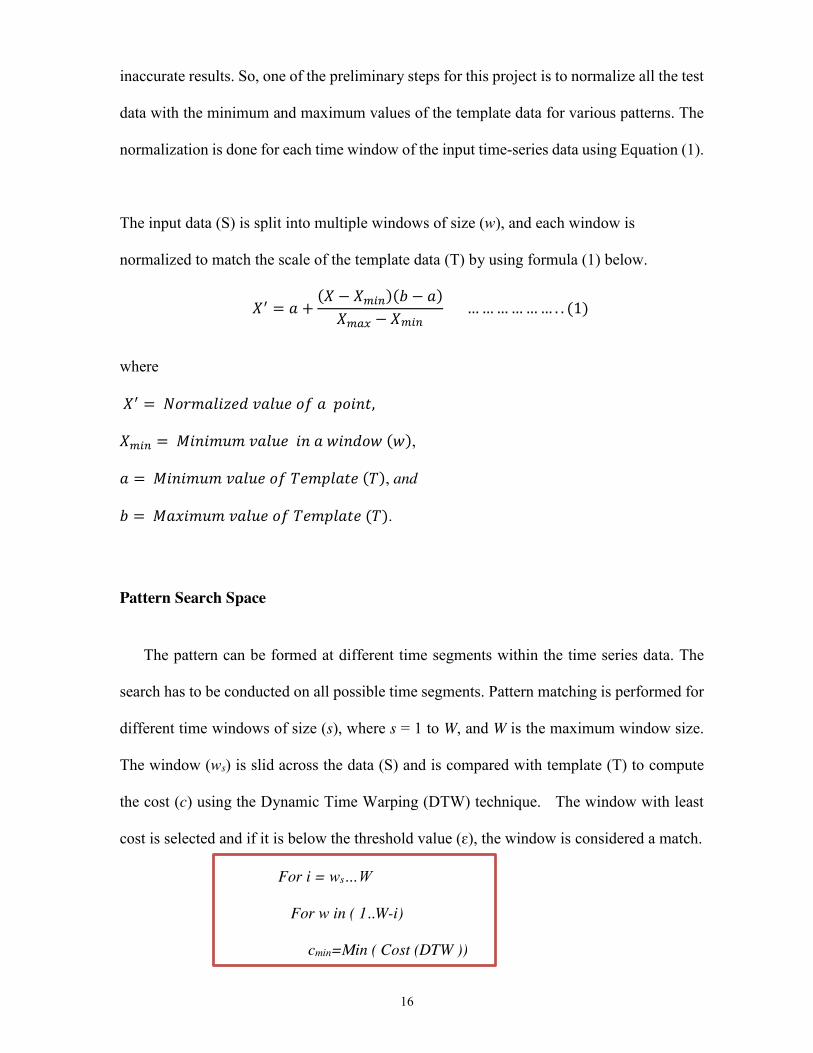
Pattern Search Space
The pattern can be formed at different time segments within the time series data. The
search has to be conducted on all possible time segments. Pattern matching is performed for
different time windows of size (s), where s = 1 to W, and W is the maximum window size.
The window (ws) is slid across the data (S) and is compared with template (T) to compute
the cost (c) using the Dynamic Time Warping (DTW) technique. The window with least
cost is selected and if it is below the threshold value (ɛ), the window is considered a match.
For i = ws…W
For w in ( 1..W-i)
cmin=Min ( Cost (DTW ))
17
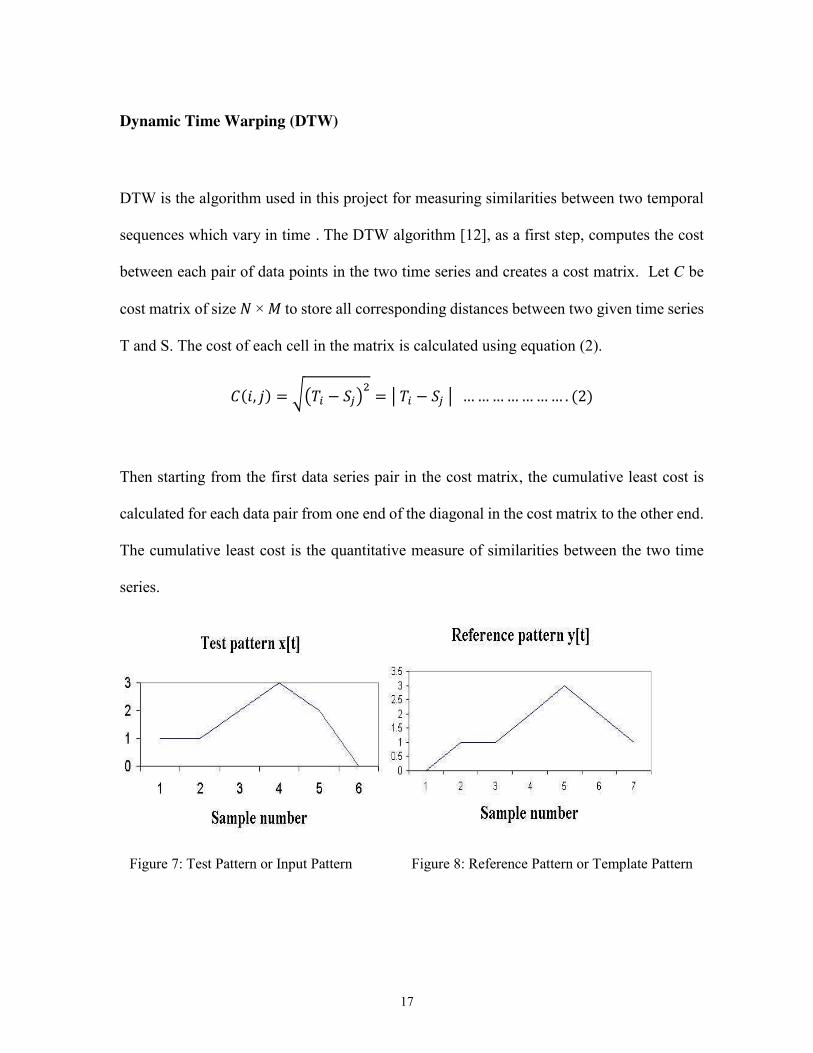
Dynamic Time Warping (DTW)
DTW is the algorithm used in this project for measuring similarities between two temporal
sequences which vary in time . The DTW algorithm [12], as a first step, computes the cost
between each pair of data points in the two time series and creates a cost matrix. Let C be
cost matrix of size 𝑁 × 𝑀 to store all corresponding distances between two given time series
T and S. The cost of each cell in the matrix is calculated using equation (2).
𝐶(𝑖, 𝑗) = √(𝑇𝑖 − 𝑆𝑗)2 = | 𝑇𝑖 − 𝑆𝑗 | … … … … … … … . (2)
Then starting from the first data series pair in the cost matrix, the cumulative least cost is
calculated for each data pair from one end of the diagonal in the cost matrix to the other end.
The cumulative least cost is the quantitative measure of similarities between the two time
series.
Figure 7: Test Pattern or Input Pattern Figure 8: Reference Pattern or Template Pattern
18
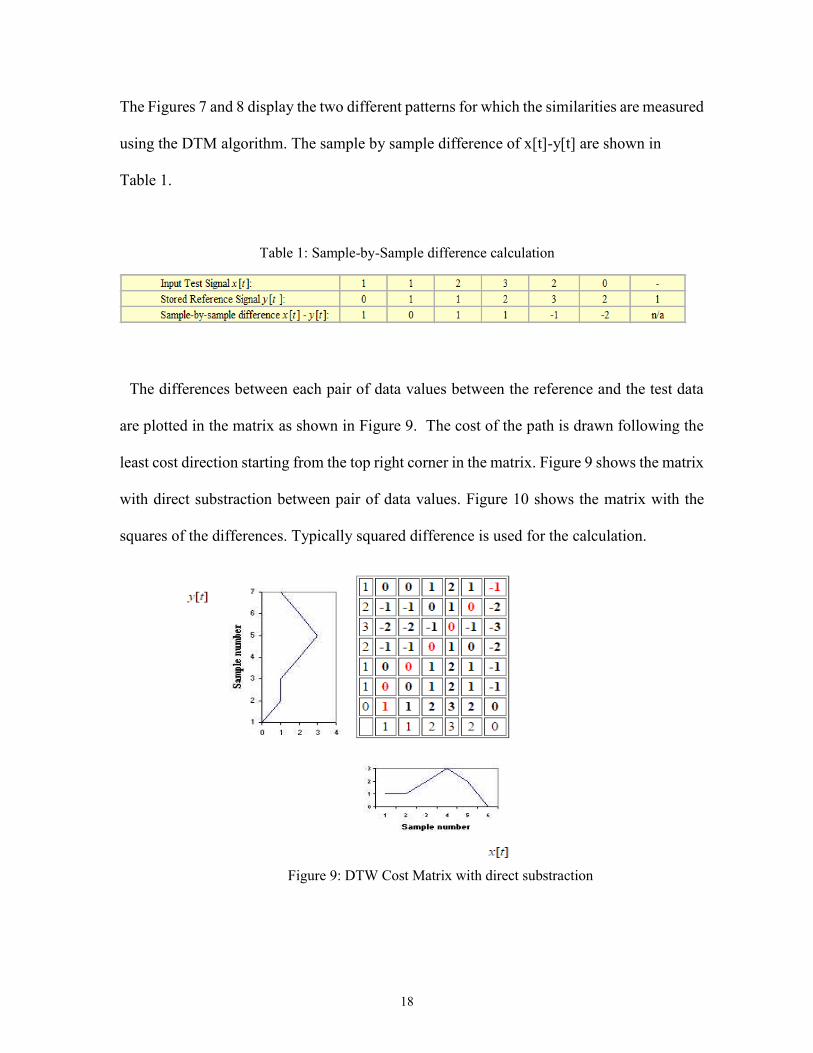
The Figures 7 and 8 display the two different patterns for which the similarities are measured
using the DTM algorithm. The sample by sample difference of x[t]-y[t] are shown in
Table 1.
Table 1: Sample-by-Sample difference calculation
The differences between each pair of data values between the reference and the test data
are plotted in the matrix as shown in Figure 9. The cost of the path is drawn following the
least cost direction starting from the top right corner in the matrix. Figure 9 shows the matrix
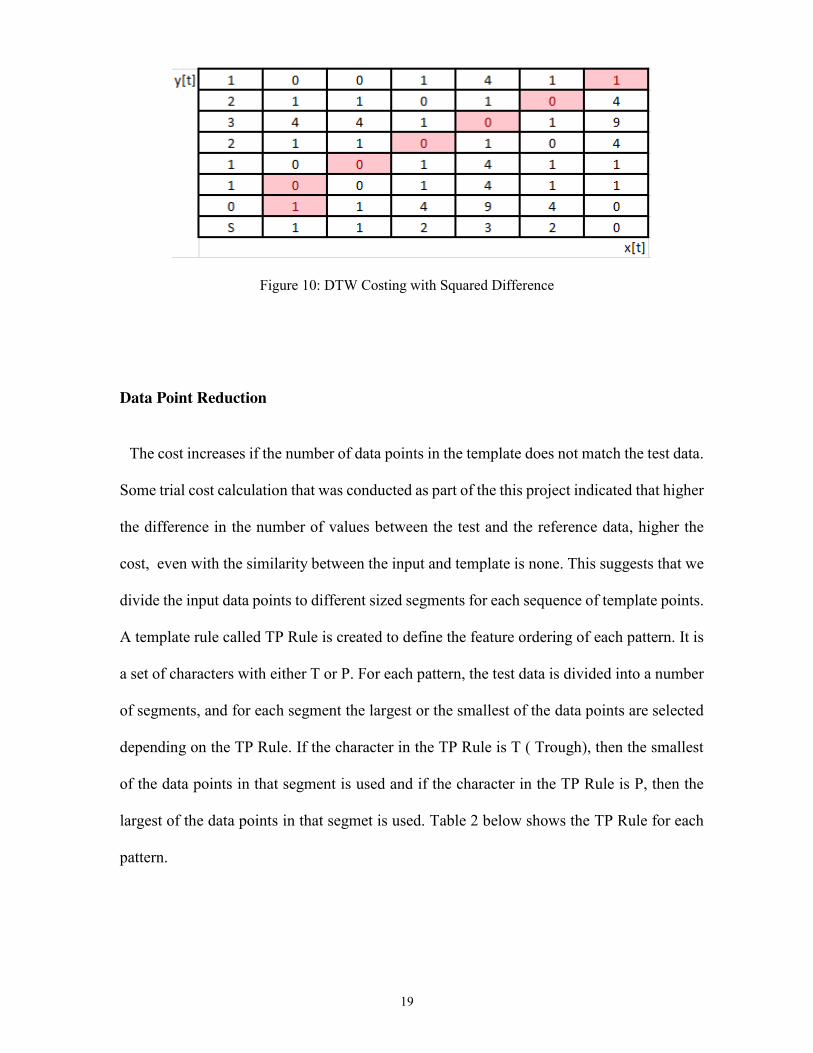
with direct substraction between pair of data values. Figure 10 shows the matrix with the
squares of the differences. Typically squared difference is used for the calculation.
Figure 9: DTW Cost Matrix with direct substraction
19
Figure 10: DTW Costing with Squared Difference
Data Point Reduction
The cost increases if the number of data points in the template does not match the test data.
Some trial cost calculation that was conducted as part of the this project indicated that higher
the difference in the number of values between the test and the reference data, higher the
cost, even with the similarity between the input and template is none. This suggests that we
divide the input data points to different sized segments for each sequence of template points.
A template rule called TP Rule is created to define the feature ordering of each pattern. It is
a set of characters with either T or P. For each pattern, the test data is divided into a number
of segments, and for each segment the largest or the smallest of the data points are selected
depending on the TP Rule. If the character in the TP Rule is T ( Trough), then the smallest
of the data points in that segment is used and if the character in the TP Rule is P, then the
largest of the data points in that segmet is used. Table 2 below shows the TP Rule for each
pattern.
20
Table 2: Template Rule for each patterns
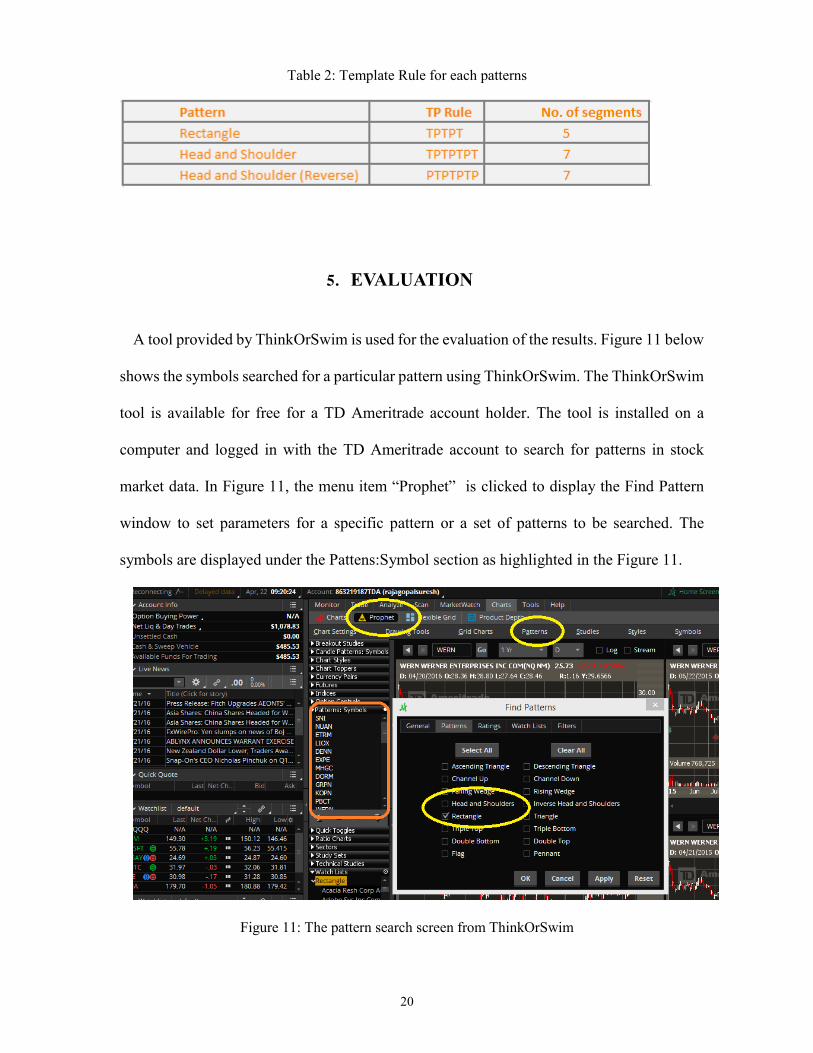
5. EVALUATION
A tool provided by ThinkOrSwim is used for the evaluation of the results. Figure 11 below
shows the symbols searched for a particular pattern using ThinkOrSwim. The ThinkOrSwim
tool is available for free for a TD Ameritrade account holder. The tool is installed on a
computer and logged in with the TD Ameritrade account to search for patterns in stock
market data. In Figure 11, the menu item “Prophet” is clicked to display the Find Pattern
window to set parameters for a specific pattern or a set of patterns to be searched. The
symbols are displayed under the Pattens:Symbol section as highlighted in the Figure 11.
Figure 11: The pattern search screen from ThinkOrSwim
21
Actual Pattern from ThinkOrSwim: The actual patterns that are shortlisted by
ThinkOrSwim are not an exact match with the theoretical shapes. These pattern are
originally shortlisted by various analysts in ThinkOrSwim. As part of this project, the
patterns that are shortlisted by the analysts are compared against the list that is shortlisted by
the DTW model.
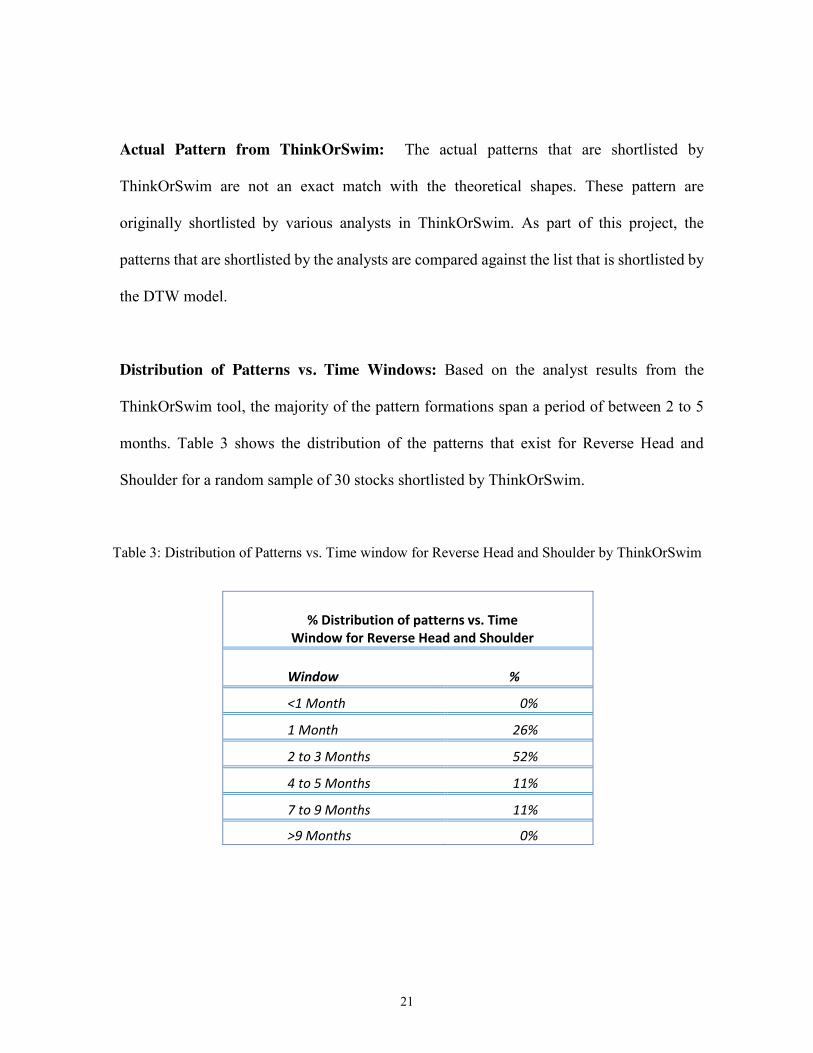
Distribution of Patterns vs. Time Windows: Based on the analyst results from the
ThinkOrSwim tool, the majority of the pattern formations span a period of between 2 to 5
months. Table 3 shows the distribution of the patterns that exist for Reverse Head and
Shoulder for a random sample of 30 stocks shortlisted by ThinkOrSwim.
Table 3: Distribution of Patterns vs. Time window for Reverse Head and Shoulder by ThinkOrSwim
% Distribution of patterns vs. Time Window for Reverse Head and Shoulder
Window %
<1 Month 0%
1 Month 26%
2 to 3 Months 52%
4 to 5 Months 11%
7 to 9 Months 11%
>9 Months 0%

22
Symbols with Head and Shoulder pattern: The following are the 69 symbols with Head
and Shoulder patterns for the past 1 year that are shortlisted by ThinkOrSwim. These
symbols are used for the evaluation of the Head and Shoulder pattern results searched
through this model.
ACAD ACAS AMBA AMKR AVAV BLUE BMRN BONT
CETV CHRW CHTR CISG CMRX CNSL COLM CPLA CRUS
CVLT DCTH DISCA DRRX EXEL FIBK FISV FLEX GPRE
GTLS HELE HLIT HSIC HUBG ILMN INTU JAZZ JCOM LIOX
MIDD MKSI NLST PCRX NFP PTC PTIE QUIK RCII REGN
ROIAK SCHN SCLN SCZ SFLY SHOO SLGN SMRT SPLS
SPRT SRDX TASR TCBI TESO TRMB TRMK UCBI UEPS
URBN VIVO VNDA XLNX ZIXI
Symbols with Reverse Head and Shoulder pattern: The following are the 64 symbols
with the Reverse Head and Shoulder pattern for past 1 year that are shortlisted by
ThinkOrSwim. These symbols are used for the evaluation of the Reverse Head and Shoulder
pattern results searched through our model.
ADBE AKAM AMRN AREX ARIA ARQL ASNA AXTI BANR
BBCN BIDU BIOS BKCC BKMU BPOP BWLD CATY COST
CSGS CTAS DENN DLTR DNKN DWA EBIX EGHT EXEL
EXPD FAST FIBK FITB FIVE HAS HBAN HCSG INO ISCA
23
JAZZ JBLU KALU KLIC KNDI MAT MCHX MPWR MSCC
MTRX NATI PCLN PDCO PENN PNRA PPHM SBUX SGI
SHOO SNTA SPLS TSEM TTMI ULTA VECO WABC WERN
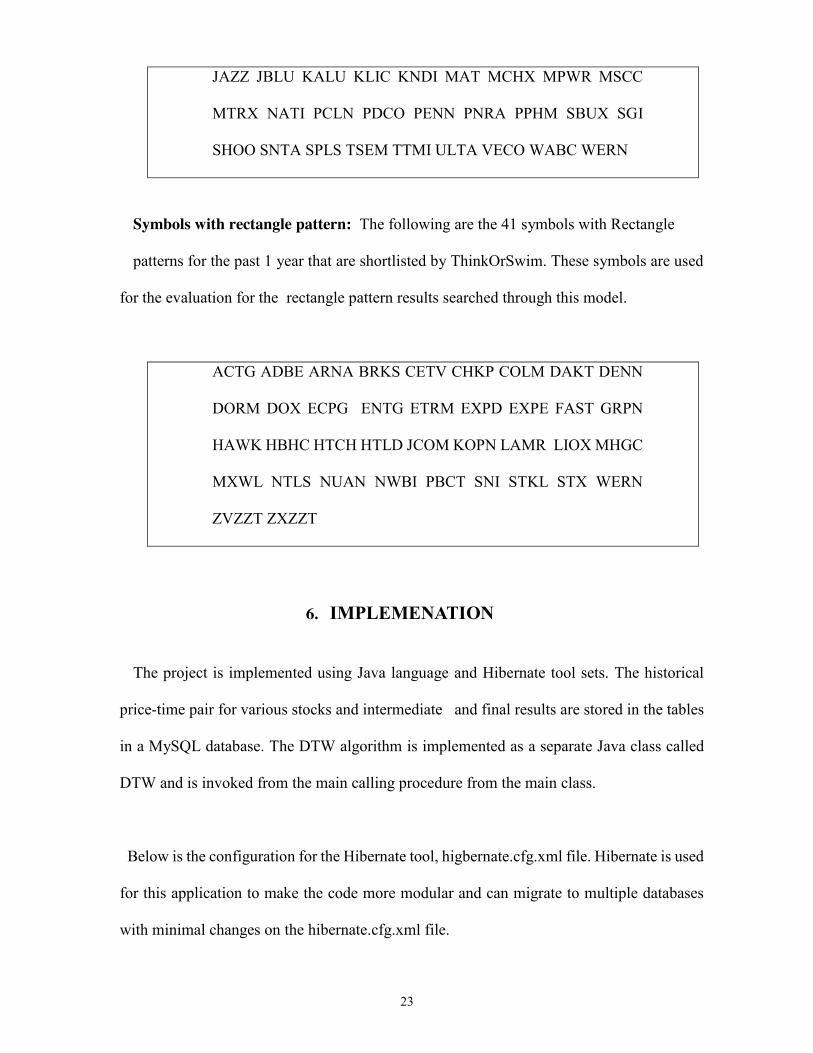
Symbols with rectangle pattern: The following are the 41 symbols with Rectangle
patterns for the past 1 year that are shortlisted by ThinkOrSwim. These symbols are used
for the evaluation for the rectangle pattern results searched through this model.
ACTG ADBE ARNA BRKS CETV CHKP COLM DAKT DENN
DORM DOX ECPG ENTG ETRM EXPD EXPE FAST GRPN
HAWK HBHC HTCH HTLD JCOM KOPN LAMR LIOX MHGC
MXWL NTLS NUAN NWBI PBCT SNI STKL STX WERN
ZVZZT ZXZZT
6. IMPLEMENATION
The project is implemented using Java language and Hibernate tool sets. The historical
price-time pair for various stocks and intermediate and final results are stored in the tables
in a MySQL database. The DTW algorithm is implemented as a separate Java class called
DTW and is invoked from the main calling procedure from the main class.
Below is the configuration for the Hibernate tool, higbernate.cfg.xml file. Hibernate is used
for this application to make the code more modular and can migrate to multiple databases
with minimal changes on the hibernate.cfg.xml file.
24
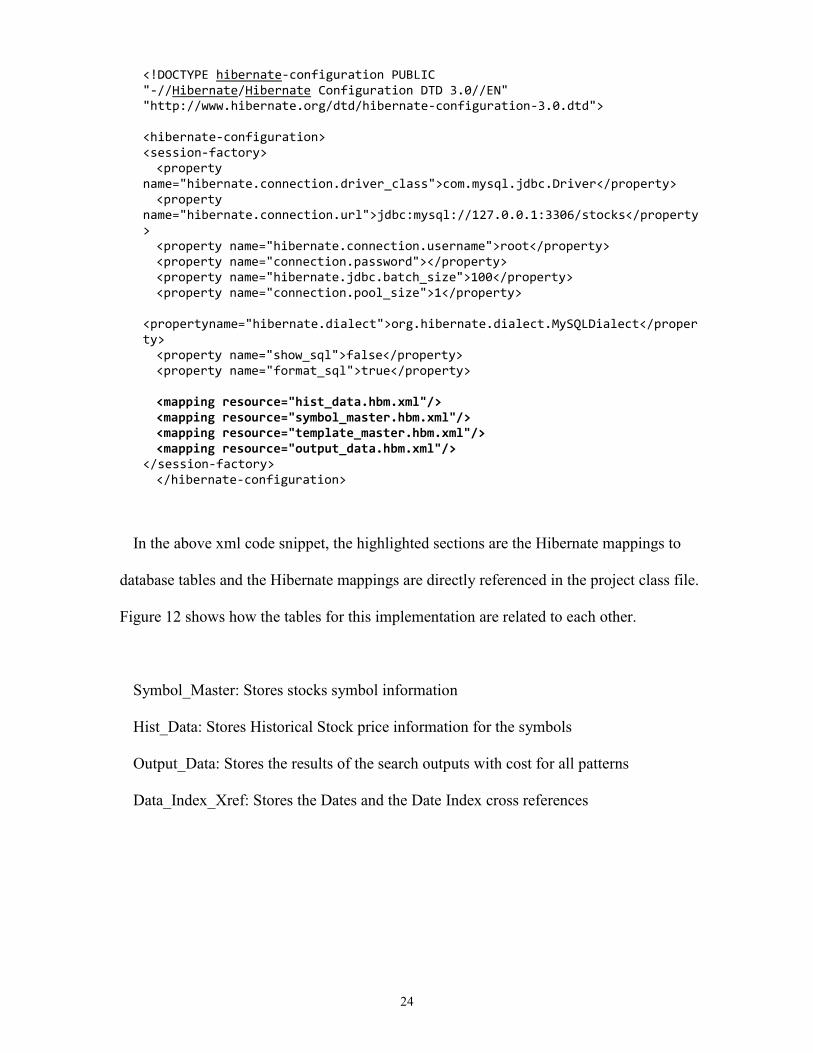
<!DOCTYPE hibernate-configuration PUBLIC "-//Hibernate/Hibernate Configuration DTD 3.0//EN" "http://www.hibernate.org/dtd/hibernate-configuration-3.0.dtd"> <hibernate-configuration> <session-factory> <property name="hibernate.connection.driver_class">com.mysql.jdbc.Driver</property> <property name="hibernate.connection.url">jdbc:mysql://127.0.0.1:3306/stocks</property> <property name="hibernate.connection.username">root</property> <property name="connection.password"></property> <property name="hibernate.jdbc.batch_size">100</property> <property name="connection.pool_size">1</property>
<propertyname="hibernate.dialect">org.hibernate.dialect.MySQLDialect</property> <property name="show_sql">false</property> <property name="format_sql">true</property> <mapping resource="hist_data.hbm.xml"/> <mapping resource="symbol_master.hbm.xml"/> <mapping resource="template_master.hbm.xml"/> <mapping resource="output_data.hbm.xml"/> </session-factory> </hibernate-configuration>
In the above xml code snippet, the highlighted sections are the Hibernate mappings to
database tables and the Hibernate mappings are directly referenced in the project class file.
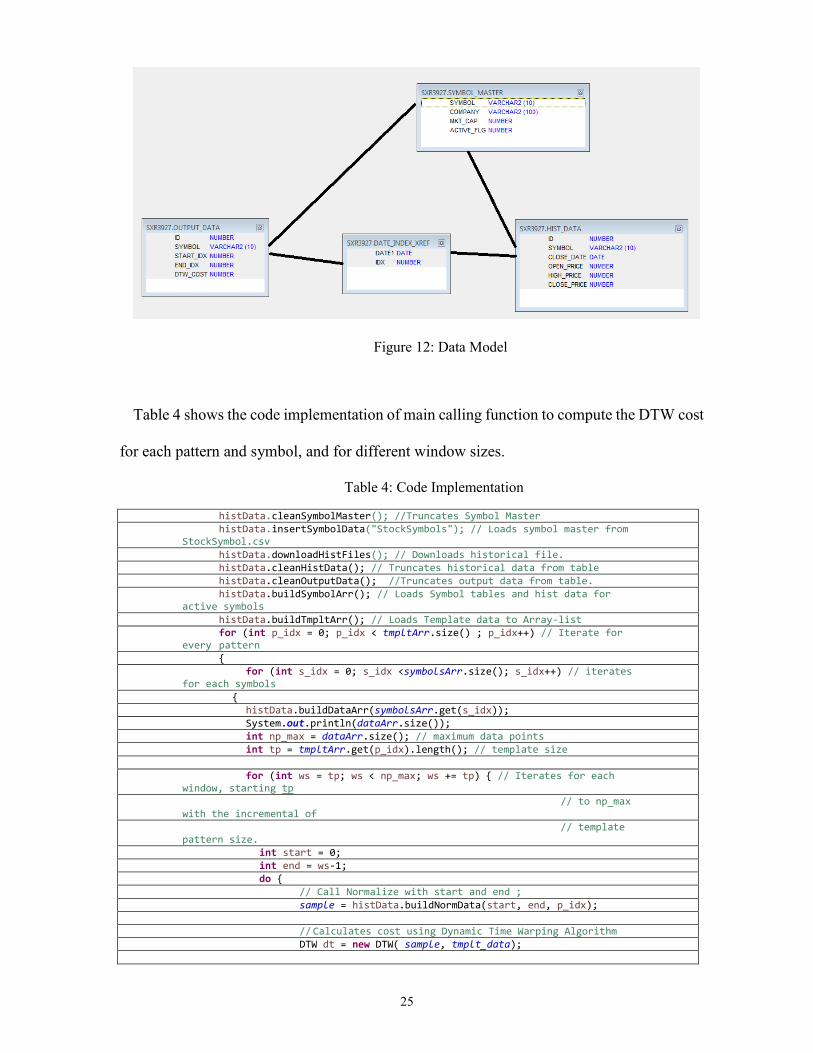
Figure 12 shows how the tables for this implementation are related to each other.
Symbol_Master: Stores stocks symbol information
Hist_Data: Stores Historical Stock price information for the symbols
Output_Data: Stores the results of the search outputs with cost for all patterns
Data_Index_Xref: Stores the Dates and the Date Index cross references
25
Figure 12: Data Model
Table 4 shows the code implementation of main calling function to compute the DTW cost
for each pattern and symbol, and for different window sizes.
Table 4: Code Implementation
histData.cleanSymbolMaster(); //Truncates Symbol Master histData.insertSymbolData("StockSymbols"); // Loads symbol master from StockSymbol.csv histData.downloadHistFiles(); // Downloads historical file. histData.cleanHistData(); // Truncates historical data from table histData.cleanOutputData(); //Truncates output data from table. histData.buildSymbolArr(); // Loads Symbol tables and hist data for active symbols histData.buildTmpltArr(); // Loads Template data to Array-list for (int p_idx = 0; p_idx < tmpltArr.size() ; p_idx++) // Iterate for every pattern { for (int s_idx = 0; s_idx <symbolsArr.size(); s_idx++) // iterates for each symbols { histData.buildDataArr(symbolsArr.get(s_idx)); System.out.println(dataArr.size()); int np_max = dataArr.size(); // maximum data points int tp = tmpltArr.get(p_idx).length(); // template size for (int ws = tp; ws < np_max; ws += tp) { // Iterates for each window, starting tp // to np_max with the incremental of // template pattern size. int start = 0; int end = ws-1; do { // Call Normalize with start and end ; sample = histData.buildNormData(start, end, p_idx); // Calculates cost using Dynamic Time Warping Algorithm DTW dt = new DTW( sample, tmplt_data);

26
histData.saveOutput( id_val,2,sym,start, end, dt.warpingDistance); id_val=id_val+1; start = start + 1; end = end + 1; } while (end < np_max); } dataArr.clear(); // Clears dataArray } }
7. RESULTS
The code is run against all the downloaded historical data for the stocks for the three
patterns Head and Shoulder, Inverse Head and Shoulder and Rectangle. The results of the
model are stored in the output_data table. The results contain information about the symbol,
start and end of the pattern formations and the associated DTW Cost.
The model was run against the known set of data from ThinkOrSwim and most of the
patterns were part of the results. False positives are high and True Negatives are very few.
The reason for false postives are that multiple time windows that are close to each other have
similar costs.
1) The DTW costs are calculated to be between 0.7 and above 10.
2) A Majority of windows that have minimal cost ranges are for 7 to 10 day windows.
3) There are a high number of False Positives (93% for Inverted Head and Shoulder) .
4) There are a low number of True Positives (40% for Inverted Head and Shoulder).
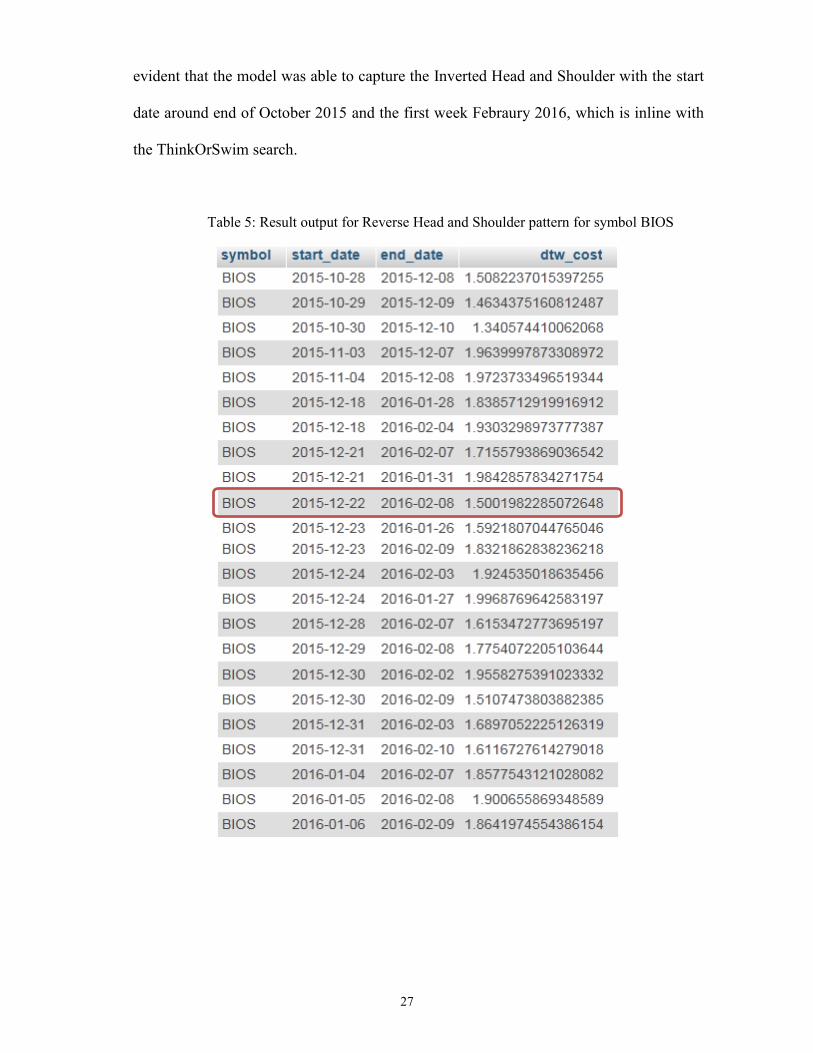
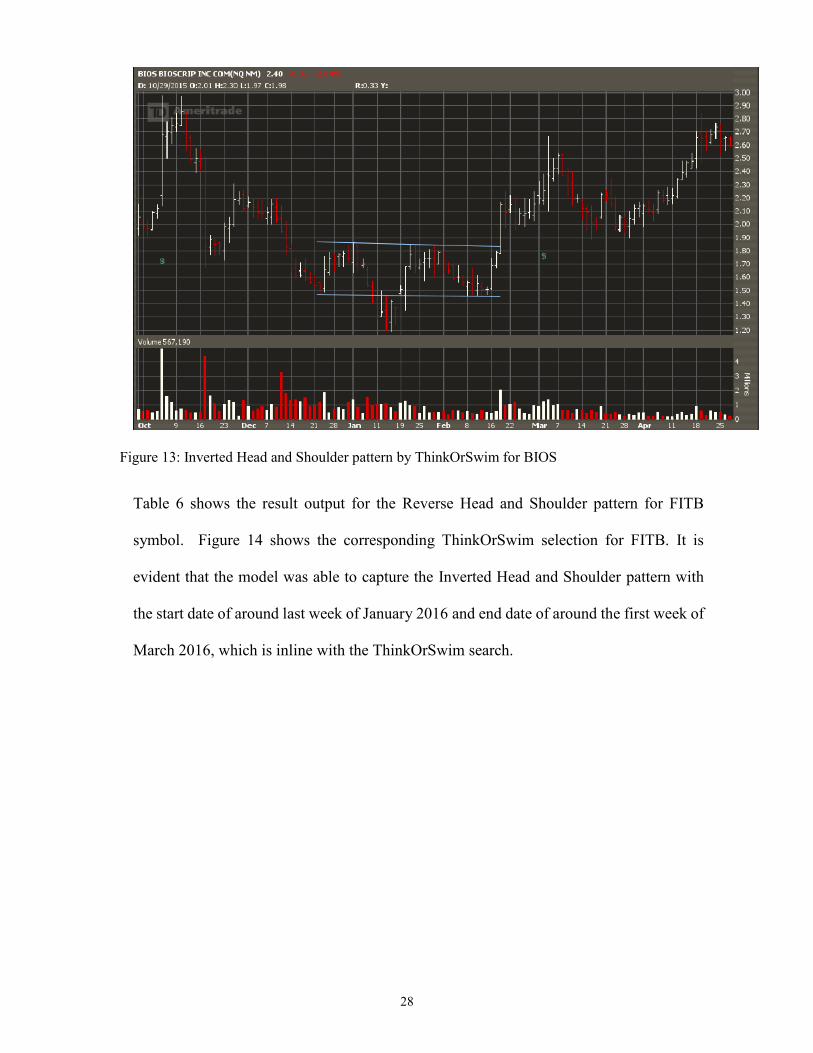
Table 5 shows the result output for the Reverse Head and Shoulder pattern for BIOS
symbol. Figure 13 shows the corresponding ThinkOrSwim selection for BIOS. It is
27
evident that the model was able to capture the Inverted Head and Shoulder with the start
date around end of October 2015 and the first week Febraury 2016, which is inline with
the ThinkOrSwim search.
Table 5: Result output for Reverse Head and Shoulder pattern for symbol BIOS
28
Figure 13: Inverted Head and Shoulder pattern by ThinkOrSwim for BIOS
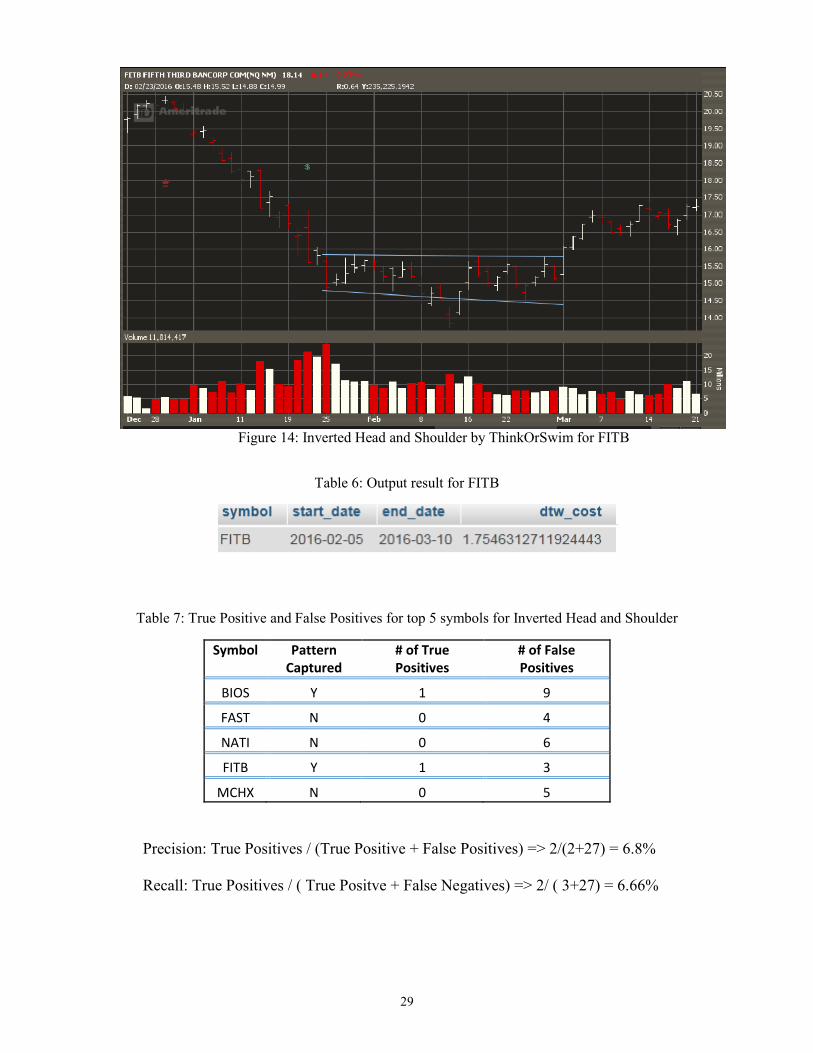
Table 6 shows the result output for the Reverse Head and Shoulder pattern for FITB
symbol. Figure 14 shows the corresponding ThinkOrSwim selection for FITB. It is
evident that the model was able to capture the Inverted Head and Shoulder pattern with
the start date of around last week of January 2016 and end date of around the first week of
March 2016, which is inline with the ThinkOrSwim search.
29
Figure 14: Inverted Head and Shoulder by ThinkOrSwim for FITB
Table 6: Output result for FITB
Table 7: True Positive and False Positives for top 5 symbols for Inverted Head and Shoulder
Symbol Pattern Captured
# of True Positives
# of False Positives
BIOS Y 1 9
FAST N 0 4
NATI N 0 6
FITB Y 1 3
MCHX N 0 5
Precision: True Positives / (True Positive + False Positives) => 2/(2+27) = 6.8%
Recall: True Positives / ( True Positve + False Negatives) => 2/ ( 3+27) = 6.66%
30
We come to the following conclusions:
1) Analyst shortlisted patterns do not just depend on one set of template points for each
pattern and there are variations in the pattern shapes.
2) Volume confirmation: Analysts use volume data for additional confirmation
(http://www.investopedia.com/) to determine the validity of patterns. The trend in the
price should match the trend in the volume. In this project, the volume consideration is
out of scope and the main focus is on the algorithm to extract patterns from time series
data.

31
8. SIMULATION WITH THINKORSWIM RESULT
ThinkorSwim results are used by the professionals or clients of TD Ameritrade for day to
day trading. A simulation is conducted on the Reverse Head and Shoulder pattern as part of
this project. The reason for choosing the Reverse Head and Shoulder pattern is that at the
end of the pattern, the breakout of the of curve is in the positive direction, that giving profit
for the investors. 30 symbols that are selected as part of Reverse Head and Shoulder pattern
by the ThinkOrSwim tool are used for the simulation. This simulation is to confirm the
theory that if an investor invests on the Reverse Head and Shoulder pattern, he/she has the
potential to be profitable out of the deal.
For this simulation, $450,000 is used as the portfolio investment and the amount is equally
distributed to each of the 30 symbols. The stocks are bought at the end of the Inverse Head
and Shoulder pattern for the amount of 15,000 ( 450,000 / 30 stocks). We look for the
Support Line and draw it after the stocks are bought if the trend goes in the positive direction
as expected for the Reverse Head and Shoulder pattern. If the trend is reversed after the
stocks are bought or if the price goes down below the support line by .725% , then that stocks
are sold to avoid potential loss. For the stocks that do not reach the level below .725% of
support line since they are bought, the stocks are sold at the market price.
32
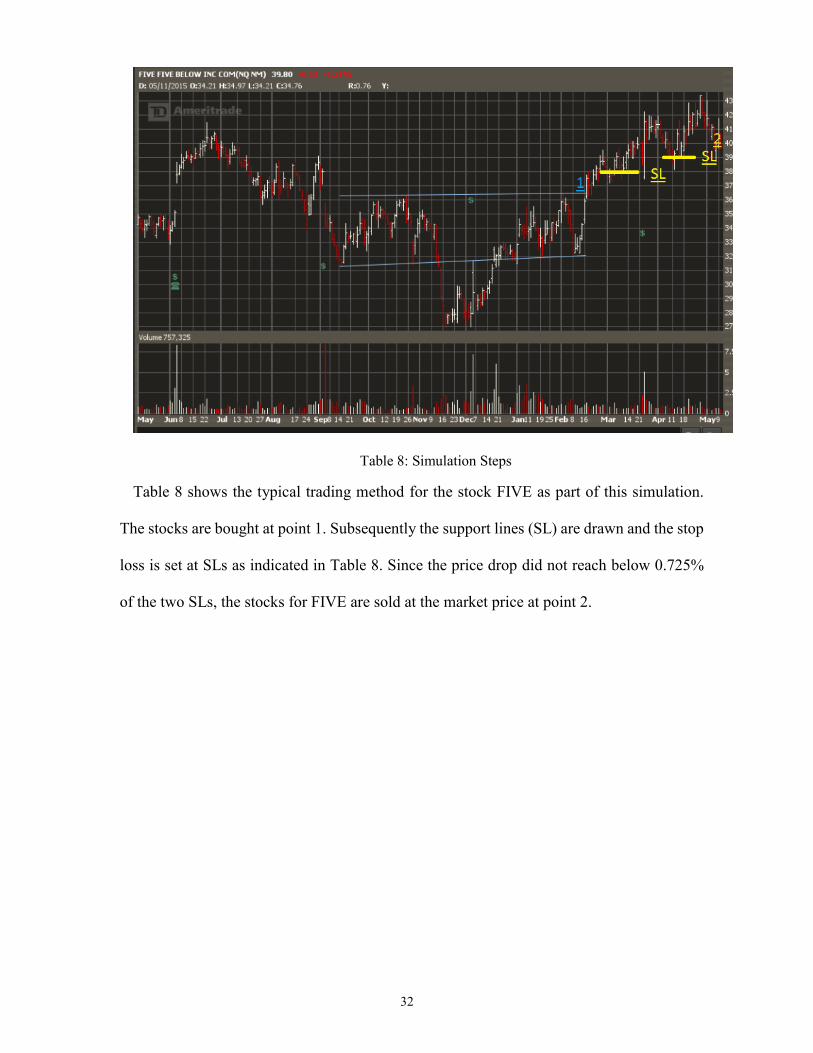
Table 8: Simulation Steps
Table 8 shows the typical trading method for the stock FIVE as part of this simulation.
The stocks are bought at point 1. Subsequently the support lines (SL) are drawn and the stop
loss is set at SLs as indicated in Table 8. Since the price drop did not reach below 0.725%
of the two SLs, the stocks for FIVE are sold at the market price at point 2.
33
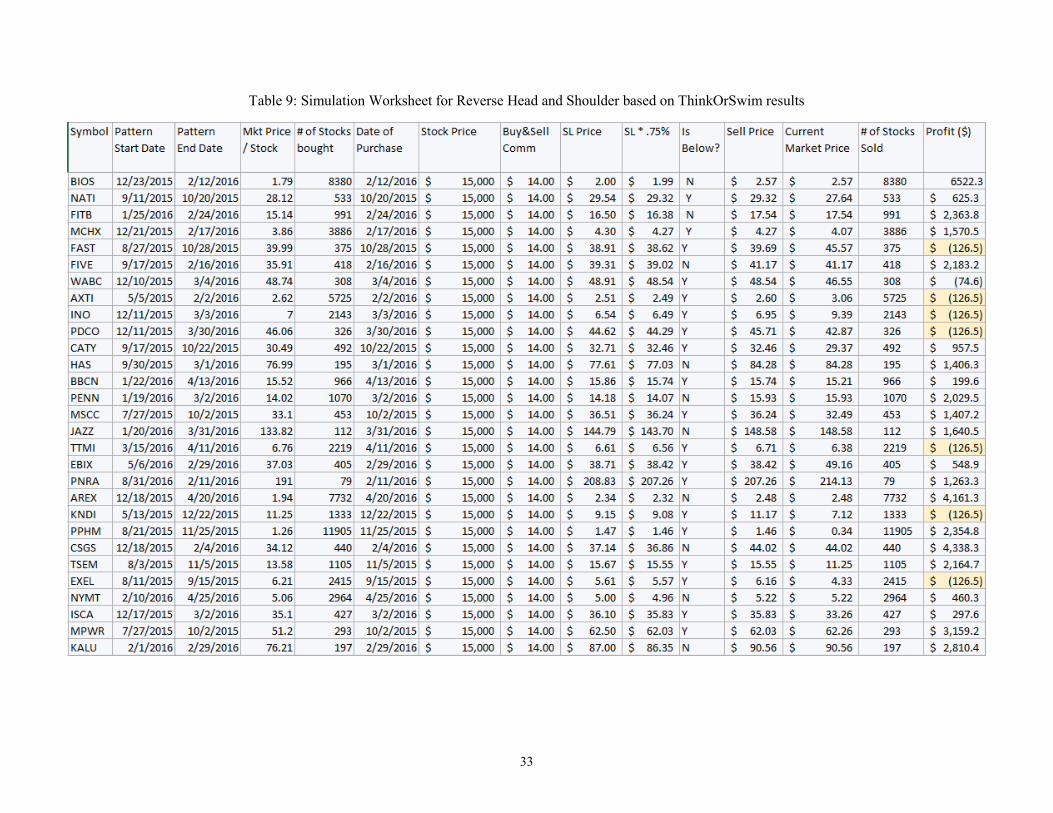
Table 9: Simulation Worksheet for Reverse Head and Shoulder based on ThinkOrSwim results

34
Table 10: Simulation Result ( % Profit ) for Reverse Head and Shoulder for ThinkOrSwim stocks
Table 10 shows the result of the simulation and validates the breakout that happens at the
end of the Reverse Head and Shoulder pattern, with 70% accuracy rate. Table 9 displays that
a profit of $41,392 (9.2%) is achieved for the investment of $450,000 with the exclusion of
the commission fees of $14.00 at the buying and the selling points. The result above is
achieved only if we consistently draw the support line level and set the stop loss levels. The
result may vary for different styles of trading and portfolio fund distribution.
Table 11: Reverse Head and Shoulder breakout rate %
9. CONCLUSION
The results of the model show that the approach followed in searching the pattern has done
a decent job in shortlisting the stocks that have the most potential to be in certain pattern
category. Additional confirmations such as volume trend, checking prior trends before the
formation of the specified pattern, etc., can be applied on the shortlisted stocks to reduce the
False Positive and increase True Positives.

35
Mining patterns from data has gained attention in recent years, in different fields such as
medical, stock market and others, as more and more people are trying to gain insight from
the wealth of data being collected. Analyzing data through charts is an intutive way to
interpret data to make decisions. The demand for applications of data mining in time series
data has been increasing. The experiment done as part of this project, have given valuable
information and future enhancement to the model could make this tool more usable to small
scale individual investors, to assist in making decisions in stock trading.
36
REFERENCES
[1] Kamijo, K. I., & Tanigawa, T. (1990, June). Stock price pattern recognition-a recurrent neural
network approach. In Neural Networks, 1990 IJCNN International Joint Conference on (pp. 215-
221). IEEE.
[2] Lin, R. A. K. L., & Shim, H. S. S. K. (1995). Fast similarity search in the presence of noise, scaling,
and translation in time-series databases. In Proceeding of the 21th International Conference on Very
Large Data Bases (pp. 490-501)
[3] Huang, W., Nakamori, Y., & Wang, S. Y. (2005). Forecasting stock market movement direction with
support vector machine. Computers & Operations Research, 32(10), 2513-2522.
[4] Keogh, E. J., & Smyth, P. (1997, August). A Probabilistic Approach to Fast Pattern Matching in
Time Series Databases. In Knowledge Discovery from Data (KDD) (Vol. 1997, pp. 24-30).
[5] Yi, B. K., Jagadish, H. V., & Faloutsos, C. (1998, February). Efficient retrieval of similar time
sequences under time warping. Proceedings of the 14th International Conference on Data
Engineering (pp. 201-208). IEEE.
[6] Chart Patterns. (n.d.). Retrieved November 23, 2015, from
http://stockcharts.com/school/doku.php?id=chart_school:chart_analysis:chart_patterns
[7] Mei, J., Scheinkman, J., & Xiong, W. (2005). Speculative trading and stock prices: Evidence from
Chinese AB share premia (No. w11362). National Bureau of Economic Research.
[8] Megalooikonomou, V., Wang, Q., Li, G., & Faloutsos, C. (2005, April). A multiresolution symbolic
representation of time series. In Data Engineering, 2005. ICDE 2005. Proceedings. 21st International
Conference on (pp. 668-679). IEEE. Chicago
[9] Corradini, A. (2001). Dynamic time warping for off-line recognition of a small gesture vocabulary.
In Recognition, Analysis, and Tracking of Faces and Gestures in Real-Time Systems, 2001.
Proceedings. IEEE ICCV Workshop on (pp. 82-89). IEEE.
[10] Goedhart, M., Koller, T., & Wessels, D. (2005). Do fundamentals–or emotions–drive the stock
market. McKinsey Quarterly, 2005.
37
[11] Nesbitt, K. V., & Barrass, S. (2004). Finding trading patterns in stock market data. Computer
Graphics and Applications, IEEE, 24(5), 45-55.
[12] Taylor, J., Zhou, X., Rouphail, N. M., & Porter, R. J. (2015). Method for investigating intradriver
heterogeneity using vehicle trajectory data: a dynamic time warping approach. Transportation
Research Part B: Methodological, 73, 59-80
[13] Bulkowski's Head-and-Shoulders Bottoms. (n.d.). Retrieved May 15, 2016, from
http://thepatternsite.com/hsb.html
[14] Bulkowski’s Head-and-Shoulders Tops. (n.d.). Retrieved May 15, 2016, from
http://thepatternsite.com/hst.html
[15] Bulkowski's Rectangle Tops. (n.d.). Retrieved May 16, 2016, from
http://thepatternsite.com/recttops.html
[16] Welcome to Market Realist. (n.d.). Retrieved May 16, 2016, from
http://marketrealist.com/2014/11/must-know-technical-analysis/
[17] Chart Patterns. (n.d.). Retrieved May 16, 2016, from
http://stockcharts.com/school/doku.php?id=chart_school:chart_analysis:chart_patterns
[18] Martinetz, T. M., Berkovich, S. G., & Schulten, K. J. (1993). Neural-gas' network for vector
quantization and its application to time-series prediction. Neural Networks, IEEE Transactions on,
4(4), 558-569.
Recommended


![ปก - nation universityit.nation.ac.th/studentresearch/files/5603331058f.pdfj‘ZUSVNOZ\cRWbcM]]ZcTPVWcoZSZbZcQSPNZbNlbZcQZW bPW]VSbZSV^bRTR ^SZqMZWQl QVWQOMbZb T‘RT _RZ‘V\aMNbPcTSPQT](https://img.pdfslide.us/doc/110x75/5f0615d87e708231d416372e/aa-nation-jazusvnozcrwbcmzctpvwcozszbzcqspnzbnlbzcqzw-bpwvsbzsvbrtr.jpg)