P3 Challenge for A/E Firms
Monday, April 20, 2015 – 9:30am – 11:30am
Moderator: Rick Volk, CH2M Hill
ABOUT THE SPEAKERS
Federal Perspective Presented by
State Perspective Presented by
Ms. Pauline Thorndike is the Alternative Financing Program Manager with the U.S. Army Corps of Engineers.
She develops and leads teams to support alternative financing initiatives within the Corps of Engineers and
serves as the primary interface for alternative financing coordination, communications and strategic integration.
Mr. Andrew Heller is the Acting Assistant Commissioner for the U.S. General Services Administration’s Public
Buildings Service (PBS) Office of Real Property Asset Management. He sets the strategic direction for
management of the vast owned and leased assets in GSA’s real estate portfolio. This includes executing optimal
investment decisions for the acquisition, construction, renovation, leasing and utilization of the PBS portfolio.
Mr. Richard Ornitz is Senior Counsel at McKenna, Long & Aldridge. A recognized market leader in
infrastructure in the U.S. and globally in emerging markets, he focuses his practice on international,
privatization, private equity and cross-border finance matters.
Mr. Douglas Koelemay has served as Director of the Virginia Office of Public Private Partnerships (VAP3)
since January 2014. In 1993 Koelemay edited “Financing the Future: Report of the Commission to Promote
Investment in America’s Infrastructure,” which sparked creation of TIFIA, private activity bonds and other U.S.
alternate financing tools.
Mr. D.J. Gribbin is a Managing Director and Head, US Government Advisory and Relations for Macquarie
Capital, having spent 15 years working on public policy and business development in the infrastructure sector.
He has led advisory teams working on transactions in Texas, Puerto Rico, New Jersey, and Colorado and has
worked on numerous public private partnership deals in the US.
Ms. Sallye Perrin is a Senior Vice President at Parsons Brinckerhoff (PB). She is nationally recognized for her
ability to help agencies find innovative and cost effective means to implement their transportation programs and
projects and is noted for her expertise in public-private partnerships and alternative delivery projects.
1
American Council of Engineering CompaniesApril 20, 2015
Andrew HellerActing Assistant CommissionerReal Property Asset ManagementPublic Buildings ServiceU.S. General Services Administration
PBS Priorities
2
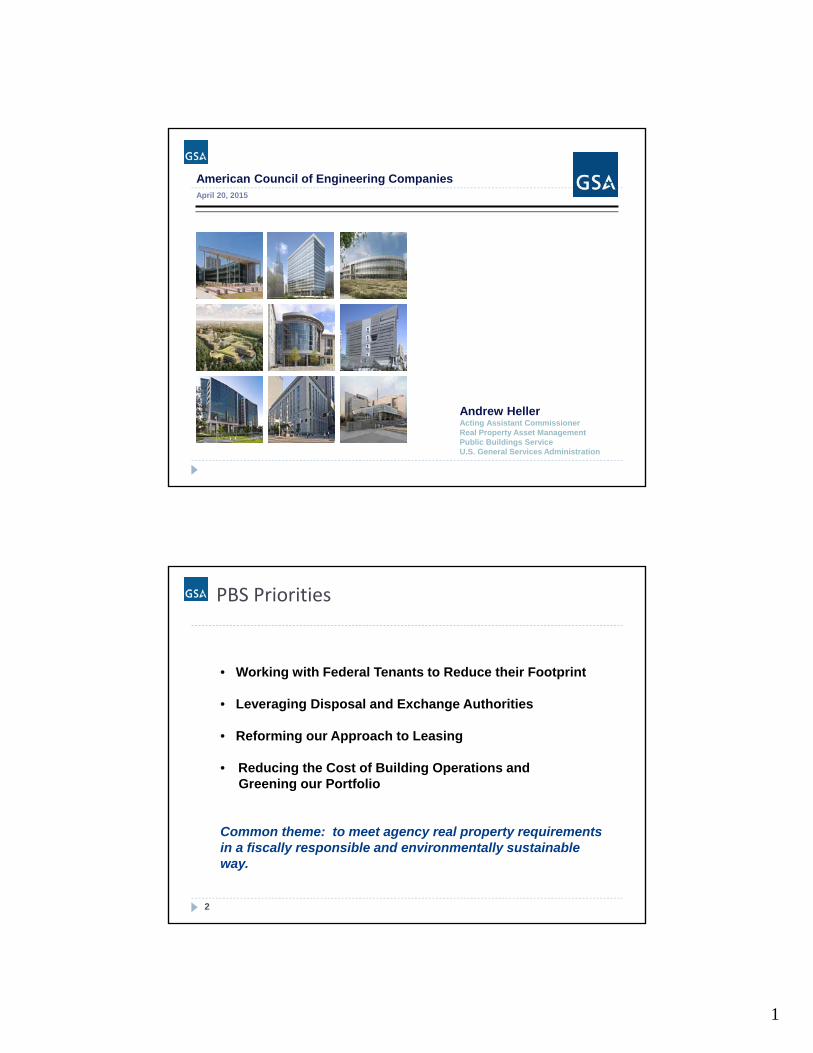
• Working with Federal Tenants to Reduce their Footprint
• Leveraging Disposal and Exchange Authorities
• Reforming our Approach to Leasing
• Reducing the Cost of Building Operations and Greening our Portfolio
Common theme: to meet agency real property requirements in a fiscally responsible and environmentally sustainable way.

2
FBF Annual Revenue vs Obligation Authority
0
2
4
6
8
10
2008 2009 2010 2011 2012 2013 2014 2015
Rent Estimates
Enacted NOA
IN BILLIONS
3
FY2016 Budget Request
4
$10.37 Billion—Total GSA Budget Request
• $1.26 Billion for New Construction
• $933 Million for Major Repairs and Alterations
• $314 Million for Minor Repairs and Alterations
• $5.58 Billion for Rent in Leased Facilities

3
Public‐Private Partnership Options
5
• Maximizing Disposal and Exchange Authorities:
- Outleasing
- Swap/Construct
• Energy Savings Performance Contracts (ESPCs)
Maximizing Disposal and Exchange Authorities
6
Hanger One at Moffett Field, Mountain View, CA

4
Maximizing Disposal and Exchange Authorities
7
Old Post Office Building, Washington, DC
Maximizing Disposal and Exchange Authorities
8
Volpe DOT Complex, Cambridge, MA

5
Maximizing Exchange and Disposal Authority
9
J. Edgar Hoover Building, Washington, DC
Energy Savings Performance Contracts
10
Fort Buchannan, Puerto Rico
IRS Financial Services Center, New Carrollton, MD

1
P3 CHALLENGE: AMERICAN COUNCILOF ENGINEERING COMPANIES
Douglas Koelemay, Director
VIRGINIA P3 PORTFOLIO

2
I‐95 EXPRESS LANES PROJECT
• I‐95 Express Lanes opened December 2014
• Meeting traffic and revenue estimates
• Virginia contribution of $71 million leveraged $925 million project
• Adds to managed lanes (HOT) system that includes I‐495 Express Lanes
• Virginia’s contribution of $409 million leveraged the $1.7 billion I‐495 project
TRANSFORM I‐66 MANAGEDLANES PROJECT
Multimodal Improvements 25‐miles East from U.S. 15 to I‐495
• 3 General Purpose Lanes, 2 Express Lanes (variable toll)
• Rapid bus and HOV free
• Park and ride facilities
• Request for Qualifications –Spring 2015
• Federal Tier 2 NEPA approval – Late 2015
• Construction 2017

3
ELIZABETH RIVER TUNNEL PROJECT
• New Midtown Tunnel ‐‐Norfolk to Portsmouth
• Rehabilitation of existing Midtown & Downtown tunnels
• Construction of Martin Luther King (MLK) Extension connecting the two tunnels
• Six of 11 tunnel elements immersed
• More than 50% complete• On Time, On Budget
HAMPTON ROADS TRANSPORTATION ACCOUNTABILITY COMMISSION
• Run multiple scenarios to
see the cause and effect
of different assumptions
• Forecast project costs,
revenues and funding
availability
• Informs decisions on
project and program
delivery
VAP3‐developed capital planning tool allows regional bodyto evaluate scenarios of project mix, prioritization,
financing and delivery.

4
PIPELINE OF P3 PROJECTS
ELEMENTS OF VIRGINIA SUCCESSES
Virginia’s P3
Program
Public Sector Capacity
Risk Analysis &
Optimization
Political/ Public Support
Standardized Processes
Pipeline of Projects
P3 Law
1
STRICTLY CONFIDENTIALSTRICTLY CONFIDENTIAL
The P3 Challenge for A/E Firms
ACEC Conference
April 20, 2015
PAGE 1STRICTLY CONFIDENTIAL MacquarieCapital
"Macquarie Capital" refers to Macquarie Capital Group Limited, its worldwide subsidiaries and the funds or other investment vehicles that they manage. Macquarie Capital Group Limited is an indirect, wholly-owned subsidiary of Macquarie Group Limited.
This document and its contents are confidential to the person(s) to whom it is delivered and should not be copied or distributed, in whole or in part, or its contents disclosed by such person(s) to any other person. Notwithstanding the foregoing, the recipient (which includes each employee, representative, or other agent of the recipient) is hereby expressly authorized to disclose to any and all persons, without limitation of any kind, the tax structure and US federal income tax treatment of the proposed transaction and all materials of any kind (including opinions and other tax analysis) if any, that are provided to the recipient related to the tax structure and US federal income tax treatment.
This document does not constitute an offer to sell or a solicitation of an offer to buy any securities. It is an outline of matters for discussion only. You may not rely upon this document in evaluating the merits of investing in any securities referred to herein. This document does not constitute and should not be interpreted as either an investment recommendation or advice, including legal, tax or accounting advice.
Future results are impossible to predict. Opinions and estimates offered in this presentation constitute our judgement and are subject to change without notice, as are statements about market trends, which are based on current market conditions. This presentation may include forward-looking statements that represent opinions, estimates and forecasts, which may not be realized. We believe the information provided herein is reliable, as of the date hereof, but do not warrant its accuracy or completeness. In preparing these materials, we have relied upon and assumed, without independent verification, the accuracy and completeness of all information available from public sources.
Nothing in this document contains a commitment from any member of Macquarie Capital to subscribe for securities, to provide debt, to arrange any facility, to invest in any way in any transaction described herein or otherwise imposes any obligation on Macquarie Capital. Macquarie Capital does not guarantee the performance or return of capital from investments. Any participation by Macquarie Capital in any transaction would be subject to its internal approval process.
None of the entities noted in this document are authorized deposit-taking institutions for the purposes of the Banking Act 1959 (Commonwealth of Australia). The obligations of these entities do not represent deposits or other liabilities of Macquarie Bank Limited ABN 46 008 583 542 (MBL). MBL does not guarantee or otherwise provide assurance in respect of the obligations of these entities.
CIRCULAR 230 DISCLOSURE
Macquarie Capital does not provide any tax advice. Any tax statement herein regarding any US federal income tax is not intended or written to be used, and cannot be used, by any taxpayer for the purpose of avoiding any penalties. Any such statement herein was written to support the marketing or promotion of the transaction(s) or matter(s) to which the statement relates. Each taxpayer should seek advice based on the taxpayer's particular circumstances from an independent tax advisor.
2015 Macquarie Capital (USA) Inc.
Important notice and disclaimer

2
01 Insert divider title 3
A Insert divider title 7
ContentsContents
STRICTLY CONFIDENTIALSTRICTLY CONFIDENTIAL
01 History of P3s in the US 3
02 Project Pipeline 7
03 The Future of P3s 9
04 Equity Available 11
05 Contact Information 13
STRICTLY CONFIDENTIALSTRICTLY CONFIDENTIAL
History of P3s in the US
01

3
PAGE 4STRICTLY CONFIDENTIAL MacquarieCapital
States with Public-Private Partnership Authorization– 1995
Legal Authority Grows
States without PPP AuthorityStates with PPP Authority
States with Public-Private Partnership Authorization – 2015
Puerto Rico
PAGE 5STRICTLY CONFIDENTIAL MacquarieCapital
States with dedicated Public-Private Partnership Offices
Managing A Public Private Partnership
States without PPP OfficesStates with PPP Offices
Puerto Rico

4
PAGE 6STRICTLY CONFIDENTIAL MacquarieCapital
Revenue Risk
Availability Payment
Route 1 Gateway
407 East PH 1
Waterloo LRT
Windsor-Essex Pkwy
Edmonton Ring Rd
SE Calgary Ring Road
Golden Ears Bridge
Denver FasTracks
I-69 Sec. 5
East End (ORB)
I-4 Ultimate Project
Port of Miami Tunnel
I-595 Corridor
Tolled Traffic
Goethals Bridge
Autoroute 30
S. Fraser Perimeter Road
Windsor-Essex Pkwy
I-69 Sec. 5
NTE Parts 1&2
SH 130 Seg. 5&6
IH-635 LBJ Freeway
Midtown Tunnel
I-895 Pocahontas Parkway
I-95 Express Lanes
I-495 Capital Beltway
Dulles Greenway
Autoroute 25
Overview of P3 MarketTOP 30 NORTH AMERICAN DEALS CLOSED 2005-PRESENT
Puerto Rico
$37,265 million$2,265 million $615 million
Total Value of Concessions:$40,145 million
Transit (2) Airports (1) Roads (27)
STRICTLY CONFIDENTIALSTRICTLY CONFIDENTIAL
Project Pipeline
02
5
PAGE 8STRICTLY CONFIDENTIAL MacquarieCapital
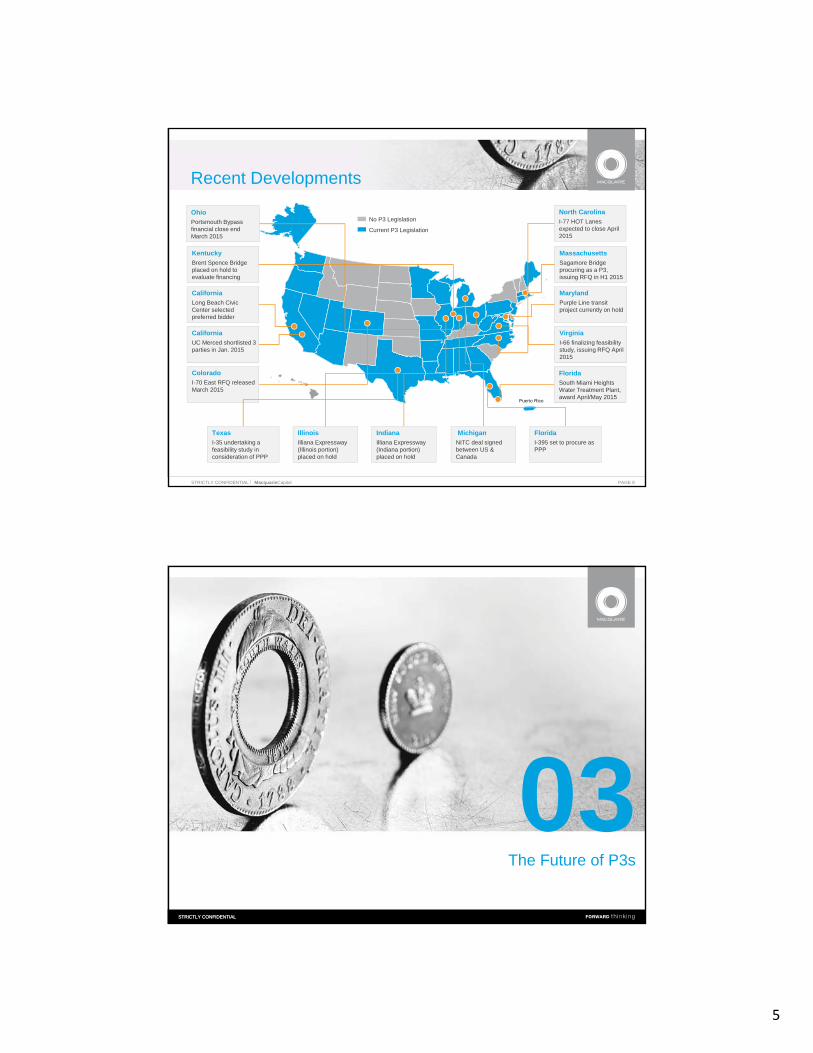
No P3 Legislation
Current P3 Legislation
Virginia
I-66 finalizing feasibility study, issuing RFQ April 2015
California
Long Beach Civic Center selected preferred bidder
Puerto Rico
Ohio
Portsmouth Bypass financial close end March 2015
Indiana
Illiana Expressway (Indiana portion) placed on hold
Maryland
Purple Line transit project currently on hold
North Carolina
I-77 HOT Lanes expected to close April 2015
Kentucky
Brent Spence Bridge placed on hold to evaluate financing
Recent Developments
Massachusetts
Sagamore Bridge procuring as a P3, issuing RFQ in H1 2015
Florida
I-395 set to procure as PPP
Illinois
Illiana Expressway (Illinois portion) placed on hold
Michigan
NITC deal signed between US & Canada
Colorado
I-70 East RFQ released March 2015
California
UC Merced shortlisted 3 parties in Jan. 2015
Texas
I-35 undertaking a feasibility study in consideration of PPP
Florida
South Miami Heights Water Treatment Plant, award April/May 2015
STRICTLY CONFIDENTIALSTRICTLY CONFIDENTIAL
The Future of P3s
03

6
PAGE 10STRICTLY CONFIDENTIAL MacquarieCapital
Where Can P3s Be Used?
Prisons
Parking
Bridges
Power
Water
Schools
Telecom Services
Ports
Hospitals
CourthousesRail
Roads
Airports
Universities
STRICTLY CONFIDENTIALSTRICTLY CONFIDENTIAL
Equity Available
04
7
PAGE 12STRICTLY CONFIDENTIAL MacquarieCapital
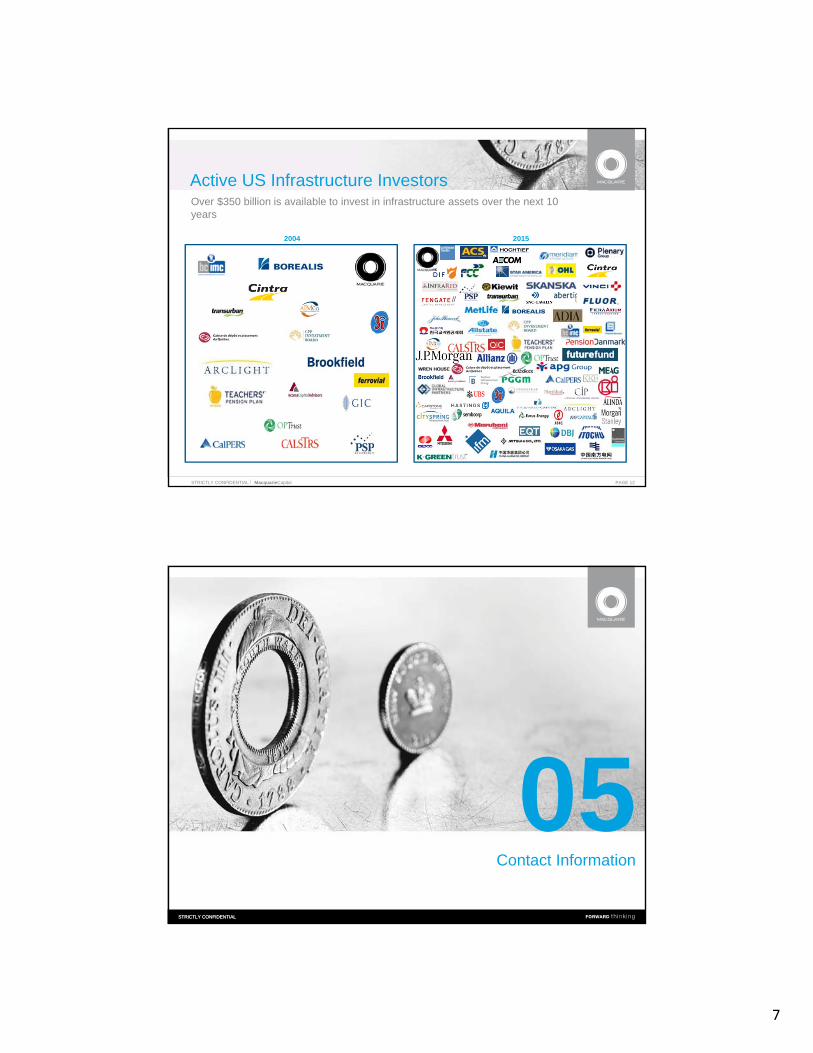
Over $350 billion is available to invest in infrastructure assets over the next 10 years
20152004
Active US Infrastructure Investors
STRICTLY CONFIDENTIALSTRICTLY CONFIDENTIAL
Contact Information
05
8
PAGE 14STRICTLY CONFIDENTIAL MacquarieCapital
D.J. Gribbin
Head, Government Advisory and Affairs
Macquarie Capital
125 W 55th Street, Level 16
New York, NY 10019
(646) 204-6772
Contact Information

1
Sallye PerrinSenior Vice President Parsons Brinckerhoff
Since 2008, P3s have been used to deliver over $27 bn of transportation infrastructure◦ 21 projects (highway/bridge/rail)◦ Trending to close 3 P3s per year ($2.5 bn in 2015)◦ Cap Ex portion of bids have been consistently 10%
to 30% below engineers estimates◦ Schedules have been accelerated on average by 4
months So how did we get here?.................

2

3
In P3s, A/Es are joining Developer/Concessionaire teams. ◦ Local knowledge and relationships are still important ◦ Innovation, efficiencies, and life cycle come into play.
P3s come with lots of agreements. ◦ The Developer/Concessionaire will pass down risks to
the D/B. ◦ D/B will pass those risks to down to the A/E. ◦ Each agreement will be unique.
Opportunity to increase profits and share in the value of our work

4
SPVSpecial Purpose
VehicleDebt
FinancialEquity
ContractorEquity
O&M JV
ConstructionJV
HoldCo
Designer Contractor
Concession orComprehensive Development
Agt (CDA)
Public Sector
TechnicalAdvisor
FinancialAdvisor
TechnicalAdvisor
FinancialAdvisor
O&M Provider
TechnicalAdvisor
P3s and alternative design are becoming acceptable options for delivering large complex projects
35+ states have P3 legislation in place Because of financing, P3s allow state DOTs to
advance major projects that would otherwise sit on the books for years…..
Project Neon and AZ 202 are now D/B. P3 failures can still mean projects are getting built
5
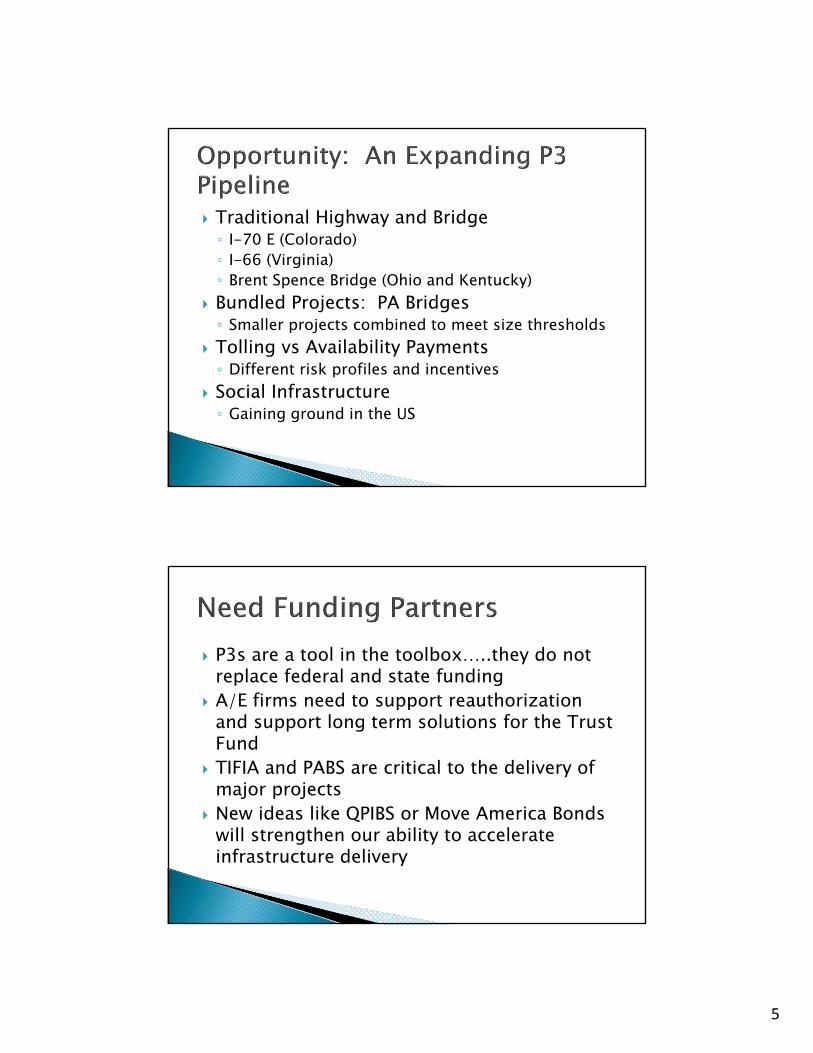
Traditional Highway and Bridge◦ I-70 E (Colorado)◦ I-66 (Virginia)◦ Brent Spence Bridge (Ohio and Kentucky)
Bundled Projects: PA Bridges◦ Smaller projects combined to meet size thresholds
Tolling vs Availability Payments◦ Different risk profiles and incentives
Social Infrastructure◦ Gaining ground in the US
P3s are a tool in the toolbox…..they do not replace federal and state funding
A/E firms need to support reauthorization and support long term solutions for the Trust Fund
TIFIA and PABS are critical to the delivery of major projects
New ideas like QPIBS or Move America Bonds will strengthen our ability to accelerate infrastructure delivery

6
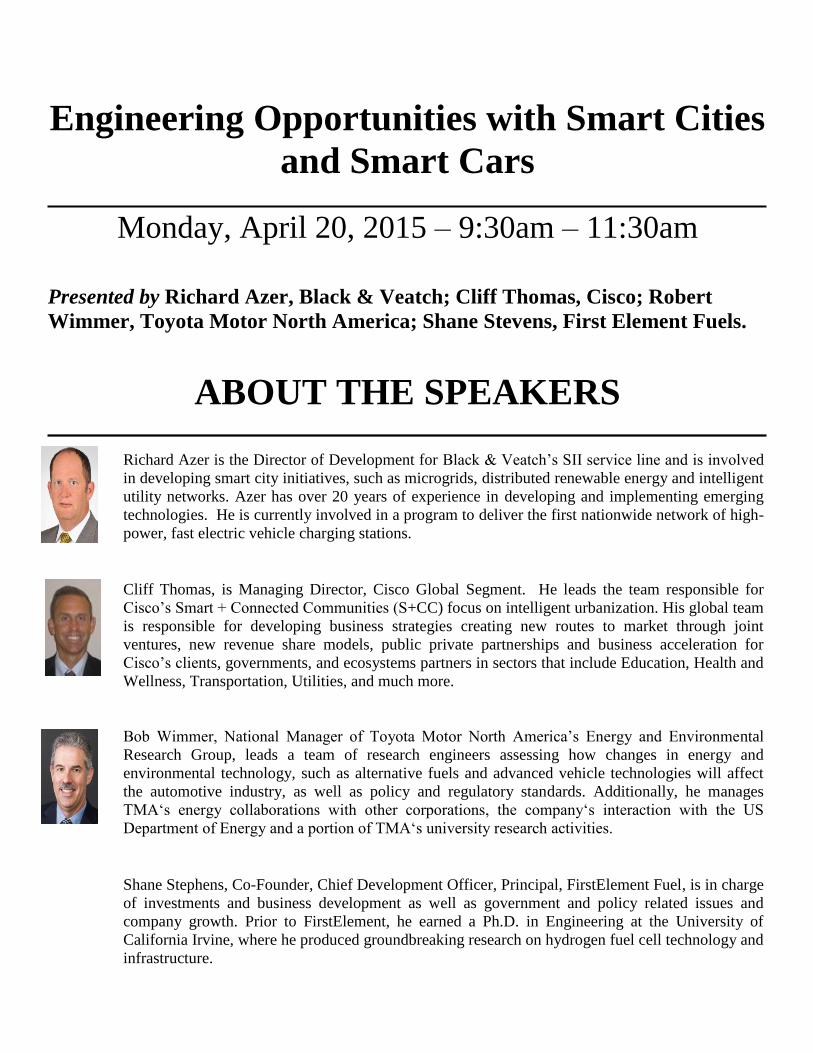
Engineering Opportunities with Smart Cities
and Smart Cars
Monday, April 20, 2015 – 9:30am – 11:30am
Presented by Richard Azer, Black & Veatch; Cliff Thomas, Cisco; Robert
Wimmer, Toyota Motor North America; Shane Stevens, First Element Fuels.
ABOUT THE SPEAKERS
Cliff Thomas, is Managing Director, Cisco Global Segment. He leads the team responsible for
Cisco’s Smart + Connected Communities (S+CC) focus on intelligent urbanization. His global team
is responsible for developing business strategies creating new routes to market through joint
ventures, new revenue share models, public private partnerships and business acceleration for
Cisco’s clients, governments, and ecosystems partners in sectors that include Education, Health and
Wellness, Transportation, Utilities, and much more.
Bob Wimmer, National Manager of Toyota Motor North America’s Energy and Environmental
Research Group, leads a team of research engineers assessing how changes in energy and
environmental technology, such as alternative fuels and advanced vehicle technologies will affect
the automotive industry, as well as policy and regulatory standards. Additionally, he manages
TMA‘s energy collaborations with other corporations, the company‘s interaction with the US
Department of Energy and a portion of TMA‘s university research activities.
Shane Stephens, Co-Founder, Chief Development Officer, Principal, FirstElement Fuel, is in charge
of investments and business development as well as government and policy related issues and
company growth. Prior to FirstElement, he earned a Ph.D. in Engineering at the University of
California Irvine, where he produced groundbreaking research on hydrogen fuel cell technology and
infrastructure.
Richard Azer is the Director of Development for Black & Veatch’s SII service line and is involved
in developing smart city initiatives, such as microgrids, distributed renewable energy and intelligent
utility networks. Azer has over 20 years of experience in developing and implementing emerging
technologies. He is currently involved in a program to deliver the first nationwide network of high-
power, fast electric vehicle charging stations.

DoD Infrastructure Programs
Monday, April 20 – 2:00pm – 4:00pm
Presented by Miroslav Kurka, Mead and Hunt; Patricia Coury, Office of the
Assistant Secretary of Defense; Beth Lachman, Rand; Lucian Niemeyer, The
Niemeyer Group, LLC
A panel of OMB and Dept. of Defense officials.
ABOUT THE SPEAKERS
Miro Kurka, PE, PMP, COL USA (Ret) leads Mead & Hunt’s Water Resources Group. He has
oversight responsibilities for all design project managers and is responsible for technical
planning and analysis, project management, developing project work scopes and negotiating
task orders. Miro has successfully managed numerous large planning and feasibility studies and
was Principal-In-Charge of a highly successful new hydroelectric project on an existing United
States Army Corps of Engineers (USACE) dam.
Beth Lachman is a policy analyst in RAND's Washington office. Her expertise includes
systems analysis of environmental problems, environmental science and technology policy,
sustainable development policy, mathematical modeling and GIS analysis of urban systems.
Ms. Lachman is currently leading a project to analyze federal, state, and local government
collaboration in the development and implementation of environmental technologies for
sustainability.
Lucian Niemeyer recently retired from the United States Senate Committee on Armed Services
after 11 years and formed the Niemeyer Group, LLC, offering business development strategies
and consulting expertise on national defense issues. He is currently partnering with numerous
firms to establish project-specific teams dedicated to efficiently and effectively meeting client
goals as well as speak publicly and lecture on federal legislative and national defense issues.
Patricia Coury spent the first 20+ years of her professional career with the U.S. Army Corps of
Engineers. She is responsible for programmatic oversight and policy development affecting the
cradle-to-grave life cycle for DoD’s worldwide facilities, the management of defense
installations, and the Department’s government-owned, leased and privatized housing and
privatized lodging.

1
DOD Infrastructure ProgramsThe Congressional Perspective
Lucian Niemeyer ([email protected]) March 2015
American Council of Engineering Companies
Congressional Issues Affecting Engineering Companies
• Sequestration of Defense Budgets• Forecast for Facility Investment Accounts
•Armed Forces Reductions
• Specter of BRAC Authorization• Intergovernmental Support Agreements
•Public Private Initiatives

2
Sequestration of Defense Budgets
The Budget Control Act of 2011• Mandates that the “base” Defense Budget will be sequestered to $499 billion in FY 2016 – Congress will not repeal.
• A $35 billion reduction over President’s Budget Request
Funds for Overseas Contingency Operations (OCO)• Intended for combat operations in Afghanistan and elsewhere
• “Off‐Budget” Emergency Supplemental Appropriations
• President Requested $51 Billion for DOD in FY16 – about $25 Billion more than needed based on historical expenses in theater
• Congress will add another $38 Billion to OCO for DOD in FY16• Intended to offset sequestration without raising non‐security spending
Forecast of Facility Investment Accounts
Military Construction• Good News ‐ FY2016 Total DOD MILCON request of $8.4 Billion is $1.8 Billion more than the FY15 enacted amount for MILCON of $6.6 Billion.
• Bad News – MILCON is subject to sequestration (about 10‐15% cut)
• DOD projects MILCON to be flat through Future Years Defense Program (FYDP) ‐unsequestered
• FY17 ‐ $8.7 B; FY18 ‐ $8.5 B; FY19 ‐ $7.9 B; FY20 ‐ $7.1 B
Facility Sustainment, Restoration, Modernization (FSRM)• DOD continues to take risk in facility sustainment accounts
• The FY2016 DOD request of $10.8 billion is better than the FY15 enacted amount of $9.0 billion, but well below the FY2014 amount of $13.3 Billion
• Congress may add small amounts back to FSRM in 2016, but still not enough to meet goals for 90% of sustainment requirement
3
Armed Force Reductions
Army• Currently 490,000 Active duty soldiers with an FY2016 President’s Budget request to drop to 475,000.
• Army is planning for sequestration to require Army to drop to 420,000
• Will have a dramatic impact on installations and housing privatization
Navy/USMC• Navy requires a 308 ship fleet to meet COCOM requirements • Currently at 272 ships after Congressional rejection of cruiser/LPD retirements• Competing pressures from sequestration and huge capital investments (Ohio Class submarine replacement, aircraft carrier construction, next small surface combatant) leaves future size of the fleet uncertain.
• Impact to shore infrastructure and facility investments Air Force
• Trying to retire weapon systems – rejected by Congress
Specter of BRAC AuthorizationDepends on the Positions of the “Big 4”• HASC Chairman – No BRAC Until sequestration fixed and force structure stabilized
• HASC RM – Supports BRAC and has drafted legislation• SASC Chairman – Included in letter to the Budget committee an endorsement of management reforms “that could reduce or consolidate military headquarters, commands and infrastructure.”
• SASC RM ‐ Endorsed a need for a BRAC round in a hearing on March 3 with Secretary Carter
Scorecard ‐ That’s 2 for, 1 against, and 1 unknown who was a primary BRAC advocate in 2001 for the 2005 round.

4
Spector of BRAC Authorization
Other Positions• SASC Readiness Chair – “Even after acknowledging the shortcomings of the 2005 round, the department continues to request the same legislative framework…I remain opposed to BRAC and do not want to give the department the open‐ended authority to pursue another BRAC round that has the potential to incur significant upfront costs”
• HASC Readiness Chair – Will propose again legislation for a BRAC facility capacity analysis – this time with force structure assumptions
• OSD/Installations – Open to discussion on changes to legislation –offered an overall cap on total BRAC implementation costs
• USAF – Updated estimate of 30% excess facilities (24% last year)• Army – Even at 490,000 soldier end strength – 18% excess facilities• Navy – “We’re good.”
Intergovernmental Support Agreements
Congress established Section 2336 of Title 10 USC in 2013
• Authorizes the military services to enter into agreement with a State or local government to provide, receive, or share installation‐support services if the Secretary determines that the agreement will serve the best interests of the department.
•Many defense communities are seeking agreements with DOD for shared utility and infrastructure maintenance or operations.
• Potential for engineering companies to facilitate the agreements
• Still considered a new authority as Services wrestle with templates, level of effort, and applicability of Federal Acquisition Regulations
5
Public Private InitiativesCongress Continues to Provide Pilot Legislative Authorities for certain programs•Military Housing Privatization is transitioning to long‐term maintenance phase with pressure from proposed reductions in the Base Allowance for Housing (BAH)
• Congress may expand legislation for utilities privatization to incorporate stormwater and allow for system expansion
• DOD using Power Purchase Agreements to facilitate construction of renewable energy sources – Congress may redirect investments to on base energy resiliency
• Renewable energy goals may be reassessed by new Congress.Renewed effort by industry and Congress to address OMB scoring with updates to OMB Circular A‐11
Questions?Lucian Niemeyer
March 2015
American Council of Engineering Companies

DoD Infrastructure Programs: Key Trends that
Will Shape Installations of Tomorrow
Beth Lachman
RAND Corporation
April 20, 2015
American Council of Engineering Companies
2015 Spring Convention
2
Key U.S. Trend Areas that Will Affect Installations
Topic Area Main Trend Area Infrastructure
Implications ?
Water Issues Water scarcity Yes
Sustainable Building Practices and
Sustainable buildings Yes
Energy Technologies Energy Yes
Community and Sustainable communities Yes
Transportation Design Sustainable transportation Yes
Encroachment
Urbanization and increased development
Indirect
Loss of biodiversity Indirect
Societal trends ??
Quality of Life Online communities ??
Issues Pervasive computing ??
Sustainable agriculture No

3
• U.S. water trends: – Clean water becoming significantly more scarce
– More and more people using limited water supplies
– More local and other government restrictions on water use
– More water partnerships and collaboration activities
• Implications for DoD installations: – May have installation operational restrictions because of water
shortages and water restrictions
– Will cost significantly more later if wait to address – Need for innovative, efficient, and collaborative investments
• Regional partnerships, ESPCs, UESCs, EULs,technologies, etc.
• Benefits to DoD strategic actions: – Provide significant cost savings
– Prevent water from becoming an operational problem – Help meet future requirements and improve environmental quality
– Improved community relationships
Address Water Issues to Avoid Significant Future Costs
4
Implement Sustainable Building Practices to Avoid Significant Future Costs
• Sustainable building trends: – State and local building codes, voluntary standards, and labeling
programs define higher and higher performance goals – More best practices for building management that save money over the
long term, such as commissioning and life-cycle analysis (LCA) – Federal, state, and local requirements for more sustainable buildings – Likely more emphasis on LCA, green procurement, and designing
buildings for reducing waste and deconstruction
• Implications for DoD installations: – If wait to act, will miss significant cost savings if have less efficient
buildings and will have high future costs to retrograde buildings for stricter requirements
– Need for investment in sustainable and strategic building improvements to save money over the long term
• Benefits to DoD strategic actions: – Provide significant cost savings with more efficient buildings – Able to meet future stricter requirements more efficiently and improve
environmental quality

5
Implement Efficient Energy Technologies to Avoid Significant Future Costs
• Energy trends: – Energy demand and prices will continue to rise – Renewable power generation and use of natural gas growing – Increasing federal, state, and local requirements for increased
investments in efficiency and renewable energy technologies
– Improvements in energy technology performances and costs • Implications for DoD installations:
– If wait to act, will miss significant cost savings if using less energy efficient technologies and incur high future costs to implement energy technologies to meet stricter requirements
– Need for innovative investments in energy efficiency and renewable energy technologies • Partnerships, ESPCs, UESCs, PPAs, etc.
• Benefits to DoD strategic actions: – Provide significant cost savings with improved energy
technologies
– Able to meet future stricter requirements more efficiently and improve environmental quality
6
Strategically Address the Design of Installation Communities
• Key sustainable community trends: – Emphasis on land use planning, compact development, growth
management, and community design • Traditional neighborhood development (TND)/New urbanism
– Development of industrial ecology/eco-industrial parks – Improved waste management, such as composting & waste-to-
energy • Implications for DoD installations:
– If wait to act, high cost to redo community infrastructure in the future and a decrease in installation land-use flexibility
– Need to include more compact development and community design principles in installation master plans
– Should explore eco-industrial park pilots with neighboring industry
• Benefits to DoD strategic actions: – Help save costs with compact development – Environmental quality and aesthetic improvements – Military personnel and family Quality of Life (QOL) improvements

7
Strategically Address Transportation Design
• Key sustainable transportation trends: – Emphasis on compact land use and less personal vehicle travel
because of the benefits to the environment, mobility, QOL, and community
– Increasing number of diverse personal mobility options, such as car sharing
– More electric and other alternative energy vehicles – More transportation system planning and operations improvements
• Implications for DoD installations: – If wait to act, in the future, will incur a high cost to redo
transportation infrastructure and have more traffic congestion and environmental problems
– Need to include more sustainable transportation planning • Infrastructure and activities that encourage decreased personal vehicle
travel, such as car sharing, more convenient buses, and bike lanes • Benefits to DoD strategic actions:
– Help save costs with better transportation planning – Environmental quality improvements – Military personnel and family Quality of Life (QOL) improvements
8
Strategically Address Encroachment
• Key Encroachment Trends: – Increases in incompatible development from nearby sprawling
communities and continuing significant loss of biodiversity • More likely to have more political, policy, and regulatory activities
protecting biodiversity • More likely to have more threatened and endangered species
(T&ES) – Causes encroachment for training and other operations – More restrictions on training and building activities
• Implications for DoD installations: – If do not address, likely to have major restrictions on
installation testing, training and other operations from more incompatible development and more T&ESs and very high future costs if not impossible to address later
– Develop partnerships with communities on growth management and to protect habitat surrounding installations
• Benefits to DoD strategic actions: – Help prevent installation encroachment and T&ESs, preserve
installation operational flexibility, and save high future costs
9
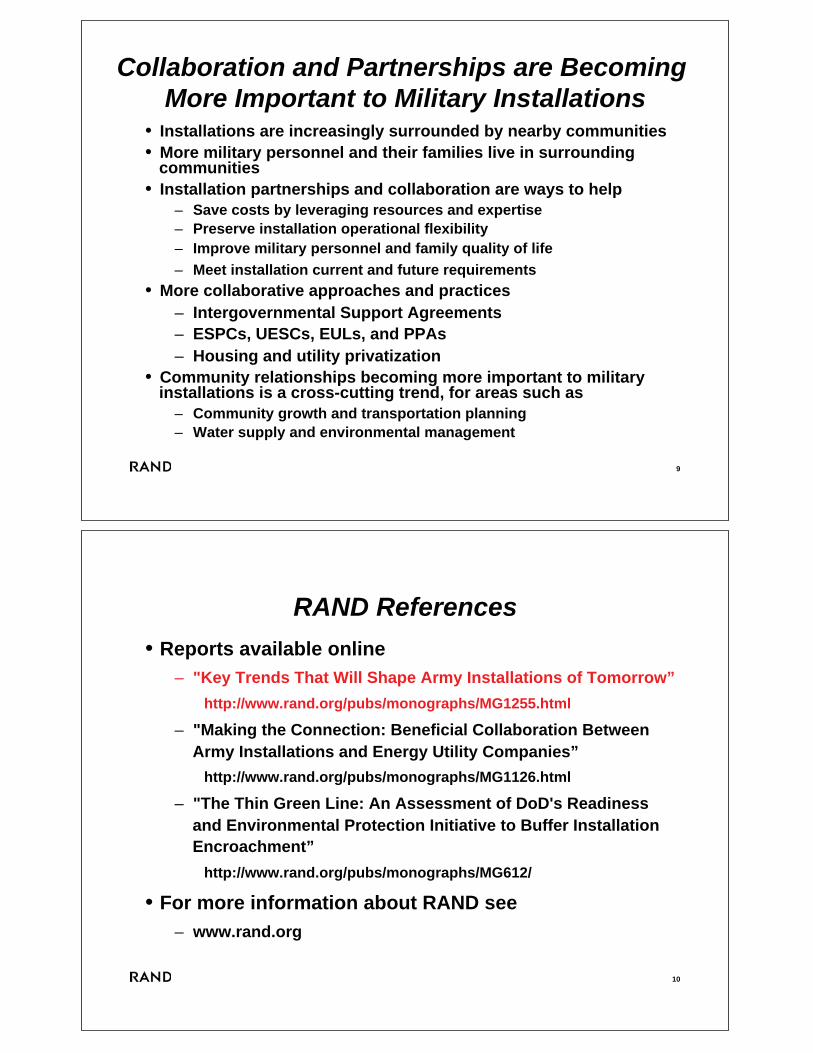
Collaboration and Partnerships are Becoming More Important to Military Installations
• Installations are increasingly surrounded by nearby communities • More military personnel and their families live in surrounding
communities • Installation partnerships and collaboration are ways to help
– Save costs by leveraging resources and expertise – Preserve installation operational flexibility – Improve military personnel and family quality of life
– Meet installation current and future requirements • More collaborative approaches and practices
– Intergovernmental Support Agreements – ESPCs, UESCs, EULs, and PPAs – Housing and utility privatization
• Community relationships becoming more important to military installations is a cross-cutting trend, for areas such as
– Community growth and transportation planning – Water supply and environmental management
10
RAND References
• Reports available online
– "Key Trends That Will Shape Army Installations of Tomorrow”
http://www.rand.org/pubs/monographs/MG1255.html
– "Making the Connection: Beneficial Collaboration Between Army Installations and Energy Utility Companies”
http://www.rand.org/pubs/monographs/MG1126.html
– "The Thin Green Line: An Assessment of DoD's Readiness and Environmental Protection Initiative to Buffer Installation Encroachment”
http://www.rand.org/pubs/monographs/MG612/
• For more information about RAND see
– www.rand.org

2 Dec Joint Base WG: ITSM COLS Changes 1
Acquisition, Technology and Logistics
DoD Infrastructure Programs
Patricia L. Coury Deputy Director
Facilities Investment & ManagementOffice of the Assistant Secretary of Defense
(Energy, Installations and Environment)
Acquisition, Technology and Logistics
DoD Real Property Portfolio
• 562,600 Facilities– 284,458 buildings ($484B Plant Replacement Value)
• 191,309 owned; 7,519 leased; 85,630 other • 2.18B sq ft
– 176,931 Structures– 101,211 Linear Structures
• 24.7M Acres – 98% in U.S.
• 523 Installations– 4,855 DoD Sites (86% in U.S.)
(Data as of Sep 2014)
2

2 Dec Joint Base WG: ITSM COLS Changes 2
Acquisition, Technology and Logistics
Base Realignment & Closure (BRAC)
• DoD has requested BRAC authority the past three years– 2004 DoD capacity assessment indicated 24% aggregate excess
– 2015 Budget testimony:
• Air Force - 30% excess capacity
• Army - 18% excess capacity
• BRAC 2005 reduced just 3.4% of DoD’s infrastructure as measured in Plant Replacement Value (PRV) – BRAC 2005 focused primarily on transformation rather than
efficiency
• Transformation recommendations cost $29B for $1B annual savings
• Efficiency recommendations cost $6B for $3B annual savings
– Subsequent force structure reductions point to additional excess capacity
• Large private companies would not retain excess capacity
3
DoD Options Limited
Acquisition, Technology and Logistics
European Infrastructure Consolidation (EIC)
• Holistic, joint review completed Jan 2015– Focused on reducing our European footprint while continuing to
support operational requirements and strategic commitments
– Used a BRAC-like process to review capacity, requirements, military value, cost, and diplomatic dynamics
– 26 recommendations
• ROI – Expected $800M cost to construct facilities at receiving sites
– Anticipated $500M annual, recurring savings once all actions implemented
• Majority of $800M in construction supports:– RAF Mildenhall - restationing of 3200 U.S. personnel elsewhere
– Offset slightly by 1,200 personnel that will support F-35s being stationed at nearby RAF Lakenheath
– Consolidation of Joint Intelligence Analysis Facilities at RAF Croughton4
2 Dec Joint Base WG: ITSM COLS Changes 3
Acquisition, Technology and Logistics
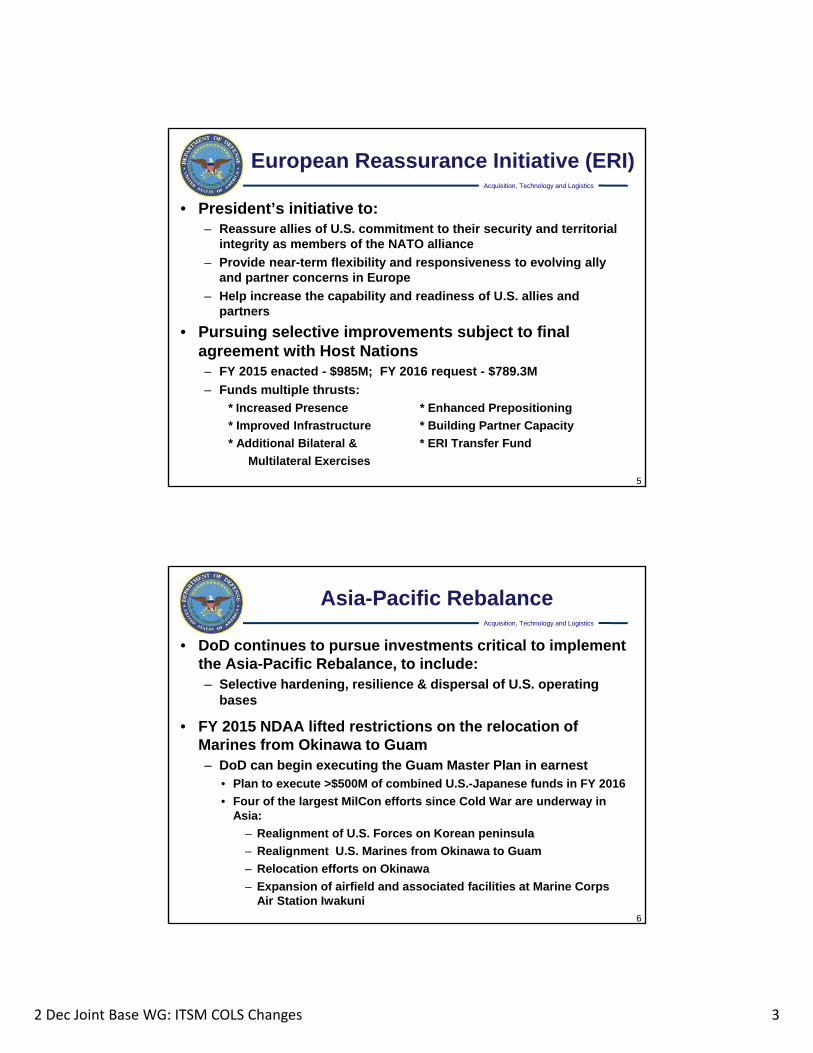
European Reassurance Initiative (ERI)
• President’s initiative to:– Reassure allies of U.S. commitment to their security and territorial
integrity as members of the NATO alliance
– Provide near-term flexibility and responsiveness to evolving ally and partner concerns in Europe
– Help increase the capability and readiness of U.S. allies and partners
• Pursuing selective improvements subject to final agreement with Host Nations– FY 2015 enacted - $985M; FY 2016 request - $789.3M
– Funds multiple thrusts:
* Increased Presence * Enhanced Prepositioning
* Improved Infrastructure * Building Partner Capacity
* Additional Bilateral & * ERI Transfer Fund
Multilateral Exercises
5
Acquisition, Technology and Logistics
Asia-Pacific Rebalance
• DoD continues to pursue investments critical to implement the Asia-Pacific Rebalance, to include:– Selective hardening, resilience & dispersal of U.S. operating
bases
• FY 2015 NDAA lifted restrictions on the relocation of Marines from Okinawa to Guam– DoD can begin executing the Guam Master Plan in earnest
• Plan to execute >$500M of combined U.S.-Japanese funds in FY 2016
• Four of the largest MilCon efforts since Cold War are underway in Asia:
– Realignment of U.S. Forces on Korean peninsula
– Realignment U.S. Marines from Okinawa to Guam
– Relocation efforts on Okinawa
– Expansion of airfield and associated facilities at Marine Corps Air Station Iwakuni
6

2 Dec Joint Base WG: ITSM COLS Changes 4
Acquisition, Technology and Logistics
Facilities Sustainment
• Sep 2013 – Facility Condition Assessment Policy– Standardized DoD-wide facility inspection process using DoD
Sustainment Management System (SMS) software suite (e.g., BUILDER)
– Requires completed inspections using SMS by Sep 2017
– Requires qualified technical personnel
– Supports FCI data necessary to inform programming & budgeting decisions
• Apr 2014 – Facility Sustainment & Recapitalization Policy– Reiterates DoD goal to budget sustainment at > 90% of modeled
requirement
– Established DoD Component inventory-wide average FCI program/budget goals with minimum average FCI > 80%
– Established DoD Component annual business plans for assets with FCIs < 60%
7
Acquisition, Technology and Logistics
Alternative Financing
• Public-Private Partnerships – examples:
– Military Housing Privatization Initiative (10 USC § 2871-2885)
– Enhanced Use Leases (10 USC § 2667)
– Energy Savings Performance Contracts (ESPCs) (42 USC § 8287 & 10 USC § 2913)
– Utility Energy Service Contracts (UESCs) (10 USC § 2913)
• Public-Public Partnerships– Section 331, NDAA 2013 (10 USC § 2679)
• Installation Support Services using Intergovernmental Support Agreements
8
DoD Fully Supports the Use of Third Party Financing

2 Dec Joint Base WG: ITSM COLS Changes 5
Acquisition, Technology and Logistics
9
Questions?
For more information:
http://www.acq.osd.mil/ie/fim/index.shtm
Recommended