Embed Size (px)
Citation preview
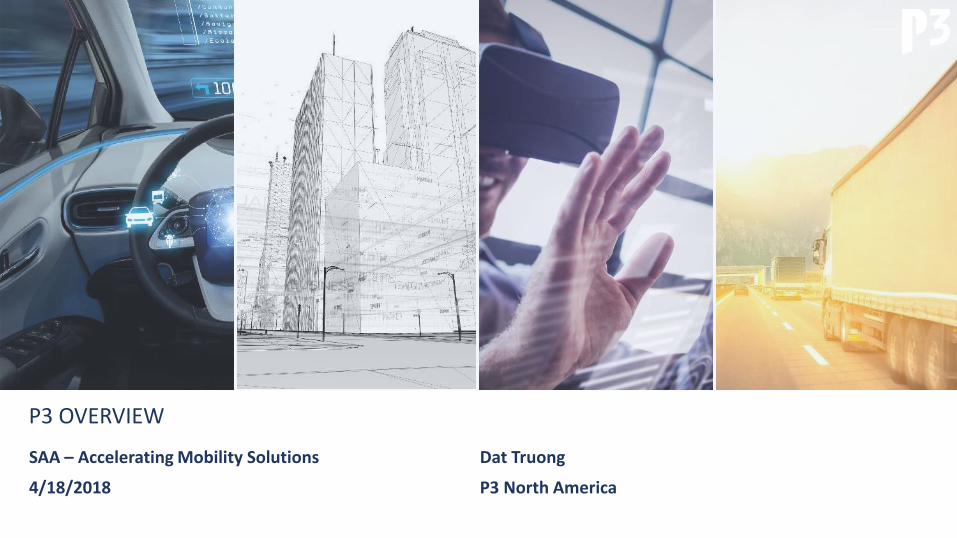
P3 OVERVIEW
SAA – Accelerating Mobility Solutions
4/18/2018
Dat Truong
P3 North America

2© 2018 P3
P3 GROUP – WHAT MAKES US UNIQUE
We bridge our expertise in business and engineering to provideend-to-end solutions.
We work side by side with our clients on business and technicalchallenges ensuring a sustainable result.
MANAGEMENT SUPPORT
ENGINEERINGSOLUTIONS
CONSULTINGSERVICES

3© 2018 P3
P3 GROUP – GLOBAL CONSULTING & ENGINEERING
34%
34%
15%
11%6%
Mechanical Engineering
Electrical Engineering
Industrial Engineering
Business Degree
Other
REVENUE (Million USD)
EMPLOYEE MIX
HEADCOUNT GROWTH
0
200
400
2007 2009 2011 2013 2015 2017
0
2000
4000
2007 2009 2011 2013 2015 2017
30+ SUBSIDIARIES in the whole P3 group
ALMOST 4000 EMPLOYEES from more than 40 nations
>75% OF OUR PEOPLEare engineers
USADallas / Detroit / Durham / Morristown / Portland / Irvine / Wichita
CANADAMontreal / Toronto / Ville St Laurent
MEXICOMexico-City
BRAZILSâo José dos Campos
GERMANYAachen / Berlin / Braunschweig / Bremen / Düsseldorf / HamburgIngolstadt / München/ StuttgartWolfsburg / Köln
FRANCEParis / Toulouse / Marignagne / Nantes
SERBIABelgrade
INDIABangalore
CHINAPeking / Shanghai / Shenzhen
JAPANTokyo
SOUTH AFRICACape Town
AUSTRALIASydney
GREAT BRITAINBristol / London / Hounslow
ITALYRome
SPAINMadrid /Sevilla
ROMANIACluj-Napoca
42 LOCATIONS
4© 2018 P3
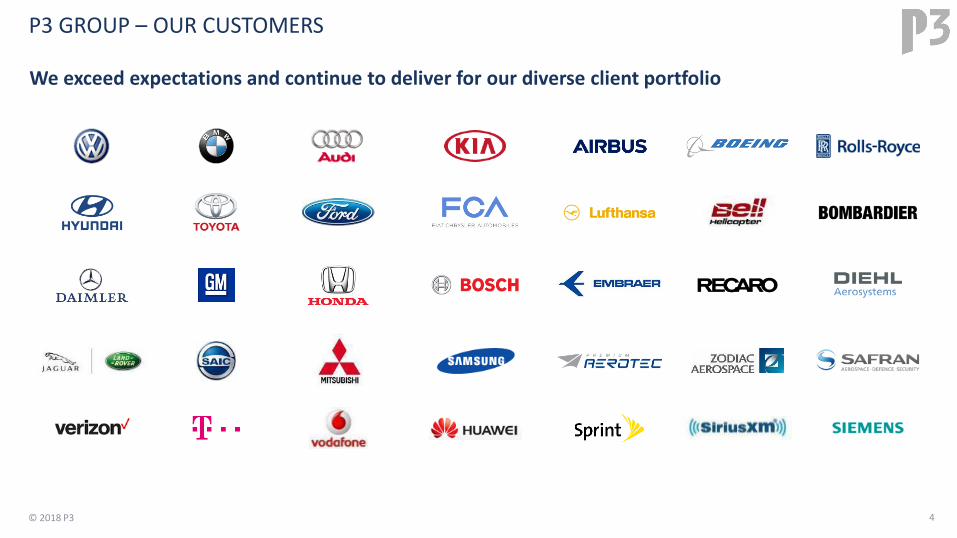
P3 GROUP – OUR CUSTOMERS
We exceed expectations and continue to deliver for our diverse client portfolio

5© 2018 P3
P3 is a global network of innovative and creative experts, servingcustomers in five industries.
P3 GROUP – FOCUS AREAS
AUTOMOTIVEConsulting, management support and testing services for the automotive industry
AEROSPACEConsulting, engineering and implementation services for all major OEMs and their tier 1 suppliers
ENERGYConsulting and innovative, technical solutions for the energy sector
TELECOMMUNICATIONSConsulting, engineering and testing services for the whole telecommunications industry
PUBLIC SECTORConsulting and management support for modernization and optimizing of processes in the public sector.

6© 2018 P3
We intersect our business units through four key technology areas.
P3 NORTH AMERICA – TECHNOLOGY FOCUS
AUTONOMOUS MOBILITY
ELECTRIC MOBILITY
CONNECTED MOBILITY
NEW MOBILITY SERVICES
MANAGEMENT CONSULTING
+
INNOVATIVE ENGINEERING
SOLUTIONS

7© 2018 P3
SYSTEMS ENGINEERING
• Requirements & Specification
Development
• Design Verification (DFMEA/
HARA)
• Design & Modeling
• System Integration
• Shop floor & Quality
improvement
• Smart Factory/ Industry 4.0
• Logistics & Warehouse
• Supplier performance
improvement
Our diverse teams is up for the challenge of bridging the gap between technology and business
P3 NORTH AMERICA – CORE TECHNOLOGY EXPERTISE
TECHNOLOGY & BUSINESS STRATEGY
TEST & VALIDATIONDATA ANALYTICS &
SOFTWARE DEVELOPMENT
TECHNOLOGY DELIVERY MANAGEMENT SERVICES
OPERATIONS & SUPPLIER MANAGEMENT
• HIL/ MIL/ SIL
• Component & System Validation
• Test Automation
• UAT
• App Development & Digitization
• Advanced Analytics &
Visualization
• Digital Strategy & Transformation
• Technology Product Portfolio &
Roadmaps
• Technical and Service Due
Diligence
• Product Costing & Optimization
• Benchmarking
• Business Modeling & Business
Requirements
• Operational System, Process
Design & Development
• Program Management / Agile &
SCRUM
• Planning & Timeline Management
• Supplier & Launch Management
• Organizational Transformation &
Benchmark
PROTOTYPE & TEST EQUIPMENT
• Bench Design & Building
• Vehicle Retrofits
• Prototyping

04/18/2018 8
Dat TruongTechnology and Marketing StrategyP3 North America
+1 248 385 [email protected]
www.p3-group.com
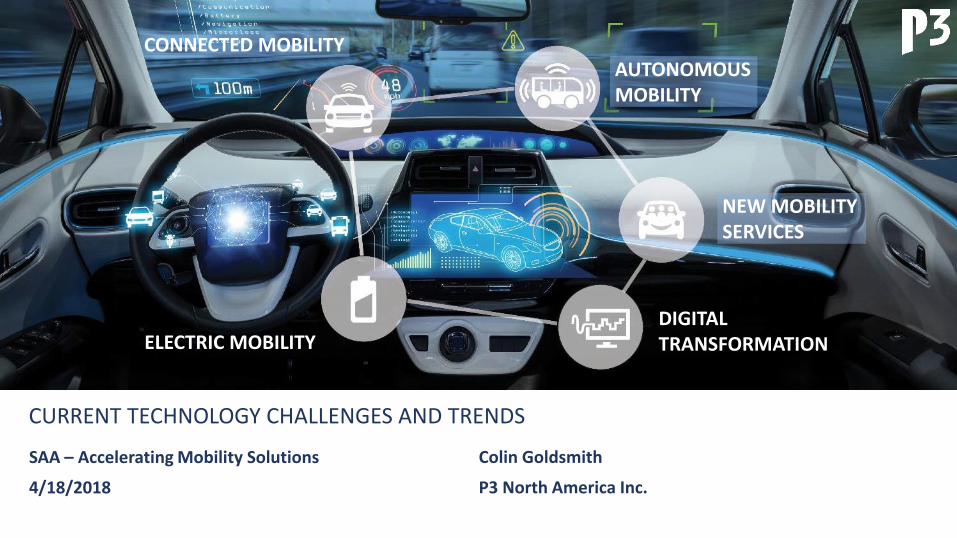
CONNECTED MOBILITYAUTONOMOUS MOBILITY
ELECTRIC MOBILITY
NEW MOBILITY SERVICES
DIGITAL TRANSFORMATION
CURRENT TECHNOLOGY CHALLENGES AND TRENDS
SAA – Accelerating Mobility Solutions
4/18/2018
Colin Goldsmith
P3 North America Inc.

04/18/2018 Current Technology Challenges and Trends 10
The automotive industry is facing tremendous pressure from inside and outside to improve current products but also introduce game changing technologies
Emission Compliance ElectrificationActive Safety/
Autonomous Driving
• Increasing emission compliance pressure in EU and China
• Unsolved real world emission compliance
• Conflicting consumer behavior regarding fleet targets
• Initially driven by emission, turning into competitor driven strategy
• Broad offering of system topologies, increasing vehicle platform complexity
• Legislative pressure for active safety technology as standard features
• Steadily increasing competition from traditional and disruptive OEMs and startups

04/18/2018 Current Technology Challenges and Trends 11
The race for autonomous driving has begun, with high expectations from consumers and industry regarding timing, pricing and value add of technology for drivers and society
98.4 95.8
75.7
2 11.6
28.2
1.5 6.64.4
2020 2025 2030
World Wide Vehicle Sales in Million UnitsSAE Level 5
SAE Level 4
SAE Level 3
SAE Level 0-2
Forecast: P3 (2016)
~100 M#
~109 M#~115 M#
• General market growth stalling, traditional vehicle market driven by emerging countries
• SAE Level 3 and 4 techn. need too prove value add in real life situations
• Trickle down and economies of scale main focus for broader feedback generation
• Semi/fully autonomous driving techn. become standard offering for premium OEMs
• Level 5 vehicles emerging out of special purpose areas into city environments
• Main advantages and value add most likely realizable in urban/mega city environments
• Extensive product hardening and innovative testing & validation concepts (machine learning) needed
• Main challenge relies on driver-vehicle interaction for control transition
• Price sensitive active safety technologies driven by regulation and competition

04/18/2018 Current Technology Challenges and Trends 12
Although most benefits of autonomous driving are undisputed several road blocks have to be addressed fast enough to prevent the failure of a disruptive idea
Automotive Mobility 2025Disruption Drivers Disruption Setbacks
1 More Road Safety
2 More Flexibility
3 More Time
1 Missing Consumer Trust
2 Real-World Complexity for Technology and Development
3 Costs
Avoidance of 95% of all typical accident causes, e.g. speeding, distraction, running red lights/stop signs, wrong way
Increase of traffic flows in congestion areas
Average daily commuting time in the US approx. 45-65 minutes that could be used for value added activities, e.g. relaxation, working, entertainment
Decreasing of vehicle ownership enables consumers to use vehicle concepts adapting to daily changing needs without paying more than today
Only 25% of Generation X show trust in AD technology.
Generation Y/Z much less critical (55% in favor)
Additional costs for semi/fully autonomous features of $5000-8000 can only be covered within premium vehicles initially, fast commoditization necessary for broader applications
Special environments (rural, city, bad weather) with high complexity and ambiguity still main concern regarding reliability and safety of autonomous vehicles

13© 2018 P3
Most OEMs Have Announced Aggressive Timelines for Automated Driving Development
2021 2025Today
SAE Level 2
SAE Level 3
SAE Level 4
SAE Level 5
AD
AS
Sem
i-A
DFu
lly-A
D
Source: P3 researchUnclear (pro-pilot is level 2+, “fully
autonomous” by 2022)
2018 2019 2020 2022 2023 2024
?
14© 2018 P3
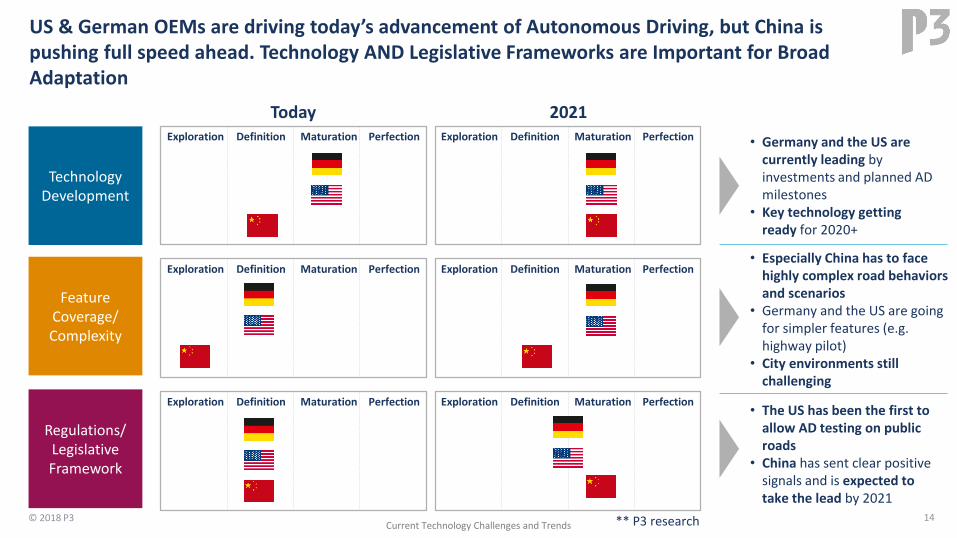
US & German OEMs are driving today’s advancement of Autonomous Driving, but China is pushing full speed ahead. Technology AND Legislative Frameworks are Important for Broad Adaptation
Technology Development
Feature Coverage/ Complexity
Regulations/ Legislative Framework
Exploration PerfectionMaturationDefinition
Today 2021
Exploration PerfectionMaturationDefinition
Exploration PerfectionMaturationDefinition
• Germany and the US are currently leading by investments and planned AD milestones
• Key technology getting ready for 2020+
• Especially China has to face highly complex road behaviors and scenarios
• Germany and the US are going for simpler features (e.g. highway pilot)
• City environments still challenging
• The US has been the first to allow AD testing on public roads
• China has sent clear positive signals and is expected to take the lead by 2021
** P3 research
Exploration PerfectionMaturationDefinition
Exploration PerfectionMaturationDefinition
Exploration PerfectionMaturationDefinition
Current Technology Challenges and Trends

15© 2018 P3
Complexity Map
AUTONOMOUS DRIVING REQUIRES A MYRIAD OF COMPETENCIES
Test and Validation
Technology
HD Maps
3rd Party Services
HiL
4G 5G
Car2X
Infrastructure
Path Planning
UserExperience
Central Process.
Data Management
Virtual Testing
PreemptiveHMI
New Business Models
New EE Platforms
HW/ SW Frameworks
Big Data
Sensors
Autonomous Driving
Success Factors
SiL
Cost Optimization
Ubiquitous Avail.
Machine Learning
Data as a Service
16© 2018 P3
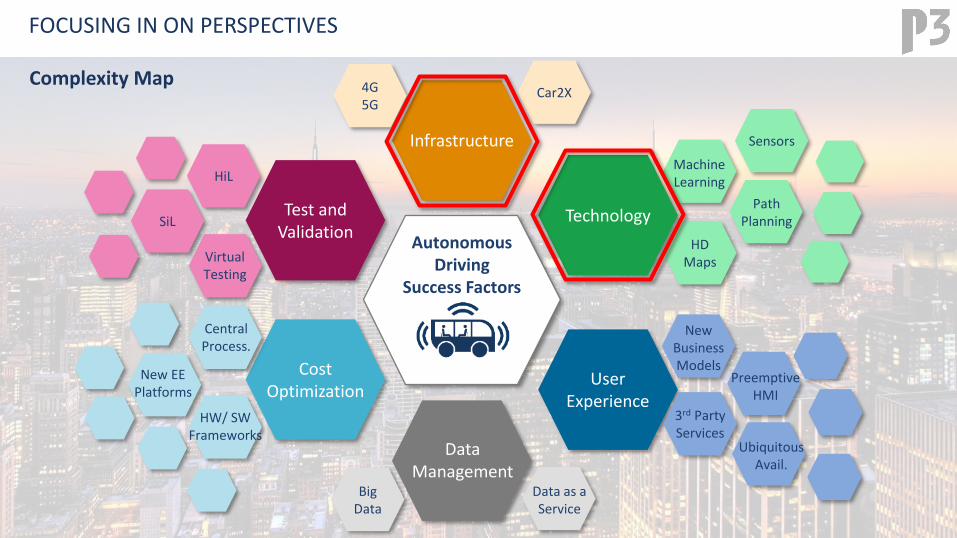
Complexity Map
FOCUSING IN ON PERSPECTIVES
Test and Validation
Technology
HD Maps
3rd Party Services
HiL
Path Planning
UserExperience
Central Process.
Virtual Testing
PreemptiveHMI
New Business Models
New EE Platforms
HW/ SW Frameworks
Sensors
Autonomous Driving
Success Factors
SiL
Cost Optimization
Ubiquitous Avail.
Machine Learning
4G 5G
Car2X
Infrastructure
Data Management
Big Data
Data as a Service

04/18/2018 Current Technology Challenges and Trends
The increase of complexity is not happening within the vehicle alone with numerous ecosystems outside of automotive are now suddenly connected to a vehicle
17
Infrastr-uctureSecurity
System
Comm. Tech.
Energy Supply
Infotain-ment
Charging Infra.
Vehicles
Intercity Transit
Intermodal
Traffic
UrbanTransit
Shared Mobility
TRANSPORTATION
EmploymentPublic
Info.AccessCITY
SecuritySystem
Info. Techn.
Education System
Multimedia
Applian-cesShared
Living
Energy Supply
Fitness
HealthcareNetwork
Social Media
Comm. Tech.
HealthTrackers
Insurance
Entertain-ment
System
Digital Diagnosis
HEALTH
HOMECONSUMER ELECTRONICS
WORK
Multi-media
Retail
The market has not yet determined the distribution of data and its processing value chain

04/18/2018 Current Technology Challenges and Trends 18
Vision sensors will dominate the equipment rate of future vehicles due to their high information density and diversity but RADAR will experience a strong push forward as well
Smart Camera
Ultrasonic
LIDAR
Long-Range Radar
Short-Range Radar
Surround View Camera
GPS/IMU
Infrared
2025 Std. Configuration High Configuration
2x 1x
4x 6-8x
1x 1x
2x 4x
0x 2x
0x 0x
12x 2x
1x 1x
OEM specific vision concept
Additional Rear Radar Feasible
Replacement of US sensors
OEM specific LIDAR concept
Limited value add in comparison to LIDAR
Challenged by commod. RADARs
Increase of precision required for DR

04/18/2018 Current Technology Challenges and Trends
In order to achieve critical cost reduction following domains within the product development cycles have to addressed and executed different from today's solutions
FEDC1
2
Limitation of HW/ sensor platforms to a minimum
Development and maintenance of SW building blocks library
3 Agile T&V developed once, applied everywhere
4 Fast trickle down of advanced features and technology
5 Leverage of 3rd party modules and open innovation
Reduction of direct and indirect costs through economies of
scale and focus on value added developments within SW.
Aiming at 85% SW reusability over all vehicles, achieving
flexibility through virtualization functions .
Shifting traditional T&V activities into implementation phases,
shortening of feedback loops with automation.
Enforcing economies of scale of advanced feature
developments to achieve cost and sourcing synergies.
Focus on core competence, avoiding distraction generating
“pet” projects that can’t deliver differentiation. Leverage of
strategic 3rd parties.
19
HW/ Sensor
SW/ Algo.
T&V
R&D
Platform Development
Vehicle Classes
3rd Party

20© 2018 P3
Complexity Map
Test and Validation
Technology
HD Maps
3rd Party Services
HiL
Path Planning
UserExperience
Central Process.
Virtual Testing
PreemptiveHMI
New Business Models
New EE Platforms
HW/ SW Frameworks
Sensors
Autonomous Driving
Success Factors
SiL
Cost Optimization
Ubiquitous Avail.
Machine Learning
4G 5G
Car2X
Infrastructure
Data Management
Big Data
Data as a Service
FOCUSING IN ON PERSPECTIVES

21© 2018 P3
OEMs and Tier 1s are struggling already today to visualize and notify users of ADAS features and behaviors. These features need to be intuitive for the driver to improve safety during driving rather than creating distraction.
1 Display of information and warnings to driver highly OEM dependent
2 Source and meaning of audible warnings not always distinguishable in critical situations
3 Level of details displayed towards driver not adaptable to personal preferences
4 Level of details of situational awareness of vehicle towards driver not always sufficient or trust increasing
Current Technology Challenges and Trends

04/18/2018 Current Technology Challenges and Trends 22
User experience solutions for automotive need to change fundamentally in the way they are conceptualized and implemented, breaking with today's understanding of it
Today’s Automotive UX Solution Tomorrow’s Automotive UX Solution
Distinct UX Domains Multi-Modal UX
Driver Adapts To Vehicle Vehicle Adapts to Driver
UX Interaction Is Initiated by Driver Driver Reacts to Anticipated Vehicle Fcts.
UX Is A Limited Environment UX Is A Well Connected Part of Daily Living
• Technology components and solutions executing functions independently
• No sophisticated interaction between UX domains
• Superior fusion and processing system takes all information about driver and passengers into account (status, wellbeing, cognitive load level)
• Drivers have to learn vehicle specific usage scenarios• Driver warnings or information are not standardized and
different from OEM to OEM
• Vehicle is able to personalize driver specific settings and interaction details
• Driver is warned and informed in the most effective way, suiting individual capabilities
• For majority of interaction features drivers or passengers need to initiate execution of functionality or feature
• UX system anticipates interaction wishes by driver or passengers
• Automated execution of tasks or features are only modified by user interruption
• Automotive interaction features are limited to the vehicle or Web/Smartphone interfaces
• Vehicle features are highly integrated into other connected environments of the daily living

23© 2018 P3
Internal External
1
2
3
4
5
6
Ability to optimize positioning in a constantly changing value chain
Achieving success not only pre-dominantly based on technology, but more on the overall solution
Leapfrog of developments rather than being bound to legacy platforms
Develop partnerships without creating new competition
Openness to radical changes of how business models are conceived & lived
Meet and exceed different & changing requirements of local markets/ regulations
AUTONOMOUS MOBILITY ELECTRIC MOBILITY CONNECTED MOBILITY NEW MOBILITY SERVICES
Current Technology Challenges and Trends
The whole industry is shifting and only those companies who get their internal & external factors aligned will succeed.
Autonomy will likely grow in hand with connectivity, shared economy and electrification.
04/18/2018 24
Colin Goldsmith
Managing PartnerP3 North America, Inc.
+1 585 943 [email protected]
www.p3-group.com

PRODUCT COST ENGINEERING X.0
The Fundamentals are Back in Fashion
Ted Mabley
April 18, 2018
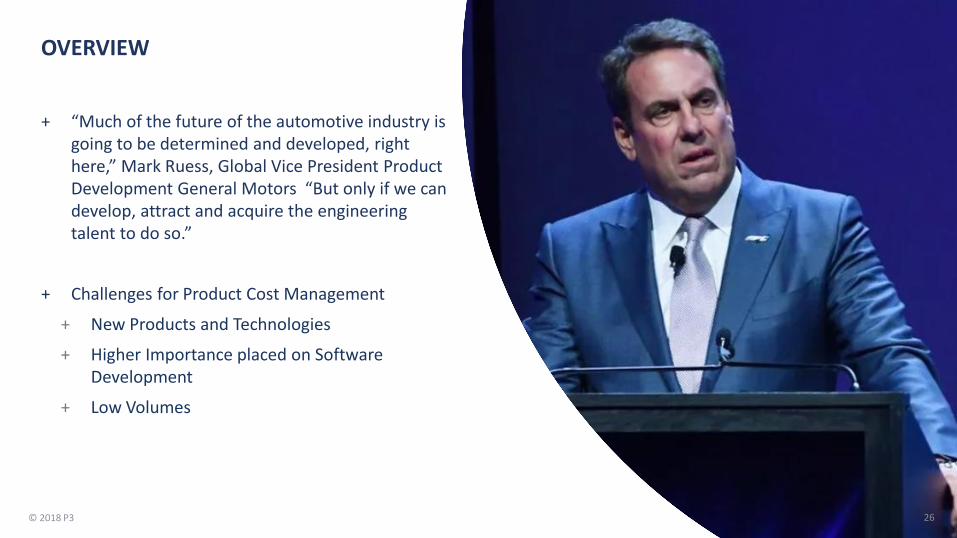
OVERVIEW
+ “Much of the future of the automotive industry is going to be determined and developed, right here,” Mark Ruess, Global Vice President Product Development General Motors “But only if we can develop, attract and acquire the engineering talent to do so.”
+ Challenges for Product Cost Management
+ New Products and Technologies
+ Higher Importance placed on Software Development
+ Low Volumes
26© 2018 P3

+ OEM Cost Estimation Challenges include:
Little to No experience with costing of new technologies (good with what we know)
Fabrication of component parts may be unknown
Assembly processes that are unknown or in the process of being defined
Supply and Demand impact on pricing
The basic premises on cost engineering remain the same
Bottom up estimates require a baseline Bill of Process and cost parameters (machine rates, labor, material rates, cycle times, etc)
27© 2018 P3
CHALLENGE #1 FOR PRODUCT COST MANAGEMENTNEW PRODUCTS AND TECHNOLOGIES

+ The impact of increasing electronics on vehicles is increasing software required to make it work
Biggest challenge is to separate software development from product cost
Definition: Software, like ED&D, can be defined as non-reoccurring charges required to adapt a product technology to a specific vehicle.
o This is not the same thing as a joint development project between two parties
o There is an element of some costs being re-used, some is minor modification, and some will require all new
− Not too dissimilar as a basic new development program in a specific system such as an Instrument Panel
28© 2018 P3
CHALLENGE #2 FOR PRODUCT COST MANAGEMENTSOFTWARE DEVELOPMENT

+ Most conventional cost modeling is based on high volumes
+ Cost Estimators will be challenged to add labor content and setup time, as well as reduce capital
+ But, this is only part of the story:
Supplier ROI expectations changes with low volume programs
Traditional tooling assumptions will crush a low volume business case
+ Many other usual customer specific issues can be magnified
Production Schedule Fluctuations
Engineering Changes
Fixed Cost Coverage
29© 2018 P3
CHALLENGE #3 FOR PRODUCT COST MANAGEMENTLOW VOLUMES

People • Developed a “Academy” approach to address the people
development issue especially in the area of product cost management
• Deep domain experts that provide desired skill sets for clients
• Rotation to keep skill sets fresh, demand for new technologies vs plastic injection mold
Processes• Global network to leverage results and resources
• Global Knowledge repository managed by SME’s
• Knowledge of processes required for how new products are designed, developed and produced
Technologies• New low volume manufacturing methods (battery packs)
• Leverage of software development knowledge into cost assessment tools
• Benchmarking of components and processes from other industries to leverage into client engagements
30© 2018 P3
P3 GROUP SOLUTIONS TO MEET THESE CHALLENGES

“A pessimist sees the difficulty in every opportunity;
An optimist sees the opportunity in every difficulty.”
Winston S. Churchill
31© 2018 P3
Ted MableyMobile 248.613.9200
THANK YOU FOR THE TIME AND ATTENTION TODAY

PARTHA GOSWAMITechnology Trends & Insights
TRANSFORMATION IN THE AUTO INDUSTRYHYPE & REALITY
April 18, 2018Society of Automotive AnalystsSouthfield, MI

We’re in the throes of technology-driven change & disruption
Quadrants of Disruption
Durability: Disruption is evident, but not life-threating
Vulnerability: Incumbents susceptible to more future disruption
Viability: Competitive advantage short-lived, as new disruptors emerge
Volatility: Prominence of violent, sudden disruption
Source:Accenture study onTrends in disruption inIndustry segmentsFeb 2018
Copyright © 2018 Accenture (used with permission)
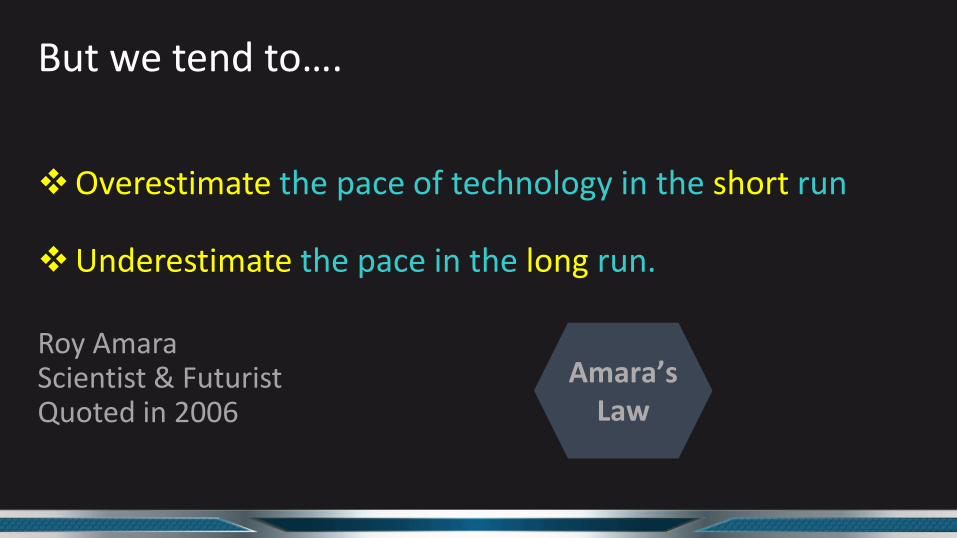
But we tend to….
Overestimate the pace of technology in the short run
Underestimate the pace in the long run.
Roy Amara Scientist & FuturistQuoted in 2006
Amara’sLaw

Exp
ecta
tio
n
Gartner’s Hype Curve partly validates Amara’s Law
TIME
Technology Trigger
Peak of Inflated Expectation
Trough ofDisillusionment
Slope of Enlightenment
Plateau ofProductivity
Emer
gin
g Te
chn
olo
gy

Deep Learning
Autonomous Vehicles
Block Chain
AGI
AGI= Artificial General Intelligence
5G
Conversational UI
2-5 (Years to maturity)
AR
VR
Commercial Drones
5-10
10+QuantumComputing
Exp
ecta
tio
n
Gartner Hype Curve 2017 : A Closer Look
TIME
2017 Emerging TechnologiesVirtual
Assistant
https://www.gartner.com/smarterwithgartner/top-trends-in-the-gartner-hype-cycle-for-emerging-technologies-2017/
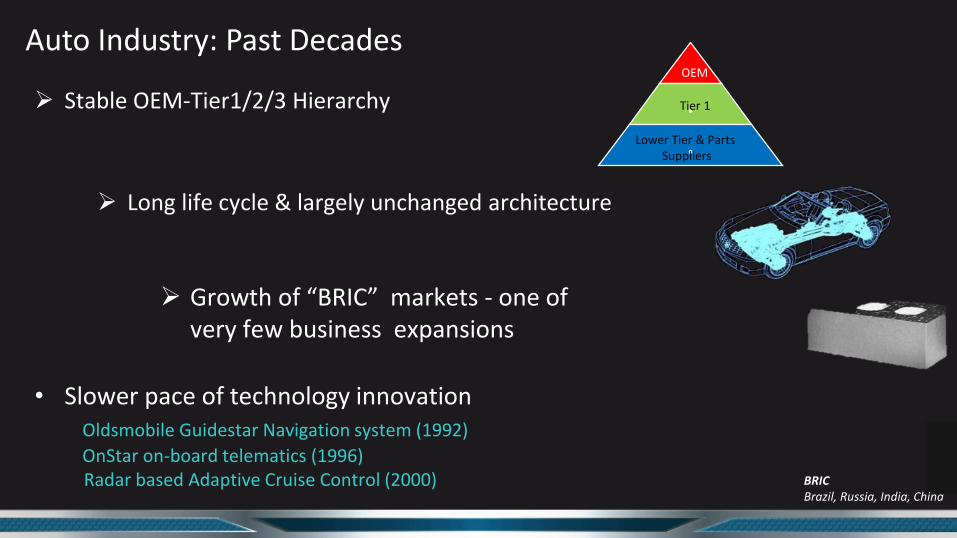
Auto Industry: Past Decades
BRICBrazil, Russia, India, China
.
.
OEM
Tier 1
Lower Tier & Parts Suppliers
Stable OEM-Tier1/2/3 Hierarchy
Long life cycle & largely unchanged architecture
Growth of “BRIC” markets - one of very few business expansions
• Slower pace of technology innovation Oldsmobile Guidestar Navigation system (1992)
OnStar on-board telematics (1996)Radar based Adaptive Cruise Control (2000)
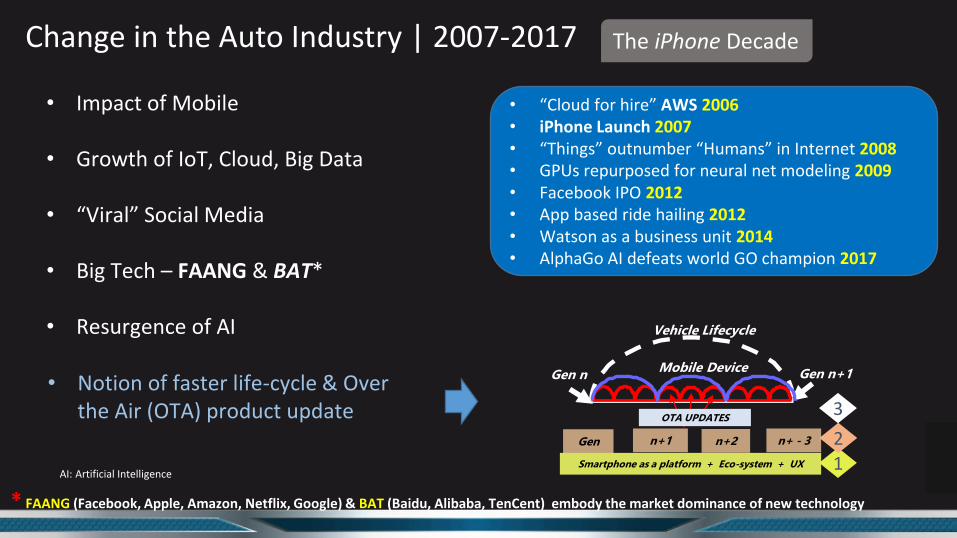
Change in the Auto Industry | 2007-2017
• “Cloud for hire” AWS 2006• iPhone Launch 2007• “Things” outnumber “Humans” in Internet 2008• GPUs repurposed for neural net modeling 2009• Facebook IPO 2012• App based ride hailing 2012• Watson as a business unit 2014• AlphaGo AI defeats world GO champion 2017
* FAANG (Facebook, Apple, Amazon, Netflix, Google) & BAT (Baidu, Alibaba, TenCent) embody the market dominance of new technology
The iPhone Decade
• Impact of Mobile
• Growth of IoT, Cloud, Big Data
• “Viral” Social Media
• Big Tech – FAANG & BAT*
• Resurgence of AI
AI: Artificial Intelligence
Gen n
Gen n
n+1 n+ - 3n+2
Gen n+1
Smartphone as a platform + Eco-system + UX
Vehicle Lifecycle
OTA UPDATES
1
2
3
Mobile Device
• Notion of faster life-cycle & Over the Air (OTA) product update

Three Dimensions of this Change
• Vehicle Transition from a HW-defined to a SW-defined platform
• ACES (or CASE) • ACE: Fast growth of Autonomous
technology, Connectivity and Electrification
• S: Car as a platform for Mobility Services
• Overhaul of Value Chain: The industry is served by a new eco-system of startups & technology providers
Software
Electronics
Mechanical
Integration
According to McKinsey, between 2010 and 2030, SW will grow 7% to 30% of vehicle content, whereas mechanical content will reduce from 68% to 41%.
Source: McKinsey & Companyhttps://www.mckinsey.com/industries/automotive-and-assembly/our-insights/rethinking-car-software-and-electronics-architecture
2010 2030

What’s the anticipated trajectory of these changes ?
• The most common scenario is based on hype & optimism
• “Race” to Level 4 or 5 autonomy
• High expectation of the penetration of MaaS or TaaS
High
Low
Expectation:
Major milestones achieved In the next decade
Change&
Adoption
Years TaaS=Transportation as a ServiceMaaS=Mobility as a Service
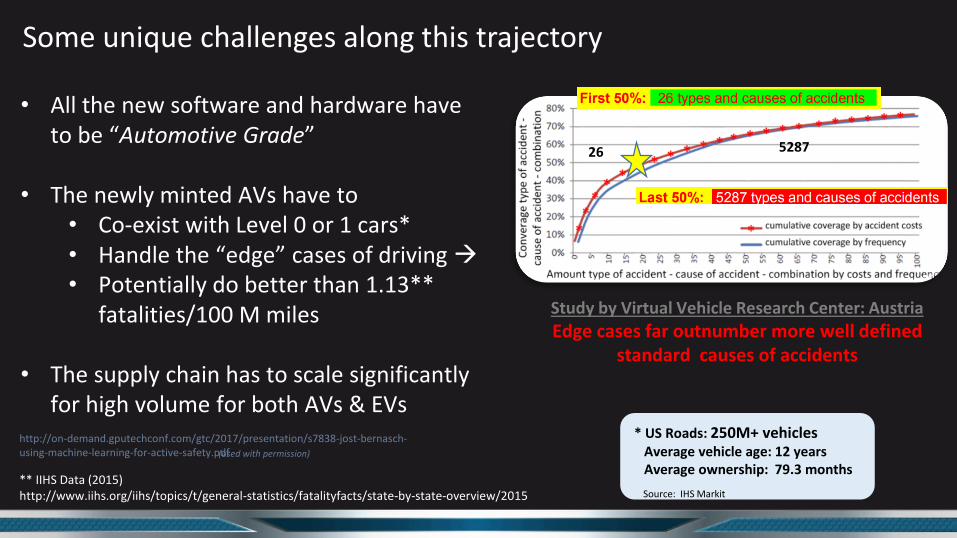
Some unique challenges along this trajectory
• All the new software and hardware have to be “Automotive Grade”
• The newly minted AVs have to • Co-exist with Level 0 or 1 cars*• Handle the “edge” cases of driving • Potentially do better than 1.13**
fatalities/100 M miles
• The supply chain has to scale significantly for high volume for both AVs & EVs
* US Roads: 250M+ vehicles Average vehicle age: 12 years Average ownership: 79.3 months
Source: IHS Markit
Study by Virtual Vehicle Research Center: Austria
Edge cases far outnumber more well defined standard causes of accidents
** IIHS Data (2015)http://www.iihs.org/iihs/topics/t/general-statistics/fatalityfacts/state-by-state-overview/2015
(used with permission)
http://on-demand.gputechconf.com/gtc/2017/presentation/s7838-jost-bernasch-using-machine-learning-for-active-safety.pdf
26 5287

Affordability & Adoption
Other areas to navigate:
Source: MIT Agelab 2016 White Paper on Consumer Preferences
http://agelab.mit.edu/files/publications/2016_6_Autonomous_Vehicles_Consumer_Preferences.pdf.
Comfort / Likely Adoption: Full Autonomy
SOURCE: https://www.bcgperspectives.com/content/articles/automotive-consumer-insight-revolution-drivers-seat-road-autonomous-vehicles/?chapter=5
16-24 25-34 35-44 45-54 55-64 65-74 75+
26.2% 40.0% 34.4% 23.4% 18.9% 14.2% 12.7%
AGE
ACC
CruiseControl
Example: BCG Study: 10 year adoption curve
Cruise Control & ACC*(Adaptive Cruise Control)
After 16+ years, availability of ACC in MY17 hovered around 45-54%
%
%
% Market Penetration
First ACC in the US launched in 2000.
Trust

Lesson from History: Trajectory of AI
AIChips
Success ofAlphaGo
Availability ofData
AI Chips
Growth of GPU
Deep Learning
Facebook, Baidu, Google’s AI Research
Decades of Development
AI Winter*
AI Winter*
* Similar to Gartner’s “Trough of Disillusionment”
Acceleration • Big data • Compute power
AI: ArtificialIntelligence

We can invoke Amara’s law & history of AI to hypothesize that:
CruiseControl
Years
Success & Mainstreaming of many new technologies (AV & EV included) could follow a similar initial slow phase followed by fast acceleration
Scenario 1 Scenario 2 Scenario 3
Infrastructure, Legislation
Affordability
Scale, Cost & reliability
• Accelerated phase
• Initial phase solving many hard problems such as:
• High Performance/Watt Computation
• Capability to resolve ambiguous edge cases
• Automotive Grade Reliability
A
E
C
A: AutonomousE:ElectrificationC: Connected

In Summary: • 2007-17 was a watershed decade for automotive,
that initiated & catalyzed many key changes
Hype
Likely Path
• Change & reinvention of automobile is certain, but its pace may be different from today’s hype
• Explosion of Mobile, Cloud technology & success of Big Tech have sparked imagination & expectation of consumers
• Industry, however, still has to solve several unique challenges – technical or otherwise
www.dreamstime.com

HOW IS GMEMBRACING THIS CHANGE?
CONNECTIVITY
ELECTRIFICATION
AUTONOMOUS
ARCHITECTURE
SERVICE
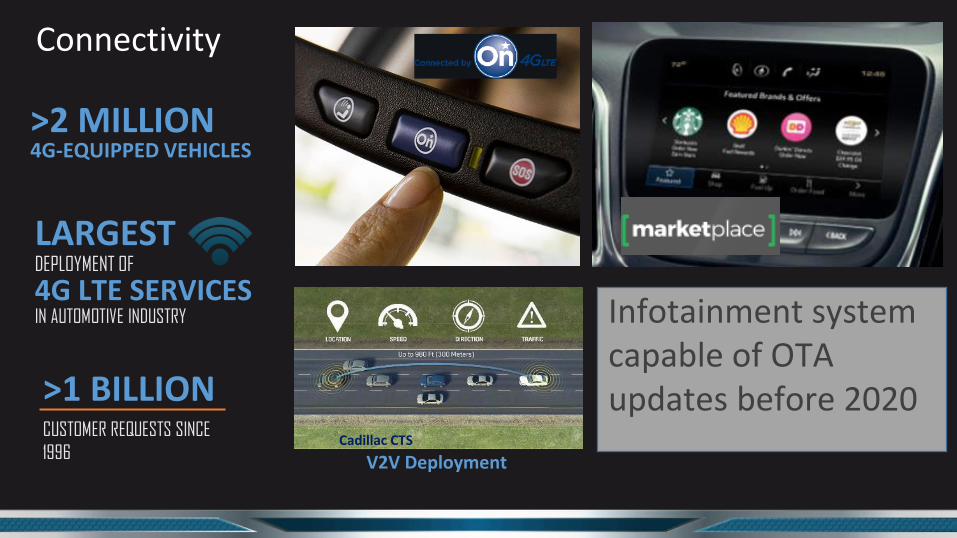
>1 BILLIONCUSTOMER REQUESTS SINCE
1996
LARGESTDEPLOYMENT OF
4G LTE SERVICESIN AUTOMOTIVE INDUSTRY
>2 MILLION4G-EQUIPPED VEHICLES
Connectivity
V2V Deployment
Infotainment system capable of OTA updates before 2020
Cadillac CTS

• Bolt EV – First Electric car to combine long range & affordability
• 238 miles range on a single charge
20+ NEW ALL ELECTRIC VEHICLES
GLOBALLY BY 2023
Electrification

• Super Cruise™ Industry’s first true hands-free driving technology for the highway
• Supported by driver monitoring system
Super Cruise

Autonomous
• Second generation test vehicles -Testing in progress at multiple locations
• Industry first – vehicles built off a regular production line

FUTURE MOBILITY
where IT ALL COMES TOGETHER
CONNECTED
NEWMOBILITY
AUTOMATED
ELECTRIC
TaaS/MaaS/CaaS: Transportation/Mobility/Car as a Service
Learn & innovate Mobility Service• New Mobility Access• Sharing• Alternate asset ownership
models

New Mobility Models
Home: Closed community
shared-use
City: Open community shared-use.
Weekly rental
Delivery Service, Rides etc.
Alternative or Supplement to traditional ownership
KeylessOn demandaccess
RemoteAPIs
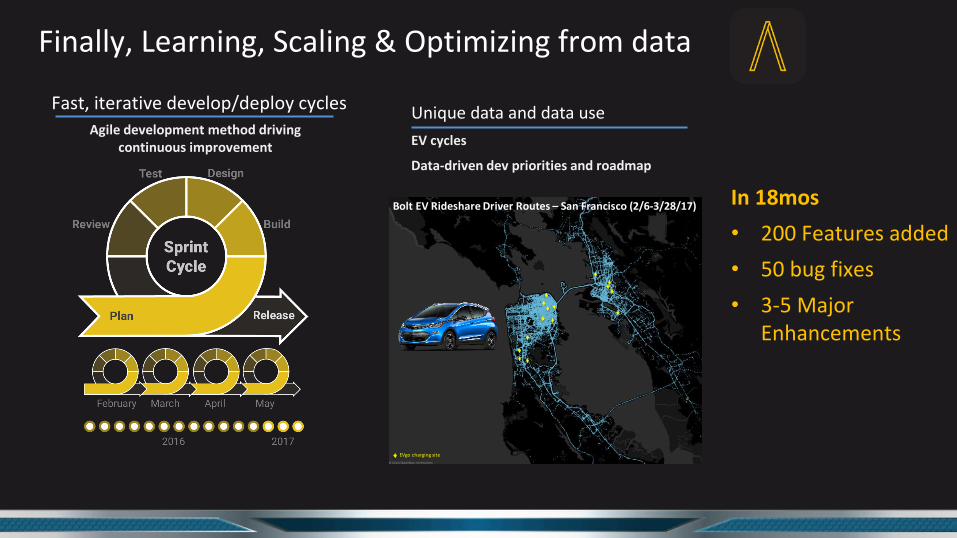
Agile development method driving continuous improvement
Unique data and data use
EV cycles
Data-driven dev priorities and roadmap
Finally, Learning, Scaling & Optimizing from data
In 18mos
• 200 Features added
• 50 bug fixes
• 3-5 Major Enhancements
7
BoltEVRideshareDriverRoutes– SanFrancisco(2/6-3/28/17)
EVgochargingsiteconfidential
DrivershavetakentheBoltEVfromSFtoLA,a380miletrip:
Fast, iterative develop/deploy cycles

CURRENT AND FUTURE TRENDS FOR AUTONOMOUS VEHICLE INTERIOR USER EXPERIENCE
SAA – Accelerating Mobility Solutions
4/18/2018
Erik Alvarado
P3 North America
56© 2018 P3
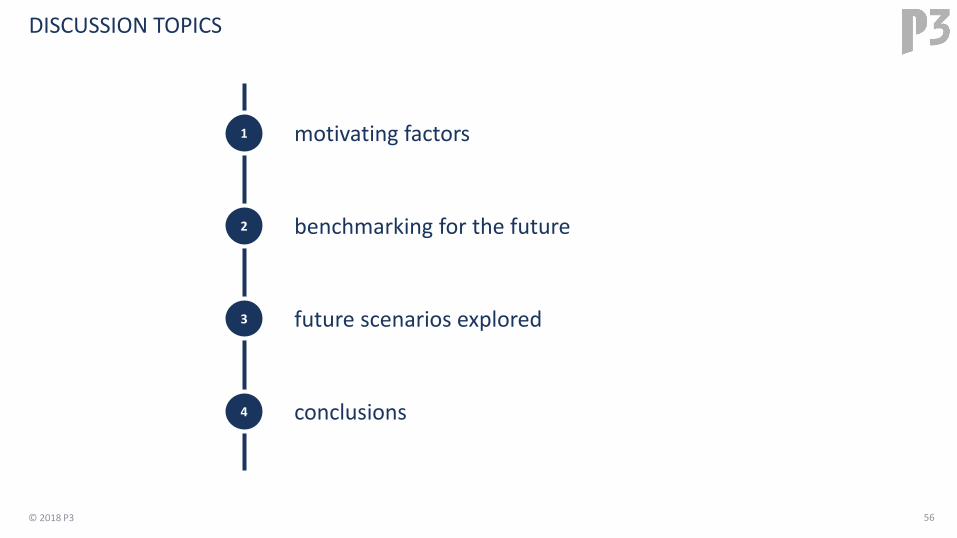
DISCUSSION TOPICS
1
2
3
motivating factors
benchmarking for the future
future scenarios explored
conclusions4
57© 2018 P3
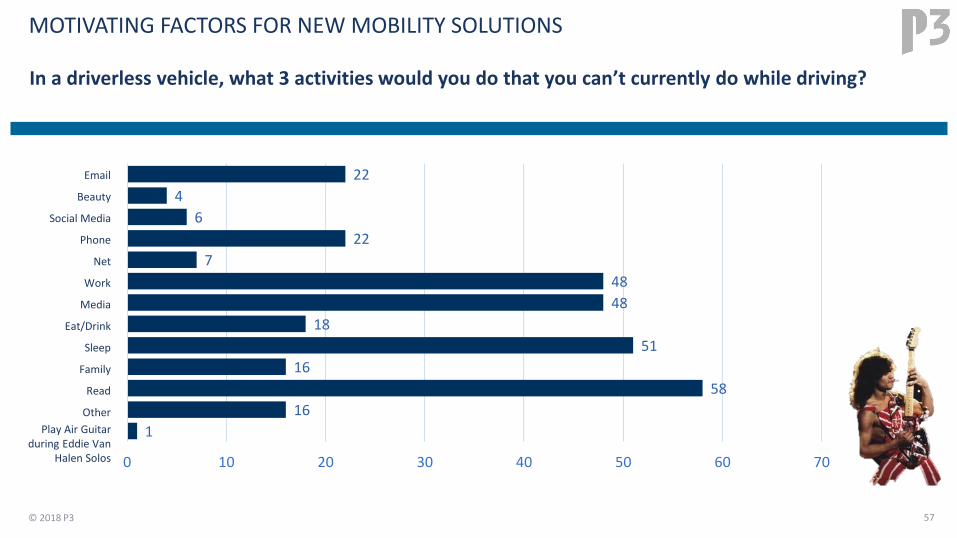
In a driverless vehicle, what 3 activities would you do that you can’t currently do while driving?
MOTIVATING FACTORS FOR NEW MOBILITY SOLUTIONS
1
16
58
16
51
18
48
48
7
22
6
4
22
0 10 20 30 40 50 60 70
Beauty
Social Media
Phone
Net
Work
Media
Eat/Drink
Sleep
Family
Read
Other
Play Air Guitar during Eddie Van
Halen Solos

58© 2018 P3
What are 3 hesitations of yours in the automotive industry going to full autonomous vehicles?
MOTIVATING FACTORS FOR NEW MOBILITY SOLUTIONS
Cost/Access Mix of Autonomous and Regular Vehicles
Safety, Trust, Reliability
ControlInfrastructureInfo/Education/Adopt Speed
31 56 98 48 32 30

59© 2018 P3
What 3 things frustrate you the most using the technology in current vehicles?
MOTIVATING FACTORS FOR NEW MOBILITY SOLUTIONS.
61
46
25
5
20
10Usability/Intuitiveness/UX
Design
Features and Functions Not Working
My phone does it better (functions, speed, apps, voice, navigation, etc)
Cost
Driver Distraction
Lack of Standardization between Manufactures

60© 2018 P3
BENCHMARKING FOR THE FUTURE
today’s trends + current research + future technology concepts
where am I now where do I want to be

61© 2018 P3
FUTURE SCENARIOS EXPLORED
auto OEMs ride sharing tech giants disruptors
trend analysis

62© 2018 P3
FUTURE SCENARIO 1: AUTO OEMS DOMINATE
integration experience of new technologies into vehicles
established pipeline of technology, manufacturing facilities, and suppliers
leading materials innovations for lightweight structures and durable interiors
strongest brand association to on-the-road safety and quality
ability to offer true vehicle personalization through mobility models that reward brand loyalty
positive indicators
vehicles will provide easier access and multiple configurations to meet a broad range of needs
vehicles will need to last for at least 2x more miles than they are designed for today
one moderate crash could easily force a vehicle to be recycled
predicted characteristics

63© 2018 P3
Permanent, main seating in rear of vehicle. Lightweight and durable
Display integrated into glass for visual alerts and shared content
Local touch controls for main seating. Also, voice control for authorized users
Interactive, holographic displays for each passenger
Fold flat seats available under optimal driving conditions
Modular arrangements to allow for increased storage space as needed. Able to hide and remove. Options for child seats, pet carriers, appliances, etc.
mobile living room
FUTURE SCENARIO 1: AUTO OEMS DOMINATE
1
2
3
4
5
6
front

64© 2018 P3
FUTURE SCENARIO 2: RIDE SHARING COMPANIES DOMINATE
adoption rate of ride sharing as an alternative to many current modes of transportation
average age is increasing for first time buyers in the current generation of drivers
adoption of on-demand, subscription, and pay-as-you-go services is increasing across all industries
vehicles will become a commodity and the dominant ownership model will be fleets
vehicles will need to last for at least 6x more miles than they are designed for today
limited innovation with bare minimum implementations as mobility costs are driven down
costs may increase long term if there are large asset losses due to theft, vandalism, or cybersecurity attacks
positive indicators predicted characteristics

65© 2018 P3
FUTURE SCENARIO 2: RIDE SHARING COMPANIES DOMINATE
personal.
commuters.
groups.
personal(on-demand)
shared(on-demand)
advertisement(always on)

66© 2018 P3
FUTURE SCENARIO 3: TECH GIANTS DOMINATE
significant user base allows for large amounts of user data to be leveraged for additional use cases
established service platforms have become household staples in HW and SW
service platforms have continuous touch points with users and are adaptive to their needs
ability to innovate and react quickly to the market resonates with young consumers
consumers will trust non-automotive brands to deliver mobility solutions
companies will provide incentives and discounts to consumers who use associated platform services
consumers will be willing to trade advertisements for mobility discounts
certified, mobility platforms will be purchased or rented as part of a fleet from OEMs or similar
positive indicators predicted characteristics
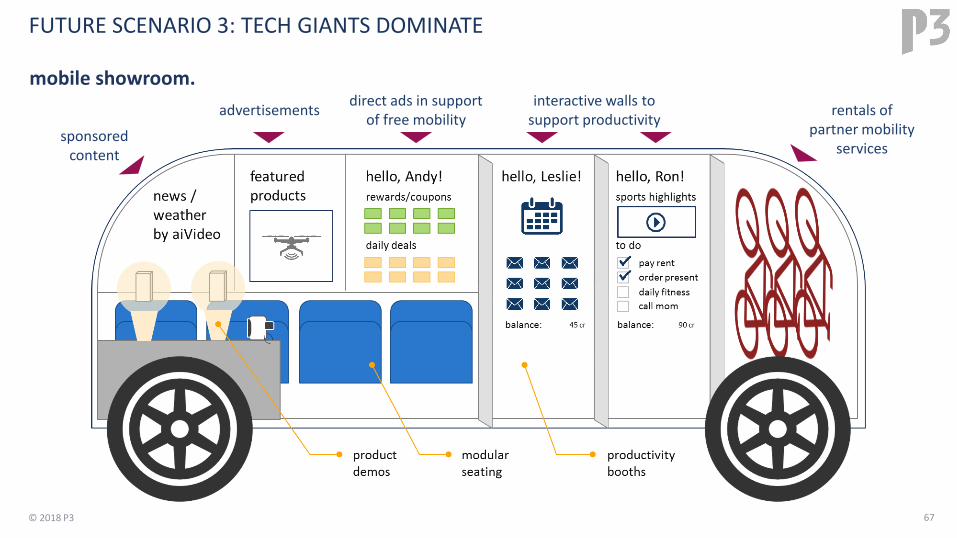
67© 2018 P3
mobile showroom.
FUTURE SCENARIO 3: TECH GIANTS DOMINATE
interactive walls to support productivity
rentals of partner mobility
services
direct ads in support of free mobility
advertisements
sponsoredcontent
68© 2018 P3
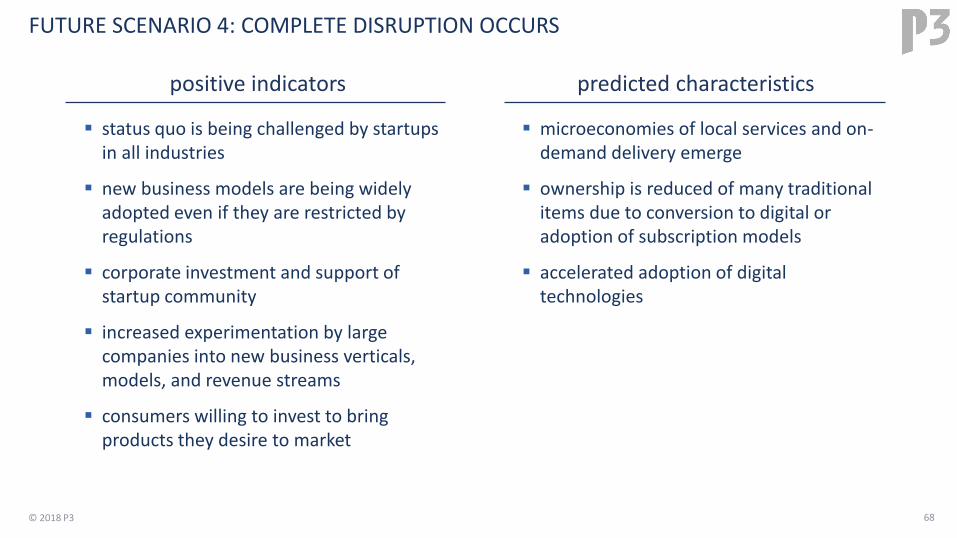
FUTURE SCENARIO 4: COMPLETE DISRUPTION OCCURS
status quo is being challenged by startups in all industries
new business models are being widely adopted even if they are restricted by regulations
corporate investment and support of startup community
increased experimentation by large companies into new business verticals, models, and revenue streams
consumers willing to invest to bring products they desire to market
microeconomies of local services and on-demand delivery emerge
ownership is reduced of many traditional items due to conversion to digital or adoption of subscription models
accelerated adoption of digital technologies
positive indicators predicted characteristics

69© 2018 P3
FUTURE SCENARIO 4: COMPLETE DISRUPTION OCCURS
always mobile. mobility not required.
https://www.designboom.com/design/cornelius-comanns-bufalino/
70© 2018 P3
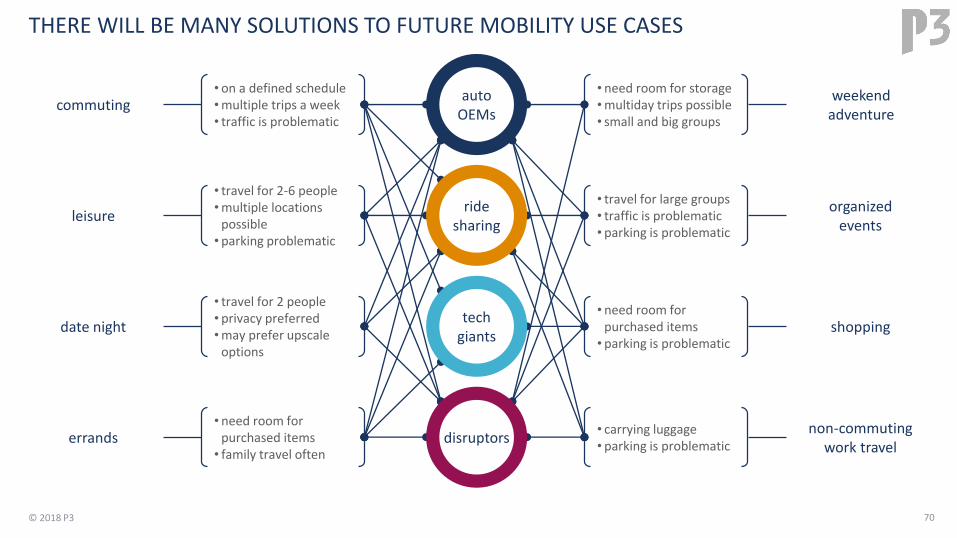
THERE WILL BE MANY SOLUTIONS TO FUTURE MOBILITY USE CASES
commuting
leisure
date night
errands
weekend adventure
organized events
shopping
non-commuting work travel
• on a defined schedule•multiple trips a week• traffic is problematic
• travel for 2-6 people•multiple locations
possible• parking problematic
• travel for 2 people• privacy preferred•may prefer upscale
options
• need room for purchased items• family travel often
• need room for storage•multiday trips possible• small and big groups
• travel for large groups• traffic is problematic• parking is problematic
• need room for purchased items• parking is problematic
• carrying luggage• parking is problematic
auto OEMs
ride sharing
techgiants
disruptors

71© 2018 P3
LOOKING FORWARD TO 2050
2018 2020 2050
target demographic
2030 2040
technology timeline
future consumer25 35born
begin careertalking
walking
high school
digital lifestyle
automation
global activism
economy of disruption
hyperloop
sae level 3
hw tokens for cybersecurity
sae level 4
sae level 5
early adoption mainstream
GLOBAL CYBERSECURITY
ATTACK
uber elevate
meals by pill
decentralized pc / phone
nanotech health care
free mobility
real & virtual self
predictive health care
shared consciousness
ul/dl from human brain
holograms & projectors on demand
digital personalization
disruptive vrvideo games
college
1st grade
interactive textiles

72© 2018 P3
It’s important to know where you stand today…
CONCLUSIONS
Technical and Non-Technical perspective testing
Accessibility, Usability, Design
Recommendations from these subjective viewpoints and testing
Diverse pool of engineers to better gain a broader look at the product under test
User-Impression Testing
Raw approach of subjective viewpoints
Little guidance gains maximum exposure
What trend’s are important to the consumer base
Develop an action plan based on recommendations and findings
Feature and function level specific testing
Pass/Fail compared to specifications and requirements
Performance (timing)
Detailed Test Cases and Test Plans
To ensure full capability testing for feature or functions under test, with overview sheet for quick snapshot of results
Self-Evaluation and Cross-Comparison
Vehicles in similar market/class, and possibly above
Comparison to class above provides added-value
Reports with visual data point comparisons, rankings, and recommendations
Objective Input Subjective Input

73© 2018 P3
Performance
All features under review
Speed, recognition, stability
Future Technological Trends
Trends towards 2050
Off-board vs. On-board
Infotainment vs. Mirroring
Cost and Risk Assessments
Future proofing for a little extra?
Added-value to consumer as a differentiator
Easy updates
Modular
OTA
User Experience
What do customers WANT vs. NEED!
Is this a new feature for the sake of needing a new feature?
Is our technology approachable?
Autonomous Vehicles
Scary, Not Safe, Responsibility, Security…all UX factors
Other industry trends…mobile, computer, health
Driver to Passenger experience
Open Box Questions
Don’t ask “what do you think about this SPECIFIC THING”
Ask “what do you think about this AREA”
…to know where to develop for tomorrow!
CONCLUSIONS
Objective Input Subjective Input
74© 2018 P3
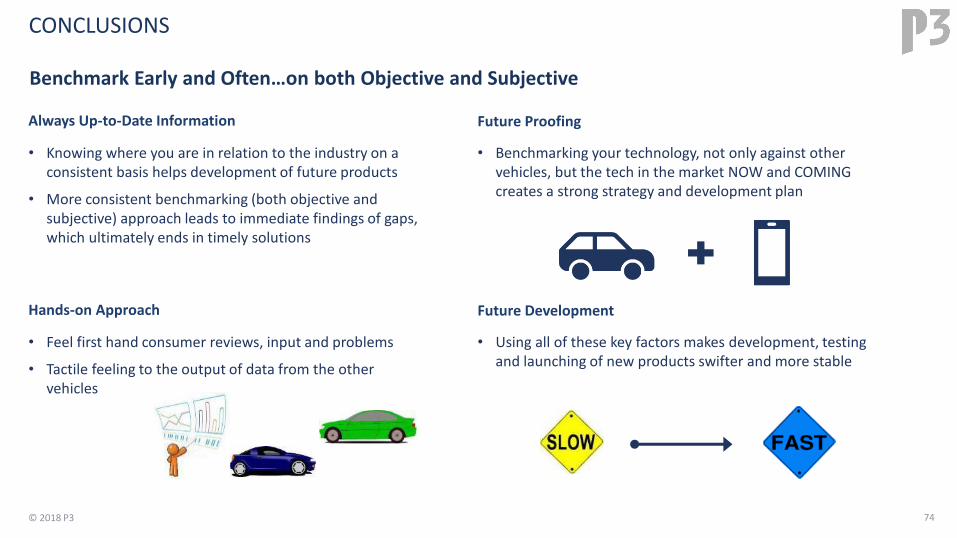
Benchmark Early and Often…on both Objective and Subjective
CONCLUSIONS
• Benchmarking your technology, not only against other vehicles, but the tech in the market NOW and COMING creates a strong strategy and development plan
• Feel first hand consumer reviews, input and problems
• Tactile feeling to the output of data from the other vehicles
• Using all of these key factors makes development, testing and launching of new products swifter and more stable
• Knowing where you are in relation to the industry on a consistent basis helps development of future products
• More consistent benchmarking (both objective and subjective) approach leads to immediate findings of gaps, which ultimately ends in timely solutions
Always Up-to-Date Information Future Proofing
Hands-on Approach Future Development

75© 2018 P3
Summary of Event
P3NA TECHNIK DAYS OVERVIEW
P3’s Stance to Our Clients Up Close and Personal In-Depth Report
P3 Capabilities Recommendations to Clients
• Personalized and hands-on user experience with vehicles under test
• Detailed report-out of findings for clients of subjective and objective data for each vehicle, as well as cross comparison of vehicles
• Develop, test, validate and report on ADAS/Autonomy, Infotainment Technologies, and Telematics/Connected Vehicle
• Recommendations for each vehicle to cover the “how do we close the gap” questions
• To give P3NA‘s stance on latest automotive technologies in the market, and approach to future trends in the industry
P3 Technik Awards
“Awards” for certain categories to highlight differences
76© 2018 P3
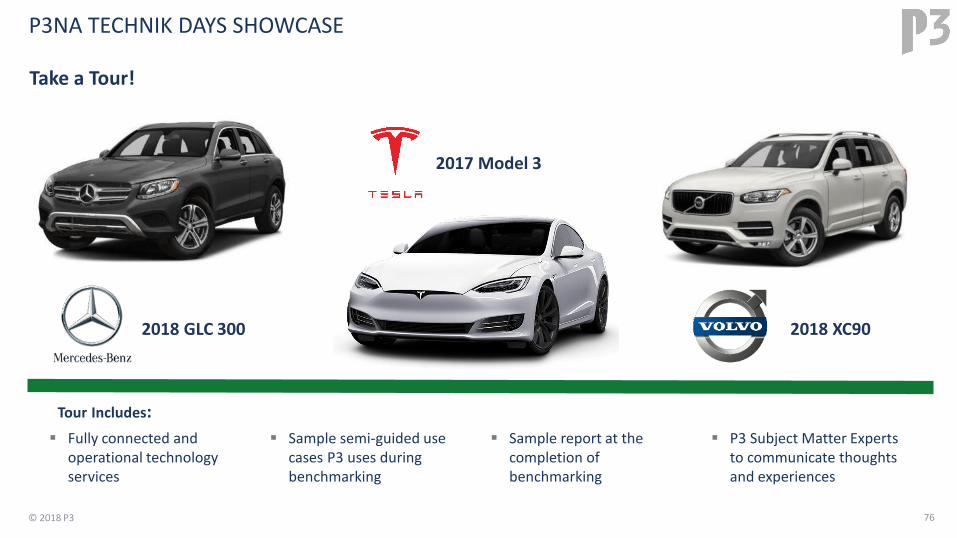
Take a Tour!
P3NA TECHNIK DAYS SHOWCASE
2018 GLC 300
2017 Model 3
2018 XC90
Tour Includes:
Fully connected and operational technology services
Sample semi-guided use cases P3 uses during benchmarking
Sample report at the completion of benchmarking
P3 Subject Matter Experts to communicate thoughts and experiences

77© 2018 P3
PLAN FOR ACTION
Define your strategy: technology, partnerships, differentiation.1.
2. Understand your customer’s expectations, needs, and consumer trends.
4. Reduce risks by prototyping and completing multiple rounds of user testing and benchmarking.
3. Invest intelligently in innovative product and service concepts.

04/18/2018 78
Erik AlvaradoManager, User ExperienceTesting and ValidationP3 North America
+1 248 925 [email protected]
www.p3-group.com

79© 2018 P3
Breakfast
MEET THE EXPERTS & TECH SHOWCASE
GLC300
MODEL3
XC90
ADAPT
PREVIEW
ADAPT – Autonomous Data & Analytics Platform for Testing
• Sensor and algorithm evaluation test platform used to benchmark sensors
• P3 also provides vehicle retrofit and custom fleet building services
Experience our methodology for structure
innovation with our xP3rience
Lab workshops.
DEMO
AUTONOMOUS MOBILITY
CONNECTED MOBILITY
PROTOTYPE & TEST EQUIPMENT
NEW MOBILITY SERVICES
DIGITAL TRANSFORMATION
ELECTRIC
A/V
WIRELESS MOBILE CHARGING UX DEMO
MEET THE EXPERTS