P a g e | 1
Optimization of Refining Crude Distillation Process Unit using
Process Simulation and Statistical Modeling Methods By Jose Bird, Darryl Seillier, and Eric Piazza - Valero Energy Corporation
Abstract
In this paper we implemented a methodology to optimize the operation of a refining crude
distillation unit using a combination of process simulation and statistical modeling
methods. The primary objective was to estimate a set of operating targets for column
pumparound and bottoms stripping steam flows that maximize the unit profitability over a typical
range of crude rate and crude quality operating conditions. The crude unit has an advanced
process control application that maximizes product draw rates but does not optimize the above
variables. We used process simulation to evaluate the crude distillation unit performance over a
feasible range of pumparound and bottoms stripping flows as existing operating data did not
provide sufficient data. Crude quality and crude feed rate were sampled randomly from actual
operating data to account for their inherent process variability. To develop a robust set of
operating targets that would perform well under varying market conditions, alternate market
scenarios were considered where gasoline margins exceeded diesel margins and vice versa when
calculating the unit profit function. Several statistical modeling methods were used to build 3D
profit response surfaces as a function of the operating targets to determine the economic
optimum. The estimated optimum operating targets for pumparound and bottoms stripping
steam flows are being implemented at the refinery.
1. Introduction
A crude distillation unit takes a crude stream and separates it into boiling point fractions, which
include naphtha, kerosene, diesel, and tower resid bottoms. Figure 1 shows a process flow
diagram for a typical crude distillation unit, which has 4 tower pumparounds. The pumparounds
remove heat from the column to pre-heat the incoming crude prior to the crude entering the
crude heaters and generate internal reflux for distillation[1]. The optimum targets for
pumparound and bottoms stripping steam flows depend on the impact of these variables on both
product yields and energy use. As the amount of heat removed from the column via the
pumparounds increases, the heater duty requirements are reduced at the expense of column
fractionation efficiency.

P a g e | 2
Figure 1: Crude Distillation Unit Schematic
This study is based on the use of process simulation to evaluate the performance of the unit over
a range of pumparound and tower bottoms stripping steam flows. Process simulation was
selected as unit operating data did not provide a sufficiently wide range to allow the
determination of the optimum targets. Pumparound flows were represented as the ratio of the
pumparound to the crude flow rate. The bottoms stripping steam flow was represented as the
ratio of the pounds of steam per gallon of tower resid bottoms. The process simulation results
were used to construct response surfaces using multiple regression methods for product yields
and heater duty requirements to validate the simulation results prior to building the profit
response surfaces. Profit response surfaces were then built using the predicted product yields
and heater duty requirements and product prices for different market scenarios with multiple
regression methods. The profit response surface mapped out the crude distillation unit profit as
a function of the pumparound ratios and the tower bottoms stripping steam ratio.
The following is a summary of the methodology used in the study: 1) develop a set of simulation
cases that covers the range of pumparound and stripping steam ratios considered, 2) for each
simulation case randomly draw the crude feed composition as well as the crude feed rate, 3) run
process simulations for cases defined above, 4) use simulation results to build multiple
regression models of product yields and crude heater duty requirements as a function of
pumparound and stripping steam ratios, 5) generate 3D response surfaces based on the
regression models to map out the product yields and the heater duty requirements as a function
of pumparound and stripping steam ratios, 6) generate profit response surfaces for market
conditions where gasoline margins exceed diesel margins and vice versa, and 7) validate results
P a g e | 3
obtained with multiple linear regression models with those obtained with other statistical
modeling methods that model non-linear behavior including multivariate adaptive regressive
splines (MARS) and classification and regression trees (CART).
A detailed description of the process simulation and the statistical modeling of product yields
and heater duty requirements is provided below, followed by the economic optimization
analysis, and the study conclusions.
2. Process Simulation
Process simulations were conducted using Petro-SIMTM 4.1 Process Simulation Software. Petro-
SIMTM 4.1 was selected as the process simulator due to its user friendly ExcelTM spreadsheet
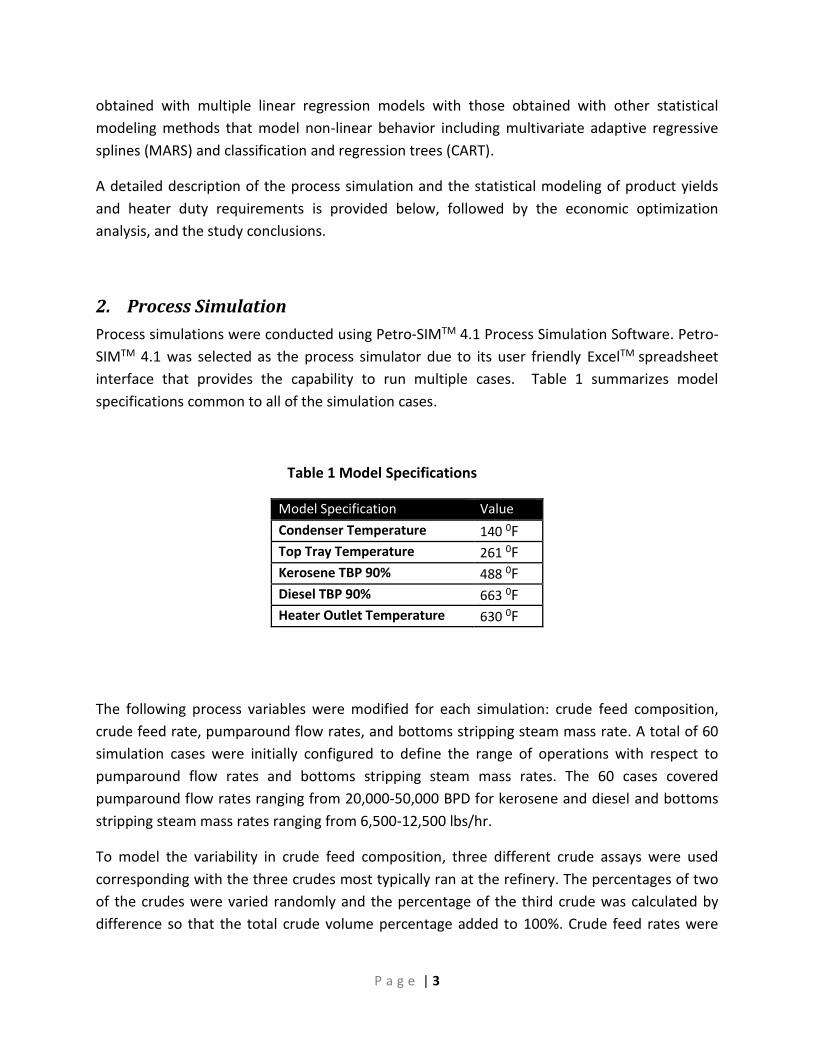
interface that provides the capability to run multiple cases. Table 1 summarizes model
specifications common to all of the simulation cases.
Table 1 Model Specifications
Model Specification Value
Condenser Temperature 140 0F
Top Tray Temperature 261 0F
Kerosene TBP 90% 488 0F
Diesel TBP 90% 663 0F
Heater Outlet Temperature 630 0F
The following process variables were modified for each simulation: crude feed composition,
crude feed rate, pumparound flow rates, and bottoms stripping steam mass rate. A total of 60
simulation cases were initially configured to define the range of operations with respect to
pumparound flow rates and bottoms stripping steam mass rates. The 60 cases covered
pumparound flow rates ranging from 20,000-50,000 BPD for kerosene and diesel and bottoms
stripping steam mass rates ranging from 6,500-12,500 lbs/hr.
To model the variability in crude feed composition, three different crude assays were used
corresponding with the three crudes most typically ran at the refinery. The percentages of two
of the crudes were varied randomly and the percentage of the third crude was calculated by
difference so that the total crude volume percentage added to 100%. Crude feed rates were
P a g e | 4
modeled using a normal distribution with the mean and standard deviation estimated from
operating data.
A second set of 60 simulation cases were defined after preliminary analysis indicated that the
direction of the optimum was at high diesel pumparound flow rates and high bottoms stripping
stream mass rates. The impact of kerosene pumaround was not found to be as significant so the
second set of cases kept the same range of kerosene pumparound flow rates as the initial
configuration. The second set of runs covered diesel pumparound flow rates from 40,000-50,000
BPD and stripping steam mass rates from 10,500-12,500 lbs/hr.
3. Statistical Modeling of Product Yields and Heater Duty Requirements
The impact of tower pumparounds and the bottoms stripping stream ratios on product yields and
heater duty requirements was first assessed to validate the process simulation results prior to
building the profit response surfaces. Figure 2 is a scatter plot matrix illustrating the relationships
between product yields and heater duty requirements against tower pumparound ratios, reflux
ratio, and bottoms stripping steam ratio. The strong impact of diesel pumparound ratio on
product yields and on heater duty requirements can be easily seen. The impact of the kerosene
pumparound ratio was not found to be as significant. A very strong correlation between product
yields and duty requirements with reflux ratio can also be observed.
Tower pumparounds were expressed as a ratio of the pumparound flow to the crude flow (P/A
ratio). Heater duty requirements were expressed as MBTU/bbl of crude. Note that the diesel
product yield was positively correlated and the kerosene product yield negatively correlated with
the diesel P/A ratio as would be expected. The diesel P/A ratio was also found to be highly
correlated with reflux ratio as the top tray temperature was assumed to be constant and the
simulator adjusted the reflux ratio to maintain this temperature. Since the reflux ratio was found
to be highly correlated with the diesel P/A ratio, the reflux ratio was excluded as a regressor to
minimize the effects of multi-collinearity on the multiple linear regression models. The tower
bottoms stripping steam ratio was found to be highly correlated with the resid bottoms yield,
diesel yield, and naphtha yield. As expected, the diesel P/A ratio and the heater duty
requirements were found to be negatively correlated as high P/A ratios translate to lower heating
requirements. The scatter plot matrix illustrating these relationships was generated using the
SAS PROC SGSCATTER [2] procedure.

P a g e | 5
Figure 2: Scatter Plot matrix
To examine the relationships between product yields and heater duty requirements against the
key factors, second order linear regression models were constructed with both quadratic and
interaction terms[3]. These models were then used to build response surfaces to examine the
unit performance over the operating range prior to proceeding with the economic optimization
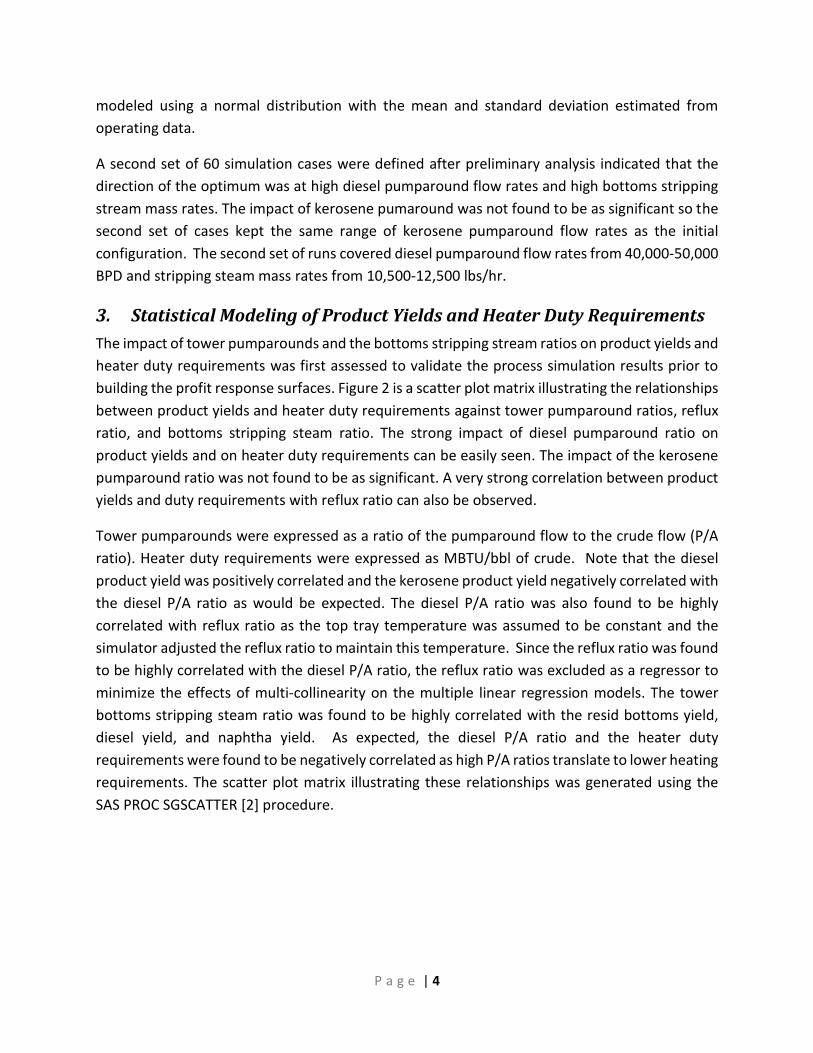
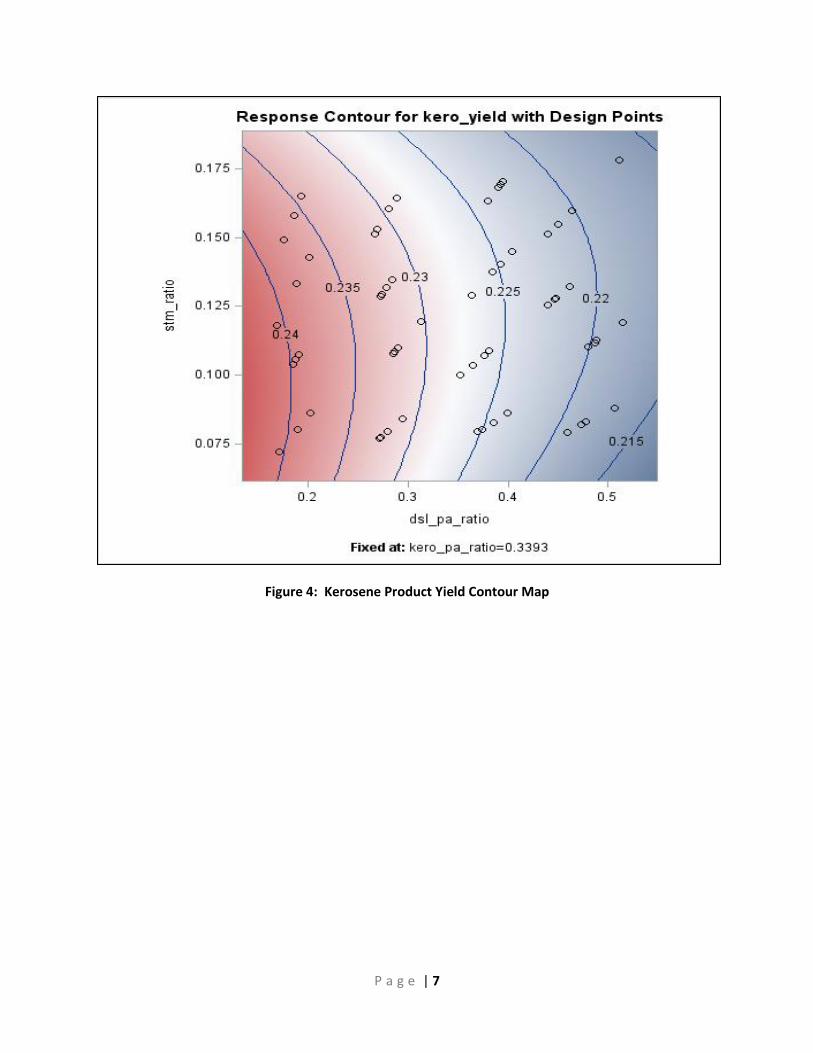
analysis[4,5]. Figures 3-6 provide 3D surface contour maps of product yields as a function of
bottoms stripping steam ratio and the diesel P/A ratio. Note that naphtha yield is maximized at
maximum diesel P/A ratio, kerosene yield at minimum diesel P/A ratio, diesel yield at maximum
P a g e | 6
diesel P/A ratio, and resid bottoms yield at minimum diesel P/A ratio. In terms of the bottoms
stripping steam ratio, diesel yields were maximized at maximum stripping steam ratio and resid
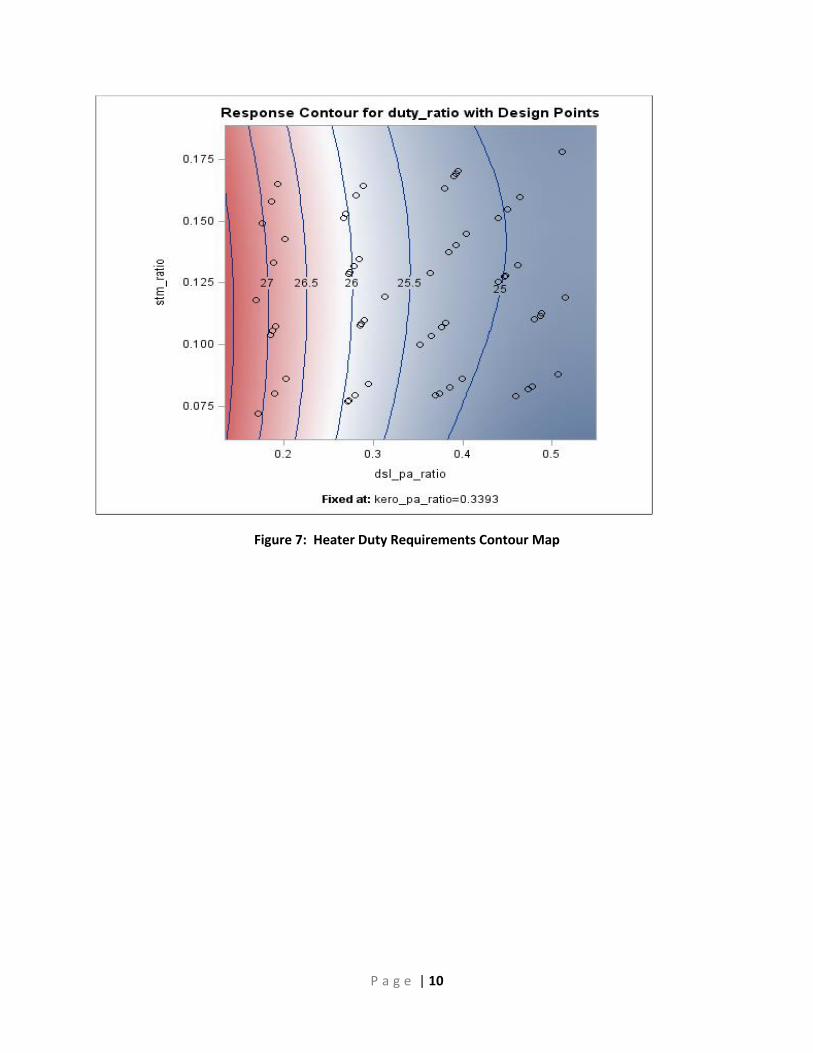
bottoms yield at minimum steam ratio. Figure 7 shows maximum heater duty requirements occur
when the diesel P/A ratio is at a minimum as would be expected.
Figure 3: Naphtha Product Yield Contour Map
P a g e | 7
Figure 4: Kerosene Product Yield Contour Map

P a g e | 8
Figure 5: Diesel Product Yield Contour Map

P a g e | 9
Figure 6: Resid Bottoms Product Yield Contour Map
P a g e | 10
© Valero 2010 Page 14
Figure 7: Heater Duty Requirements Contour Map

P a g e | 11
4. Economic Optimization Analysis
Once the process simulation results were validated based on the second order linear regression
model results, profit response surfaces were built to determine the optimum targets. Profit
response surfaces were constructed for scenarios where gasoline margins exceeded diesel
margins and vice versa to develop a set of robust targets that would perform well under varying
market conditions and minimize the need to adjust these targets. Figure 8 shows the average
product margins used to estimate product revenues along with the natural gas prices used to
estimate the crude heaters fuel costs and stripping steam costs. This data was based on actual
pricing data from November 2014 to October 2015. The resid bottoms product margin was
estimated as 70% of the gasoline margin and 30% of the diesel margin.
Figure 8: Product Margins and Natural Gas Prices – Diesel and Gasoline Mode
Profit response surfaces were first constructed based on second order linear regression models.
Figures 9 and 10 provide the profit per barrel of crude for both market scenarios considered.
Note the higher density of points at the higher values of diesel P/A ratio and stripping steam ratio
which represent the second set of simulation runs configured. Figure 9 shows that when gasoline
margins exceeded diesel margins, the profit function was maximized at maximum diesel P/A
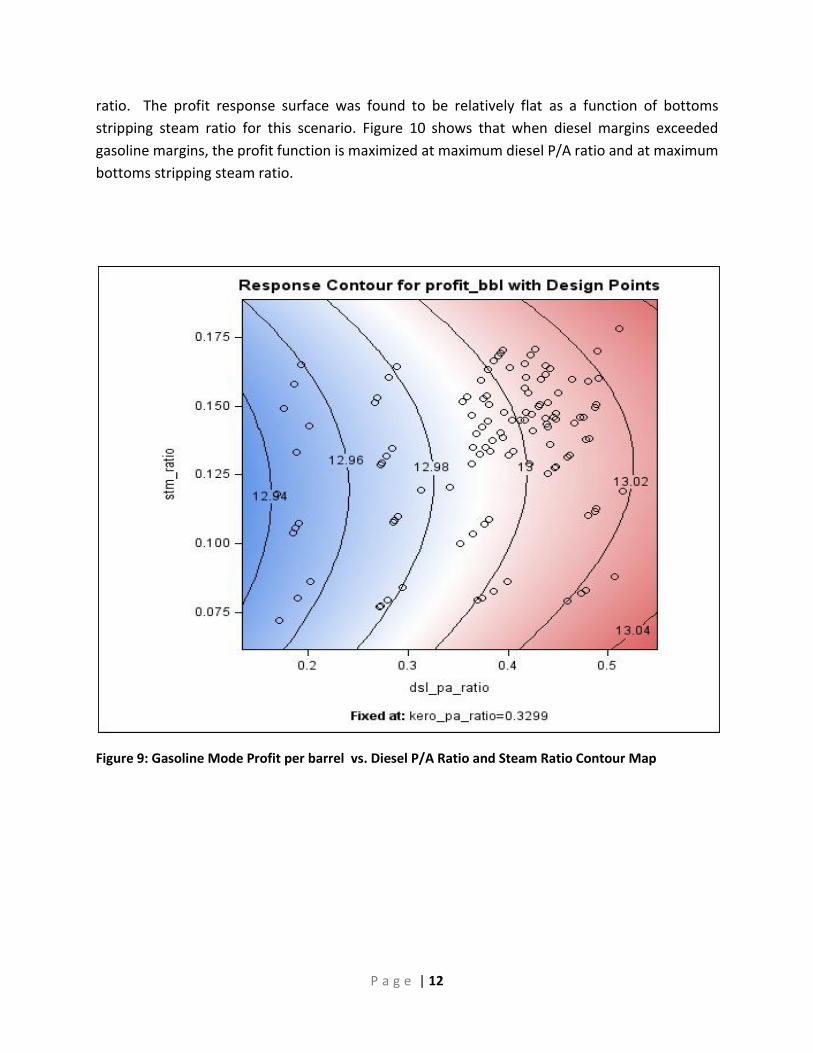
P a g e | 12
ratio. The profit response surface was found to be relatively flat as a function of bottoms
stripping steam ratio for this scenario. Figure 10 shows that when diesel margins exceeded
gasoline margins, the profit function is maximized at maximum diesel P/A ratio and at maximum
bottoms stripping steam ratio.
Figure 9: Gasoline Mode Profit per barrel vs. Diesel P/A Ratio and Steam Ratio Contour Map

P a g e | 13
Figure 10: Diesel Mode Profit per barrel vs. Diesel P/A Ratio and Steam Ratio Contour Map
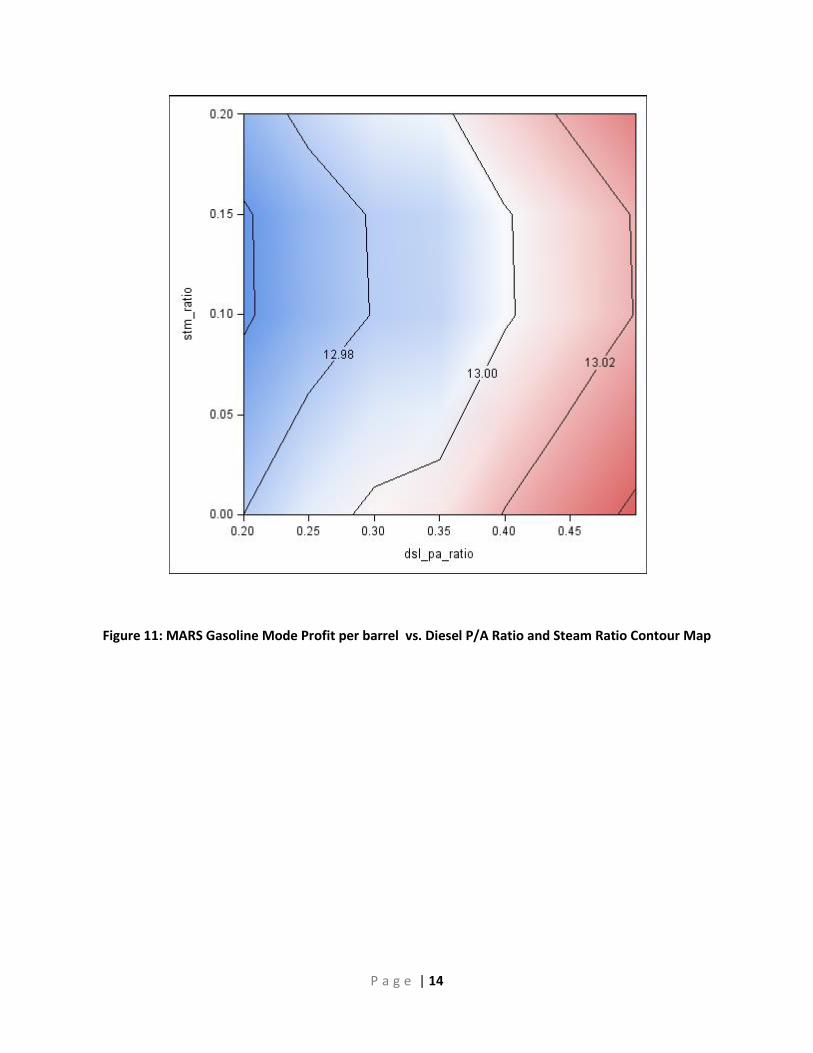
To validate the results obtained with the multiple linear regression models, a model based on
MARS method was also constructed. The MARS method uses piecewise linear basis functions to
allow for the modeling of non-linear behavior. Figures 11-12 show profit response surfaces
based on the MARS method for both market scenarios. Note that the behavior of both profit
response surfaces was consistent with the results obtained with the multiple linear regression
models. The SAS procedure PROC ADAPTIVEREG was used to build the model and SAS procedures
PROC TEMPLATE and PROC SGRENDER were used to generate the profit response surfaces.
P a g e | 14
Figure 11: MARS Gasoline Mode Profit per barrel vs. Diesel P/A Ratio and Steam Ratio Contour Map
P a g e | 15
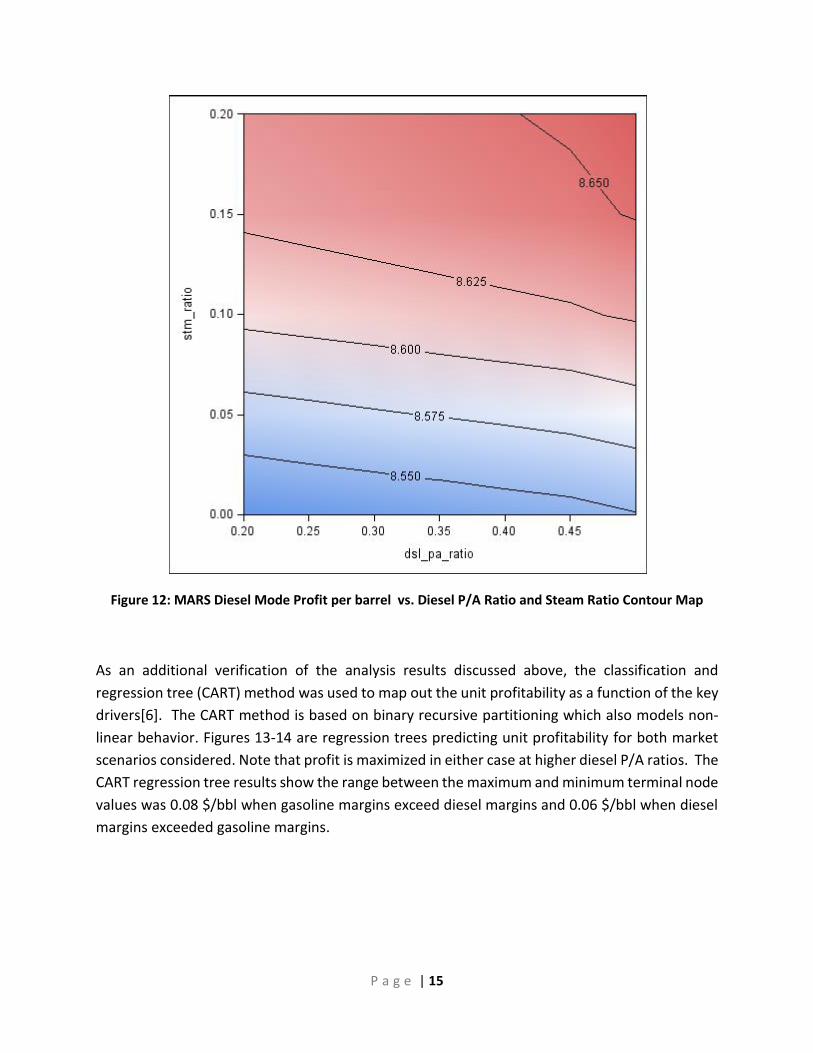
Figure 12: MARS Diesel Mode Profit per barrel vs. Diesel P/A Ratio and Steam Ratio Contour Map
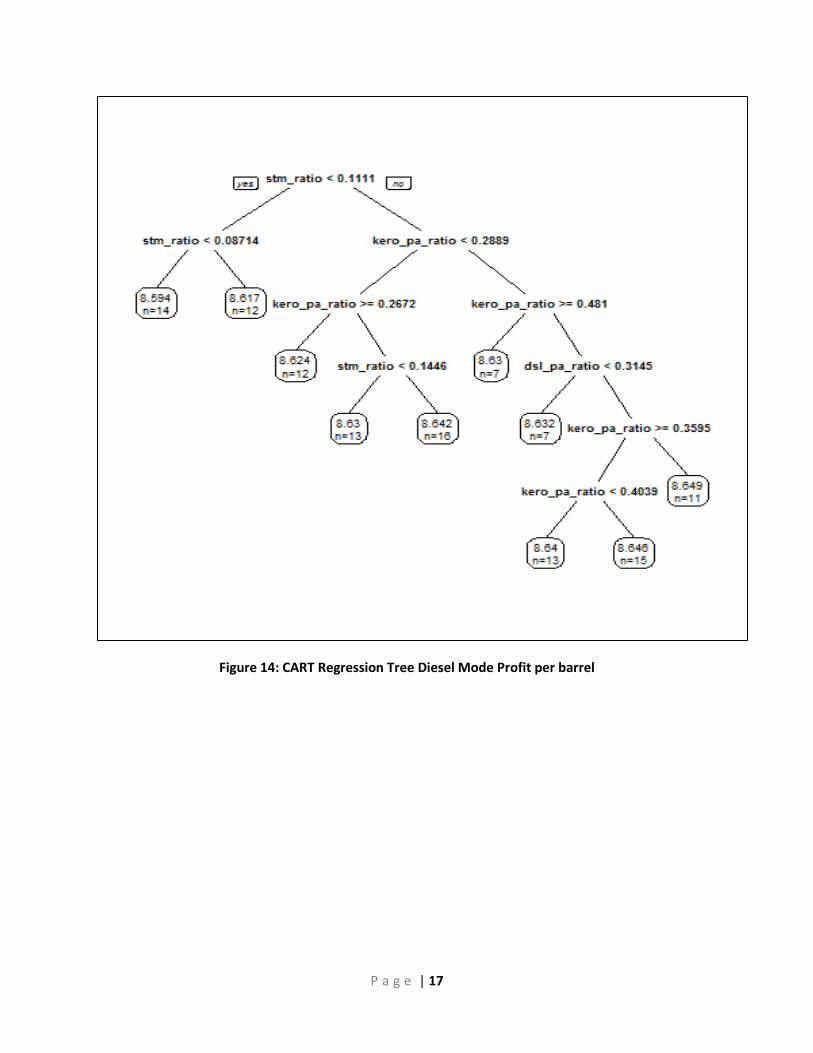
As an additional verification of the analysis results discussed above, the classification and
regression tree (CART) method was used to map out the unit profitability as a function of the key
drivers[6]. The CART method is based on binary recursive partitioning which also models non-
linear behavior. Figures 13-14 are regression trees predicting unit profitability for both market
scenarios considered. Note that profit is maximized in either case at higher diesel P/A ratios. The
CART regression tree results show the range between the maximum and minimum terminal node
values was 0.08 $/bbl when gasoline margins exceed diesel margins and 0.06 $/bbl when diesel
margins exceeded gasoline margins.

P a g e | 16
Figure 13: CART Regression Tree Gasoline Mode Profit per barrel
P a g e | 17
Figure 14: CART Regression Tree Diesel Mode Profit per barrel

P a g e | 18
4. Conclusions
In this paper we determined optimum operating targets for crude distillation unit pumparound
flow rates and bottoms stripping steam mass rates using process simulation combined with
statistical modeling. Process simulation was used to evaluate the unit performance as existing
operating data did not provide sufficient data. Diesel P/A ratio and the bottoms stripping steam
ratio were found to be the key drivers impacting unit profitability. The analysis estimated
maximum diesel P/A ratio and maximum bottoms stripping steam ratio as the optimum operating
targets for the range of market scenarios considered.
Author biographies:
Jose Bird, PhD is Director Advanced Analytics at Valero Energy Corporation. He is responsible for implementing statistical solutions in the areas of process optimization, energy efficiency, process monitoring, and ethanol manufacturing operations.
Darryl Seillier is Technology Advisor at Valero Energy Corporation. He is responsible for leading strategic projects as well as company-wide process improvement in the areas of energy efficiency and hydrogen systems.
Eric Piazza is Sr. Staff Refinery Models Engineer at Valero Energy Corporation. He is a subject matter expert in refinery process modeling.
References
[1] Gary, J.H., Handwerk, G.E., Kaiser, M.J. (2007). Petroleum Refining: Technology and
Economics, 5th ed., CRC Press.
[2] SAS Customer Support, http://support.sas.com.
[3] Montgomery, D.C., Peck, E.A., Vining, G.G. (2012). Introduction to Linear Regression
Analysis, 5th ed., Wiley.
[4] Montgomery, D.C., Myers, R.H. (1995). Response Surface Methodology, Wiley.
[5] Del Castillo, E. (2007). Process Optimization – A Statistical Approach, Springer
[6] R package rpart: https://cran.r-project.org/web/packages/rpart/rpart.pdf.
Recommended